Article

Stability Analysis of Jinchuan Hydropower Station Hydraulic Tunnels during Excavation and Unloading

1
Chn Energy Dadu River Hydropower Development Co., Ltd., Chengdu 610041, China
2
State Key Laboratory of Hydraulics and Mountain River Engineering, College of Water Resource and Hydropower, Sichuan University, Chengdu 610065, China
3
School of Geoscience and Technology, Southwest Petroleum University, Chengdu 610500, China
*
Author to whom correspondence should be addressed.
Appl. Sci. 2022, 12(22), 11660; https://doi.org/10.3390/app122211660
Submission received: 4 September 2022 / Revised: 4 November 2022 / Accepted: 11 November 2022 / Published: 16 November 2022
(This article belongs to the Section Earth Sciences)

Abstract

:
As the hydropower development strategies of China continue to be implemented, a host of large hydropower projects have been completed or are being constructed in southwest China. During construction of the Jinchuan hydropower station, this study examined the stability of the surrounding rock during the excavation and unloading of hydraulic tunnels under demanding geological conditions. Microseismic (MS) monitoring technology was employed to monitor the deformation and failure of the surrounding rock online and in real time, based on engineering geological data and site surveys. To analyze the stability of the surrounding rock in the spillway tunnel and to study the temporal and spatial evolution characteristics of MS events, source parameter analysis and numerical modeling were performed. The 3D finite-difference numerical modeling software FLAC3D was used to simulate the mechanical response of the surrounding rock during the excavation and unloading of the spillway tunnel and the diversion tunnel. The numerical modeling results were compared with the monitoring results and site surveys to determine the failure mechanisms of the surrounding rock during the construction and unloading of the hydraulic tunnels. The research results can serve as a guide for studying the stability of the surrounding rock in similar hydraulic tunnels.

1. Introduction

The new social and economic deals of the last years in China have resulted in a larger demand for renewable energy. Many hydropower projects have been realized, and many others are under design [1,2,3,4,5], especially in southwest China (shown in Figure 1). Most of these hydropower plants are located in high mountain regions with complex tectonic frameworks. Faults, joints, weak structural planes characterize the rock mass in a region with an important stress field [6]. This geological setting requires strict quality control and safety requirements for the engineering rock mass. In addition, the construction process is challenging and mainly includes blasting excavation, and unloading, which might disturb the surrounding rock of underground caverns and undermine its stability.
Currently, engineering geological analogy, geomechanical analysis, and model testing are the main methodologies used in both domestic and international studies on the stability of the surrounding rock. Moreover, safety monitoring is also an important topic related to the stability of the underground rock of hydraulic tunnels. In particular, rock deformation occurs mainly in the surrounding rock and includes vault subsidence and ground subsidence. The safety monitoring of the rock mass in underground caverns relies on accurate conventional monitoring results of multipoint displacement meters, rock bolt stressometers, etc. However, when the readings of the displacement meter change, it indicates that the macroscopic deformation of the rock mass has already occurred, and the displacement meter alone cannot provide an early warning prior to the deformation. As a high-precision 3D monitoring technique, MS monitoring has more advantages than the traditional monitoring techniques as it can detect micro-fracture signals before the macroscopic failure of the surrounding rock. It was initially employed for mine monitoring [7,8,9,10] before being promoted and used in the oil and natural gas industries [11,12,13]. It was first applied in the field of hydropower engineering by domestic academics Xu et al. [14,15,16,17,18,19], and since then, the field has seen rapid development [20,21,22]. Many academics [23,24,25] have successfully built MS monitoring systems in hydropower projects such as Jinping-II and Baihetan, conducted in-depth research on engineering issues such as rock bursts and rock deformation, clarified the fracture mechanisms of the surrounding rock, proposed numerous warning indicators for rock bursts, and promoted the growth of geotechnical engineering disciplines. In recent years, the numerical calculation method has gradually become one of the main methods for analyzing rock stability in the field of geotechnical engineering.
Numerical calculation methods based on computer technology have been applied in many fields as a result of the rapid advancement in computing efficiency. The following numerical methods are currently used in geotechnical engineering: the finite element method (FEM) [26,27], finite difference method (FDM) [28], boundary element method (BEM) [29,30,31], discrete element method (DEM) [32,33,34,35,36], meshless method [37], discontinuous deformation analysis (DDA) [38], numerical manifold method [39], and infinite element method [40].
Researching the safety monitoring and failure mechanisms of the surrounding rock during the excavation and unloading of underground caverns under difficult geological conditions is, therefore, a significant challenge in the prevention and control of underground disasters. In this study, based on the spillway tunnel of the Jinchuan Hydropower Station, MS monitoring technology was adopted to monitor the deformation and failure of the surrounding rock in real time, and source parameter analysis and numerical modeling were performed to analyze the stability of the surrounding rock in the spillway tunnel. This paper can provide a reference for the safe excavation of underground caverns in similar hydropower projects.

2. Engineering Background

The Jinchuan Hydropower Station is located about 13 km north of Jinchuan County, in Ngawa Tibetan and Qiang Autonomous Prefecture, Sichuan Province, on an approximately 1-km reach upstream of the confluence of the Dadu River and a right bank tributary of the Xinzagou River. It is the sixth stage of the cascade development of hydropower stations on the mainstream of the Dadu River, downstream of the Shuangjiangkou Hydropower Station, and upstream of the Badi Hydropower Station in Jinchuan County. The location of the Jinchuan Hydropower Station is shown in Figure 1.
The spillway tunnel was built on the right side of the spillway for flood control during the construction period and flood relief during the permanent operation period, with a total length of 938.5 m and a maximum discharge of 1612 m3/s. The pressurized section of the spillway tunnel consists of an inlet transition section, a circular pressurized section, and an outlet transition section. Gravity is the dominant factor controlling the ground stress field in the project area. The surrounding rock of the spillway tunnel was mostly broken but still quite hard, whereas the surrounding rock in the inlet and outlet sections of the tunnel as well as in the weak interlayer in the middle of the tunnel was soft and heavily broken. The stability of the surrounding rock was poor and required support treatment. The overall layout of the underground powerhouse caverns of the Jinchuan Hydropower Station is shown in Figure 2.

3. Study of the MS Activity of the Surrounding Rock

The instrument and system installation for the MS monitoring system in the spillway tunnel project of the Jinchuan Hydropower Station started in July 2020 and construction was formally finished at the end of August. After a period of trial runs and equipment debugging, the system started to run officially on 2 August 2020. The system conducted 24-h dynamic monitoring of the rock mass in the excavation and unloading area of the spillway tunnel. Due to the complex site conditions, the signals detected by the MS monitoring system included blasting signals, mechanical signals, current interference signals, and other unknown signals in addition to rock micro-fracture signals. As of 16 December 2020, a total of 229 valid rock micro-fracture signals had been detected after signal identification and unscrambling, and removal of the remaining non-MS signals. The source parameters of the collected MS data were studied to summarize the temporal and spatial evolution characteristics of MS events in the surrounding rock during the excavation and unloading of the spillway tunnel.

3.1. Temporal Evolution Characteristics of MS Events

Figure 3 shows the temporal distribution of daily MS events and their cumulative energy in the spillway tunnel project of the Jinchuan Hydropower Station. It can be shown that, despite the uneven distribution of MS events over time during the monitoring period, these events could generally be divided into three stages. To be specific, the first stage saw a general increase in the number of MS events and a gradual increase in the cumulative energy; the second stage saw a significant increase in the cumulative energy and a wide range in the number of MS events, from zero to six; in the third stage, the number of MS events was generally one or two and remained low while the cumulative energy initially increased significantly and then tended to level out.
The number of daily MS events remained at between zero and four in the first stage of MS monitoring in the spillway tunnel (2 August to 11 September 2020), typically below two, and the cumulative energy of MS events gradually increased. In this stage, the main tunnel was being slowly excavated while the #1 adit of the spillway tunnel was already finished. This stage mainly involved supporting the intersection of the #1 adit and the main tunnel and conducting blasting and excavation for the spillway tunnel. The excavation of the upper portion of the main tunnel was gradually accelerated with the completion of the excavation and support of the intersection with the #1 adit. In addition, due to the disturbance from the construction of the adjacent diversion tunnel, micro-fractures developed in the surrounding rock of the spillway tunnel, and MS activity increased gradually. In the second stage (12 September to 8 November 2020), the number of daily MS events fluctuated between one and six, reaching or exceeding five events on several days. In particular, the number of daily MS events reached a low point at the end of September before rising dramatically from 1–2 to 4–6 events, peaking at six events on October 9 and October 22. The cumulative energy of MS events grew slowly before October 7. Following October 7, it surged for 5 days before climbing at a steadily slower rate. In this stage, MS activity diminished as the support for the section from the intersection of the #1 adit to the tunnel face of the main tunnel was completed. After the support was completed, the upper portion of the main tunnel was dug out more quickly, with an average of two blasts per day and a maximum of three. Furthermore, due to the intersection of the spillway tunnel with two faults close to the working chamber, the damage to the surrounding rock from the intersection of the spillway tunnel and the #1 adit (stake 0 + 135 m) to the working chamber (stake 0 + 450 m) worsened, especially near the working chamber (stakes 0 + 400 m to 0 + 450 m). Internal stress adjustment, the initiation and development of micro-fractures, and a rise in MS activity were all brought on by this. Following that, tunneling was slowed down and MS activity gradually decreased once the excavation of the pressurized section was completed. In the third stage of the MS monitoring period (9 November to 16 December 2020), the number of daily MS events showed an overall decrease and an increase for some periods. The number of daily MS events remained between zero and three but was usually one. Despite this, until early December, the cumulative energy of the MS events appeared to rise progressively before leveling off after December 5. This stage mainly involved supporting the working chamber and penetrating the first layer of the spillway tunnel, which resulted in fewer MS events. However, the blasting and excavation of the adjacent diversion tunnel were accelerated on the upstream side, and the tunnel face was advanced to the stake number of the diversion tunnel corresponding to the working chamber of the spillway tunnel. This caused more energetic MS events to be generated on the side next to the diversion tunnel, increasing the cumulative energy of the events.
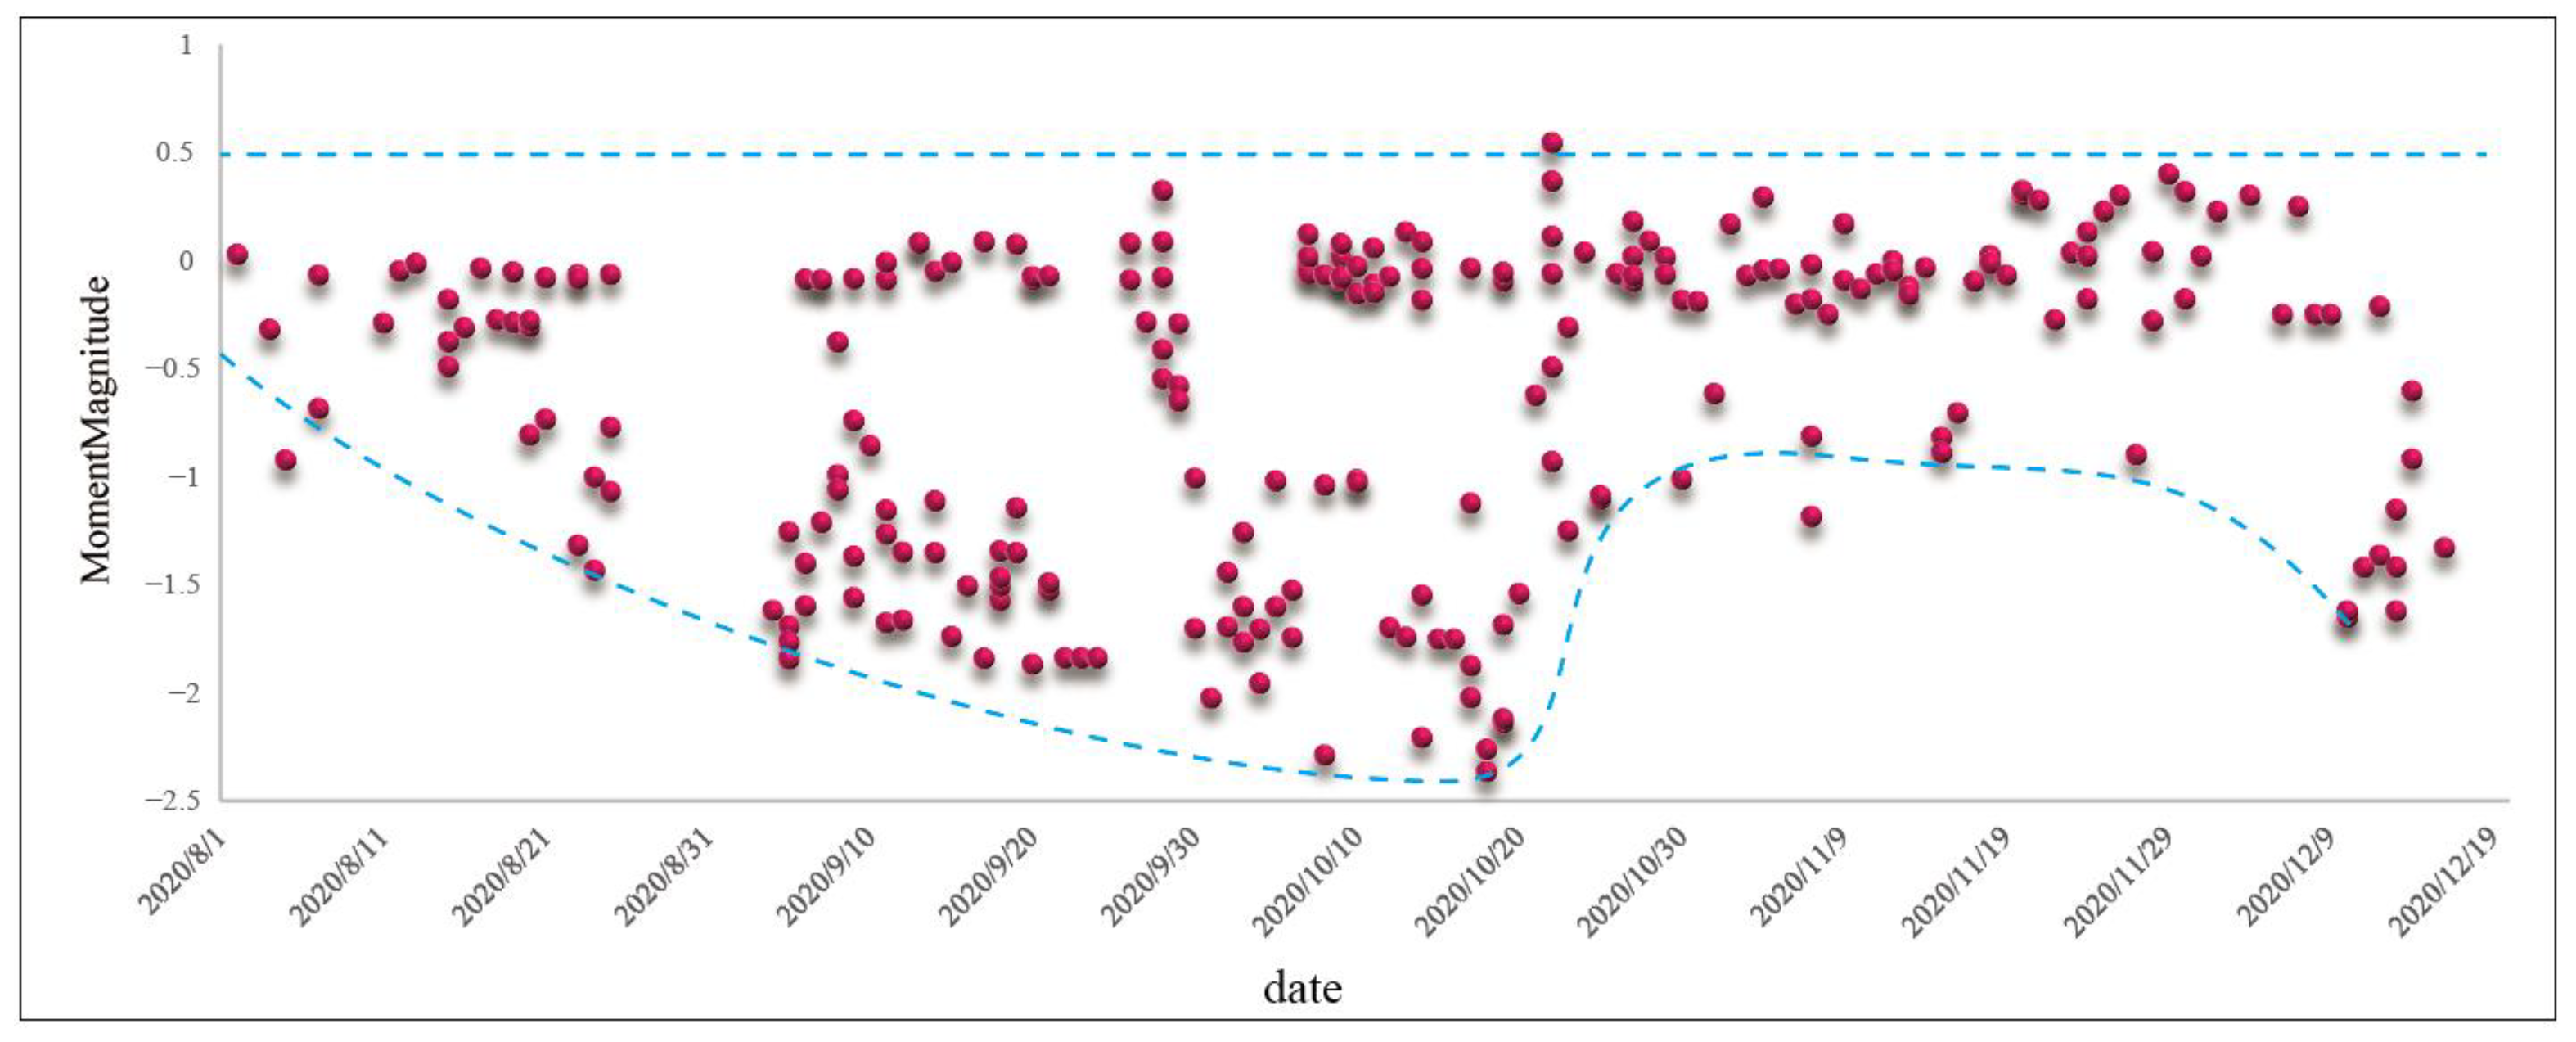
Figure 4 shows the temporal evolution of the moment magnitude of MS events. As can be seen, the moment magnitude of MS events in the surrounding rock of the spillway tunnel mainly ranged from –2.5 to 0.5, remaining at an overall low level. Note that after the completion of excavation and support of the working chamber of the spillway tunnel, the moment magnitude of MS events was distributed in a concentrated manner in the excavation stage of the unpressurized section of the spillway tunnel, ranging from –1.0 to 0.5. In this stage, the surrounding rock was mainly affected by excavation and unloading, as well as the frequent blasts for the adjacent diversion tunnel. Despite a decrease in the number of MS events, the moment magnitude was greater and more concentrated, and the level of energy dissipation increased (see Figure 3).

3.2. Spatial Evolution Characteristics of MS Events

As micro-fractures inside the surrounding rock are characterized by MS events, the evolution of the micro-fractures is characterized by the spatial concentration of MS events and the dynamic migration of the concentration zone. In order to ensure the safety and efficiency of the site’s construction, it is necessary to delineate the damage zone and determine the potential for surrounding rock deformation by studying the spatial concentration and dynamic migration of MS events.
Figure 5 shows the spatial distribution and density of MS events. In the spatial distribution diagram, the filled circles indicate MS events; the size of the filled circles indicates the energy level of the MS events; the color of the filled circles indicates the moment magnitude of the MS events. In the density cloud diagram, different colors indicate different densities of MS events. The spatial distribution law of MS events can be observed by an analysis of Figure 5. In particular, according to the top view, the MS events were distributed in the surrounding rock on both sides of the spillway tunnel, mainly concentrated in three zones: stakes 0 + 340 m, 0 + 400 m to 0 + 450 m, and 0 + 500 m to 0 + 540 m. With the excavation and unloading of the spillway tunnel, micro-fractures were concentrated in the area of poor geological structure and the area disturbed by strong unloading under the influence of stress adjustment, which is consistent with the law presented in the spatial distribution diagram and density cloud diagram of MS events in Figure 5.
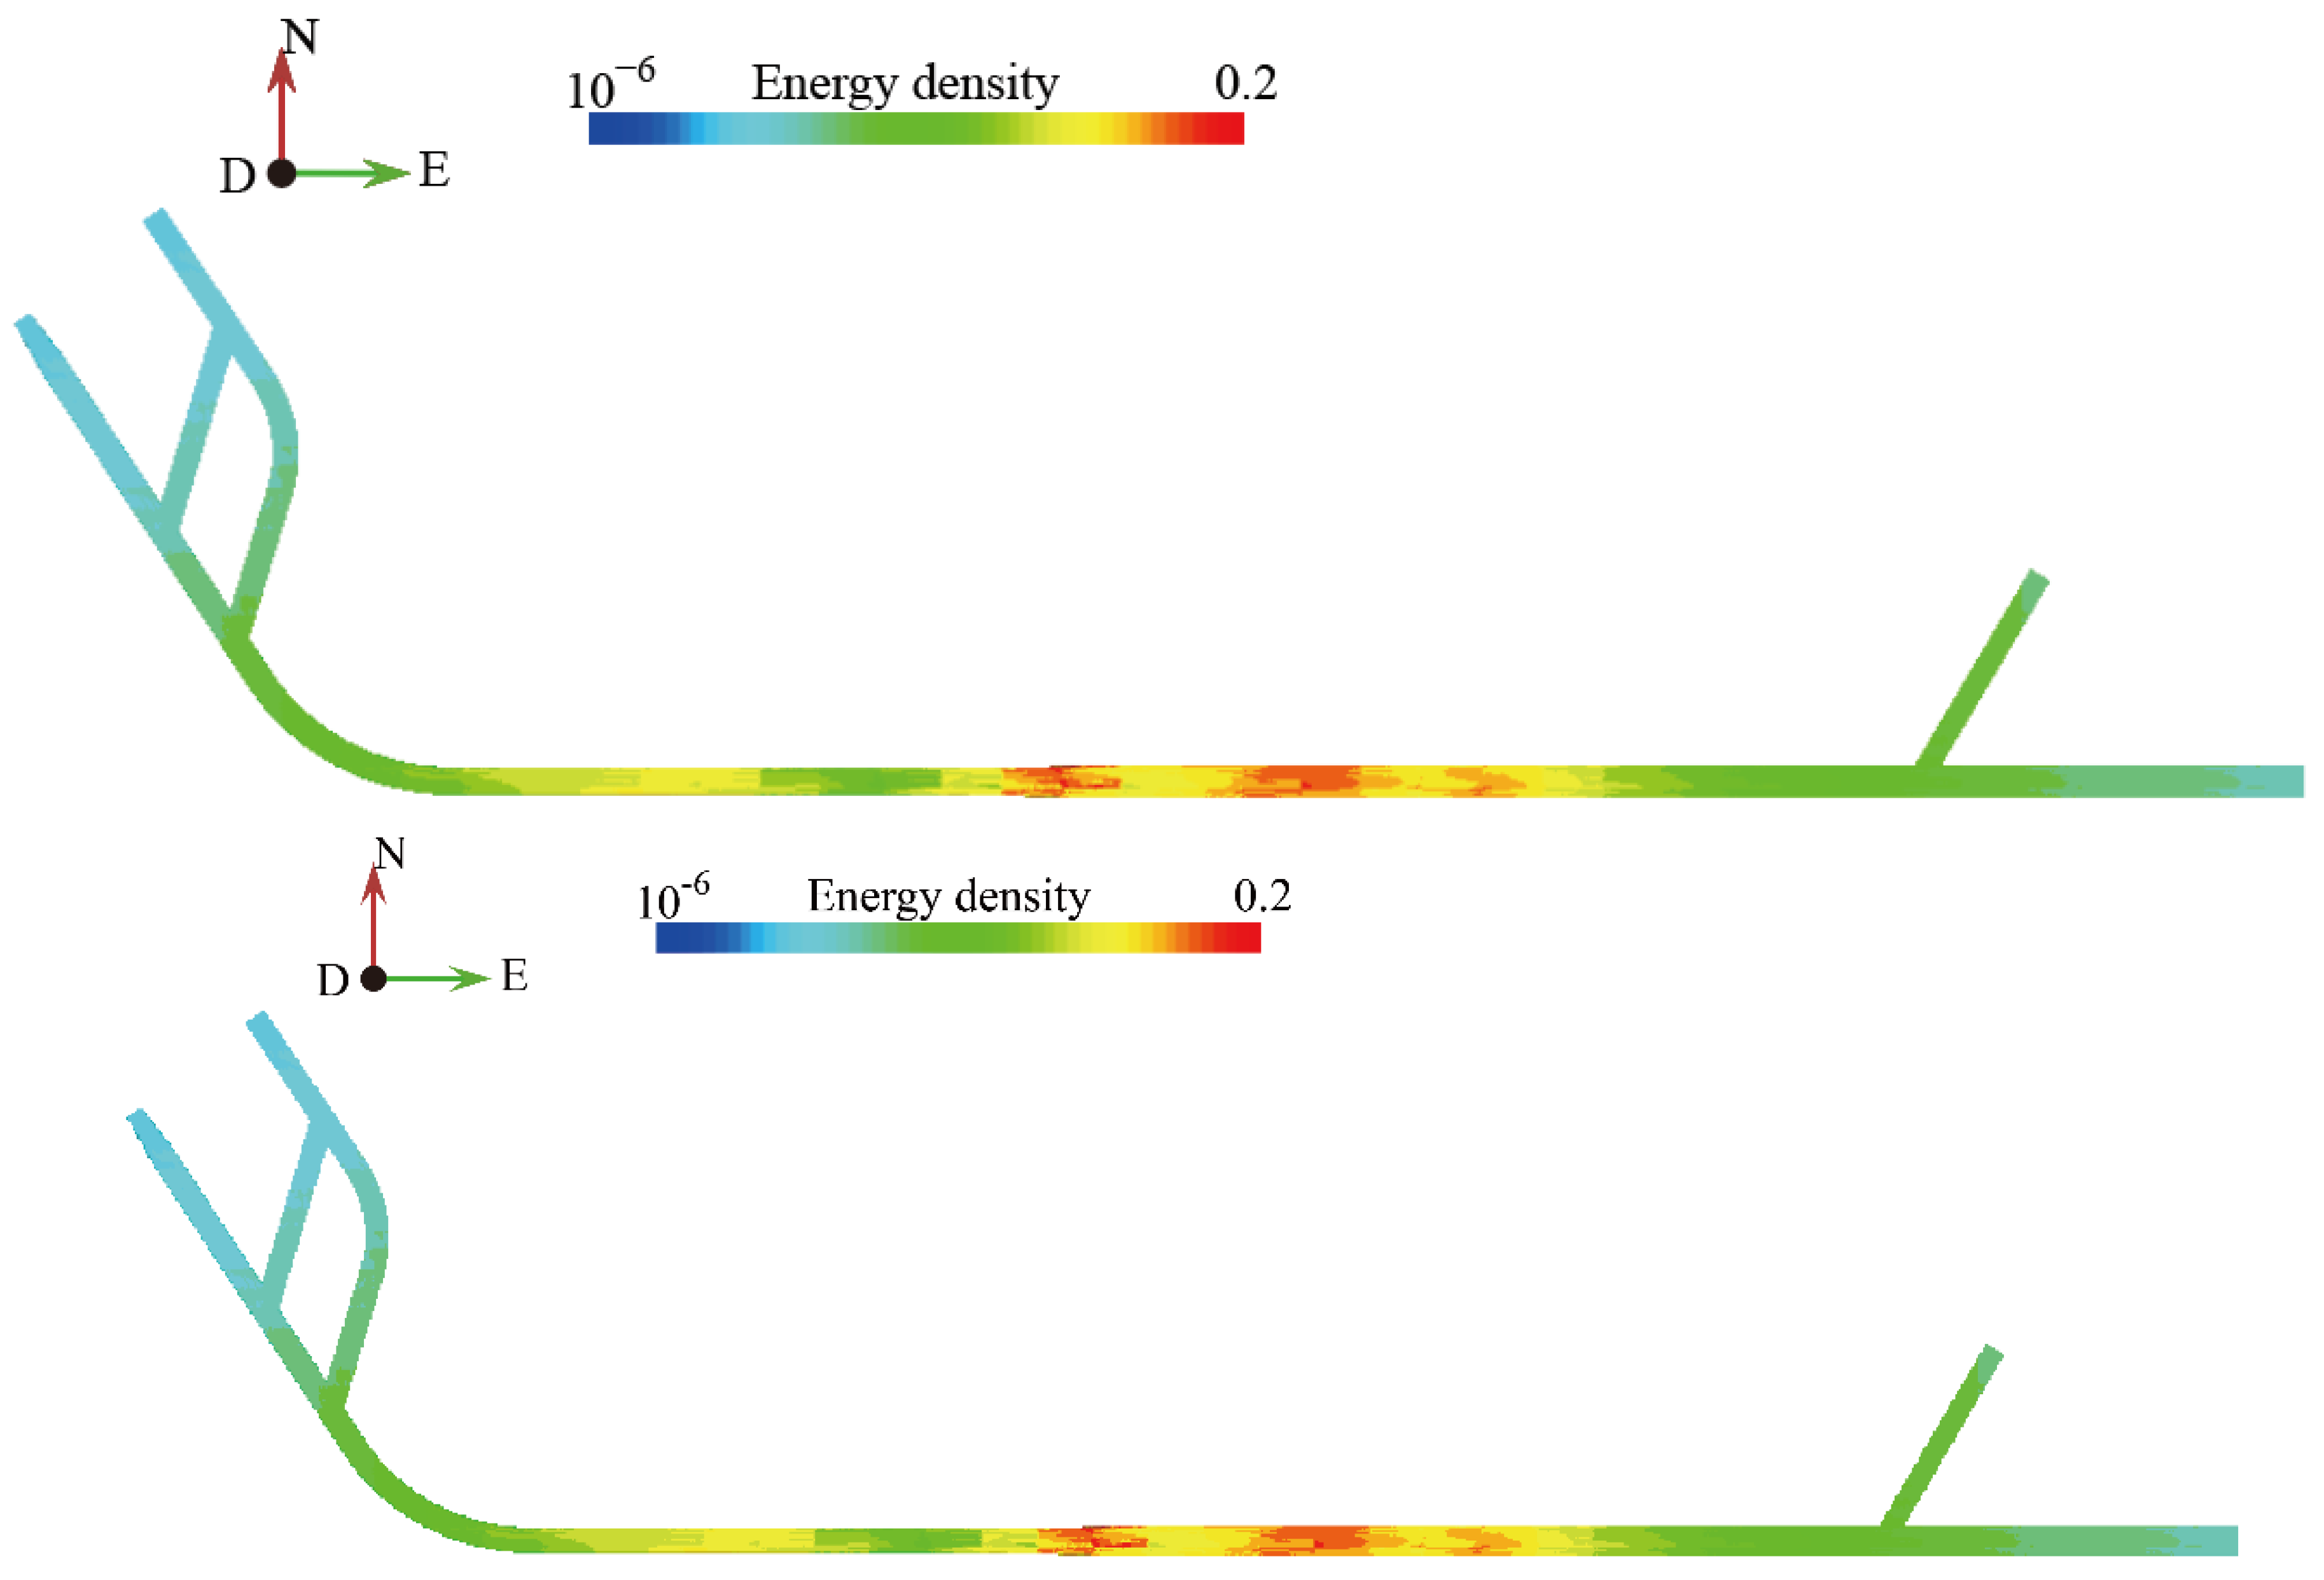
One of the most crucial elements of micro-fractures which can be used to assess the degree of damage to the surrounding rock is the energy release of MS events [41]. The continuous release of internal elastic energy from the surrounding rock frequently coincided with the occurrence of micro-fractures, which are reflections of rock damage. This resulted in the deterioration of the mechanical performance of the surrounding rock, which in turn led to a worsening of the damage to the surrounding rock. Figure 6 shows the density of energy of micro-fractures that occurred during the excavation and unloading of the spillway tunnel. It is clear that the energy from the surrounding rock in the spillway tunnel was mainly concentrated in three zones, namely, stakes 0 + 300 m to 0 + 340 m, 0 + 420 m to 0 + 450 m, and 0 + 500 m to 0 + 580 m, which were dominated by MS events with higher levels of energy and larger moment magnitude scales. A comparison of Figure 5 and Figure 6 reveals that the spatial distribution of energy and MS events was roughly the same. As a result, the two zones with the highest energy densities sustained the most serious damage and were at risk of becoming unstable, and thus, it is important to reinforce the support for these zones.

4. Numerical Modeling of the Excavation of Adjacent Tunnels

4.1. FLAC3D Finite-Difference Software

The Fast Lagrangian Analysis of Continua in 3 Dimensions (FLAC3D) is numerical modeling software developed by Itasca Consulting Group, Inc. in the U.S. It is also a numerical analysis method that uses 3D finite differences to simulate the mechanical properties of the rock-soil mass or other materials under different stresses. The method involves dividing the computing object into several elements, establishing a linear or nonlinear constitutive model, and imposing boundary conditions. The element deforms along with the material if the material yields or flows plastically under stress. It is capable of solving differential equations and accurately simulating the yielding, softening, plastic flow, and large deformations of the material using a mixed/discrete finite element model and an explicit finite difference method.

4.2. Modeling

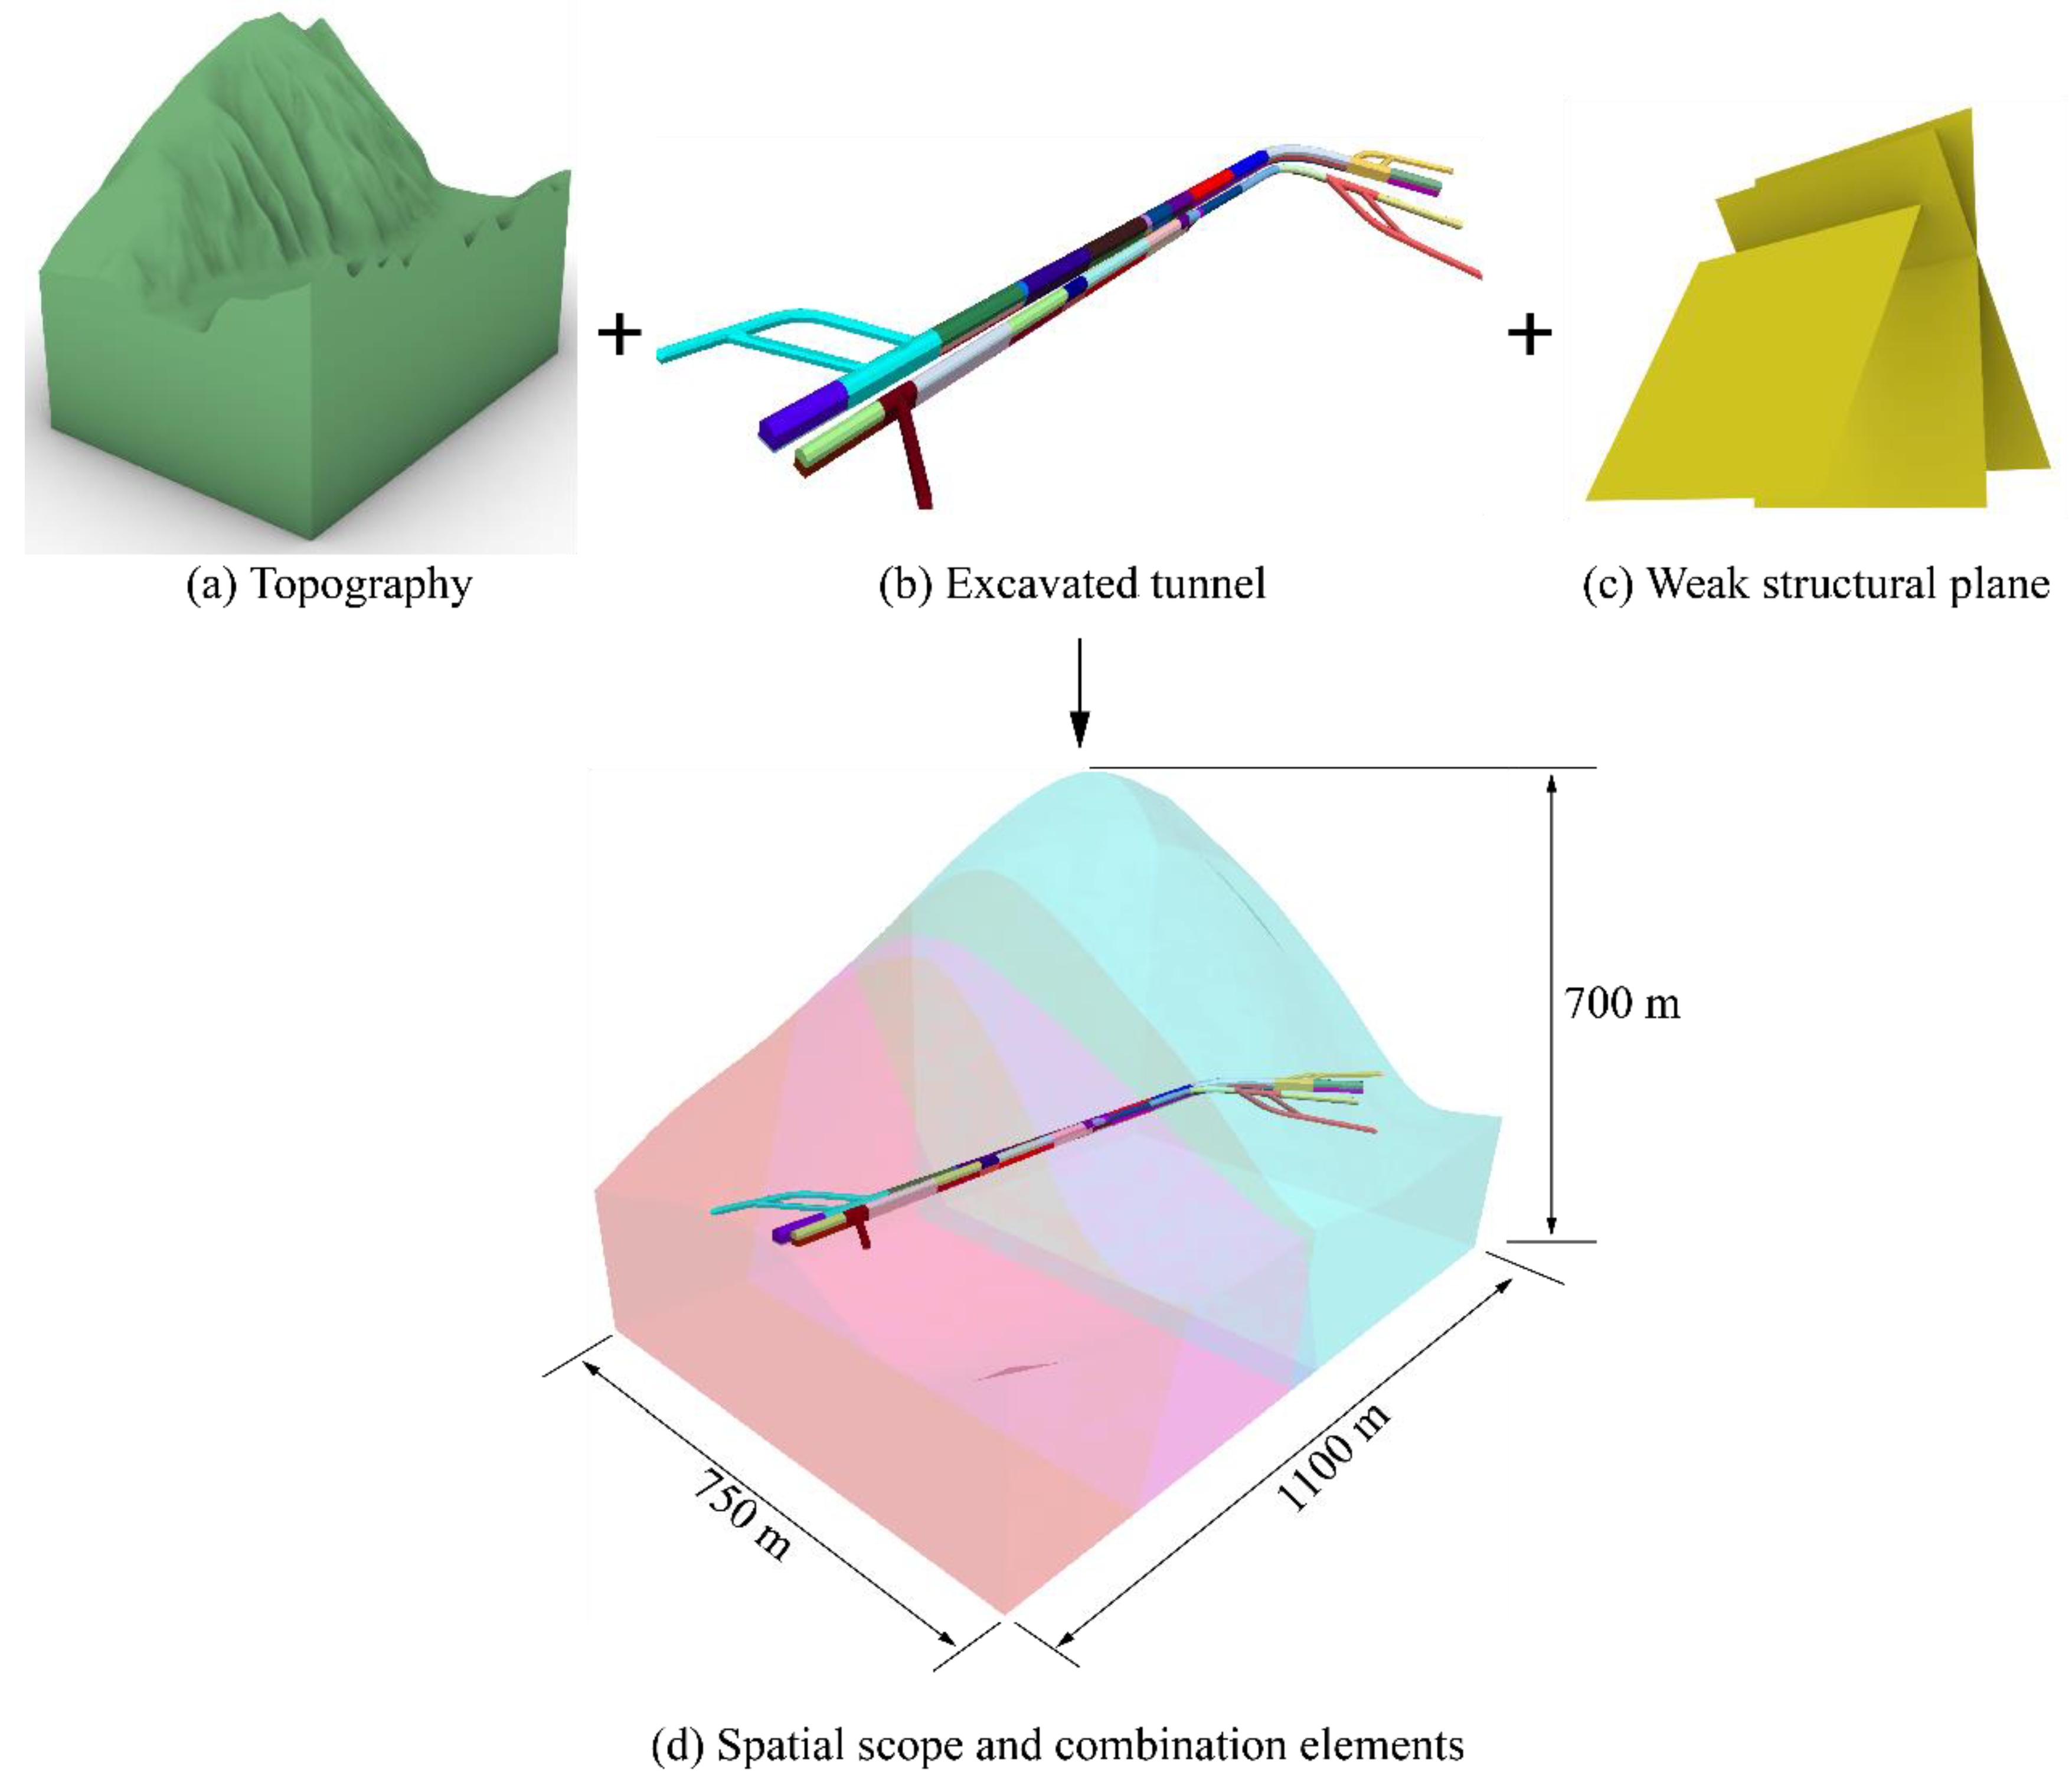
The contour diagram of the dam site and the topography of the area being excavated for the spillway tunnel and diversion tunnel of the Jinchuan Hydropower Station served as the basis for the modeling of the surrounding rock. Based on the excavation and support arrangement of the spillway tunnel and the diversion tunnel, the main faults during the excavation of the two tunnels were modeled, and the excavation process was broken up into layers and sections. Finally, the FLAC3D numerical calculation model, which considers the fault, excavation process, and weak structural plane, was built as shown in Figure 7. When the distance between both the two tunnels and each boundary was greater than 10 times the tunnel diameter, the model was considered to be satisfactory. Figure 7 shows a model that was divided into tetrahedral meshes and measured 1100 m along the spillway tunnel axis, 750 m perpendicular to the Dadu River, and 700 m overall from the bottom of the model to the highest point of the terrain. The total number of meshes was approximately 831,000, and the mesh size was extended from 0.5 to 10 m from the inside out. Gravity is the dominant factor controlling the ground stress field in the project area, according to the hydrometeorology and engineering geology studies of the dam site area of the Jinchuan Hydropower Station. Therefore, incorporating the effects of topography, fault, and gravity stress into calculations can improve simulation results. To more accurately restore the stress–strain characteristics of the surrounding rock during the excavation and unloading of the two tunnels of the Jinchuan Hydropower Station, the model was divided into layers and sections in strict accordance with the construction process and construction logs of the spillway tunnel and diversion tunnel. In particular, the diversion tunnel was dug in sections of 100 m, with more sections added at the fault, and it was excavated in three layers, each measuring 8.26 m, 7.5 m, and 2 m in height. The pressurized section of the spillway tunnel was excavated in two layers, each measuring 8.5 m and 4.5 m in height, while the unpressurized section was dug out in three layers, each measuring 9.15 m, 7 m, and 1 m in height. The spillway tunnel was also dug in sections of 100 m, with more sections being constructed at the fault.

4.3. Constitutive Model and Parameters

The Mohr–Coulomb constitutive model, which represents loose or cemented granular materials (such as concrete, soil, and rock), is a general geotechnical model for simulating underground excavation and slope instability. Moreover, the Mohr–Coulomb constitutive model and the Drucker–Prager model are the two plastic models with the highest calculation efficiency, whereas the other plastic constitutive models require more time and memory during the calculation process. The Mohr–Coulomb model was chosen for this analysis to accelerate the calculation because the surrounding rock of the spillway tunnel and diversion tunnel is loose.
The calculation parameters were based on the geological report, which states that IV1 dominates the surrounding rock in the vicinity of the spillway tunnel and the diversion tunnel. The main faults (f31, f27, and f54) were primarily well-extended weak structural planes made up of uncemented schist, mylonite, fault gouge, and a few rock fragments. The technical parameters of the surrounding rock and faults in the model were selected based on the above description, as listed in Table 1 and Table 2.

4.4. Mechanical Response of the Surrounding Rock during Step-by-Step Excavation

Monitoring the mechanical response of the surrounding rock is essential to the success of the entire tunnel excavation progress and even the entire hydropower project because the excavation of the first layer of the spillway tunnel and the diversion tunnel in the Jinchuan Hydropower Station destroyed the stress state of the primary surrounding rock and directly exposed faults and other weak structural planes. Therefore, this section focuses on the analysis of the excavation and penetration of the first layer of the spillway tunnel and the diversion tunnel, and the excavation process was modeled in strict accordance with the construction process and construction logs.
During the site construction process, the excavation of the spillway tunnel and the diversion tunnel was divided into 71 sections, as shown in Figure 7b. The penetration of the first layer was the research focus, and the excavation steps prior to it are listed in Table 3 and Table 4. The two adjacent tunnels were excavated in 10 steps before the first layer was penetrated, as seen in the tables, for a total of 28 sections excavated. The spillway tunnel and the diversion tunnel were excavated in opposite directions at the same time. Excavation from the inlet to the outlet is referred to as “leftward excavation,” and excavation from the outlet to the inlet is referred to as “rightward excavation.”

4.4.1. Deformation Characteristics of the Surrounding Rock

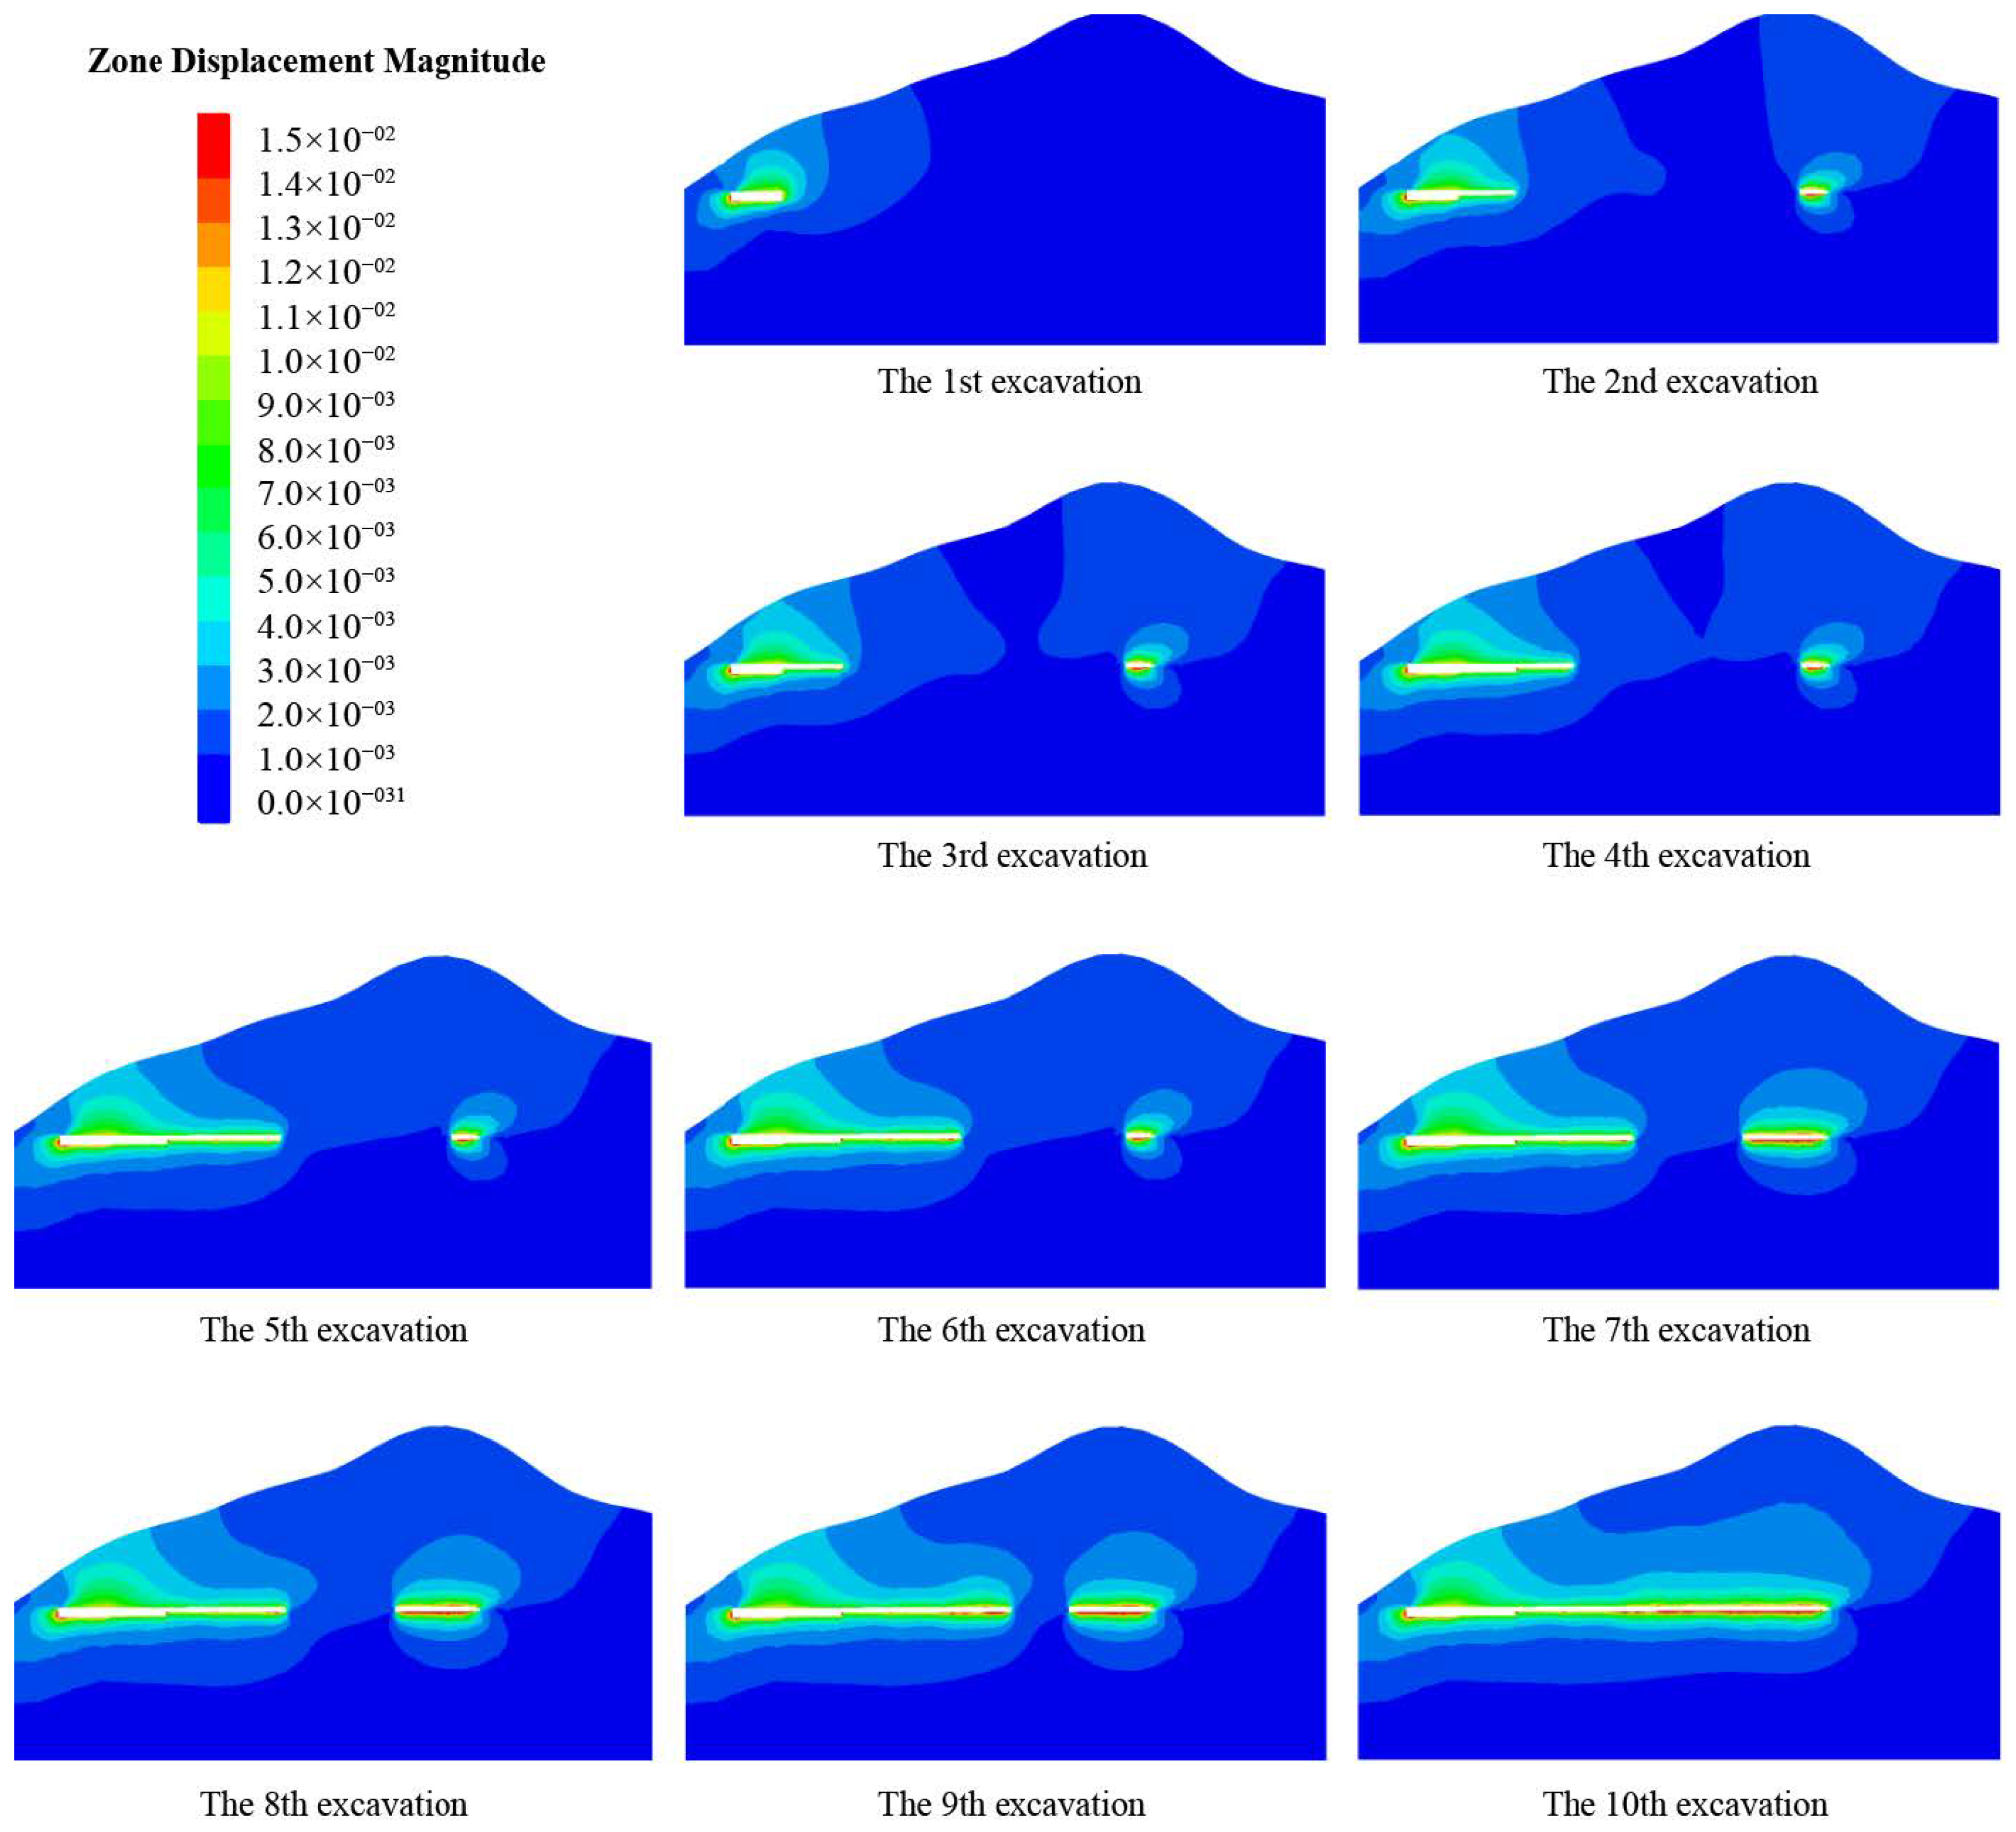
The deformation evolution characteristics of the surrounding rock in the spillway tunnel excavated to the penetration of the first layer were obtained after the 3D numerical calculation using FLAC3D, as shown in Figure 8.
Figure 8 shows the deformation evolution law of the surrounding rock of the spillway tunnel during the excavation and unloading process. In general, the surrounding rock showed little deformation and remained stable. The surrounding rock changed dramatically as the excavation and unloading proceeded. The deformation of the surrounding rock was especially severe near the intersection of #2 adit and the main tunnel, or the exposure area of faults, indicating that the stress concentration at the intersection of the fault and the tunnel was the main factor affecting tunnel stability. The displacement value gradually decreased as the distance between the surrounding rock and the free face increased.
The displacement of the tunnel surrounding rock increased as the excavation progressed, according to an analysis of the displacement caused by the excavation in sections shown in Figure 9. The initial excavation destroyed the stress state of the primary rock and caused complete stress self-adjustment in the surrounding rock, and the unloading process at the tunnel intersection was primarily responsible for tunnel deformation. The displacement of the shallow surrounding rock was mostly between 5 and 9 mm, with a maximum of 10 mm, whereas the displacement of the deep surrounding rock was less. When the rightward excavation reached the vicinity of f54, a large displacement of 8 mm was observed at the intersection of the fault and the floor, but deformation was observed at a shallow depth of 0.5 m, and the deformation of the surrounding rock in the vicinity of f54 was maintained below 5 mm. This indicates that f54 caused minor deformation to the surrounding rock. When the rightward excavation of the spillway tunnel reached f54, a displacement of 10 mm was observed at the intersection of the fault and the tunnel, with a large difference in displacement between the fault’s hanging wall and footwall. As a result, it is assumed that a fault-slip failure occurred there, resulting in greater deformation. The leftward excavation caused significant floor heave deformation. According to the analysis, the first layer of excavation formed a cross-section with an arch on the upper part and a plane on the lower part because the pressurized section was circular. The arch material could transform the upper load into transverse pressure along the arch ring when it was under pressure, and the rock had better compressive performance, so smaller deformation was observed on the upper part, whereas a larger displacement was observed on the lower-part free face toward the unstressed plane. Moreover, no obvious floor deformation was discovered during site surveys, due mainly to the site being repeatedly crushed by heavy-duty machinery, and no obvious floor heave deformation was observed. The displacement impact area of leftward excavation and rightward excavation intersected and caused deformation at f31 and f27, which were not excavated. According to Figure 8, the diversion tunnel had greater deformation in the vicinity of its inlet than the spillway tunnel, owing to the larger span of its left and right side walls. Before excavation in both directions reached f27, no obvious deformation was observed, and the deformation of the surrounding rock did not differ significantly from that observed during the excavation of the previous section. When rightward excavation reached f27, the displacement of the tunnel face increased sharply on the hanging wall of the fault, reaching 25 mm. Furthermore, the relaxation depth was greater, and a 10 mm displacement was still present 8 m from the tunnel face. Because the fault was disturbed by excavation, the mechanical performance of the surrounding rock deteriorated, and the surrounding rock on the free face lost the bearing layer, resulting in significant deformation and displacement in a direction far from the tunnel face. As a result, excavation of this section should be closely followed by advanced support to prevent microscopic deformation or even collapse of the surrounding rock near the tunnel face. During step 8 of the excavation, the first layer of the spillway tunnel was penetrated, resulting in a large deformation of the surrounding rock, up to 15 mm between f27 and f31. The next two steps were to excavate the diversion tunnel so that the surrounding rock of the spillway tunnel completed stress adjustment without obvious displacement changes, and only the area affected by deformation extended slightly into the deep.
The deformation evolution characteristics of the surrounding rock in the diversion tunnel excavated to the penetration of the first layer were obtained using FLAC3D after a 3D numerical calculation, as shown in Figure 9.
Figure 9 shows the deformation evolution law of the surrounding rock of the diversion tunnel during the excavation and unloading process. In general, the deformation was small, but it was greater than in the spillway tunnel, due mainly to the wider span of the diversion tunnel and the greater heights for layered excavation. As the excavation and unloading proceeded, the surrounding rock showed obvious displacement changes, particularly at the intersection of the #2 adit and the main tunnel and at the intersection of the leftward excavated section and the fault, indicating that the stress concentration at the intersection of the tunnel and weak structural planes were the main factors affecting tunnel stability. The analysis of the leftward excavated section reveals that the deformation was large due to the greater burial depth of this section compared with other sections, and this area was dominated by gravity load, implying that the deformation of the leftward excavated section was primarily caused by the higher ground stress. Similarly, the excavation process of the diversion tunnel was broken down into sections. Similar to the spillway tunnel, the initial excavation destroyed the stress state of the primary rock and caused complete stress self-adjustment in the surrounding rock. Moreover, the tunnel deformed at the intersection of the tunnel due to unloading, with the maximum deformation being slightly larger than that of the spillway tunnel, reaching 18 mm. The displacement of the shallow surrounding rock was mostly between 10 mm and 15 mm, which was related to the larger excavation section of the diversion tunnel. The displacement occurred at the intersection of the fault and the tunnel toward the free face when the diversion tunnel was excavated to the vicinity of f54 (step 3 excavation), and the deformation of the shallow surrounding rock was small in the exposure area of the fault. According to the analysis, the hanging wall of the fault was disturbed by excavation and unloading, and the surrounding rock on the hanging wall was under the contact force of that on the footwall, resulting in only minor deformation. However, when the first layer was excavated through the fault and the second layer was excavated near the fault, the surrounding rock of the diversion tunnel at stakes 0 + 630 m to 0 + 650 m exposed two free faces and a fault plane on the other side and lost the bearing layer. As a result, the displacement vector developed in the direction of the two free faces, with a value close to 20 mm. The deformation of the surrounding rock near the first layer of the tunnel face was inconspicuous, and the deformation of the shallow surrounding rock was less than 7 mm. At this time, the deformation in the leftward excavated section was generally greater than that in the rightward excavated section due to relatively high ground stress. The surrounding rock deformed slowly during the subsequent excavation, and only a few areas were slightly deformed. The deformation started to increase significantly once the excavation reached the f27 and f31 areas. When the tunnel passed through f27 and f31, the deformation in the exposed area of the fault increased. Moreover, on the roof, the deformation on the hanging wall of the fault was less than that on the footwall, whereas, on the floor, the deformation on the hanging wall of the fault was greater than that on the footwall. According to the mechanical structure of the fault, on the roof, the surrounding rock on the footwall bore the weight of that on the hanging wall, resulting in a small deformation on the surrounding rock of the hanging wall, while the surrounding rock on the hanging wall pressed that on the footwall in the direction of the free face, resulting in a large displacement of the surrounding rock on the footwall toward the free face. On the floor, the surrounding rock on the footwall was pressed by that on the hanging wall in the opposite direction of the free face, resulting in inconspicuous deformation and displacement. The pressure received by the surrounding rock on the hanging wall from that on the footwall, in contrast, was directed toward the free face, resulting in a greater displacement of the hanging wall than the footwall.

4.4.2. Stress Characteristics of the Surrounding Rock

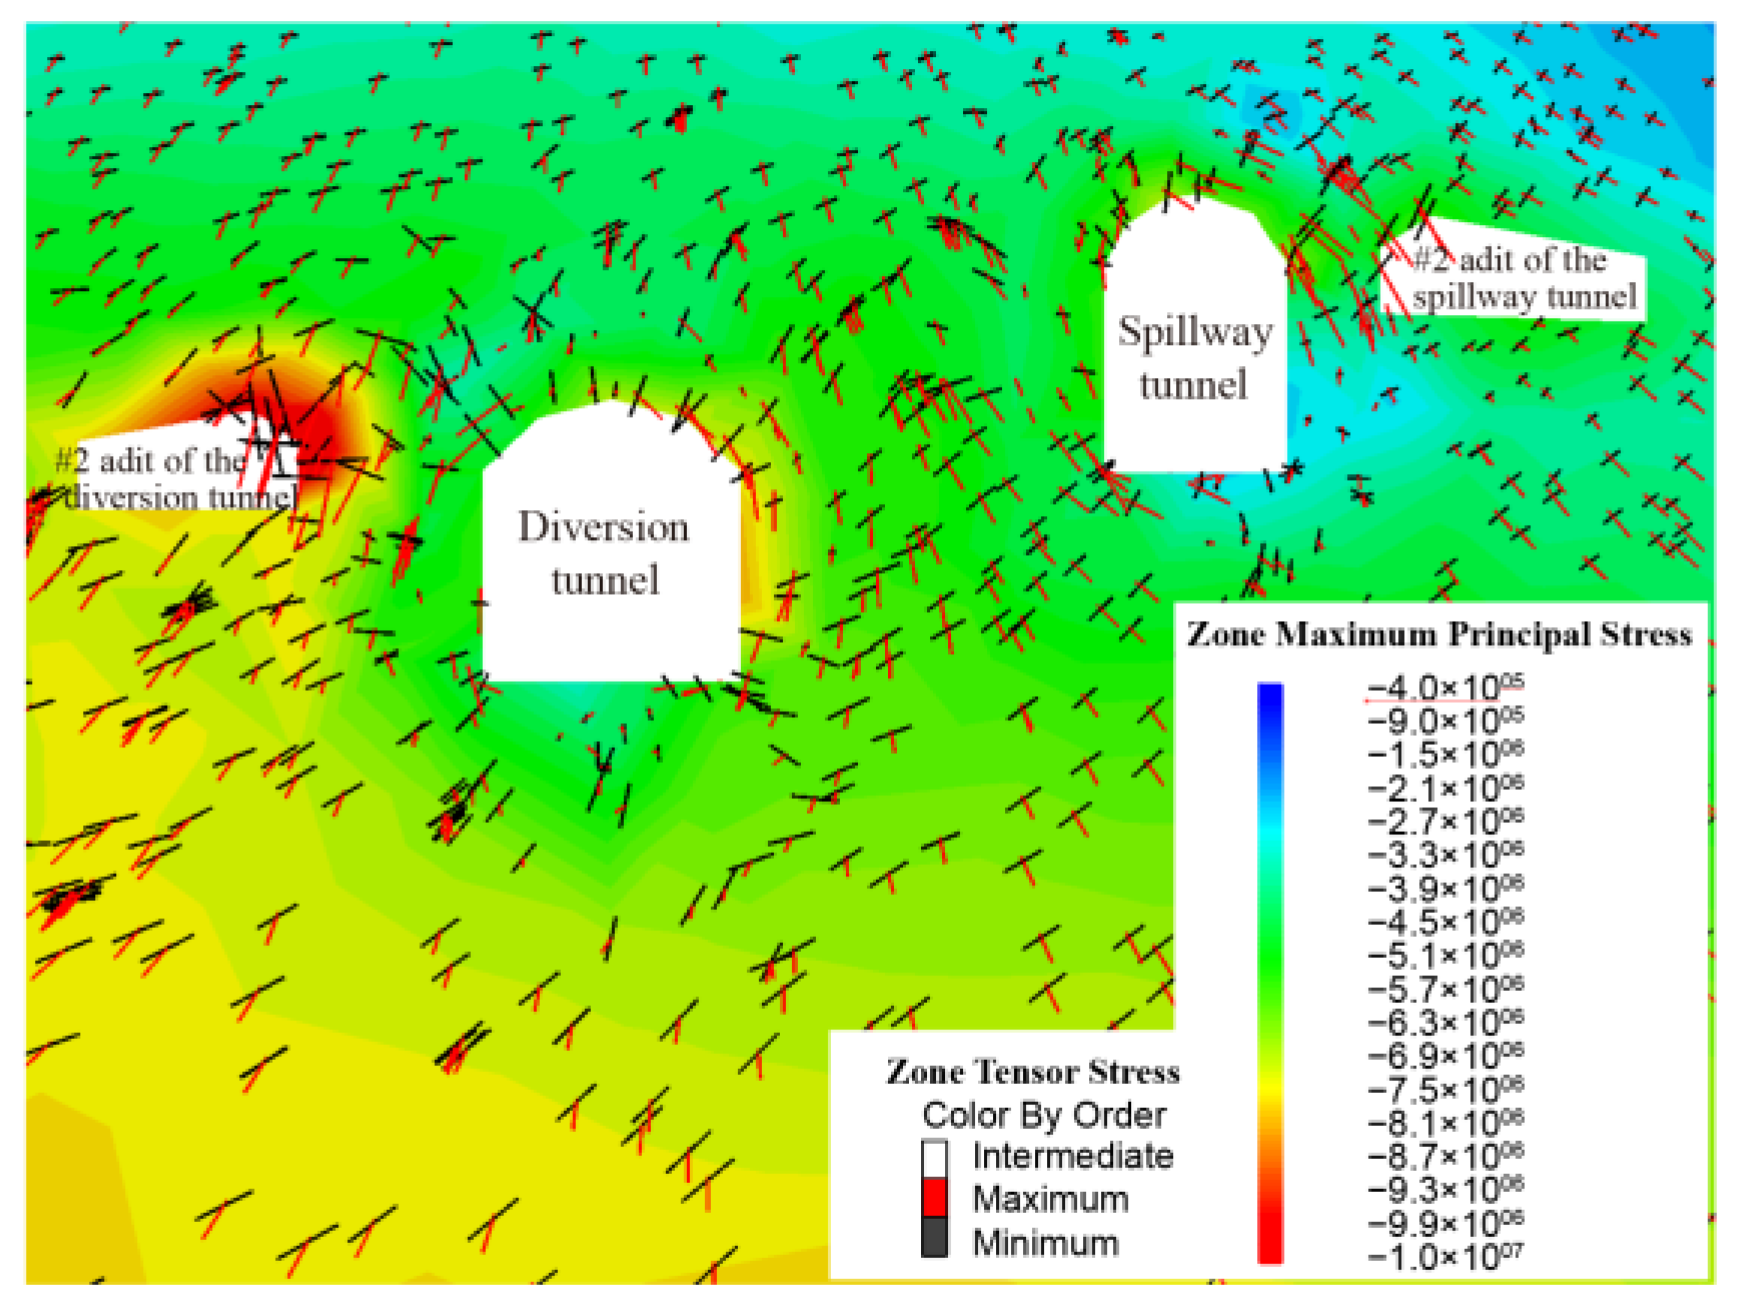
To examine the stress magnitude and direction, the stress tensor and stress cloud diagram were both examined. Based on the analysis of the deformation of the surrounding rock, two typical sections were selected for the study: (1) the area influenced by f31 and f27 (stake 0 + 450 m in the spillway tunnel), and (2) the area near the intersection of the adit and the main tunnel at the outlet (stake 0 + 870 m in the spillway tunnel).
Figure 10 and Figure 11 show the stress tensor and maximum principal stress at 0 + 870 m in the spillway tunnel as well as the stress tensor and minimum principal stress, respectively. The fact that the maximum burial depth was only around 50 m and that the maximum and minimum principal stresses did not concentrate substantially resulted in relatively low stress values. Despite low stress values, the right spandrel of the #2 adit of the diversion tunnel clearly showed a stress concentration, while the left arch footings of the #2 adit of the diversion tunnel, the side wall of the horseshoe-shaped cross-section of the diversion tunnel, and the left spandrel of #2 adit of the spillway tunnel all showed a slight stress concentration. The direction of the principal stress can be seen from the stress tensor. In particular, the minimum principal stress of the shallow surrounding rock was directed at the free face, while the direction of the maximum principal stress was horizontal and parallel to the direction of the tunnel axis, thus helping ensure tunnel stability.
Figure 12 shows the stress tensor and maximum principal stress at stake 0 + 450 m in the spillway tunnel, and Figure 13 shows the stress tensor and minimum principal stress at stake 0 + 450 m in the spillway tunnel. It is clear that the stress value was higher than that at stake 0 + 870 m in the spillway tunnel, and the maximum and minimum principal stresses were concentrated more obviously. This is primarily due to the greater ground stress and burial depth in this area. There were obvious stress concentrations on the left and right side walls and spandrel of the diversion tunnel, as well as the left spandrel of the spillway tunnel. It can be seen from the stress tensor that the maximum principal stress was nearly perpendicular to the tunnel axis rather than parallel to it, which undermined the stability of the surrounding rock of the tunnel. To avoid macroscopic deformation of the surrounding rock, its support at this location needs to be strengthened.

4.5. Comparison between Numerical Modeling and Monitoring Results

Figure 14 compares the deformation of the surrounding rock of the spillway tunnel obtained by numerical modeling with the results of MS monitoring.
In the analysis of the MS events in the surrounding rock of the spillway tunnel in Section 3.2, the accumulation zone of the MS events was divided into three zones (stake 0 + 340 m, stakes 0 + 400 m to 0 + 450 m, and stakes 0 + 500 m to 0 + 540 m), i.e., zones I, II, and III, as shown in Figure 14b. In the analysis of the density of energy from MS events, three zones with a high density of energy were also observed, i.e., stakes 0 + 300 m to 0 + 340 m, 0 + 420 m to 0 + 450 m, and 0 + 500 m to 0 + 580 m in the spillway tunnel, as shown in Figure 14c. This paper describes the analysis of the spillway tunnel and diversion tunnel excavation following the actual construction process by using FLAC3D and shows the displacement of the surrounding rock in the tunnel axis section of the spillway tunnel, as shown in Figure 14a. Figure 14a shows that there were three zones with large deformation of the surrounding rock (zones I, II, and III), which corresponded to the three accumulation zones on the density cloud diagrams of MS events and energy from the events. Furthermore, the numerical modeling results corresponded to the risk areas revealed by MS monitoring, and the two methods corroborated each other. Then, the numerical modeling results were compared with the conventional monitoring results to prove the accuracy of the numerical modeling results, thus demonstrating the feasibility of the research method integrating MS monitoring, numerical modeling, and conventional monitoring.
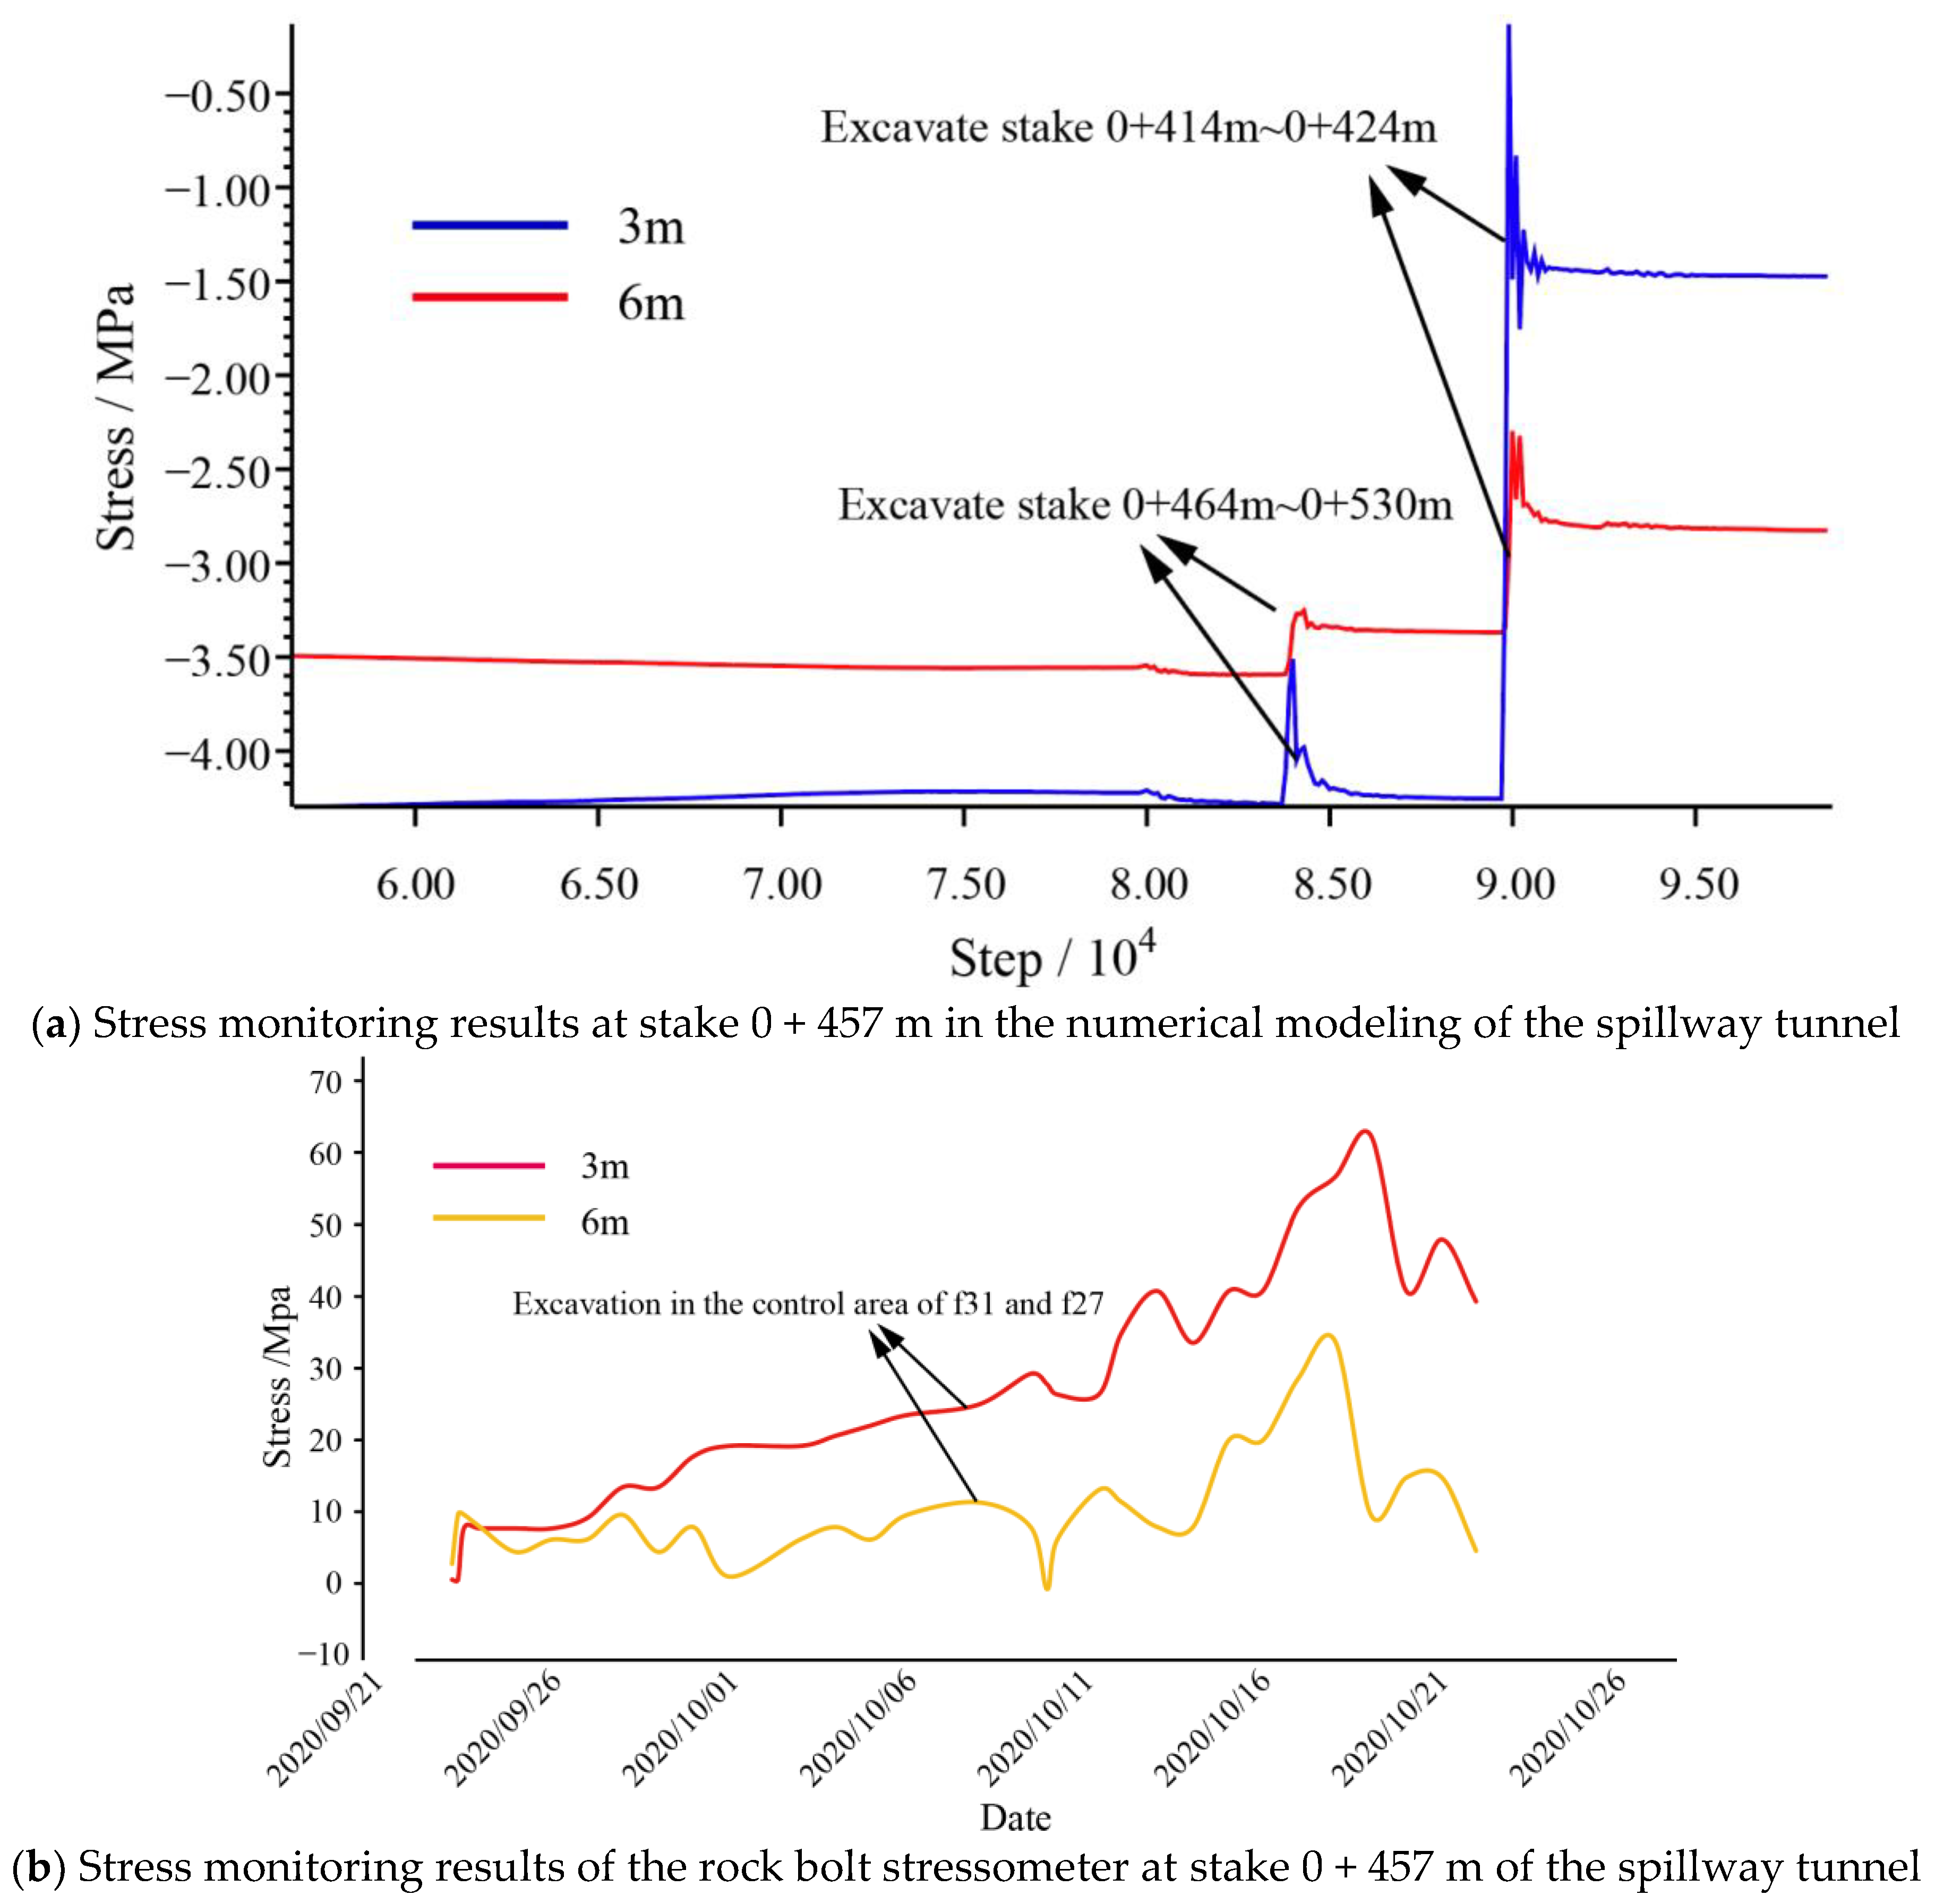
Figure 15 compares the detected stress value in numerical modeling with the monitoring results of the rock bolt stressometer at stake 0 + 457 in the spillway tunnel. Overall, there are similarities between the traditional monitoring and numerical modeling: (1) The stress changed slowly in the beginning and suddenly in the latter stages. (2) The stress change at the burial depth of 3 m was greater than that at the burial depth of 6 m. According to the time-segment-based analysis, the excavation of the first layer of the spillway tunnel after October 6 gradually approached the structural plane, and the excavation in the control area of the structural planes f31 and f27 caused drastic changes to the rock bolt stressometer located at stake 0 + 457 m in the spillway tunnel. The numerical modeling results show the same characteristics of change. Particularly, the stress value increased abruptly around steps 85,000 and 90,000. Based on the step statistics in the numerical calculation process, it can be found that the two abrupt increases corresponded to the excavation of stakes 0 + 464 m to 0 + 530 m and 0 + 414 m to 0 + 424 m, both of which were caused by the excavation in the control area of f31 and f27 (f31 exposure area: stake 0 + 404 m; f27 exposure area: stake 0 + 450 m), which is consistent with the measured results of the rock bolt stressometer. The accuracy of the numerical modeling results was verified by the conventional monitoring results, and the numerical modeling and the MS monitoring supported each other. These results show that the research method integrating MS monitoring, numerical modeling, and conventional monitoring is feasible. Numerical modeling allows advanced calculation according to the construction process to delineate the risk zone in advance and to serve as a guide for construction design; MS monitoring can provide real-time monitoring of the surrounding rock, forecast the abnormal MS parameters during construction promptly for early warnings, and adjust the construction progress in real time; conventional monitoring is used to check the accuracy of the other monitoring and modeling processes.

4.6. Comparison between Numerical Modeling and Site Surveys

The site surveys show that several instability problems with the surrounding rock occurred in the spillway tunnel and the diversion tunnel during excavation, which agrees well with the deformation zones of the surrounding rock obtained from numerical modeling. For a comparative analysis, two typical zones were selected, as shown in Figure 16 and Figure 17.
Figure 16 shows the intersection of the #2 adit and the diversion tunnel at the outlet of the diversion tunnel. Stress concentration in many parts of this zone due to excavation and unloading caused large deformation, and tension cracks were observed at the intersection of the upper adit and the main tunnel and the intersection of the lower adit and the main tunnel, as shown in Figure 16a,b. The V-shaped failure shown in Figure 16c was caused by stress concentration at the right angle of the horseshoe-shaped cross-section of the main tunnel. According to site surveys, no regional weak structural planes were discovered, indicating that stress failure brought on by regional stress concentration rather than weak structural planes predominated in this zone. When such macroscopic deformation is discovered, the contractor should act quickly to limit it. For example, they should shorten the gap between steel arches and use more dense rock bolts for bolting. Figure 17 shows the cross-section at stake 0 + 450 m in the spillway tunnel, which is the control area of weak structural planes f31 and f27. The surrounding rock in this zone failed as a result of the penetration of the fault into the spillway tunnel and the diversion tunnel, which was dominated by structural failure due to the fault. Figure 17a shows the shear failure that occurred along the structural plane at stake 0 + 443 m in the spandrel of the spillway tunnel, and Figure 17b shows the block fall that occurred from the side wall to the spandrel of the diversion tunnel (stake 0 + 590 m in the diversion tunnel), which posed a serious threat to the stability of the surrounding rock and construction safety. The comparison between the numerical modeling and site surveys shown in Figure 16 and Figure 17 indicates that the large deformation zone in the numerical modeling matched the actual failure. Therefore, the numerical modeling method can more accurately reflect the mechanical response of the surrounding rock during the excavation and unloading process. It can also be used to study the interaction mechanisms of adjacent tunnels when multiple tunnels are excavated simultaneously and act as a reference for construction design and subsequent excavation.

5. Conclusions

In this study, a 3D MS monitoring system was built to keep track of the micro-fracture signals of the rock mass during the excavation and unloading of the spillway tunnel in the Jinchuan Hydropower Station. The 3D finite-difference numerical modeling software FLAC3D was used to simulate the site excavation process. Moreover, the numerical modeling results were compared with the monitoring results and site surveys to determine the failure mechanisms of the surrounding rock during the excavation and unloading and the following conclusions were drawn:
(1)
The study focused on the temporal and spatial evolution characteristics of MS events brought on by the excavation and unloading of the spillway tunnel. When the causes of MS event concentration under various working conditions were combined with the site construction conditions, it was determined that the main causes of MS events were construction disturbance and an unfavorable geological structure, which damaged the surrounding rock and made it vulnerable to macroscopic deformation.
(2)
In the tunnel at shallow burial depths, there was only a slight stress concentration at some right-angle intersections of the free face due to the low level of ground stress, and the minimum principal stress of the shallow surrounding rock was directed at the free face, while the direction of the maximum principal stress was parallel to that of the tunnel axis, thus helping ensure tunnel stability. In the deeper part of the tunnel, the stress concentration became obvious due to the increased level of ground stress, and the maximum principal stress was nearly perpendicular to the tunnel axis, thus undermining the stability of the tunnel surrounding rock.
(3)
By comparing microseismic monitoring results, numerical simulation, and conventional monitoring, it is found that there is a good spatial correspondence between microseismic monitoring and numerical simulation results, as well as good temporal correspondence between numerical simulation results and changes in stress gauges, which proves the feasibility of the comprehensive research method of microseismic monitoring combined with numerical simulation. It can provide reliable technical support for assessing the stability of the surrounding rock.

Author Contributions

Methodology, Y.S.; writing—original draft preparation, Y.Z.; writing—review and editing, H.M.; project administration, B.L. All authors have read and agreed to the published version of the manuscript.

Funding

This research was funded by the National Natural Science Foundation of China (42177143,42277461) and the Science Foundation for Distinguished Young Scholars of Sichuan Province (2020JDJQ0011).

Institutional Review Board Statement

Not applicable.

Informed Consent Statement

Not applicable.

Data Availability Statement

Data are based on field monitoring and can be obtained from the corresponding author via email if necessary.

Conflicts of Interest

The authors declare no conflict of interest.

References

  1. Li, B.; Xu, N.W.; Dai, F.; Gu, G.K.; Ke, W. Microseismic monitoring and stability analysis for the large-scale underground caverns at the Wudongde hydropower station. Bull. Eng. Geol. Environ. 2020, 79, 3559–3573. [Google Scholar] [CrossRef]
  2. Sun, Y.P.; Li, B.; Dong, L.L.; Mao, H.Y.; Xu, N.W.; Zhu, Z.P.; Liu, J.F. Microseismic moment tensor based analysis of rock mass failure mechanism surrounding an underground powerhouse. Geomat. Nat. Haz. Risk 2021, 12, 1315–1342. [Google Scholar] [CrossRef]
  3. Liang, Z.Z.; Xue, R.X.; Xu, N.W.; Dong, L.; Zhang, Y. Analysis on microseismic characteristics and stability of the access tunnel in the main powerhouse, Shuangjiangkou hydropower station, under high in situ stress. Bull. Eng. Geol. Environ. 2020, 79, 3231–3244. [Google Scholar] [CrossRef]
  4. Li, B.; Ding, Q.F.; Xu, N.W.; Dai, F.; Xu, Y.; Qu, H.L. Characteristics of microseismic b-value associated with rock mass large deformation in underground powerhouse caverns at different stress levels. J. Cent. South Univ. 2022, 29, 693–711. [Google Scholar] [CrossRef]
  5. Li, A.; Dai, F.; Liu, Y.; Liu, K.; Wang, K. Deformation characteristics of sidewall and anchorage mechanisms of prestressed cables in layered rock strata dipping steeply into the inner space of underground powerhouse cavern. Int. J. Rock Mech. Min. Sci. 2022, 159, 105234. [Google Scholar] [CrossRef]
  6. Wan, Y.G. Contemporary tectonic stress field in China. Earthq. Sci. 2010, 23, 377–386. [Google Scholar] [CrossRef] [Green Version]
  7. Young, R.P.; Collins, D.S.; Reyes-Montes, J.M.; Baker, C. Quantification and interpretation of seismicity. Int. J. Rock Mech. Min. Sci. 2004, 41, 1317–1327. [Google Scholar] [CrossRef]
  8. Trifu, C.I.; Shumila, V. Microseismic monitoring of a controlled collapse in Field II at Ocnele Mari, Romania. Pure Appl. Geophys. 2010, 167, 27–42. [Google Scholar] [CrossRef]
  9. Leśniak, A.; Isakow, Z. Space–time clustering of seismic events and hazard assessment in the Zabrze-Bielszowice coal mine, Poland. Int. J. Rock Mech. Min. Sci. 2009, 46, 918–928. [Google Scholar] [CrossRef]
  10. Hudyma, M.; Potvin, Y.H. An engineering approach to seismic risk management in hardrock mines. Rock Mech. Rock Eng. 2010, 43, 891–906. [Google Scholar] [CrossRef]
  11. Denlinger, R.P.; Bufe, C.G. Reservoir conditions related to induced seismicity at the Geysers steam reservoir, northern California. Bull. Seismol. Soc. Am. 1982, 72, 1317–1327. [Google Scholar] [CrossRef]
  12. Rutledge, J.T.; Phillips, W.S. Hydraulic stimulation of natural fractures as revealed by induced microearthquakes, Carthage Cotton Valley gas field, east Texas. Geophysics 2003, 68, 441–452. [Google Scholar] [CrossRef]
  13. Majer, E.L.; McEvilly, T.V. Seismological investigations at The Geysers geothermal field. Geophysics 1979, 44, 246–269. [Google Scholar] [CrossRef] [Green Version]
  14. Xu, N.W.; Tang, C.A.; Li, L.C.; Zhou, Z.; Sha, C.; Liang, Z.Z.; Yang, J.Y. Microseismic monitoring and stability analysis of the left bank slope in Jinping first stage hydropower station in southwestern China. Int. J. Rock Mech. Min. Sci. 2011, 48, 950–963. [Google Scholar] [CrossRef]
  15. Xu, N.W.; Tang, C.A.; Li, H.; Dai, F. Excavation-induced microseismicity: Microseismic monitoring and numerical simulation. J. Zhejiang Univ. Sci. A 2012, 13, 445–460. [Google Scholar] [CrossRef]
  16. Xu, N.W.; Dai, F.; Liang, Z.Z.; Zhou, Z.; Sha, C.; Tang, C.A. The dynamic evaluation of rock slope stability considering the effects of microseismic damage. Rock Mech. Rock Eng. 2014, 47, 621–642. [Google Scholar] [CrossRef]
  17. Li, B.; Li, T.; Xu, N.; Dai, F.; Chen, W.; Tan, Y. Stability assessment of the left bank slope of the Baihetan Hydropower Station, Southwest China. Int. J. Rock Mech. Min. Sci. 2018, 104, 34–44. [Google Scholar] [CrossRef]
  18. Li, B.; Xu, N.; Dai, F.; Zhang, G.; Xiao, P. Dynamic analysis of rock mass deformation in large underground caverns considering microseismic data. Int. J. Rock Mech. Min. Sci. 2019, 122, 104078. [Google Scholar] [CrossRef]
  19. Hu, Z.; Xu, N.; Li, B.; Xu, Y.; Xu, J.; Wang, K. Stability Analysis of the Arch Crown of a Large-Scale Underground Powerhouse During Excavation. Rock Mech. Rock Eng. 2020, 53, 2935–2943. [Google Scholar] [CrossRef]
  20. Feng, D.; Biao, L.; Nuwen, X.; Fan, Y.; Zhang, C. Deformationforecasting and stability analysis of large-scale undergroundpowerhouse Caverns from microseismic monitoring. Int. J. Rock Mech. Min. 2016, 86, 269–281. [Google Scholar]
  21. Ke, M.; Chun-an, T.; Nu-wen, X.; Liu, F.; Xu, J.-W. Failureprecursor of surrounding rock mass around cross tunnel inhigh-steep rock slope. J. Cent. South Univ. 2013, 20, 207–217. [Google Scholar]
  22. Feng, G.-L.; Feng, X.-T.; Chen, B.-R.; Xiao, Y.-X.; Zhao, Z.-N. Effects of structural planes on the microseismicity associatedwith rockburst development processes in deep tunnels of theJinping-II Hydropower Station, China. Tunn. Space Technol. 2019, 84, 273–280. [Google Scholar] [CrossRef]
  23. Chen, B.R.; Li, Q.P.; Feng, X.T.; Xiao, Y.-X.; Feng, G.-L.; Hu, L.-X. Microseismic monitoring of columnar jointed basalt fracture activity: A trial at the Baihetan Hydropower Station China. J. Seismol. 2014, 18, 773–793. [Google Scholar] [CrossRef]
  24. Feng, G.L.; Feng, X.T.; Chen B, R.; Xiao, Y.-X. Microseismic sequences associated with rockbursts in the tunnels of the Jinping II hydropower station. Int. J. Rock Mech. Min. Sci. 2015, 80, 89–100. [Google Scholar] [CrossRef]
  25. Feng, D.; Peng, J.; Xu, N.W.; Chen, W.; Tan, Y. Focal mechanism determination for microseismic events and its application to the left bank slope of the Baihetan hydropower station in China. Environ. Earth Sci. 2018, 77, 268. [Google Scholar]
  26. Wu, N.; Liang, Z.Z.; Zhang, Z.H.; Li, S.H.; Lang, Y.X. Development and verification of three-dimensional equivalent discrete fracture network modelling based on the finite element method. Eng. Geol. 2022, 306, 106759. [Google Scholar] [CrossRef]
  27. Coli, N.; Pranzini, G.; Alfi, A.; Boerio, V. Evaluation of rock-mass permeability tensor and prediction of tunnel inflows by means of geostructural surveys and finite element seepage analysis. Eng. Geol. 2012, 101, 174–184. [Google Scholar] [CrossRef]
  28. Yasitli, N.E.; Unver, B. 3D numerical modeling of longwall mining with top-coal caving. Int. J. Rock Mech. Min. Sci. 2005, 42, 219–235. [Google Scholar] [CrossRef]
  29. Liu, C.l. Three-dimensional boundary element method based on FSM with influence coefficients solved by analytical integral. Chin. J. Rock Mech. Eng. 2002, 8, 1243–1248. (In Chinese) [Google Scholar]
  30. Yang, Y.; Liu, Y. Modeling of cracks in two-dimensional elastic bodies by coupling the boundary element method with peridynamics. Int. J. Solids Struct. 2021, 217–218, 74–89. [Google Scholar] [CrossRef]
  31. Xu, Y.; Li, X.; Liu, Q.; Yang, S.; Tan, X. A semi-analytical solution of finite-conductivity multi-wing fractured well in naturally fractured reservoirs by boundary element method. J. Pet. Sci. Eng. 2021, 203, 108584. [Google Scholar] [CrossRef]
  32. Cundall, P.A.; Strack, O.D.L. A discrete numerical model for granular assemblies. Geotechnique 1979, 29, 47–65. [Google Scholar] [CrossRef]
  33. Cundall, P.A. A computer model for simulating progressive large-scale movements in blocky rock system. In Proceedings of the International Symposium on Rock Mechanics, Nancy, France, 4–6 October 1971. ISRM. [Google Scholar]
  34. Cundall, P.A. Formulation of a three-dimensional distinct element model—Part I. A scheme to detect and represent contacts in a system composed of many polyhedral blocks. Int. J. Rock Mech. Min. Sci. Geomech. Abstr. 1988, 25, 107–116. [Google Scholar] [CrossRef]
  35. Hart, R.; Cundall, P.A.; Lemos, J. Formulation of a three-dimensional distinct element model—Part II. Mechanical calculations for motion and interaction of a system composed of many polyhedral blocks. Int. J. Rock Mech. Min. Sci. Geomech. Abstr. 1988, 25, 117–125. [Google Scholar] [CrossRef]
  36. Cundall, P.A.; Hart, R. Numerical Modeling of Discontinua. Anal. Des. Methods 1993, 9, 231–243. [Google Scholar]
  37. Zhou, W.Y.; Kou, X.D. Element-free method and its application in geotechnique engineering. Chin. J. Geotech. Eng. 1998, 20, 5–9. (In Chinese) [Google Scholar]
  38. Shi, G.H. Discontinuous deformation analysis: A new numerical model for the statics and dynamics of deformable block structures. Eng. Comput. 1992, 9, 157–168. [Google Scholar] [CrossRef]
  39. Shi, G.H.; Goodman, R.E. Generalization of two-dimensional dis-continuous deformation analysis for forward modeling. Int. J. Numer. Anal. Methods Geomech. 1989, 13, 359–380. [Google Scholar] [CrossRef]
  40. Burnett, D.S.; Holford, R.L. An ellipsoidal acoustic infinite element. Comput. Methods Appl. Mech. Eng. 1998, 164, 49–76. [Google Scholar] [CrossRef]
  41. Caiping, L.; Liu, G.; Liu, Y.; Nong, Z. Microseismic multi-parameter characteristics of rockburst hazard induced by hard roof fall and high stress concentration. Int. J. Rock Mech. Min. Sci. 2015, 76, 18–32. [Google Scholar]
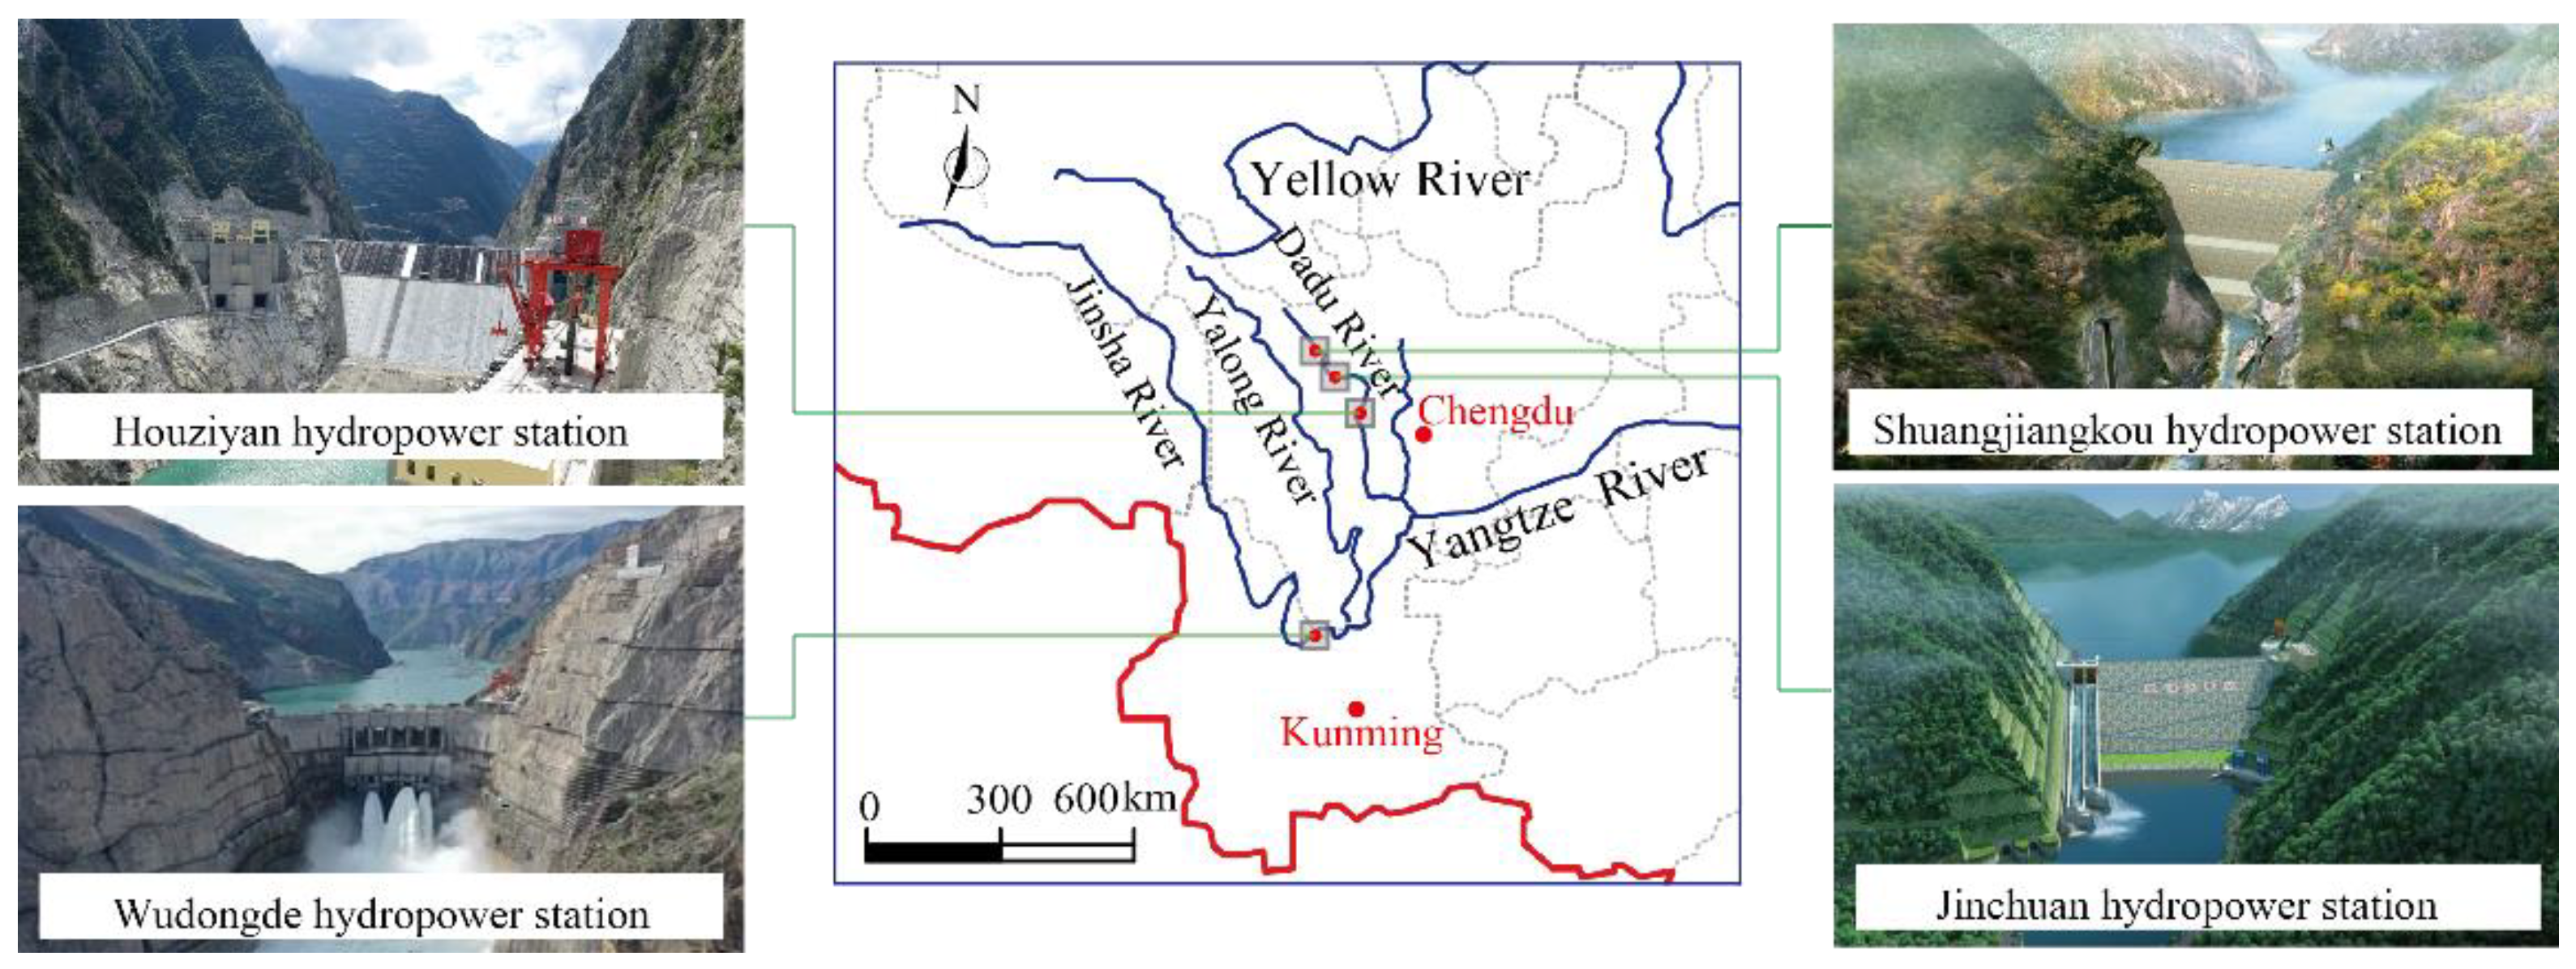
Figure 1. Geographical location of hydropower stations in southwest China.
Applsci 12 11660 g001
Figure 2. Overall layout of the underground powerhouse caverns of the Jinchuan hydropower station.
Applsci 12 11660 g002
Figure 3. Temporal evolution of the number of MS events and cumulative energy released.
Applsci 12 11660 g003
Figure 4. Temporal distribution of the moment magnitude of MS events.
Applsci 12 11660 g004
Figure 5. Spatial distribution and density of MS events (2 August to 16 December 2020).
Applsci 12 11660 g005aApplsci 12 11660 g005b
Figure 6. Energy density contour induced by MS activities.
Applsci 12 11660 g006
Figure 7. Spatial scope and combination elements for model calculations.
Applsci 12 11660 g007
Figure 8. Simulated rock deformation around the spillway tunnel at each excavation step.
Applsci 12 11660 g008
Figure 9. Simulated rock deformation around the division tunnel at each excavation step.
Applsci 12 11660 g009
Figure 10. Maximum principal stress of the section at stake 0 + 870 m.
Applsci 12 11660 g010
Figure 11. Minimum principal stress of the section at stake 0 + 870 m.
Applsci 12 11660 g011
Figure 12. Maximum principal stress of the section at stake 0 + 450 m.
Applsci 12 11660 g012
Figure 13. Minimum principal stress of the section at stake 0 + 450 m.
Applsci 12 11660 g013
Figure 14. Comparison between numerical modeling and MS monitoring results.
Applsci 12 11660 g014
Figure 15. Comparison between numerical modeling and conventional monitoring results.
Applsci 12 11660 g015
Figure 16. Comparison between numerical modeling results and site failure at the intersection of the diversion tunnel.
Applsci 12 11660 g016
Figure 17. Comparison between numerical modeling results and site failure at stake 0 + 450 m of the spillway tunnel.
Applsci 12 11660 g017
Table 1. Mechanical parameters of the surrounding rock.
Rock Deformation ModulusElastic ModulusPoisson’s RatioRock/RockAllowed
Bearing Capacity
Shearing StrengthShear Strength
E0
(GPa)
ES
(GPa)
μfc
(MPa)
fc
(MPa)
[R]
(MPa)
4–54.5–60.30–0.350.65–0.700.30–0.400.55–0.6002.0–3.0
Table 2. Recommended values for the mechanical parameters of the structural planes.
Structural Plane Typef′c′ (MPa)
f31Debris with mud0.35–0.400.05–0.07
f27Debris with mud0.35–0.400.05–0.07
f54Debris with mud0.35–0.400.05–0.07
Table 3. Step-by-step excavation of the spillway tunnel.
Excavation StepsExcavation Position
Step 1 excavationAdits and adjacent main tunnels at the inlet and outlet
Step 2 excavationStakes 0 + 160 m to 0 + 240 m and 0 + 724 m to 0 + 824 m in the first layer
Step 3 excavationStakes 0 + 240 m to 0 + 340 m and 0 + 655 m to 0 + 724 m in the first layer
Step 4 excavationStakes 0 + 630 m to 0 + 655 m in the first layer
Step 5 excavationStakes 0 + 323 m to 0 + 414 m and 0 + 530 m to 0 + 630 m in the first layer, and stakes 0 + 724 m to 0 + 824 m in the second layer
Step 6 excavationStakes 0 + 464 m to 0 + 530 m in the first layer
Step 7 excavationStakes 0 + 160 m to 0 + 240 m in the second layer, and stakes 0 + 414 m to 0 + 424 m in the first layer
Step 8 excavationStakes 0 + 424 m to 0 + 464 m in the first layer
Step 9 excavation\
Step 10 excavation\
Table 4. Step-by-step excavation of the diversion tunnel.
Excavation StepsExcavation Position
Step 1 excavationAdits and adjacent main tunnels at the inlet and outlet
Step 2 excavationStakes 0 + 165 m to 0 + 290 m and 0 + 790 m to 0 + 890 m in the first layer
Step 3 excavationStakes 0 + 780 m to 0 + 790 m in the first layer
Step 4 excavationStakes 0 + 690 m to 0 + 780 m in the first layer, and stakes 0 + 790 m to 0 + 890 m in the second layer
Step 5 excavationStakes 0 + 590 m to 0 + 690 m in the first layer
Step 6 excavationStakes 0 + 570 m to 0 + 590 m in the first layer
Step 7 excavationStakes 0 + 290 m to 0 + 390 m in the first layer
Step 8 excavation\
Step 9 excavationStakes 0 + 490 m to 0 + 570 m in the first layer
Step 10 excavationStakes 0 + 390 m to 0 + 490 m in the first layer
Publisher’s Note: MDPI stays neutral with regard to jurisdictional claims in published maps and institutional affiliations.