Article

Obtaining Infrared Thermal Camera Sensor Calibration Data for Implementation in FireBot Autonomous Fire Protection Robot System

1
Faculty of Electrical Engineering, Computer Science and Information Technology, Josip Juraj Strossmayer University of Osijek, Kneza Trpimira 2b, 31000 Osijek, Croatia
2
Faculty of Dental Medicine and Health Osijek, Josip Juraj Strossmayer University of Osijek, Crkvena ul. 21, 31000 Osijek, Croatia
*
Author to whom correspondence should be addressed.
Appl. Sci. 2022, 12(22), 11657; https://doi.org/10.3390/app122211657
Submission received: 20 October 2022 / Revised: 13 November 2022 / Accepted: 14 November 2022 / Published: 16 November 2022

Abstract

:
Fire protection is one of the activities that follow the development of technology in real-time and implements all the innovations of a detection system. This paper presents a unique solution for the development of an autonomous robot for the prevention, detection, and extinguishing of fires by studying the problem of choosing the optimal early-detection sensor in the infrared part of the spectrum, which characterizes the highest level of excitation in the state of prevention. The robot is equipped with several different sensors arranged in a hierarchical structure. Thermal detection has proven to be a significant investment that can be adapted to the different complexity of the objects to be protected, taking into account image processing and modular implementation of the required sensors. To this end, it is necessary to calibrate systems for different thermal cameras. The calibration procedure on seven cameras and two pyrometers resulted in data required for input-data correction and anomaly detection. The results of the analysis confirmed that devices of a higher price range have a lower deviation from the reference value compared to low-cost technical solutions. At the same time, results were observed indicating malfunction of more expensive devices, whose data exceed the specified nominal accuracy. Thanks to the performed calibration procedure and the obtained results, the observed problem is not an obstacle for implementation in an autonomous robotic system and can be used to correct the input data required for computer analysis.

1. Introduction

Each year, fire causes a significant number of fatalities as well as significant material losses. As a result, society now places a high importance on fire prevention and early detection, and thus, it is also the main area of study and development for many scientists and different sectors. Rapid technological advancement, particularly in the areas of robotics, embedded systems, and machine learning, is having an impact on how the field of firefighting is developing. This field is becoming more effective and safe, and consequently, is minimizing the danger for people and property, as well as firefighters. There are some existing robotic solutions for firefighting in the area of forest firefighting [1]. There is a number of robotic systems for indoor and outdoor firefighting that can be found in [2,3,4]. Over time, there have been several attempts to develop an autonomous robot for firefighting that uses advanced methods for navigation and mapping as well as different image-processing techniques for fire prevention and detection [5,6,7]. More recent work proposes using unmanned aerial vehicles (UAVs) for both indoor and outdoor firefighting [8,9,10]. Due to the many challenges involved, such as real-time prevention and detection, complex mapping and navigation inside narrow and often dark areas, changes of environment, obstacle avoidance, and balancing the processing power with energy consumption, none of the above-mentioned projects resulted in a commercially available solution. The work in this paper is focused on developing an autonomous robot for fire prevention, fire detection, and extinguishing (FPDE). More details about our work will be provided in the next section.
Many existing techniques rely on using different sensors for fire prevention, as presented in [11,12,13,14]. Due to their limitations, they are becoming obsolete, and with the recent advances in the field of image processing and machine learning, many new techniques for fire detection have emerged [15,16,17,18]. Early detection of a potential fire hazard is most easily accomplished with an infrared thermal-imaging camera, as shown in [19,20,21]. An IR thermal camera is the only one capable of converting the highest excitation that can be registered by the sensor into a visual image accompanied by radiometric data. IR thermal-imaging cameras do not measure temperature but register radiation, which can be converted into object temperature after accounting for the emission coefficient of the object’s surface and environmental parameters. Detection of anomalies in the form of hotspots is the basis of an approach that would provide useful information depending on the algorithm. The accuracy of the information depends on the accuracy of the camera, the correct choice of emissivity, and the angle of capture. These are the basic parameters that the algorithm analyzes. Cheap thermal-imaging cameras have been on the market since 2014, and the price of the single element of the sensor is continuously decreasing while at the same time the resolution is increasing, which, together with software support, leads to a wide range of prices for individual thermal-imaging cameras. Choosing the optimal solution is not easy, as the width of the optics and the need to see detail must be matched. For the development of FireBot (Faculty of Electrical Engineering, Computer Science and Information Technology Osijek, Osijek, Croatia), we analyzed the possibility of using seven thermal-imaging cameras and two pyrometers. Calibration, which served as the basis for comparison, was performed in the temperature range of 27 °C to 45 °C, since this range poses the greatest challenge for the early detection of anomalies. The deviation analysis provided useful information on the basis of which the accuracy and precision can be determined, as well as an indicator of the optimal selection based on indicators that include financial indicators and the deviation of the results. Calibration was performed with two blackbodies, as the procedure itself requires considerable time for the blackbodies to heat up and enter a steady state. Two operators performed multiple measurements by rotating the gauges to obtain a mean value that was insensitive and had minimal temperature deviation of the blackbody due to heating and regulation of the temperature of the active surface. After five hours of active testing, we found a malfunction in a camera and the need for laboratory calibration. The novelty of the work is the definition of the numerical indicator of the price in terms of the accuracy necessary to achieve an optimal technical solution in accordance with the requirements of the analyzed area.

2. Materials and Methods

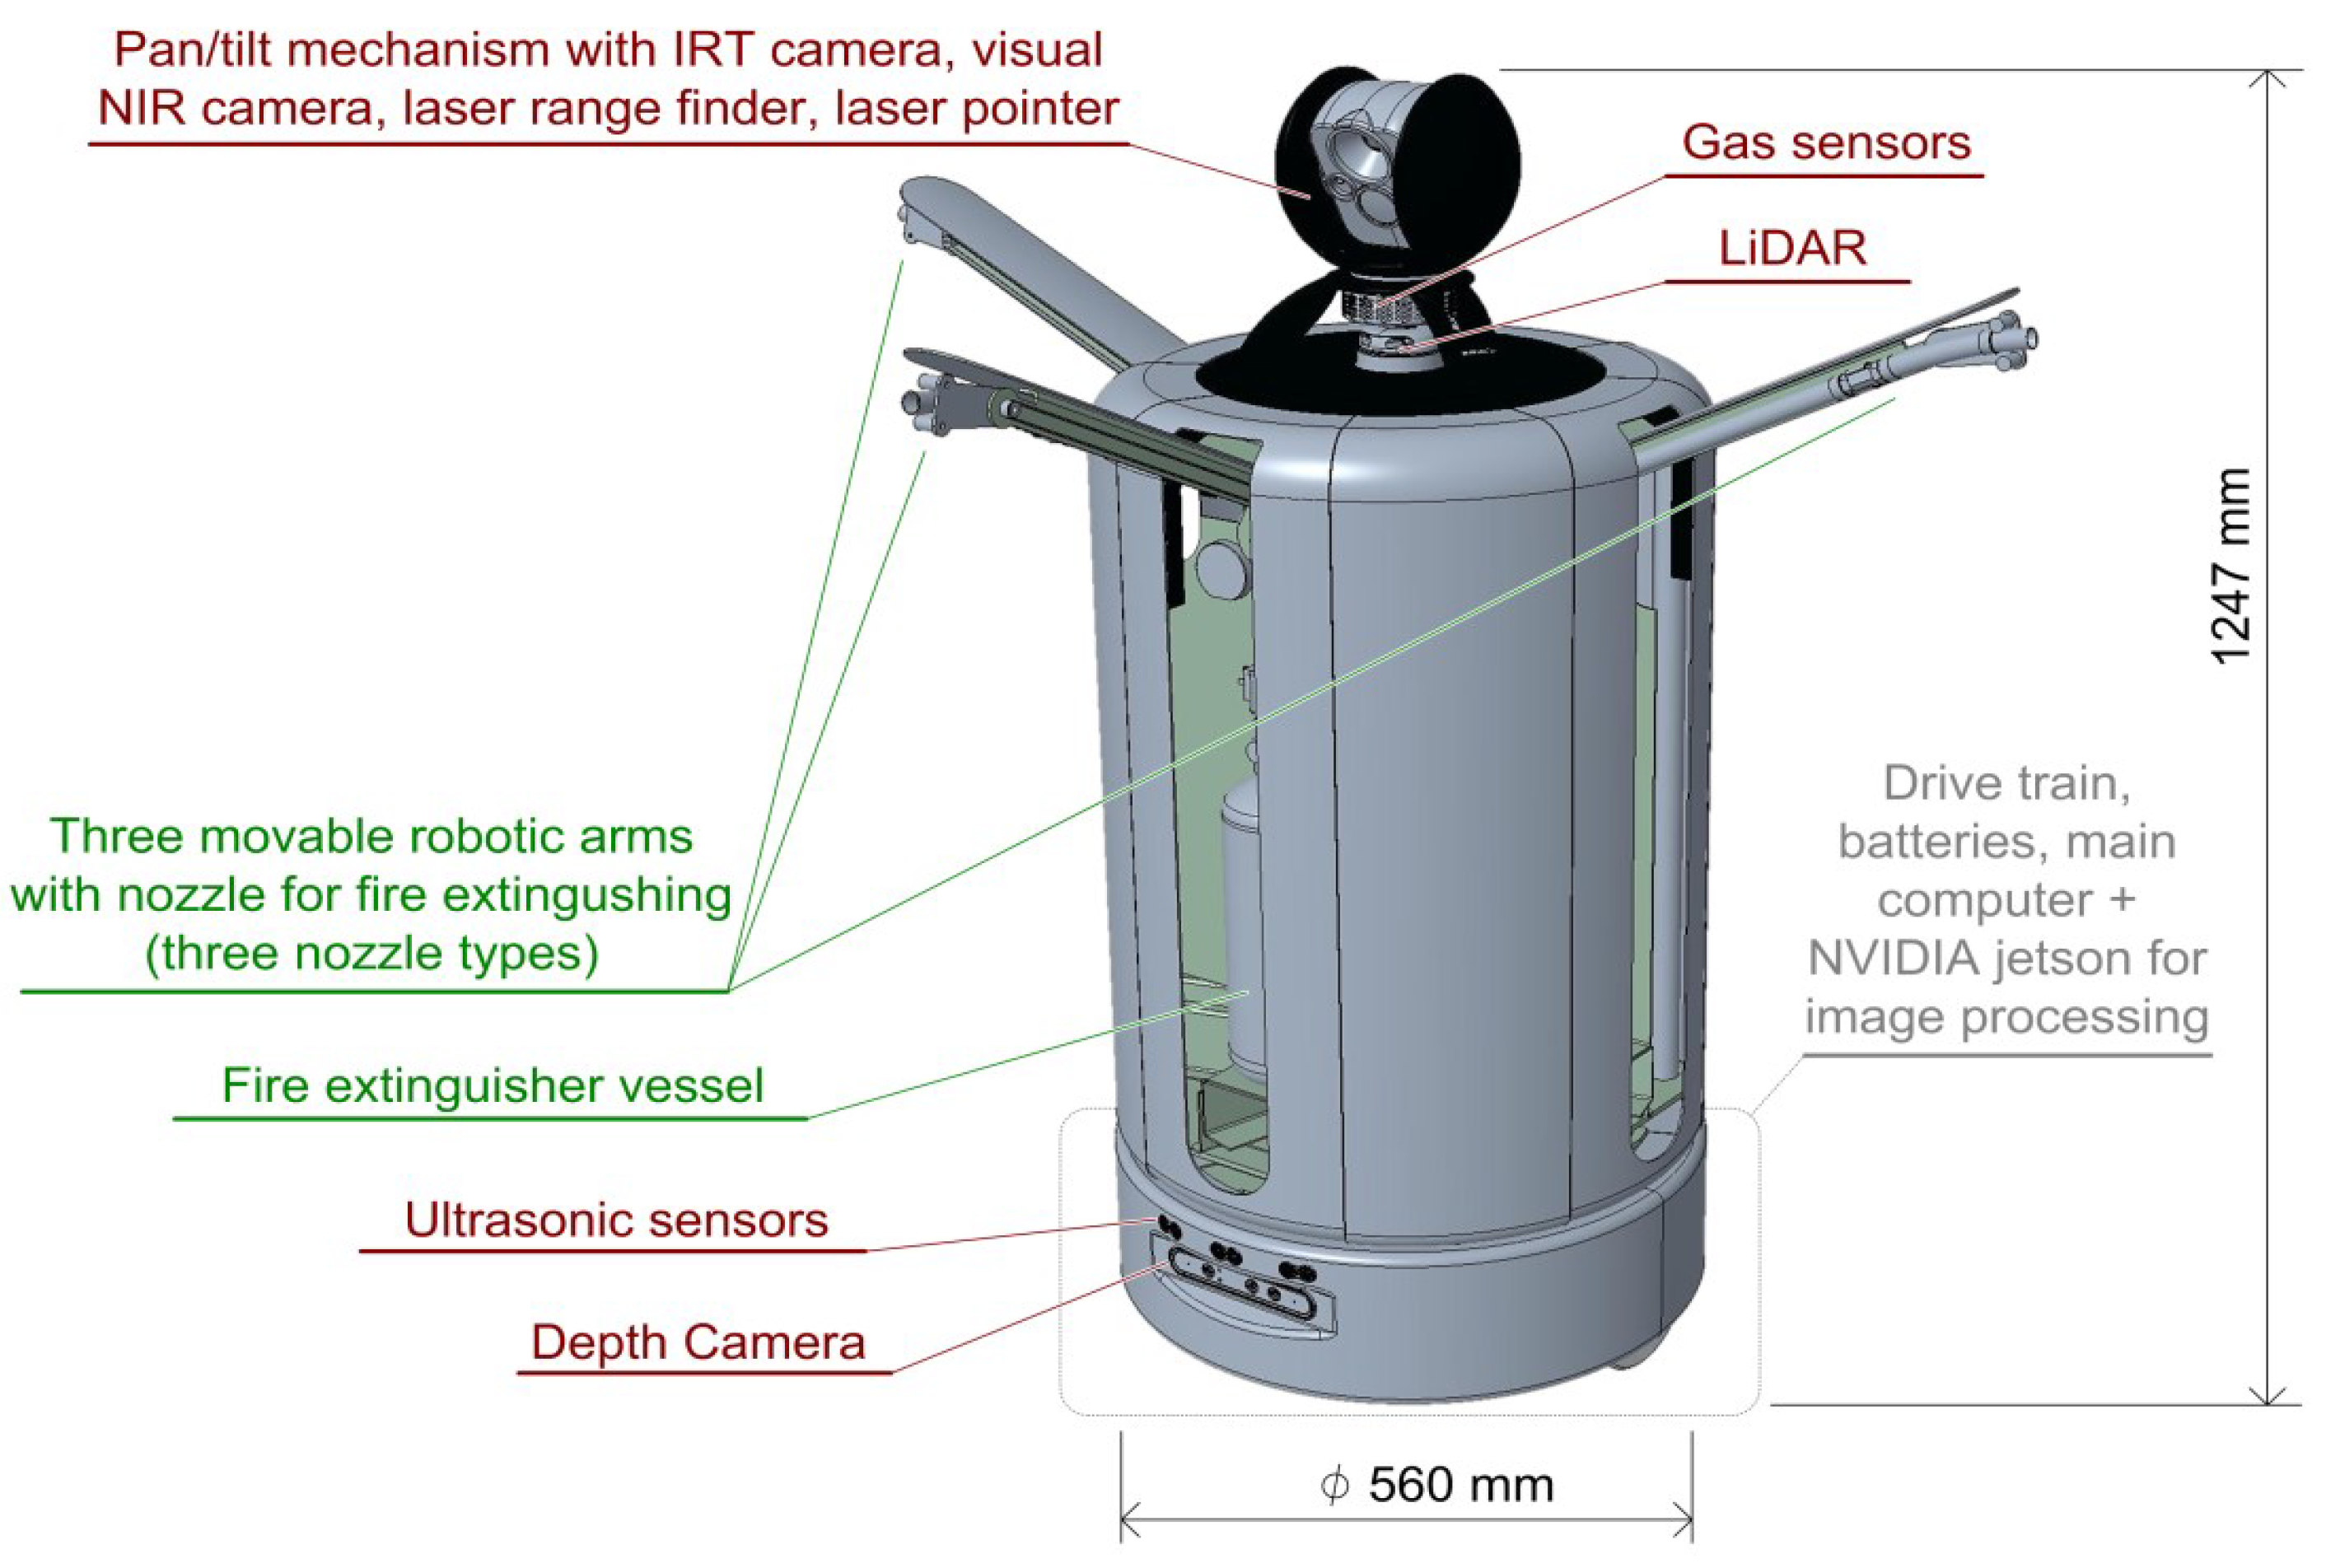
2.1. FireBot System Overview

The title of the project is “Research and development of autonomous robotic fire extinguisher for prevention, early detection, and fire extinguishing.” It is funded by the European Regional Department Fund, and it is worth more than EUR 2,200,000.00. Pastor TVA (Pastor TVA d.d., Bestovje-Rakitje, Croatia), the largest manufacturer of fire-extinguishing devices in Southeast Europe, is the project’s leader. Pastor is in charge of project management as well as robot and charger construction, physics, statics, dynamics, a fire-extinguishing subsystem and logic, energy management, and power supply. The second partner is Orqa (Orqa d.o.o., Osijek, Croatia), a small company from Osijek, Croatia, that specializes in the development of technology and protocols for fast and efficient transfer of video signals for drones. They are globally recognized for developing their First Person View (FPV) goggles for drones. They are in charge of electronics, sensors, hardware, and remote control of the robot via FPV goggles. The third partner is the Faculty of Electrical Engineering, Computer Science, and Information Technology of Osijek. The faculty is in charge of developing software for autonomous navigation, fire prevention, and fire detection using various sensors as well as visual and thermal cameras.
As mentioned in the introduction, the main task is the research and development of a complex system for FPDE called FireBot. It will be constructed as a highly efficient yet also highly performant system. This will be achieved by balancing components of all subsystems to achieve the best power/performance ratio. When combined with an existing state-of-the-art algorithm that will be further modified and implemented, the robot will be capable of autonomous navigation in a previously mapped indoor space and fire prevention and detection in real time. Furthermore, an attached fire-extinguishing device will be administered in case a fire is detected and will be capable of extinguishing a small fire. In addition, FireBot will be capable of reporting anomalies to the authorities if an anomaly is detected. If FireBot suspects an anomaly is detected but it is not completely confident, a remote user will have the possibility to take control of FireBot and to see what the robot sees, both with a visual and infrared thermal camera to confirm or to deny anomaly detection. To further extend FireBot’s capabilities in fire prevention, various sensors for different types of gases will be implemented, along with a microphone and sound-processing algorithm for detecting other anomalous events, e.g., gas and water leaks and other types of noises. More detailed descriptions of FireBot’s architecture as well as technical information will be presented in the following subsections.

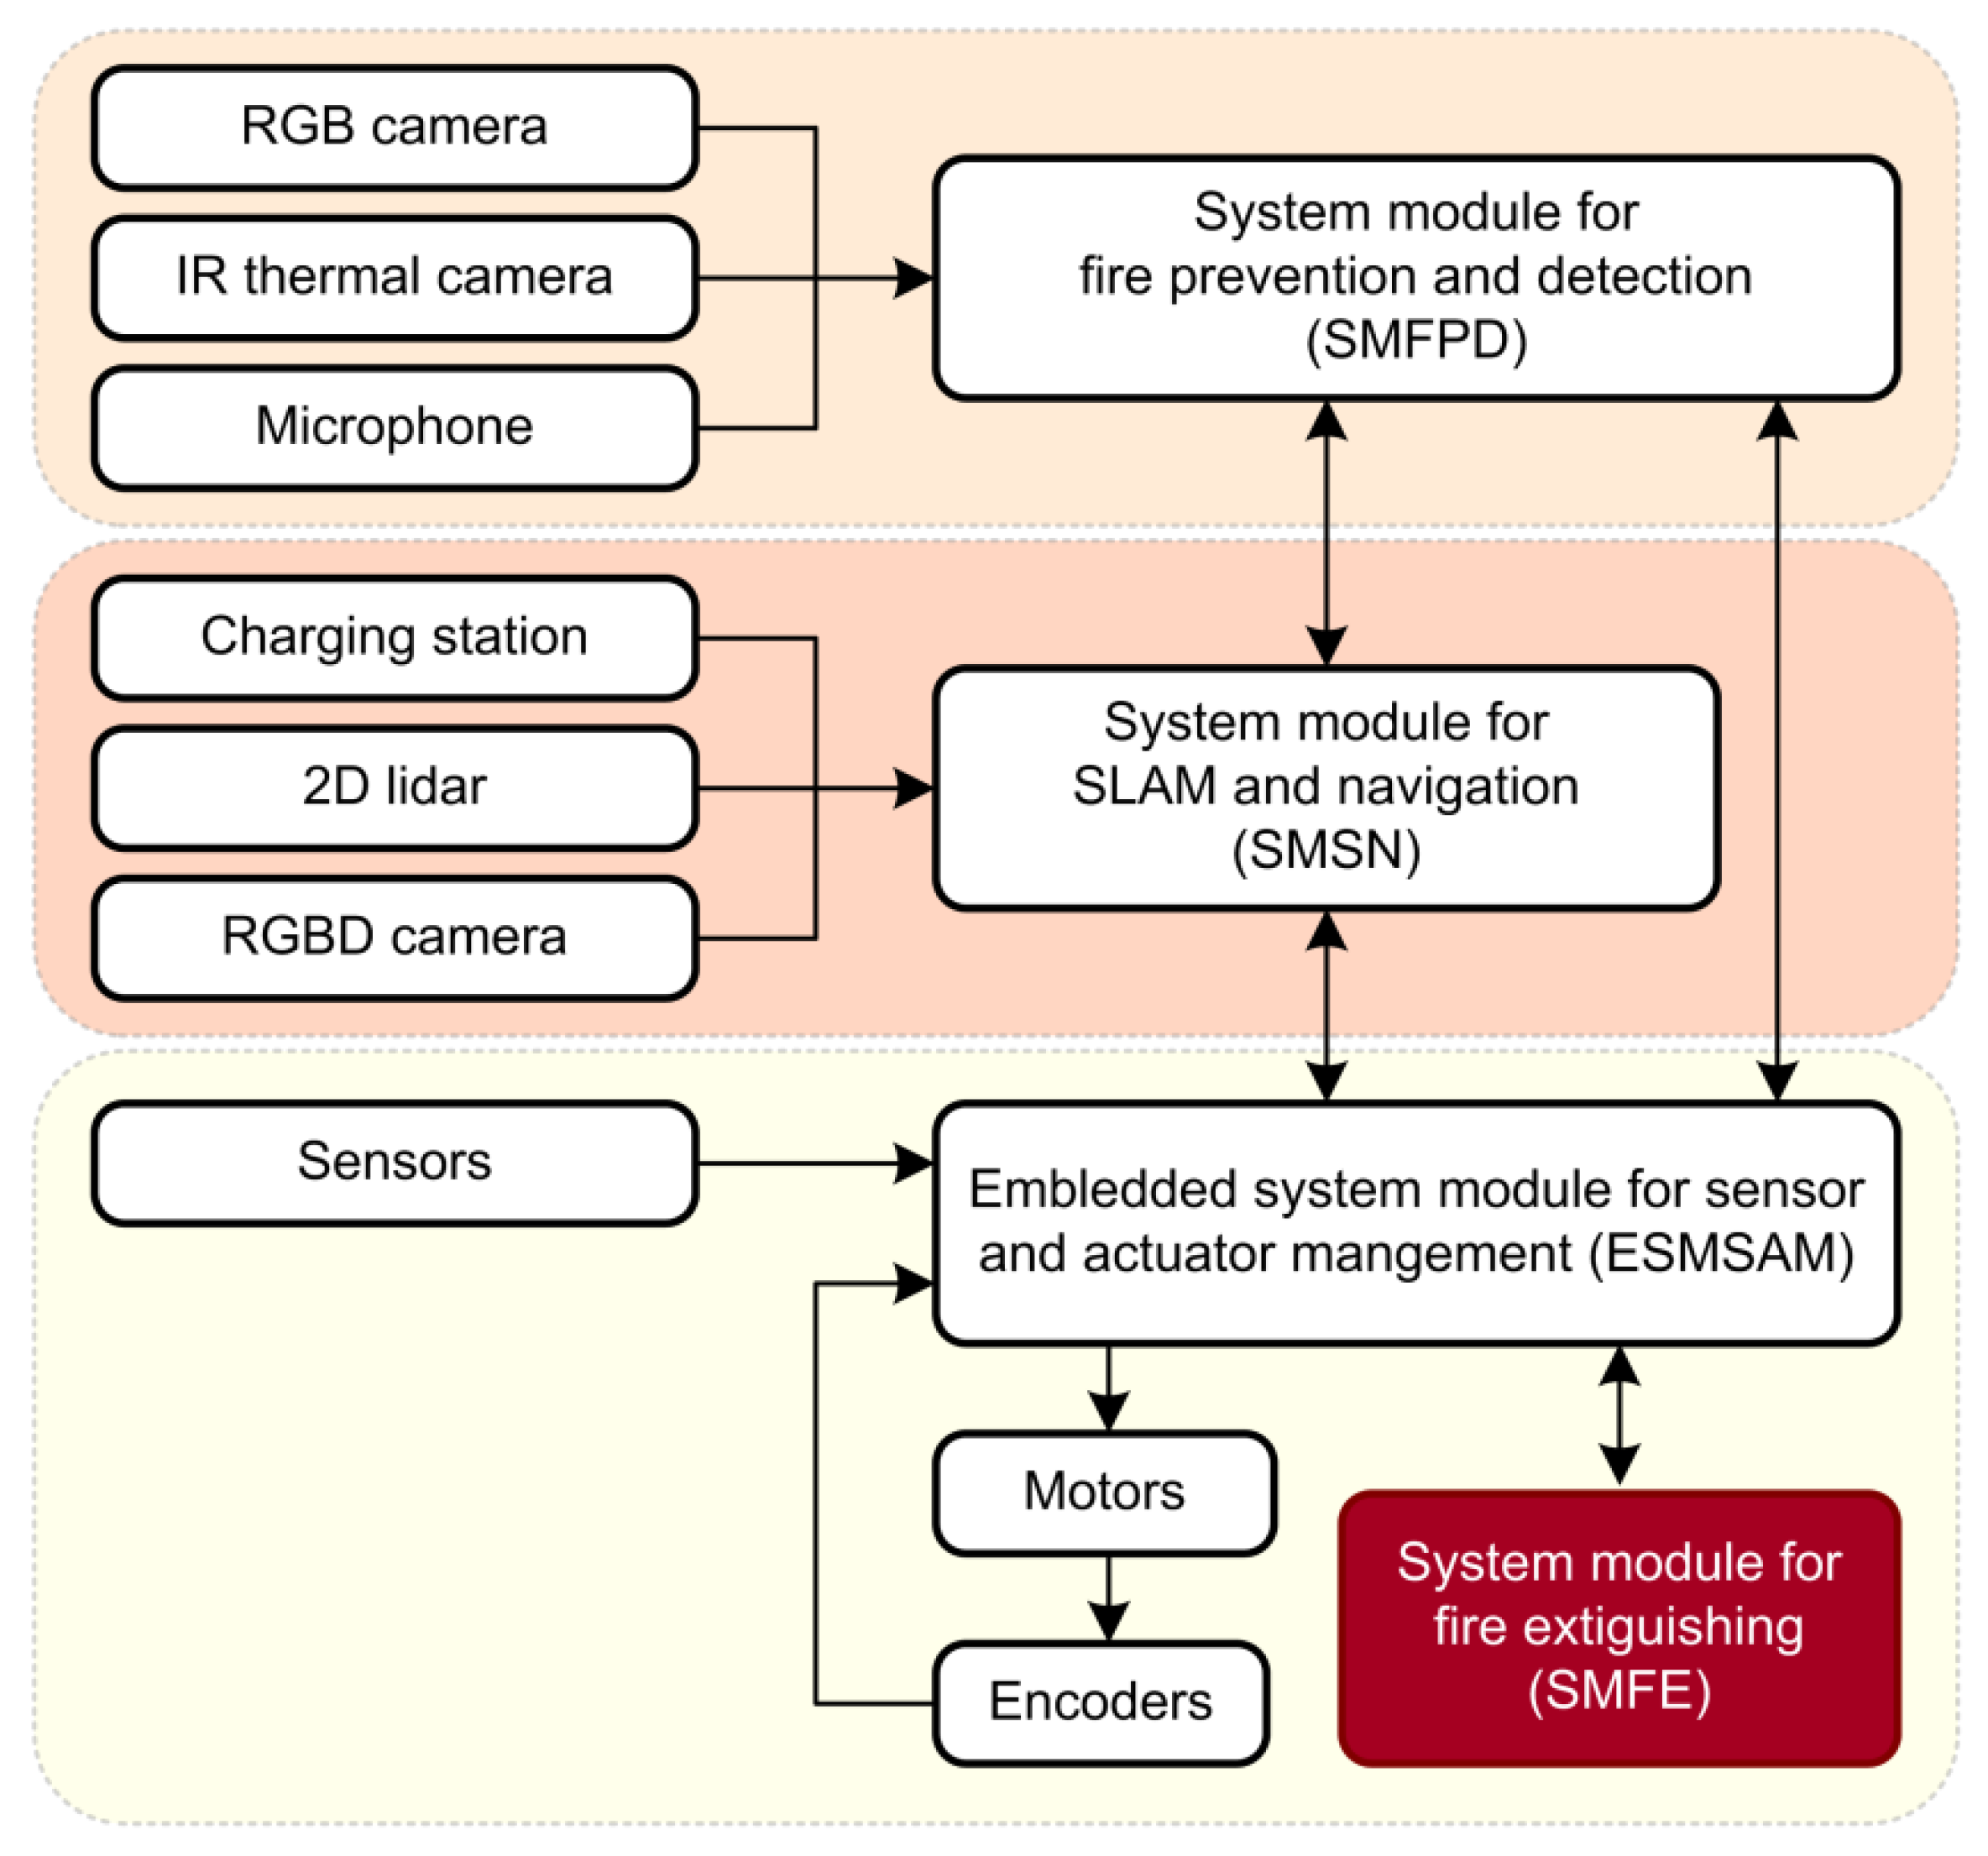
2.1.1. FireBot Architecture

FireBot presents a new and innovative concept for FPDE. It utilizes state-of-the-art technologies that enable autonomous navigation, including avoiding all obstacles, video surveillance, and FPDE. It has a LiDAR and a depth camera, as well as the IR and ultrasonic sensors used in RTAB, a cutting-edge SLAM (simultaneous localization and mapping) algorithm for autonomous mapping and navigation [22], and a modern convolutional neural network (CNN) paired with infrared thermal (IRT) and RGB cameras for fire and temperature-anomaly detection. The final version of FireBot is currently in development, and the final model is presented in Figure 1.
FireBot has various other sensors for monitoring the surroundings and detection of potential anomalies (various gas sensors, microphone for detecting water and gas leaks, intrusion detection, etc.). There are three types of fire-extinguishing devices attached to FireBot (foam, powder, and CO2) for extinguishing different types of fires. Paired with a rotating mechanical hand, on top of which is an electronic nozzle, FireBot can precisely direct its nozzle to the source of fire for fast and efficient extinguishing.
The FireBot system architecture consists of the three main logical components for indoor FPDE: an embedded system module for sensor and actuator management (ESMSAM), a system module for SLAM and navigation (SMSN), and a system module for fire prevention and detection (SMFPD). Another important module is a system module for fire extinguishing (SMFE), which consists of three different fire-extinguishing devices (powder, foam, and CO2) along with the movable arm and electronic nozzle. Furthermore, a charging station is provided separately from the robot. The complete proposed system-architecture diagram is provided in Figure 2, and a detailed description of FireBot’s architecture and all its subsystems can be found in [23].

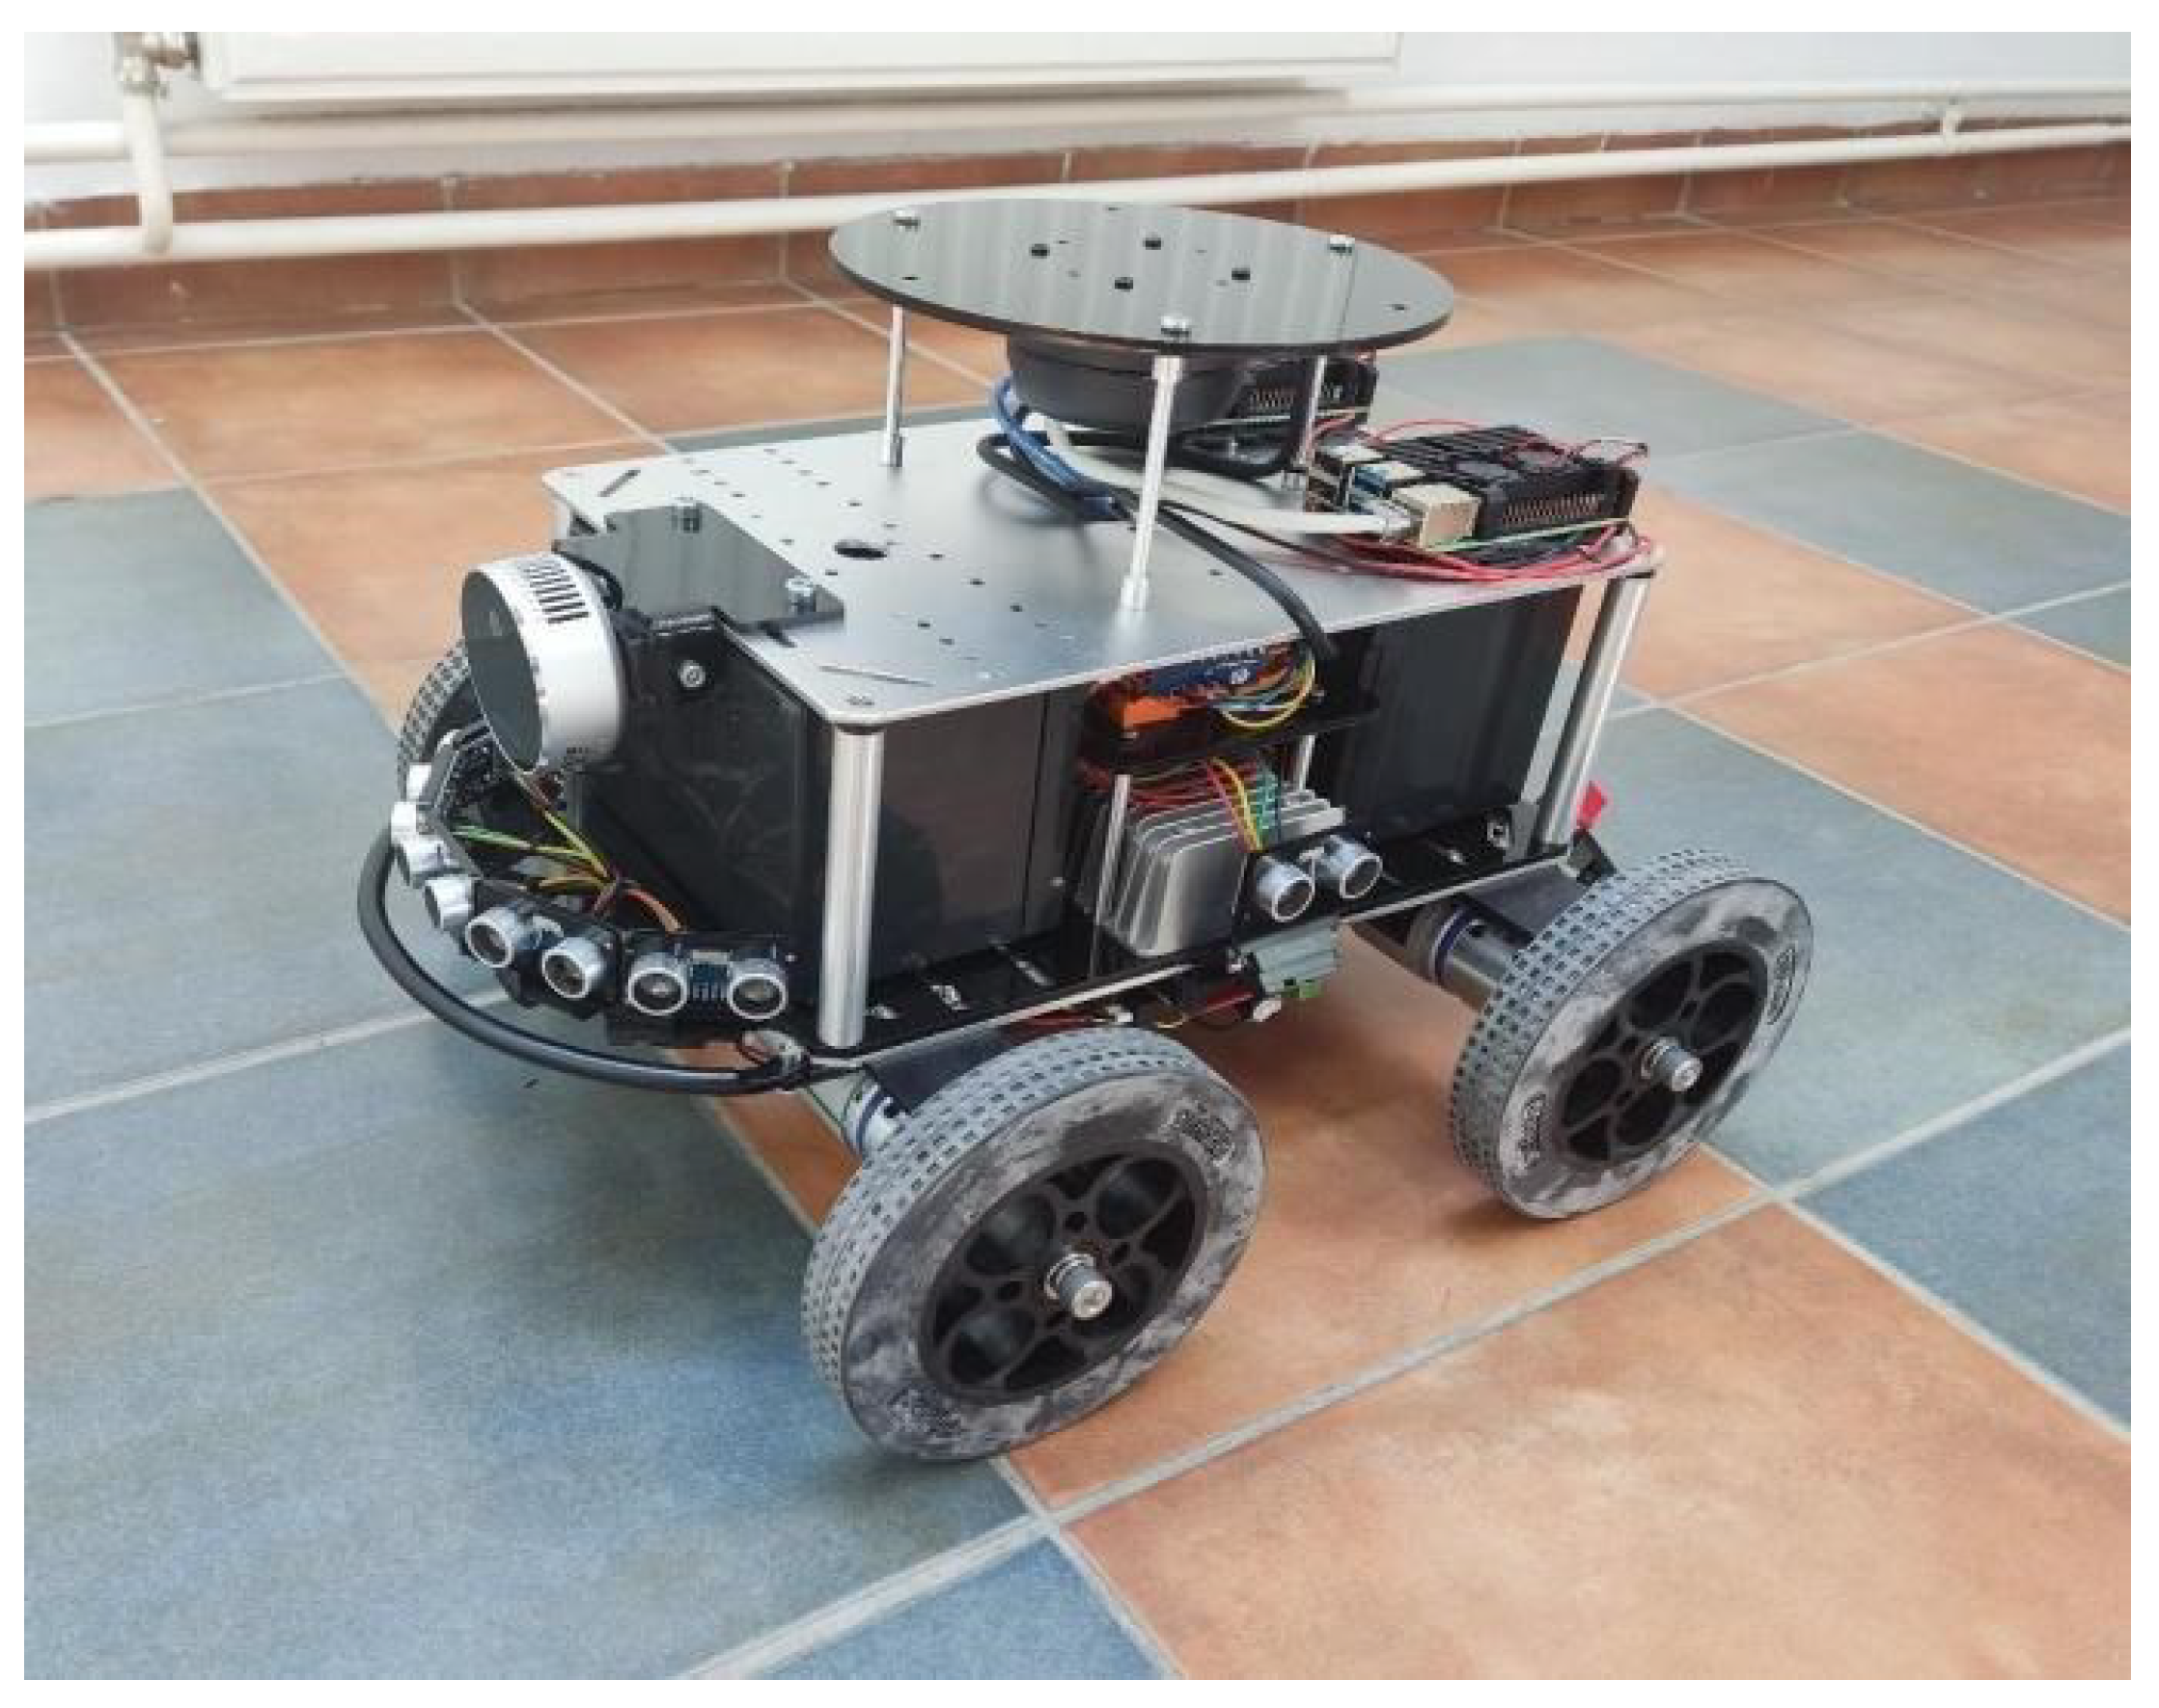
2.1.2. Hardware Specifications of an Experimental Platform

In this subsection, a brief overview of FireBot’s hardware components will be presented. At the starting point of developing our complex system, the commercially available robotic platform TurtleBot2 (Willow Garage, Menlo Park, CA, USA) was used for the implementation of the SLAM algorithm and for the first tests. TurtleBot2 is a low-cost robot platform with open-source software, and it is a platform based on a differential drive, equipped with a gyroscope, three front bumper sensors, and three cliff sensors. Additionally, RPLidar A2 was added along with the Orbbec Astra RGB-D camera (Orbbec 3D Technology International, Inc., Troy, MI, USA). Since TurtleBot2 does not have a central processing unit, a portable computer (Intel i7-10610U, 32 GB DDR4, Ubuntu 18.04) was used on top of a robot. After an initial custom robot specification was defined, a custom robotic platform was built that is presented in Figure 3. Hardware specifications of the first custom prototype are presented in Table 1 along with the approximate prices of publicly available components. Labor hours for software development, hardware assembly, and indoor-developed components are not included in the final price.
After the initial tests in different environments, several problems appeared. First of all, a skid-steering drivetrain with rubber wheels was inefficient, as it was very dependent on the surface type. Slight changes in ground textures resulted in different behaviors of the robot. That problem was partially solved by switching to mecanum wheels, but at the same time, it introduced another problem. Due to the nature of mecanum wheels, a lot of vibrations were introduced, which significantly reduced video quality from the visual camera. For that reason, the final version of FireBot will be equipped with a differential drivetrain with two stronger motors with rubber wheels and two caster wheels for stability. In addition, full suspension will be added to the chassis to further improve stability. A second problem was that the Raspberry Pi 4 did not have enough processing power for both navigation and image processing. That problem will be solved by using an industrial PC (i7-10750H, 32 GB DDR4, 512 GB SSD, Ubuntu 20.04) for navigation and an NVidia Jetson Xavier AGX 64 GB for image processing. In addition, sensor-data management will be upgraded from Arduino Mega to dedicated custom electronics with a CAN Bus interface. The lead batteries that were used are very heavy, and their capacity proved to be insufficient for the required autonomy. Therefore, the battery capacity will be increased, the battery technology will change to LiFePO4, and the total weight of the battery pack will decrease. The hardware specifications of the final version of FireBot along with the approximate prices of publicly available components are presented in Table 2. Labor hours for software development, hardware assembly, and indoor-developed components are not included in the final price.

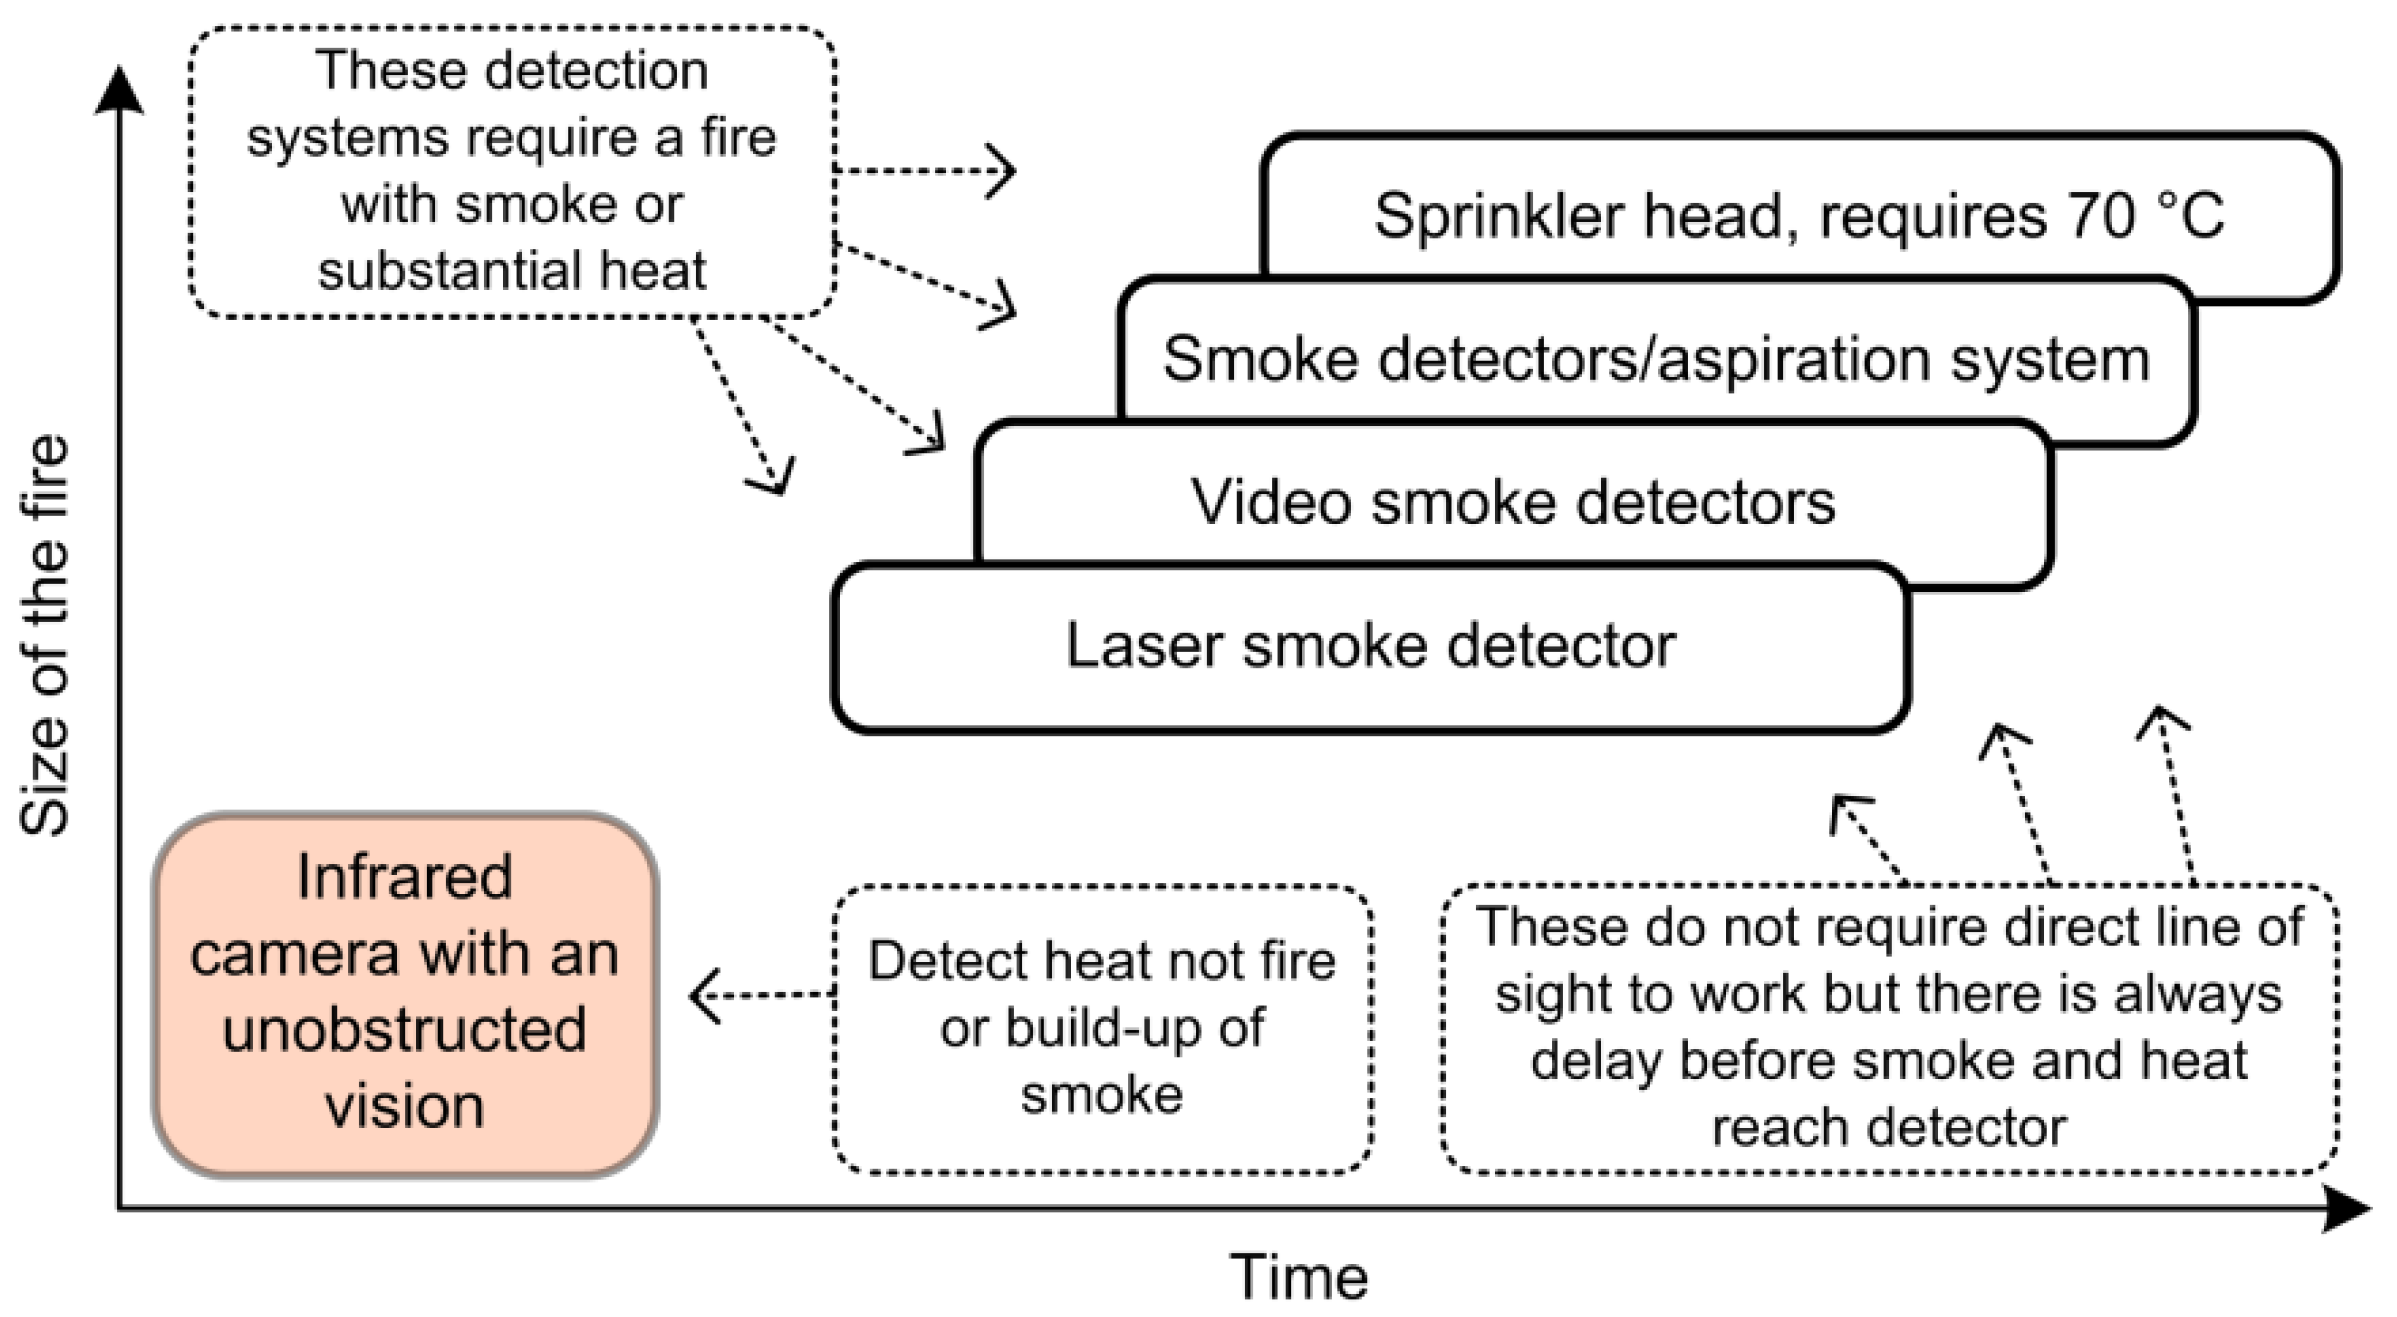
2.2. Fire Prevention and Fire Detection

When it comes to fire prevention and fire detection, there are many existing solutions. Some of them use different types of sensors, which include temperature sensors [11], smoke and gas sensors [12], or flame detectors [13], which are becoming obsolete due to their limitations. In [14], the authors presented an advanced method for fire detection using chemical sensors. The advantage of that kind of approach lies in the fact that chemical symptoms of fire appear even before the smoke or flame, so it presents an excellent method for fire prevention.
Using CNNs in conjunction with raw RGB picture-processing and computer-vision algorithms has been a popular fire-detection technology during the past decade. The two pre-trained networks utilized in [15] were VGG16 and ResNet-50, which the authors improved by adding more fully connected layers. They evaluated these models using a dataset that was unbalanced and contained fewer fire images, simulating the environment of the actual world. The results indicated higher accuracy in comparison to the base models, but the additional layers also resulted in longer training times. Two steps make up the unique fire-detection approach that the authors suggested in [16]. The first step is to use a faster R-CNN network to find and locate potential fire zones. In the second phase, validation of the fire zones that have been spotted is carried out by analyzing spatial attributes using linear dynamic systems. Finally, VLAD encoding is used, which greatly enhances efficiency and decreases detection errors, to differentiate between actual fire and fire-colored objects. The proposed solution maintained a high true-positive rate while drastically reducing the false-positive rate since they employed many fire-colored images for training. Based on CNN’s cutting-edge object-identification models, the authors in [17] suggested four revolutionary fire-detection techniques: Faster R-CNN, R-FCN, SSD, and YOLOv3. Faster R-CNN and R-FCN are examples of two-stage object-detection networks since they comprise both a classification network and a region-proposal network. In the initial step, CNN uses input images to produce region suggestions. The second stage determines whether the fire is present in the suggested regions using region-based object-detection CNN. One-stage networks (SSD and YOLOv3) were proposed since two-stage networks have slower detection speeds. They use a single forward CNN to forecast the object class. All suggested solutions outperformed other non-CNN-based approaches in tests using two separate datasets. There is frequently a need for an accurate, quick, and portable fire-detection solution that can be used on hardware with constrained computational power and that is also reasonably priced. Since GoogleNet is better suited for implementation on FPGA and other memory-constrained hardware while maintaining good classification accuracy, the authors presented a low-cost fire-detection CNN architecture based on it in [18]. Two primary-convolution layers, four max-pooling levels, one average-pooling layer, and seven inception layers make up the 100 layers of the suggested model. They also employed a transfer-learning strategy in this work. In terms of accuracy, the experiments produced great results when compared to more robust models like AlexNet.
Another approach to consider when it comes to fire prevention and fire detection is using infrared thermal (IRT) cameras. The benefit of this method is its capacity for early fire detection and prevention because it can identify anomalies before other symptoms manifest (smoke or smell), which can be seen in Figure 4.
For instance, an electrical installation that is overheating because of an overload or a faulty connection may catch fire eventually. It is feasible to recognize an increase in temperature and respond appropriately by using thermal imagery. In [19], scientists used CNN and IRT images of rotating machinery to extract fault features. Then, fault-pattern identification was carried out using the Softmax Regression classifier. The proposed method had outstanding performance in detecting and recognizing various defects on bearings and rotors during the nine different types of faults that were used to assess the system’s effectiveness. IRT images were used in [20] to find electrical-facility flaws. As detection methods, Fast Region-Based CNN (Fast R-CNN), Faster R-CNN, and YOLOv3 were employed. The detected objects were examined using a thermal-intensity-area analysis (TIAA). The results were most accurate when using a Faster R-CNN. According to the authors of [21], transforming images in the HSV color space produces better results than other color schemes such as grayscale. They employed the Otsu, Prewitt, and Roberts techniques for thresholding. A loose phase connection, an imbalanced phase connection, an overloaded phase connection, and a solar panel with a fault were used as test cases for their hot-region-detection approach. Their suggested approach successfully identified overheating on the device.
Although every kind of approach brings an advantage for a specific use-case, none of the abovementioned approaches or other commercially available solutions are ideal for FireBot. Due to the specific use-case, FireBot should navigate in an indoor closed area that is changing dynamically and at the same time be able to detect fire using a visual camera. It should also be able to prevent potential fire outbreaks by using an infrared thermal camera along with various other sensors and extinguish fire if detected. To be able to do all that autonomously and efficiently, a new solution that is a fusion of multiple approaches, specially designed for FireBot’s use-case, is being developed. Some of the considered approaches are described in the following subsection, and the final solution is still in development.

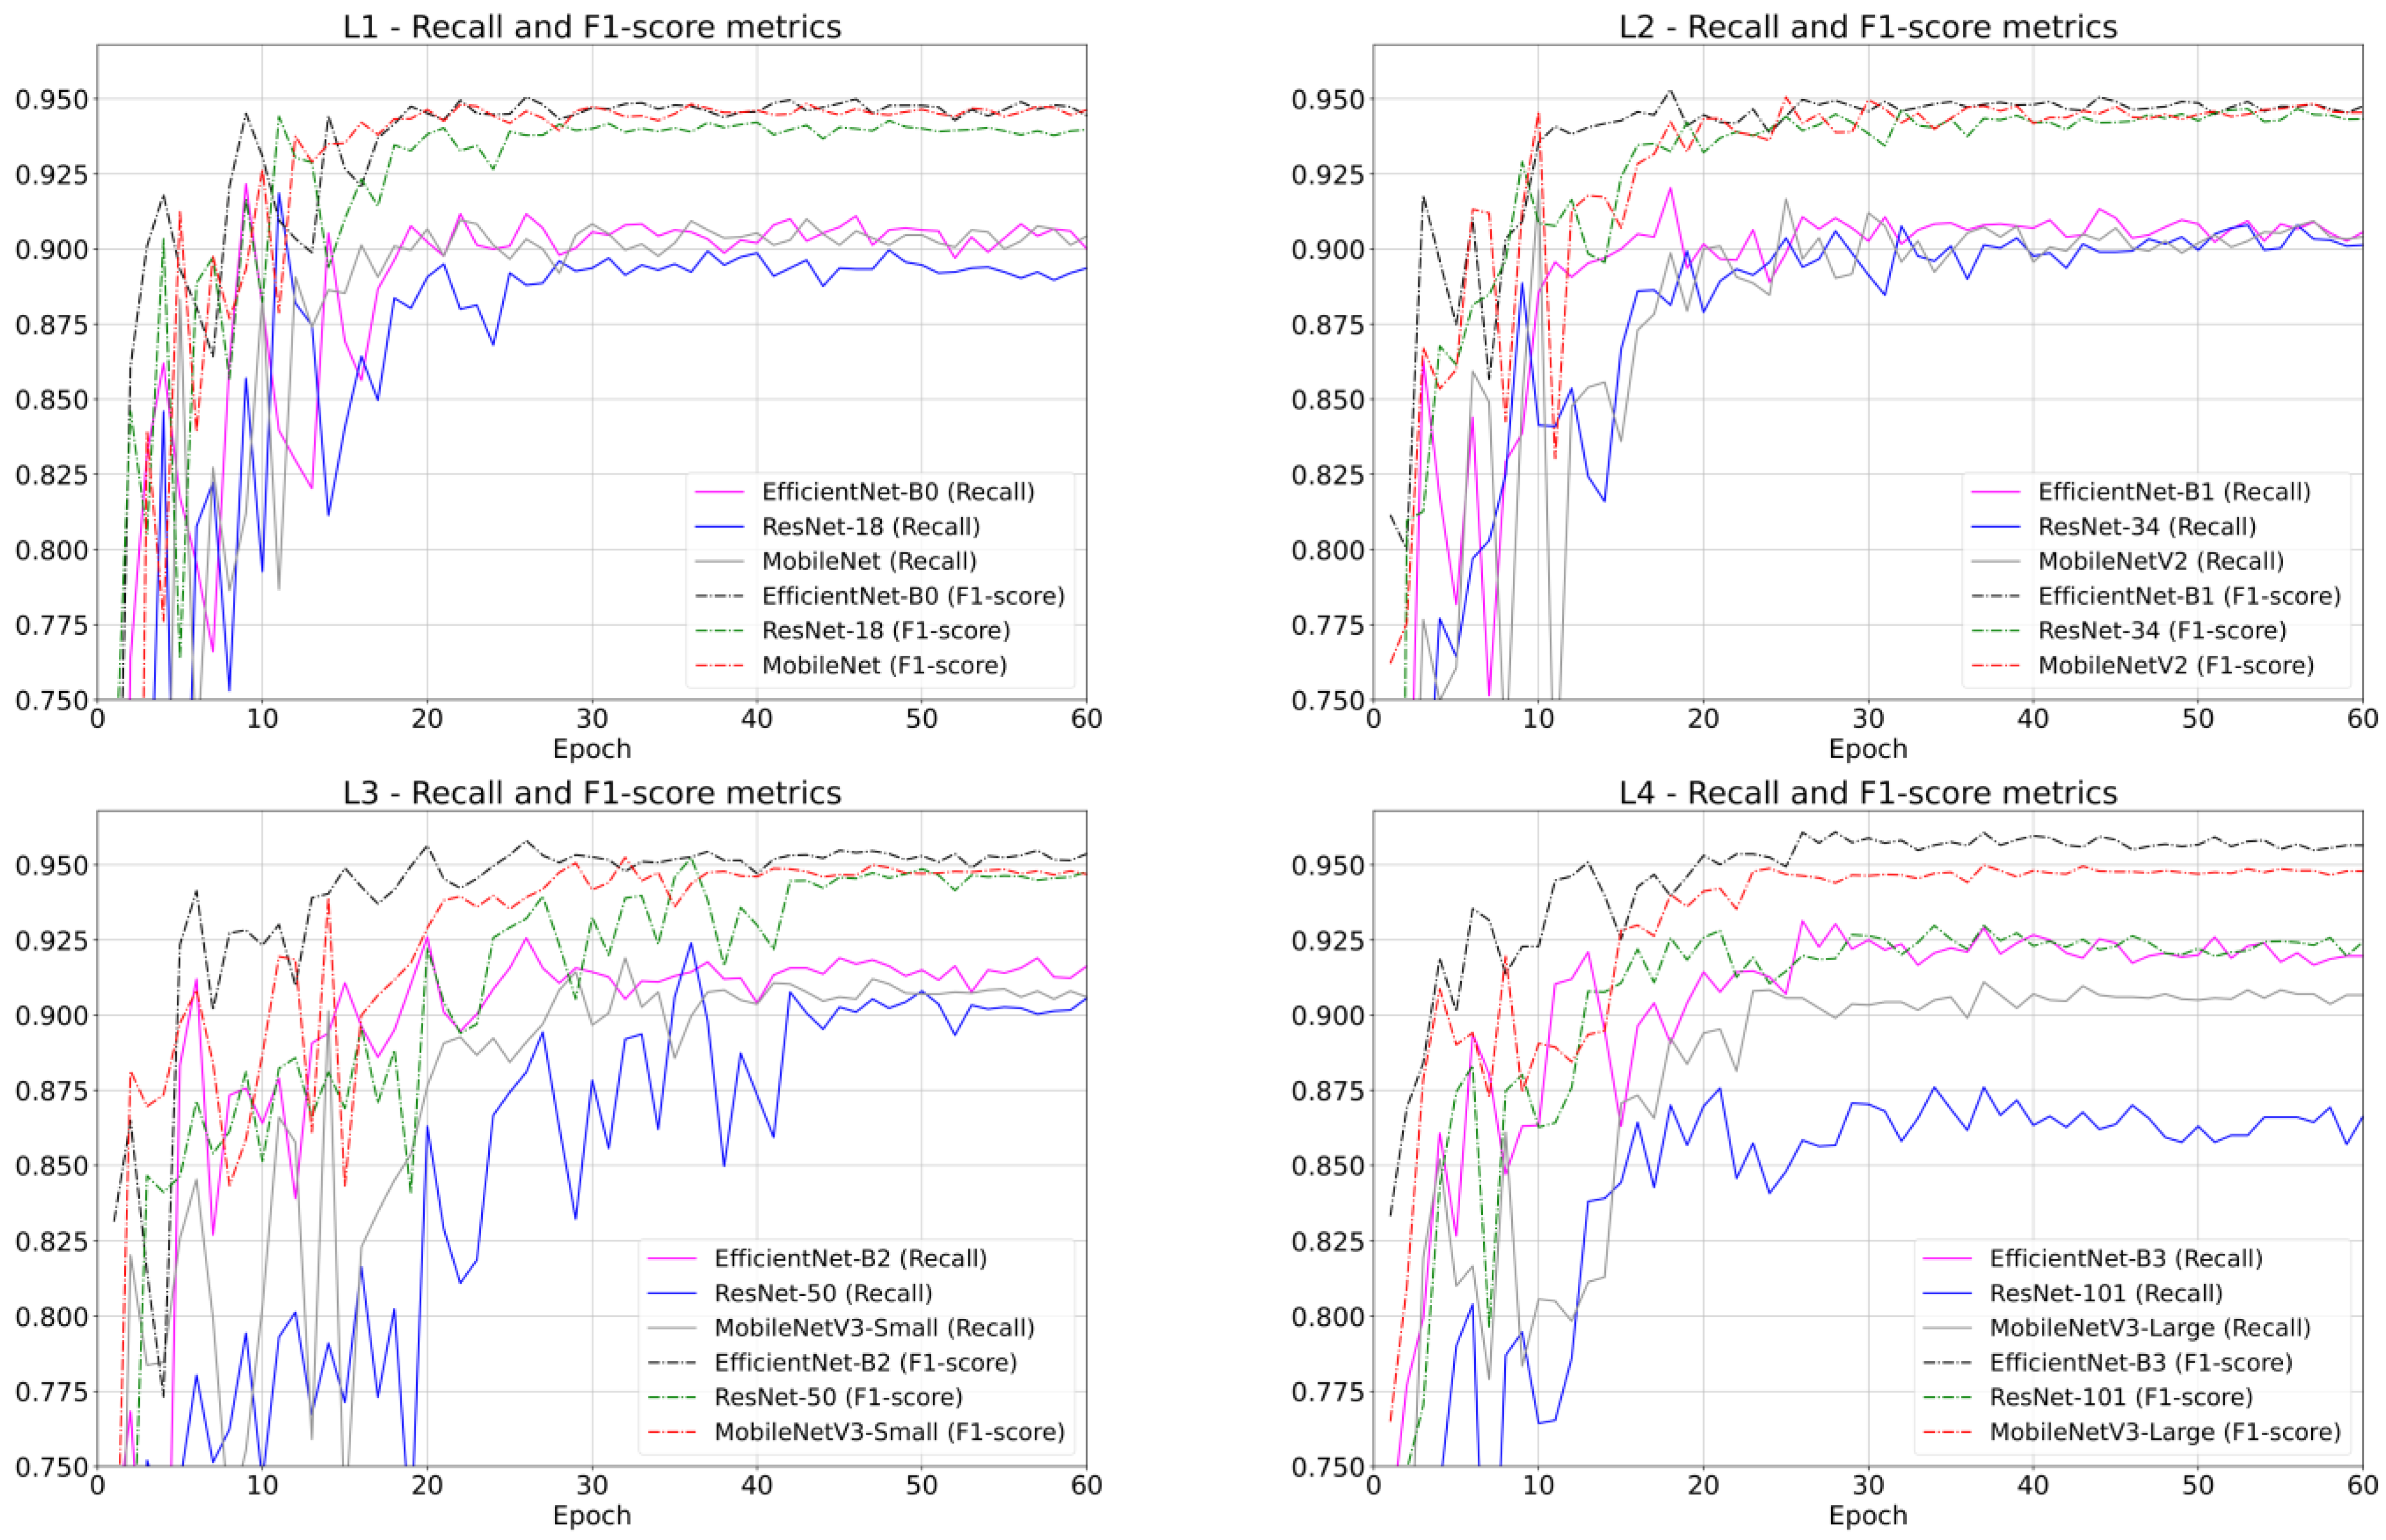
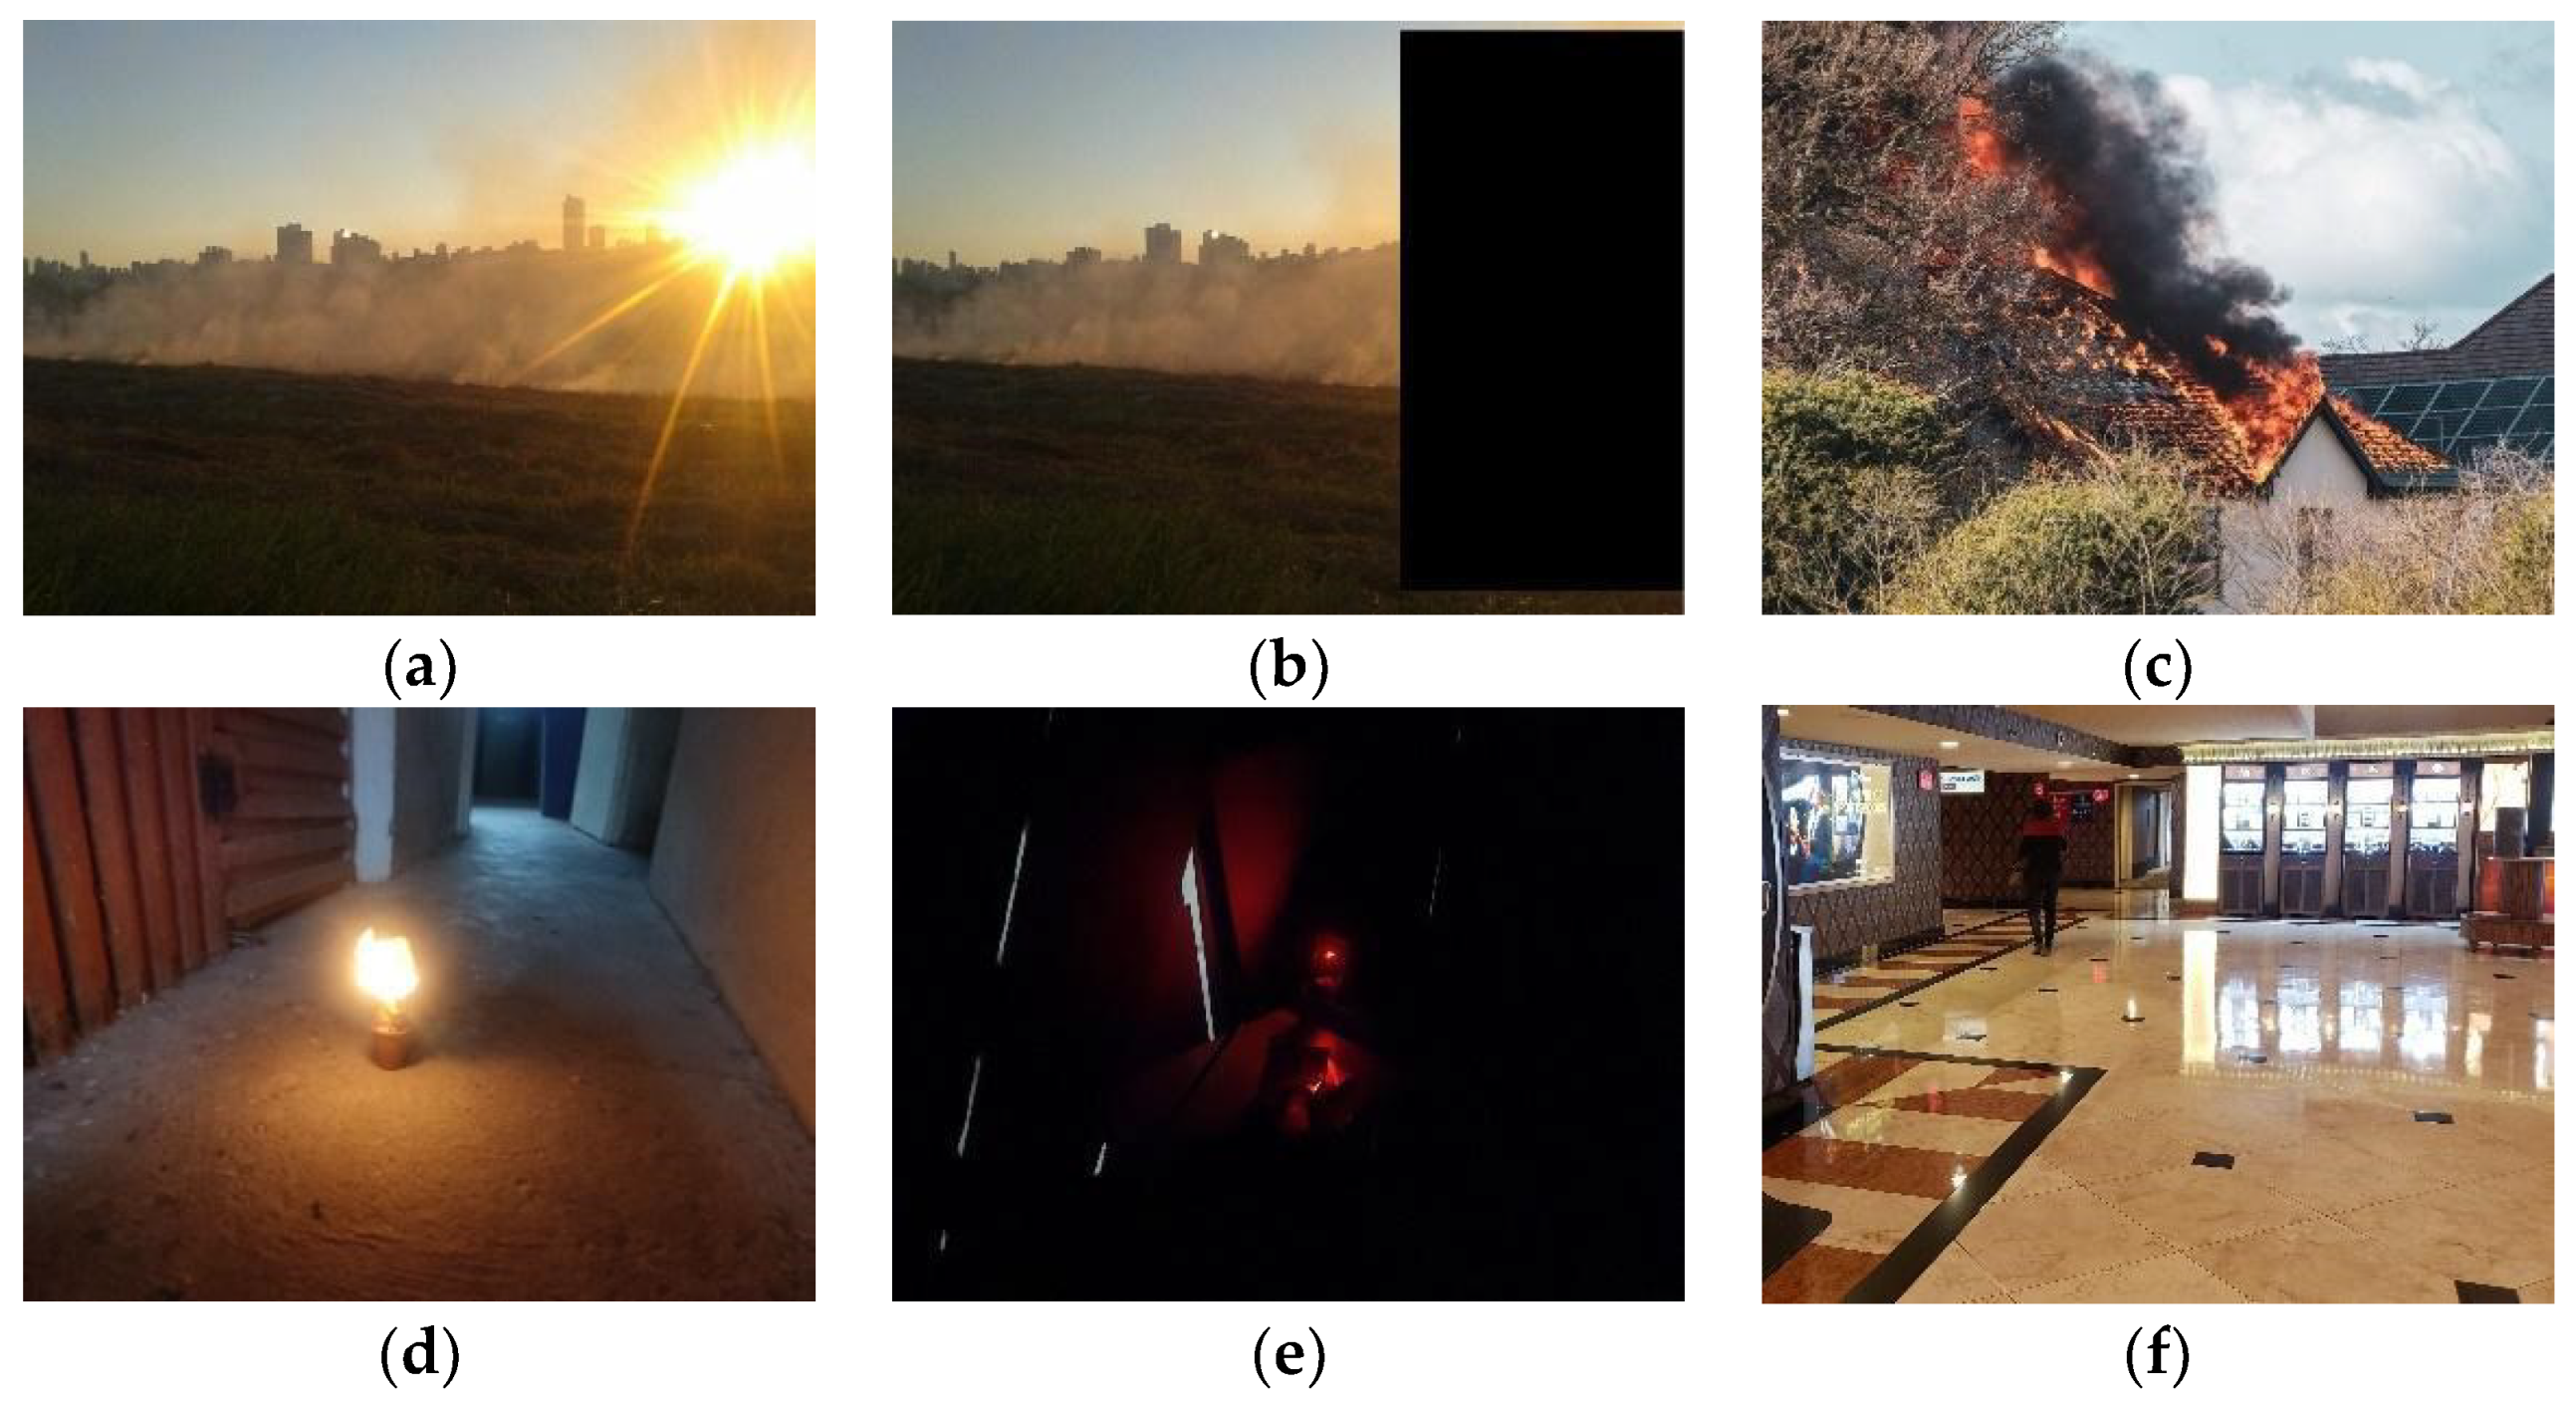
2.2.1. Image Classification

When it comes to fire detection using a visual camera, the main goal was to create a dataset that can be used to train, validate, and test custom or existing convolutional neural network (CNN) architectures that can detect fire in input images. The first task was to create a dataset for training. Due to the lack of proper datasets, we had to create a new one. That was accomplished by obtaining publicly available datasets in addition to images scraped from the Internet. The final dataset used for training consists of 50,972 non-fire images and 7359 fire images. The validation dataset consists of 3000 non-fire images and 3000 fire images, and the test dataset consists of 2000 and 2000 images of non-fire and fire, respectively. The evaluated CNNs include various implementations of ResNets, MobileNets, and EfficientNets. ResNets represent the oldest evaluated type of CNNs, whereas MobileNets and EfficientNets are more recent. The best-performing networks out of the four crafted network tiers on the stated dataset include ResNet-101 [25], MobileNetV3-Large variant [26], and EfficientNet-B3 [27]. All evaluated models were trained for 120 epochs, which indicated the number of passes of the entire training dataset that the evaluated model completed. The complete testing methodology, together with training parameters, is available in [28]. The main evaluation metrics of focus were recall and F1-score calculated from the entries in the confusion matrix. Recall is a measure of how many of the positive cases (fire) the classifier correctly predicted as a fire over all the positive cases in the dataset. The recall represents the most important metric because we do not want to misclassify a fire event as a non-fire event, which can lead to extensive or total property damage and has a very high chance of claiming human lives. The F1-score metric was chosen to have a balanced overview of the overall performance of a given model, as it is defined as the harmonic mean of precision and recall. The metrics for all four tiers (L1–L4) of the evaluated networks for the first 60 epochs can be seen in Figure 5. On the designed dataset, a similar conclusion can be derived when looking at all four tiers. EfficientNet outperformed MobileNet, which was close behind. In comparison to other examined networks, Base ResNet exhibited its aging characteristics with poor recall and a low F1-score measure. The similarities between MobileNet and EfficientNet are due to the fact that EfficientNet scales the network width, depth, and input-image resolution in addition to including numerous components from the complete MobileNet network stack. As can be expected, the best results were achieved with network models evaluated in the L4 tier. In Figure 6, the number of parameters, number of operations, and size on disk are presented to visually compare the complexity and required computational power for each tested model. It is shown that all ResNet models had the lowest performance but also the largest number of parameters as well as size on disk, which makes them least suitable for embedded usage.
In Figure 7, there are several image examples from our test dataset along with the achieved results of the best-performing model, EfficientNet-B3. The image in Figure shows the actual class, the class predicted by CNN, and the network’s confidence.
In Figure 7b,e there are some examples in which the network wrongly classified images. Figure 7b is a very challenging image since the flame is very small and barely visible. In the same image, the Figure 7a network correctly classified the image as a fire, but that is due to the sun, which is very bright and is fire colored, thus leading to the network mistaking it as fire. That is confirmed in image in Figure 7b in which the sun is covered but small flames remain, and the network wrongly changed the prediction to non-fire. Figure 7d shows an example in which the fire is overexposed whereas other parts of the image are darkened, posing a challenge to the evaluated model, which predicted correctly but with a lower level of confidence. Because of the stated overexposure, fire morphology cannot be observed properly. A similar problem occurs when observing various light bodies (light bulbs, LEDs, neon lights, etc.). For that reason, many such images were included in the dataset. Figure 7e is another example in which the network made a wrong prediction due to the light, which is quite bright in a very dark area. The images in Figure 7c,f are examples in which the network made a correct prediction with high confidence. To further increase the network’s performance, the dataset must be additionally extended, including more real-world images, and the used network models should also be enhanced to better suit our use case. In addition, some of the newer network architectures will be evaluated on the created dataset.

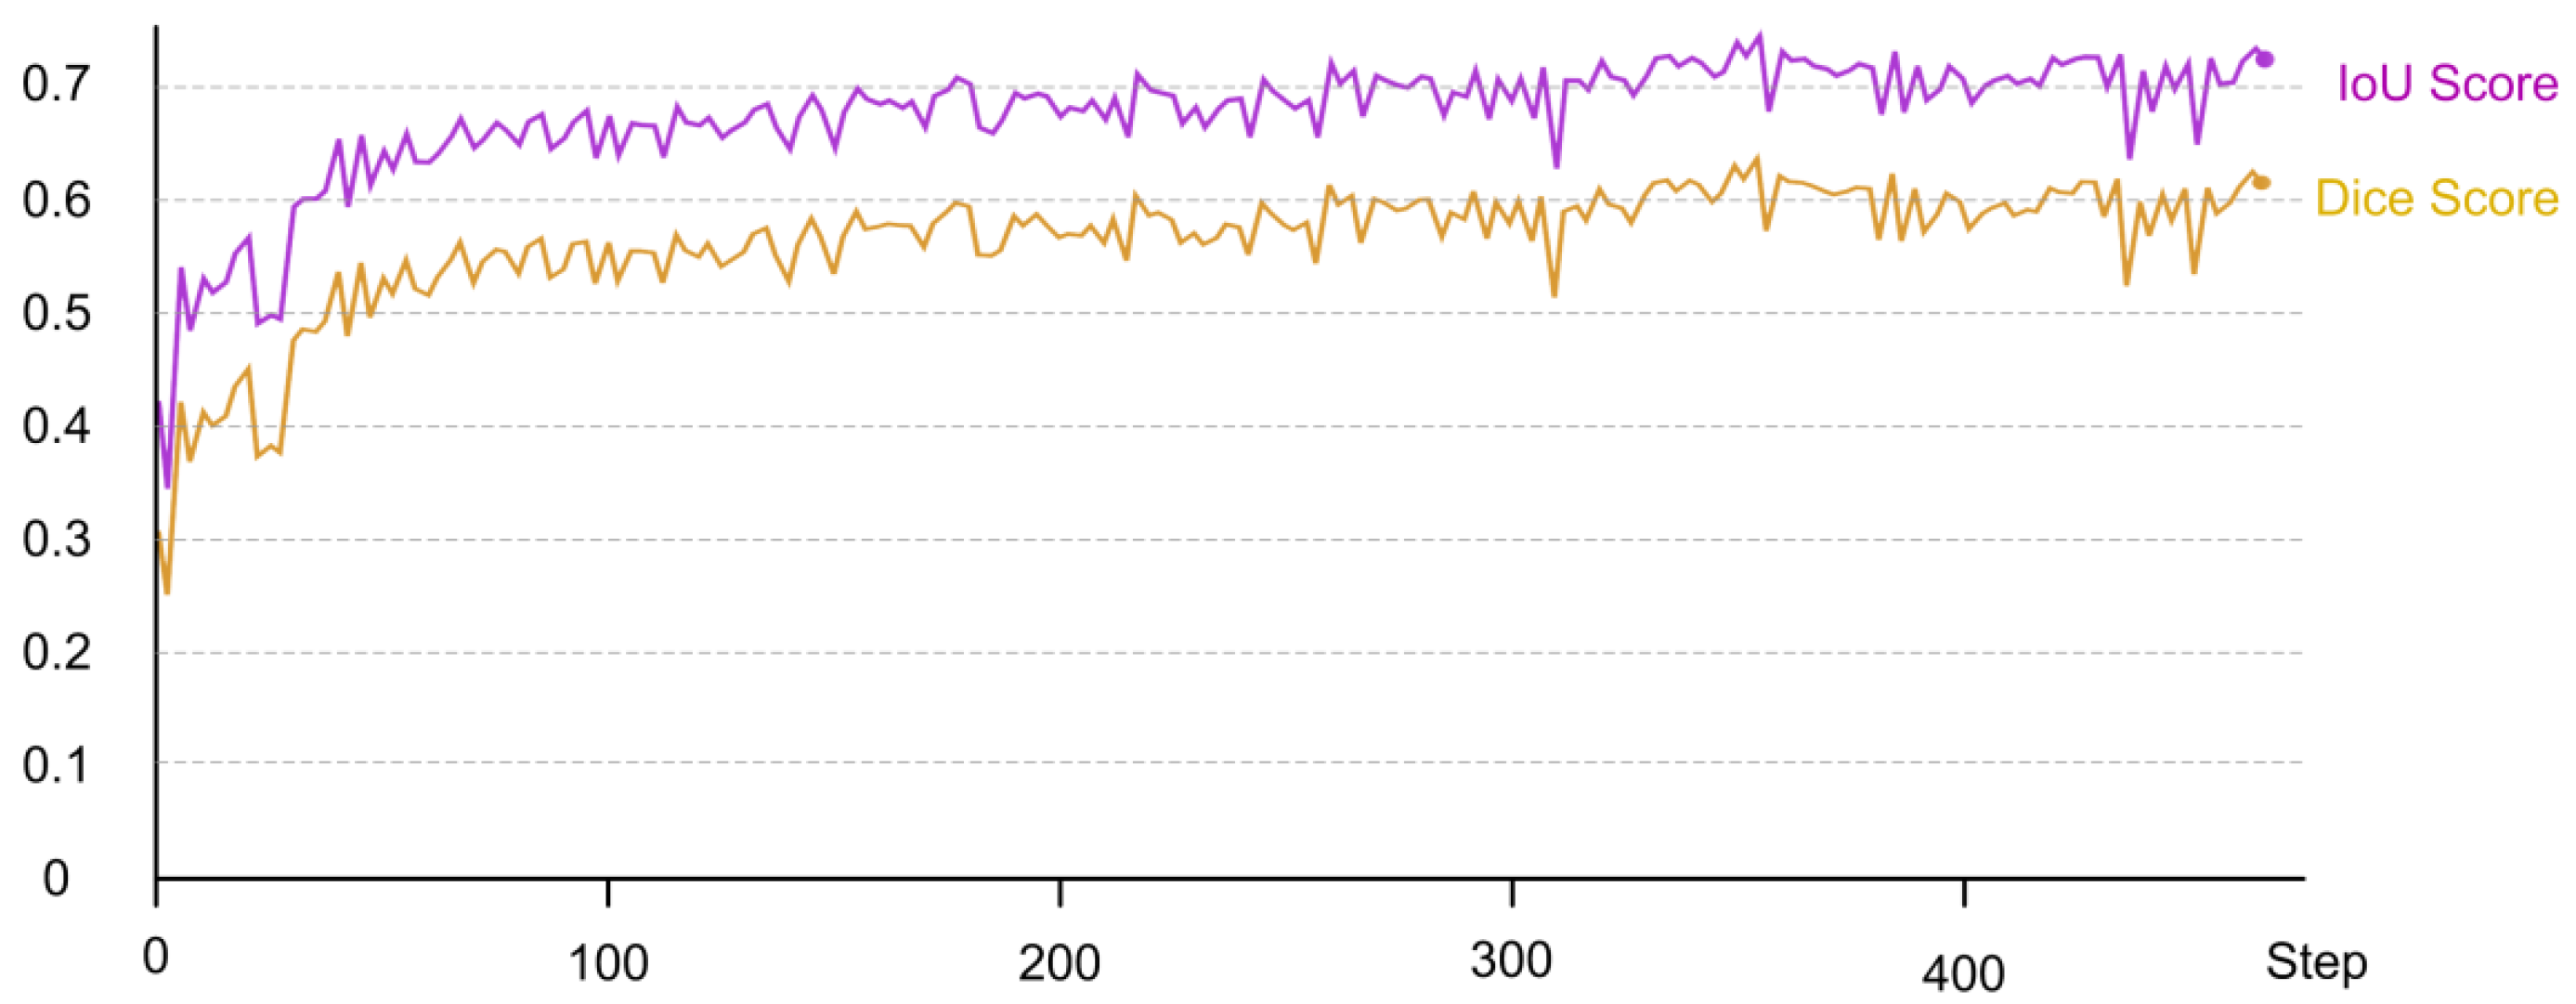
2.2.2. Semantic Segmentation

To enhance the precision of fire detection even further and to localize the fire in input images, two approaches were used—semantic segmentation and object detection. The goal of semantic segmentation is to cluster the parts of an image together that belong to the same object class. In our case, two target classes are fire and smoke. Semantic segmentation does not only expect labels and bounding box parameters as output. The result is a high-quality image with each pixel assigned to a certain class, often the same size as the input image. Therefore, it is a classification of images at the pixel level. There are two types of image segmentation: semantic segmentation, which classifies each pixel with a label, and instance segmentation, which classifies each pixel and differentiates each object instance. For the purpose of image segmentation, U-Net architecture [29] was used. U-Net architecture was originally designed for medical-image segmentation but over the time it was adapted for different purposes. It is one of the earliest deep-learning segmentation models, and several GAN variations, including the Pix2Pix generator, use the U-Net design. The model architecture is fairly simple. It consists of an encoder (for downsampling) and a decoder (for upsampling) with skip connections. Skip connections are used to concatenate the encoder feature map with the decoder, which helps the backward flow of gradients for improved training. Two main metrics when evaluating image segmentation are the dice coefficient and Intersection-Over-Union (IoU). IoU is the area of the overlap between the predicted segmentation and the ground truth divided by the area of the union between those two measures. It ranges from 0 to 1 (0 to 100%). The dice coefficient is calculated exactly the same as the F1-score, two times the area of overlap divided by the total number of pixels in both images. The preliminary results, dice score, and IoU of the evaluated U-Net network are presented in Figure 8. From the obtained score, it can be seen that the dice score and IoU score were both slightly above the 0.6, which is considered a good score but leaves a lot of room for progress both in improving the dataset and upgrading the trained network model. An example of segmented images from the training is presented in Figure 9, which also confirms the abovementioned statement that the segmentation network already achieved great results, but additional improvements will make it even better.

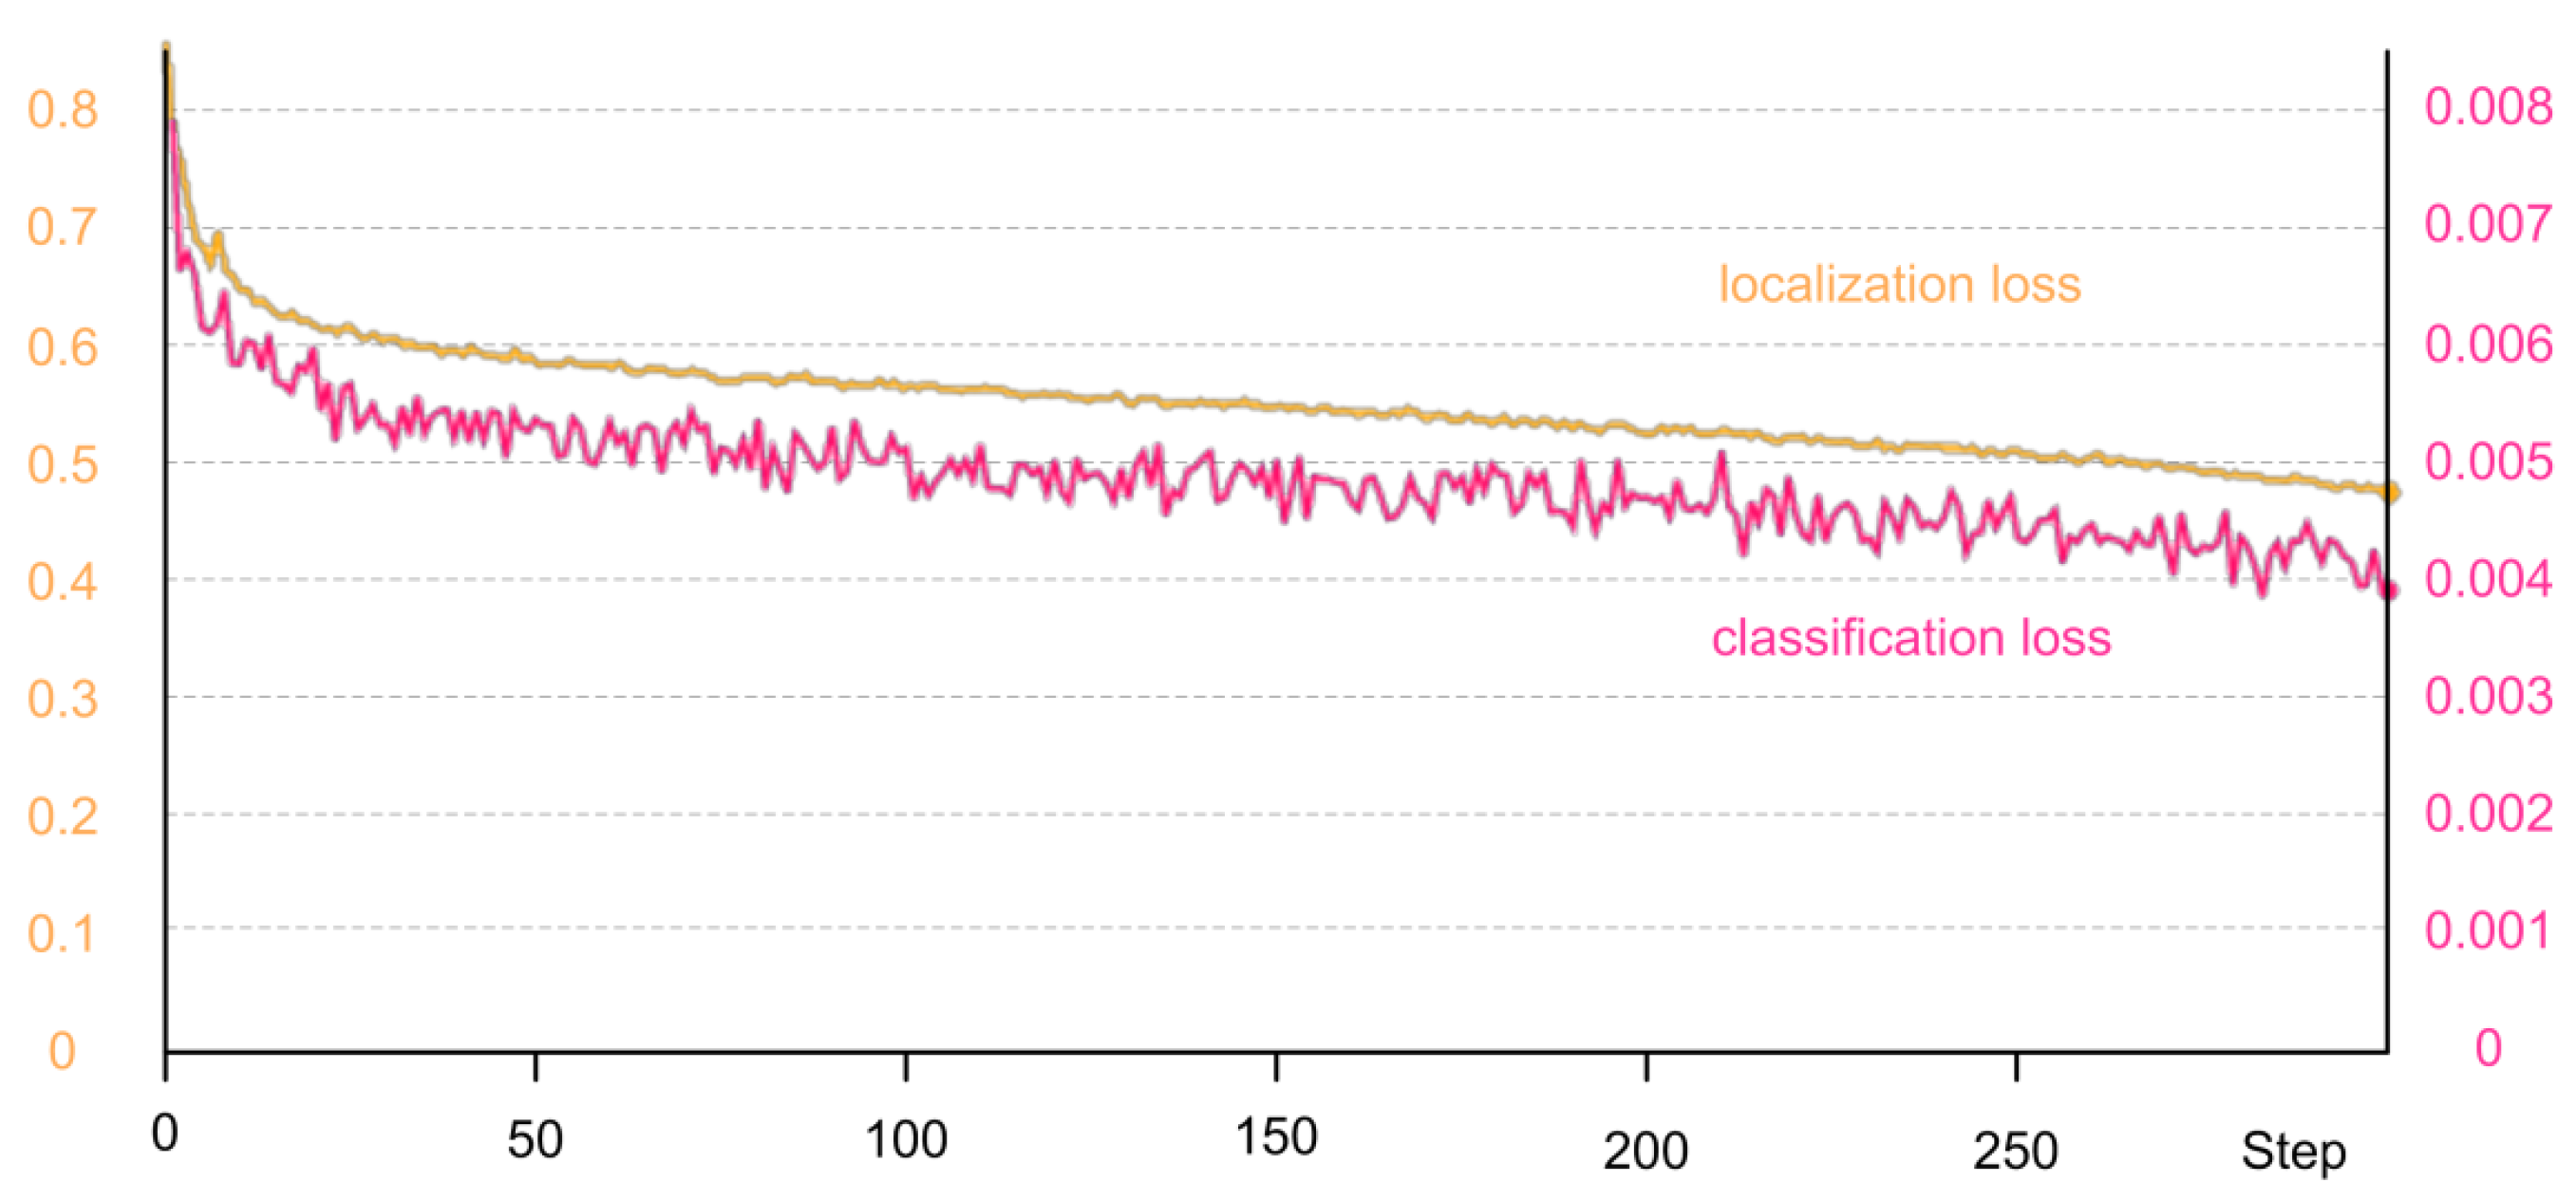
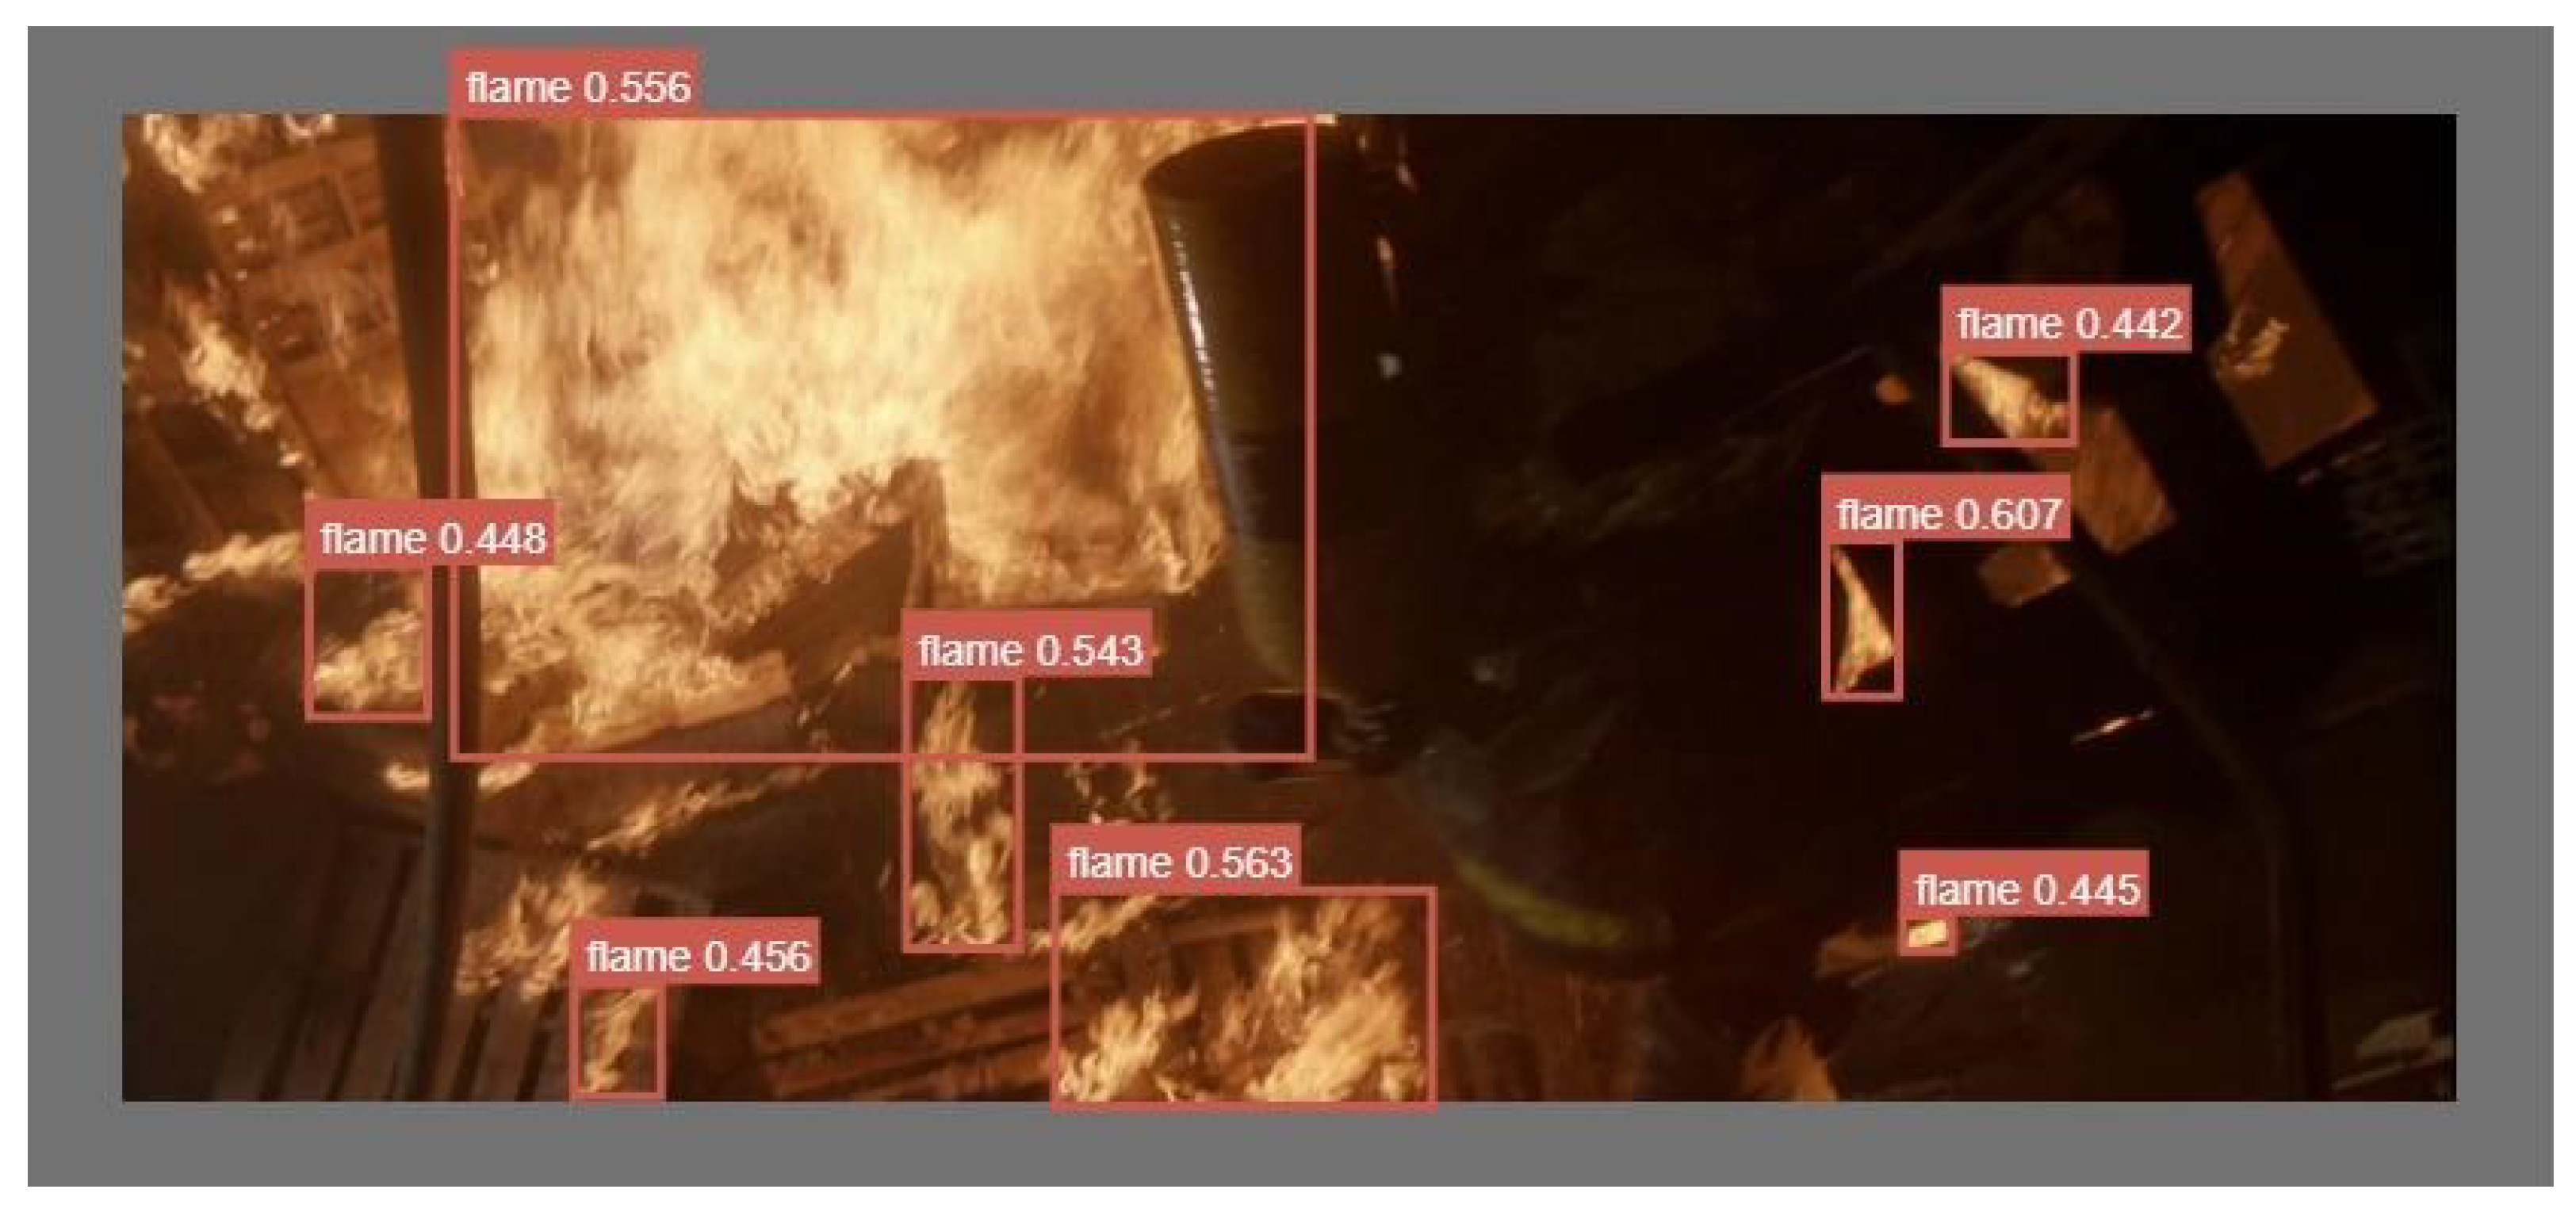
2.2.3. Object Detection

As we mentioned in the previous subsection, the second approach is object detection using the YOLOv5 network model. YOLOv5 is an upgraded network model of the You Only Look Once network model presented in 2016 in [30], YOLOv2 presented in [31], YOLOv3 presented in [32], and YOLOv4 presented in [33]. It is an extremely fast, state-of-the-art network model for object detection. Its main task is to detect instances of objects of a certain class within an image. Object-detection methods can be categorized into two main types: one-stage methods, which prioritize inference speed, and two-stage methods, which prioritize accuracy. YOLOv5 is a one-stage method. It works by dividing images into a grid system; then, each grid is responsible for detecting objects within itself. Outputs are predicted bounding boxes and probabilities for each component. The architecture of the YOLO model consists of three parts. The first part is the backbone. It is used to extract key features from an input image. The neck is the second part. It is used to create pyramid parts. Feature pyramids aid models in generalizing when it comes to object scaling. It also helps in the identification of the same object in various sizes. The last part is the head. It is responsible for the final detection step. It uses anchor boxes to construct final output vectors with class probabilities and bounding boxes. Figure 10 depicts the YOLOv5 loss function as a combination of classification loss and localization loss. If an object is detected, the classification loss at each cell is the squared error of the class conditional probabilities for each class. The localization loss measures the errors in the predicted boundary-box locations and sizes. From the presented loss, the YOLOv5 model achieved excellent results but still leaves room for additional progress. An example of a trained model prediction on our dataset is presented in Figure 11.
After the image segmentation and object detection, in addition to knowing whether fire is present in an image, we also know the exact location of the fire in that image. This is critical for directing the fire-extinguishing nozzle to the proper location for quick and effective fire extinguishment.
To be able to train an image-segmentation model or object-detection model, a dataset with a ground truth mask of fire and smoke for every image is required. Because of the lack of that kind of dataset, we started building a new one and began manually annotating every image. For that purpose, a new annotation tool was developed that will be further explained in the next subsection

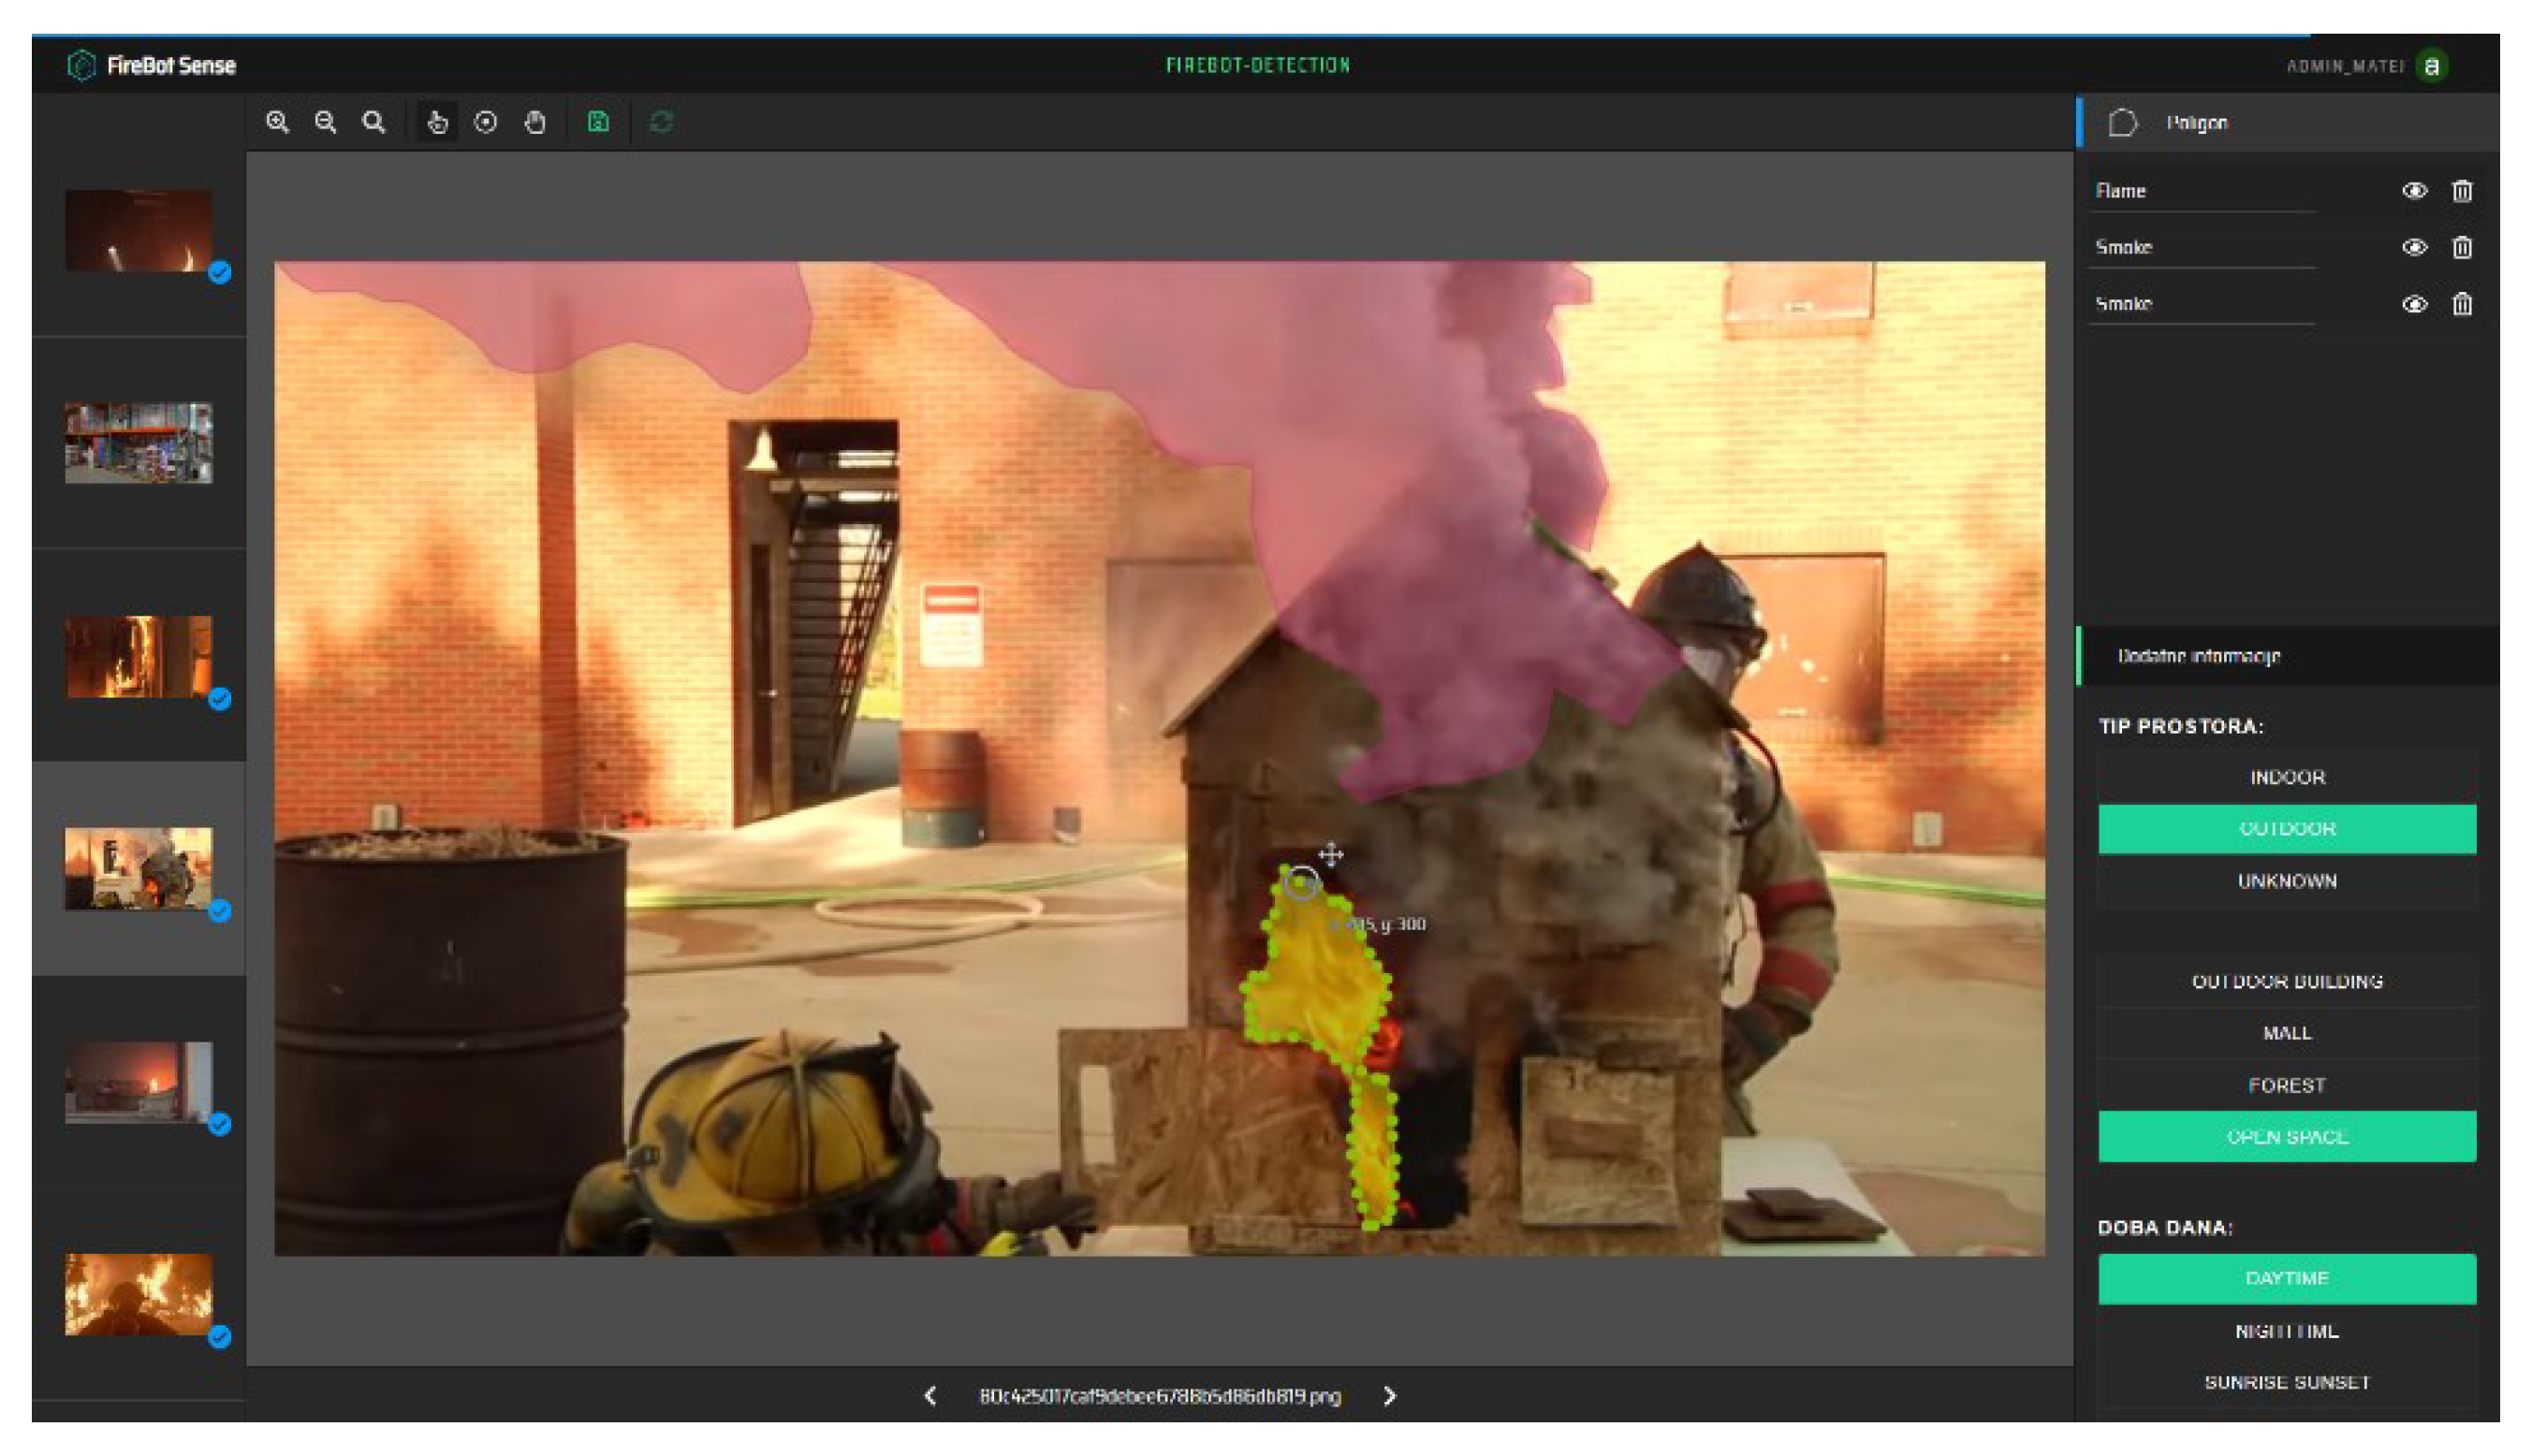
2.2.4. FireSense Image Annotation Tool

For image annotation, there are many tools available. The drawing of polygons, rectangles, points, and lines is one of the fundamental features that every annotation tool must have. Additionally, they must be able to export annotated data in multiple formats that are used by different deep-learning models for computer vision. Data from various annotation tools are exported in a variety of formats. The two most popular formats are Pascal VOC and Microsoft COCO. The main difference between COCO and Pascal VOC is the file format. COCO is stored in JSON format [34], whereas Pascal VOC is stored in XML format [35]. There are also some additional distinctions in the way the annotation data are presented in the stored format. LabelMe [36] is the most-often-used tool for data annotation and was developed by MIT researchers. It is a Web-application tool for image annotation. Although the online application is closed to new users, a copy of the Python-written program has been created and is now in use. This application exports the data in XML format. The biggest disadvantage of the LabelMe annotation tool is that the dataset must be distributed to multiple computers in order for numerous users to annotate it. Another popular annotation tool is the free and open-source browser-based Computer Vision Annotation Tool (CVAT) [37]. It is used for digital image and video annotation. The tasks of image classification, object detection, and picture segmentation can be accomplished with CVAT. Annotators can cooperate on a particular project because projects can be local or shared online. One of the advantages of CVAT is that it can use the TensorFlow API to automatically annotate images. The client side of the CVAT application is limited to working only on the specified browser engine because it only supports Google Chrome and chromium-based browsers. Make Sense [38] is another well-liked tool for annotating data. Make Sense is a GitHub-hosted, free-to-use image-annotation online application. Users can export image-annotation data in a variety of formats.
For the purpose of creating a quality dataset, a new image-annotation tool called FireSense was developed. It is based on the previously mentioned open-source Make Sense tool but with several improvements. The dataset is located on a centralized server, and batches of randomly selected images are sent to the annotators. Administrators can easily manage the images in the dataset. Additionally, double-blind image annotation with a 90% intersection over union (IOU) overlap is enabled with random batches. Annotations are manually checked if the IOU is less than 90%. It has a backend (on the server side) and a frontend (on the client side), both of which are hosted on a dedicated server. Clients connect using a Web browser. It also allows users to export image-annotation data in a variety of formats, which include CSV, YOLO, VOC XML, VGG JSON, and COCO. When a user logs in, they immediately receive a batch of images. The large area in the middle shows the editor viewport, where polygons can be added or modified. In the left sidebar, all images from the batch are listed. The top-right sidebar shows all the labels that users annotated. There, the user can change the polygon’s class, toggle the visibility, or remove the polygon. In the bottom-right sidebar, the user can change other information about the image, including type of space, time of day, whether there is an artificial light source, the size of the flame, etc. The FireSense interface is presented in Figure 12.
To create an annotated-image dataset, some of the images from the dataset mentioned in Section 2.2.1. were used along with some additional fire images acquired from several different firefighting departments, and by using the abovementioned image-annotation tool, we created a dataset of 11,164 manually annotated images. That dataset includes a total of 48,662 flame annotations, 3350 smoke annotations, and 1230 non-fire images. Out of all annotated images, 2356 are in a warehouse, 476 are inside an office, and others are outside or unknown. Half of the images were taken during daytime and a quarter during night; the rest could not be determined. This dataset is currently being used along with the image-segmentation network model for fire detection and fire localization. In addition, this dataset is constantly being increased to enhance the model confidence even further in determining the presence of fire and smoke pixels. More information about the FireSense (Faculty of Electrical Engineering, Computer Science and Information Technology Osijek, Osijek, Croatia) annotation tool and created dataset can be found in [39].

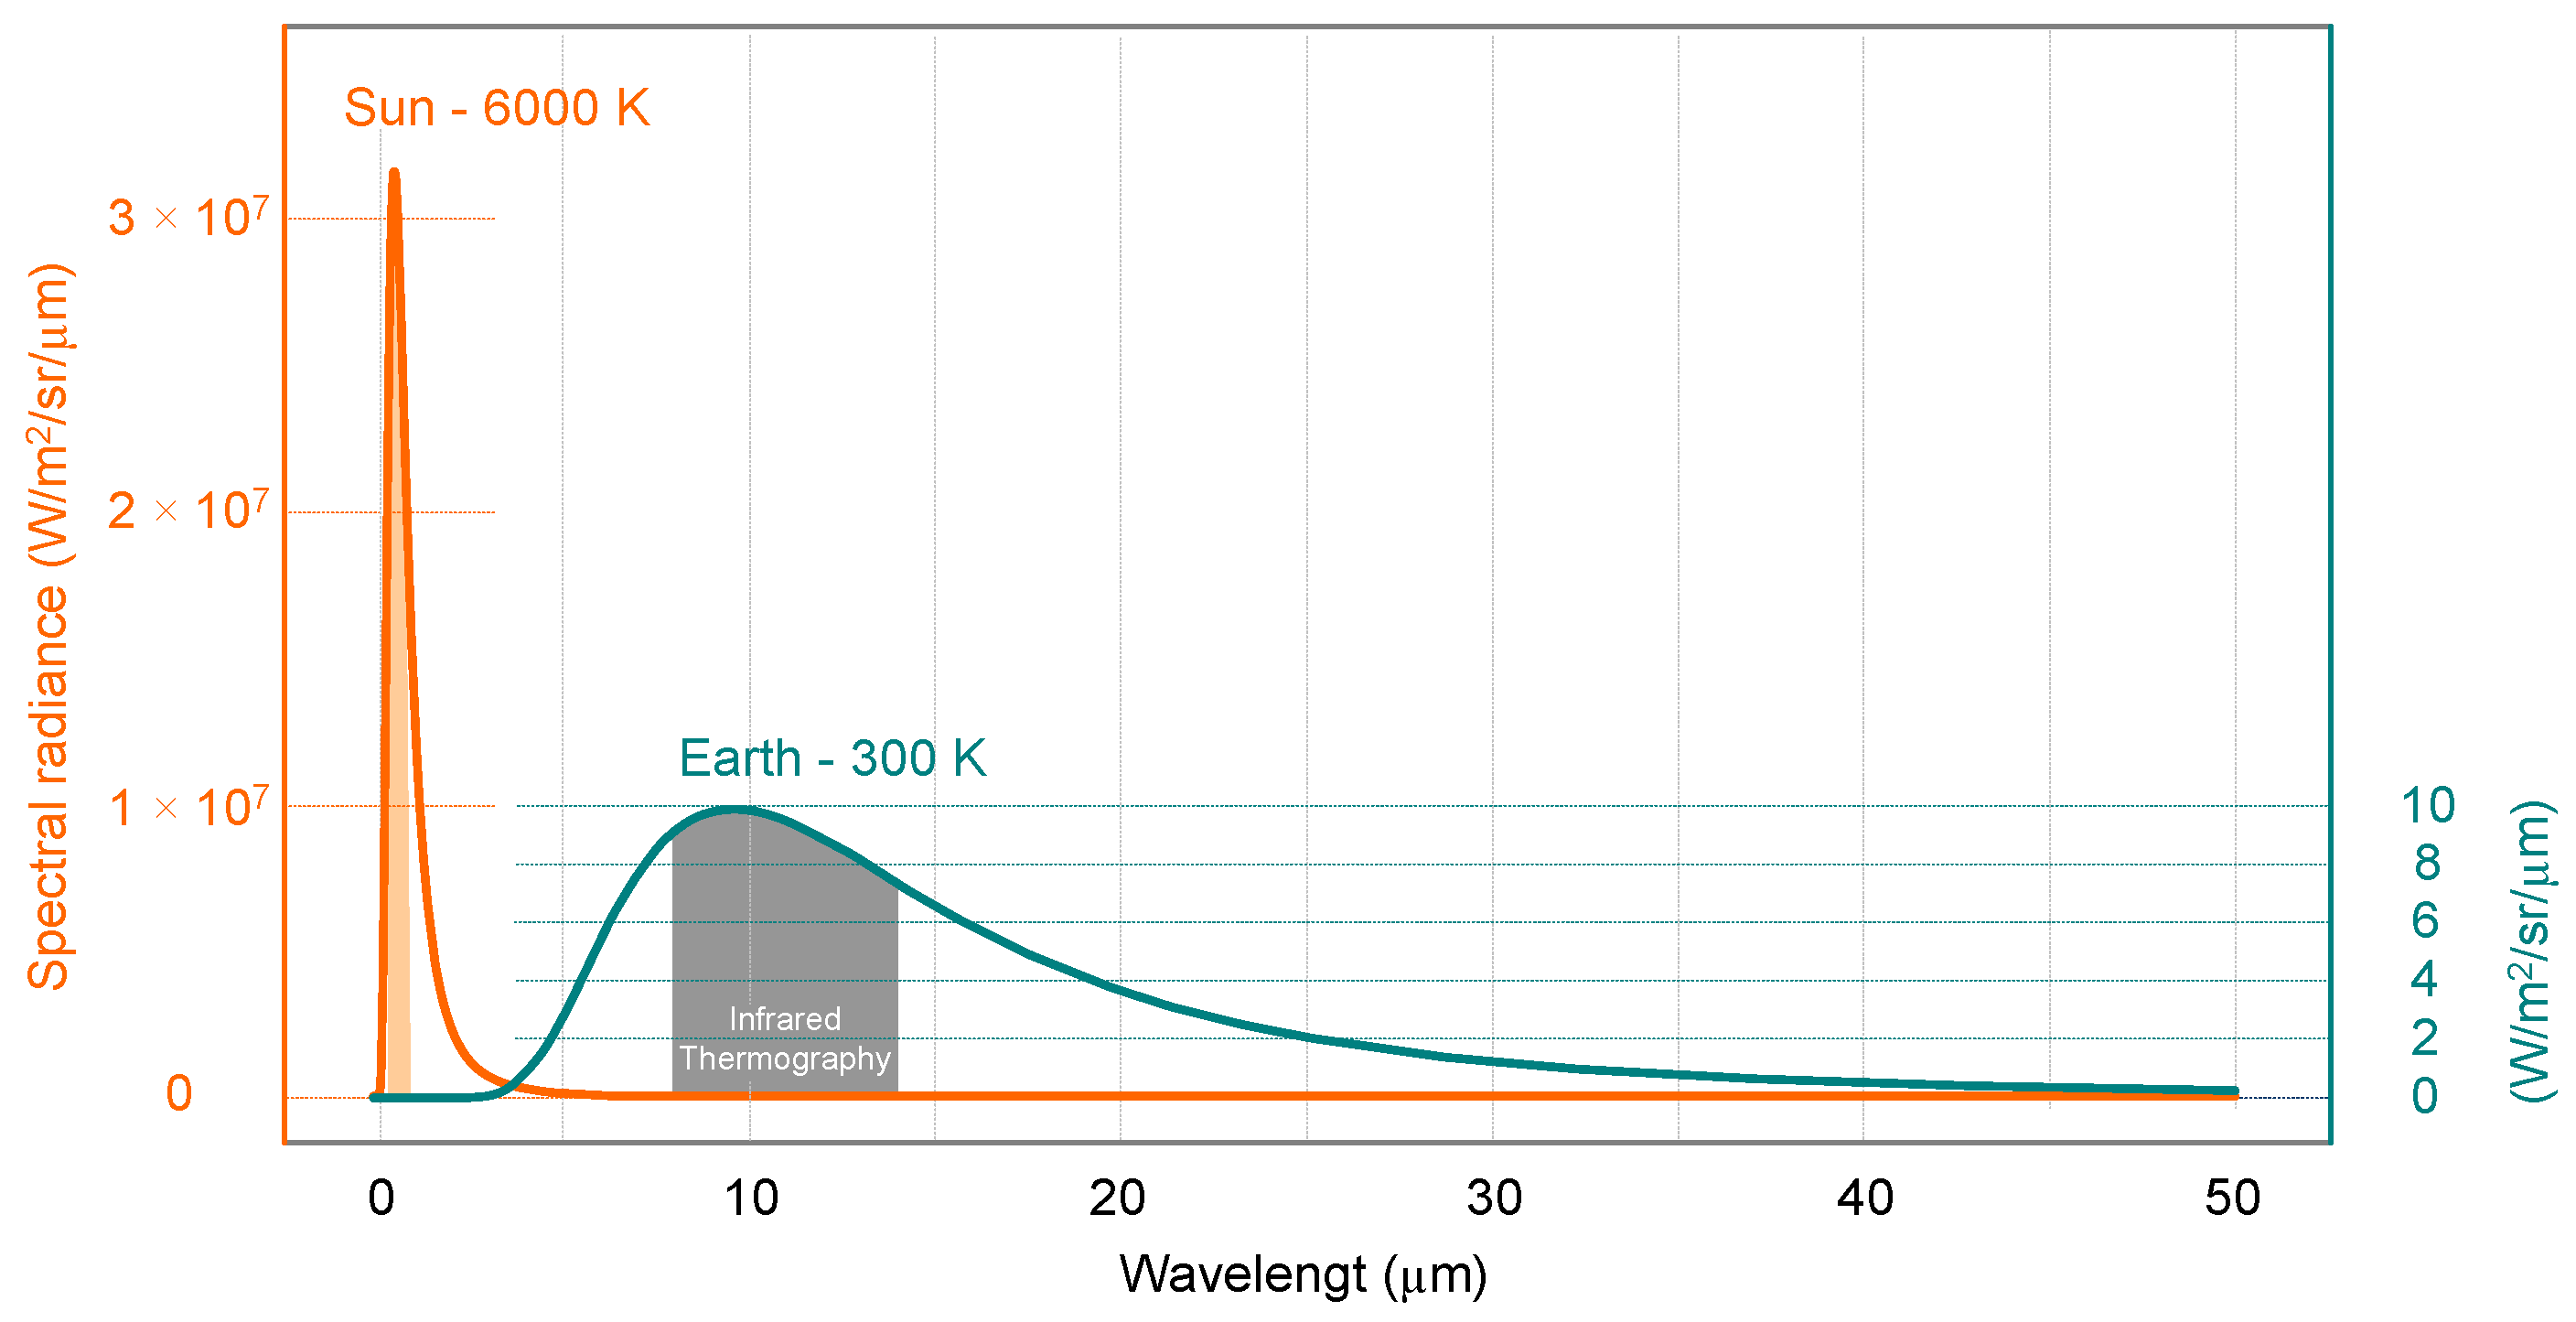
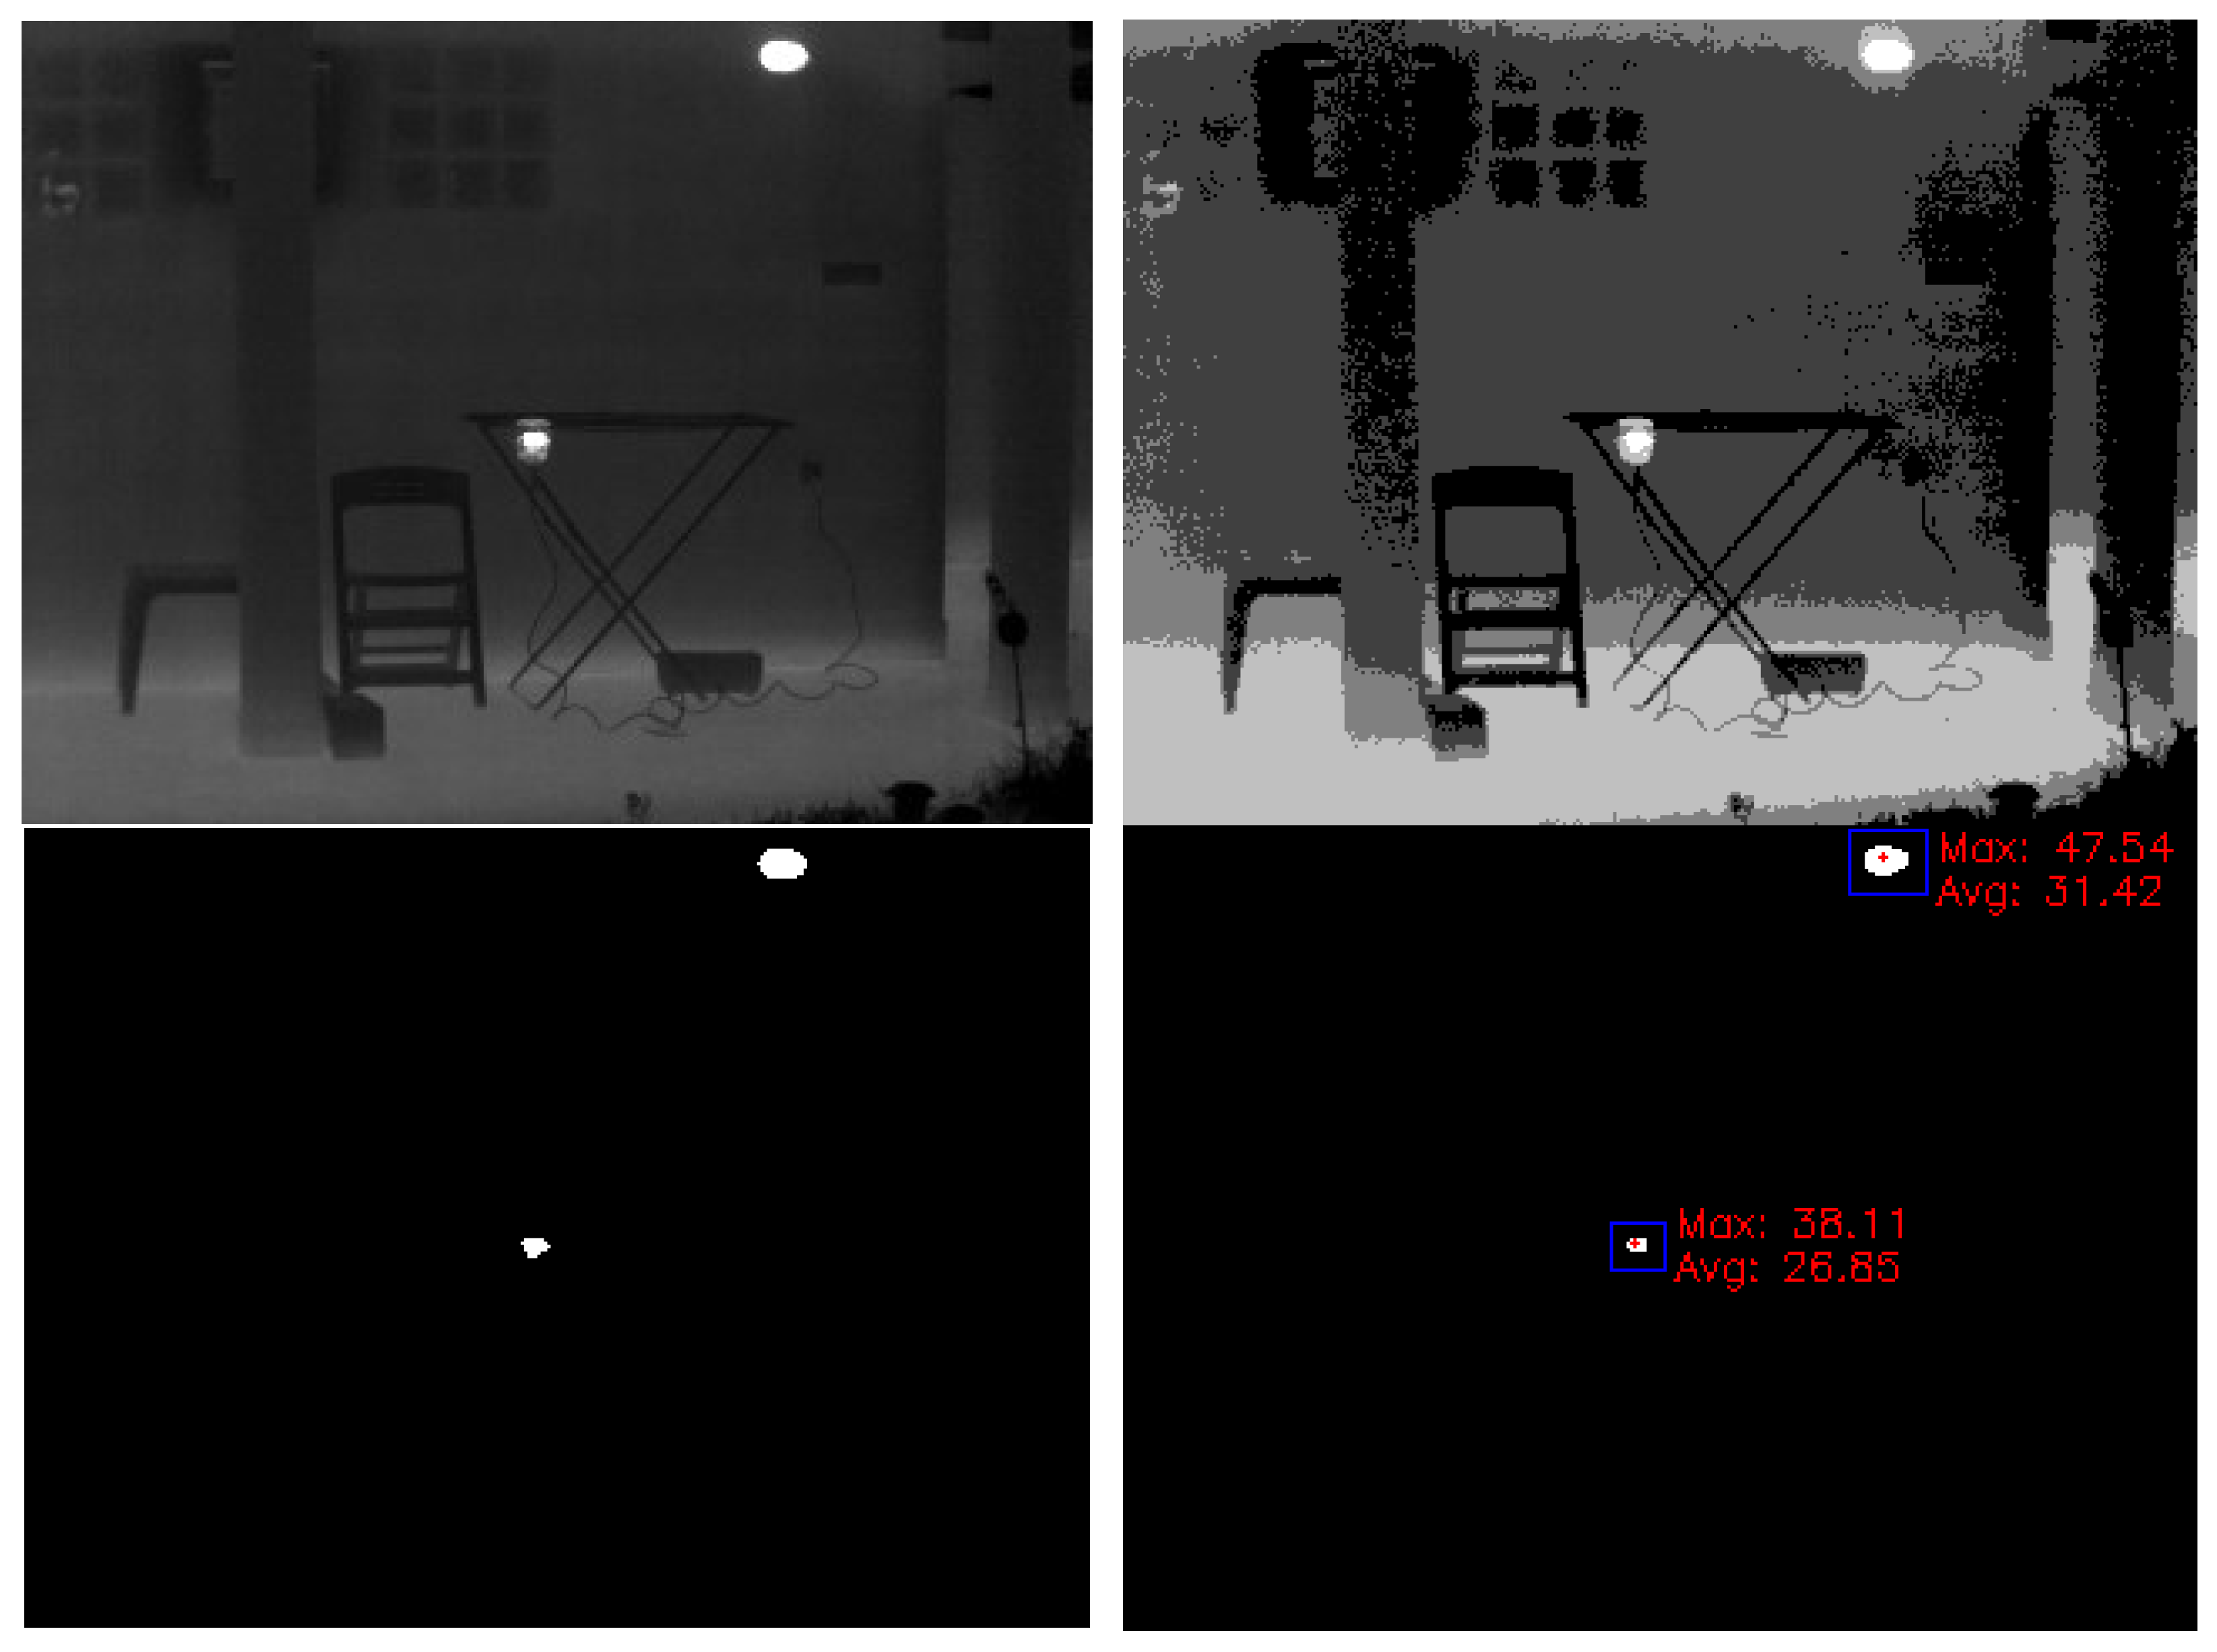
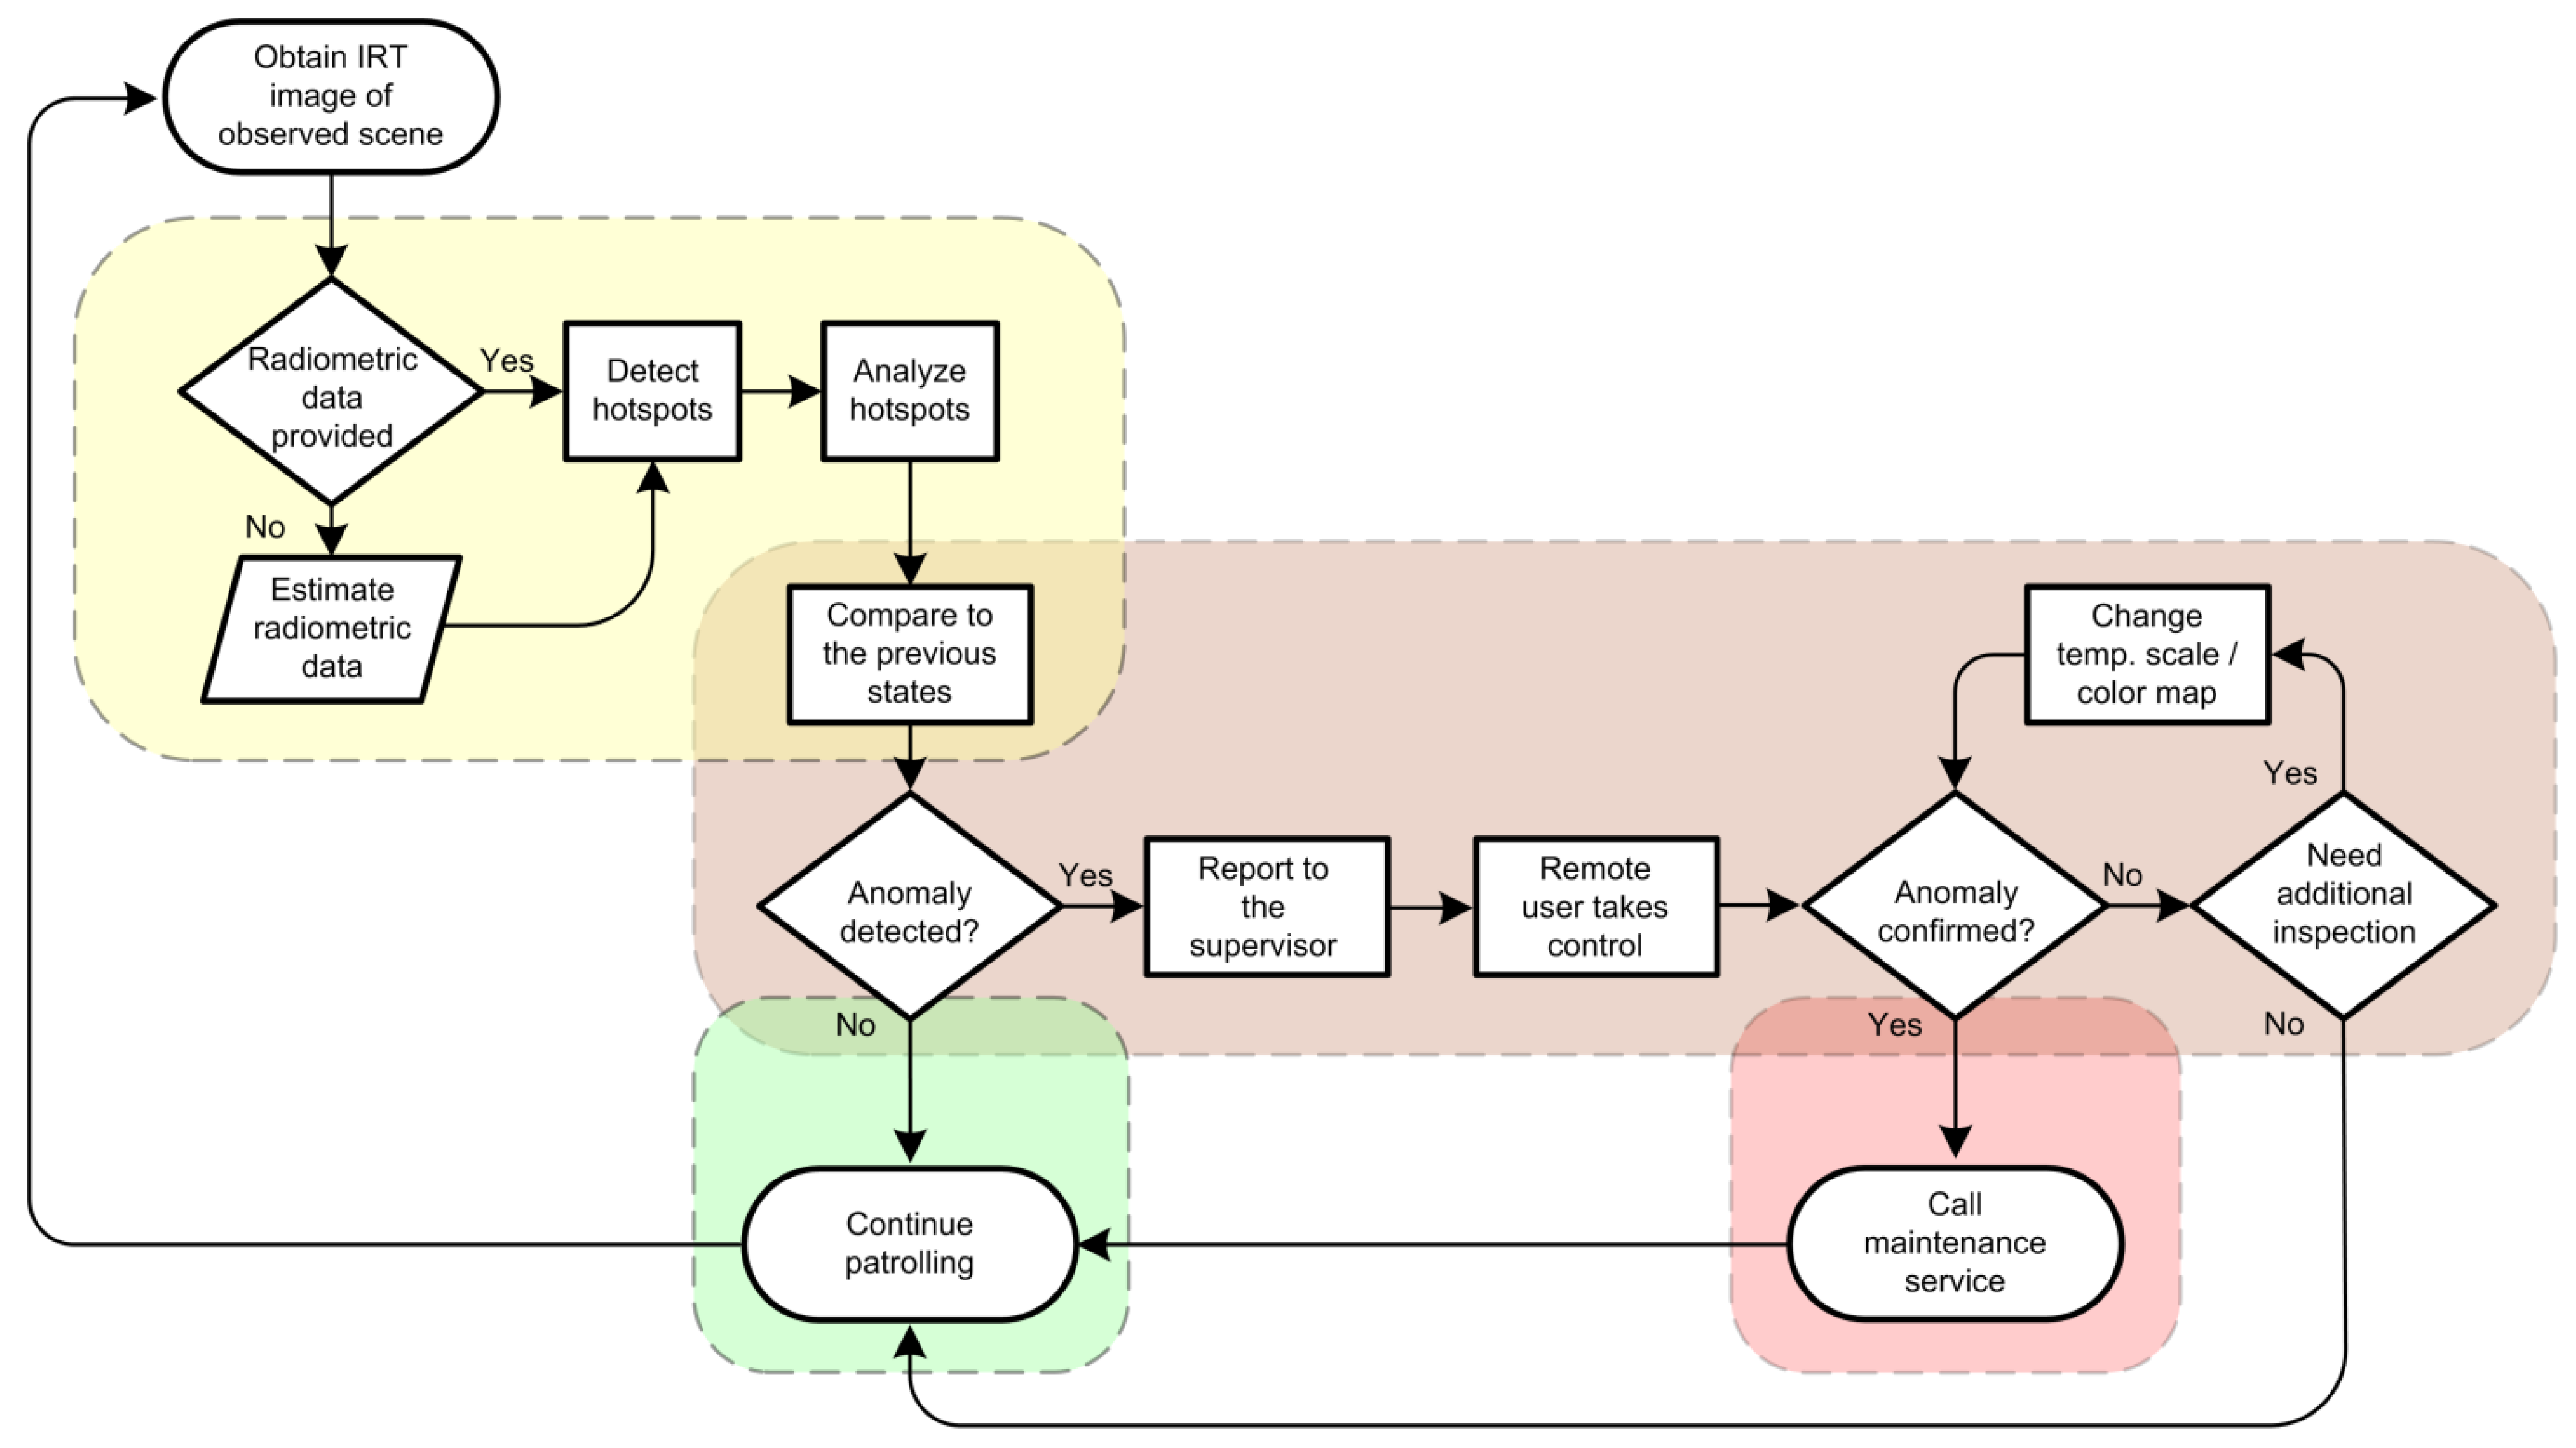
2.2.5. Temperature Anomaly Detection

When it comes to fire prevention by determining potential temperature anomalies, an infrared thermal camera is used. Infrared thermal imaging is the best way to capture the temperature-range characteristic of the Earth’s electromagnetic spectrum. Figure 13 clearly shows the maximum of the visible part of the spectrum and the detection range of the infrared thermal imager. When objects were heated to a temperature higher than 525 °C, in addition to thermal radiation, the emission of light detected by a classical camera began to appear. However, the fire situation had progressed already.
As mentioned earlier, FireBot will be equipped with an infrared thermal-imaging camera that will provide complete spatial radiometric data of the observed scene to detect the potential development of a fire in time before it manifests visually. A thermal-imaging camera does not measure temperature but registers radiation in the infrared part of the spectrum, as shown in Figure 14. Depending on the recording parameters set, the most important of which are the emissivity of the object, the amount of radiation reflected from the surroundings, and, at greater distances, the transmission of the atmosphere, accurate radiometric data can be obtained.
The intensity of infrared radiation from the surface of the observed scene is measured by the camera’s sensor and interpreted as the temperature of every pixel of a thermogram. The thermogram is used to better understand the scene and the potential temperature anomaly when inspecting visually, whereas the radiometric data are required for developing an efficient algorithm for automatic anomaly detection. If an infrared thermal camera without full spatial radiometric data is used, radiometric data can be accurately estimated from a thermogram and detected temperature boundaries, as described in [40]. The idea for anomaly detection is as follows: FireBot will have a predefined route for patrolling, during which it will actively search for a fire using a visual camera. On that route, it will have predefined points of interest that present a potential danger or contain some expensive equipment that needs to be monitored regularly—for example, computers, electric machines, electrical cabinets, server racks, etc. Every time FireBot comes to a certain point of interest, it will take an image of that scene; detect the hotspots; calculate the area of each hotspot, average temperature, and maximum temperature of every hotspot; and compare that data to the data gathered from all previous passes. If the detected temperatures are increased in comparison to the previous states, the number of hotspots is increased, or the area of a hotspot is increased beyond the predetermined threshold, it will be a trigger for an alarm, and an automatic warning message will be sent to the supervisor along with the location of that point of interest. At that moment, a remote supervisor can take control of FireBot and visually inspect that point by using an infrared thermal camera. If a more detailed inspection is required, a remote user can easily adjust the temperature scale or color map of a thermogram to better understand the scene, as described in [40], and call maintenance service if required. An example of anomaly detection is presented in Figure 15, and the flowchart of the temperature anomaly-detection algorithm is presented in Figure 16.

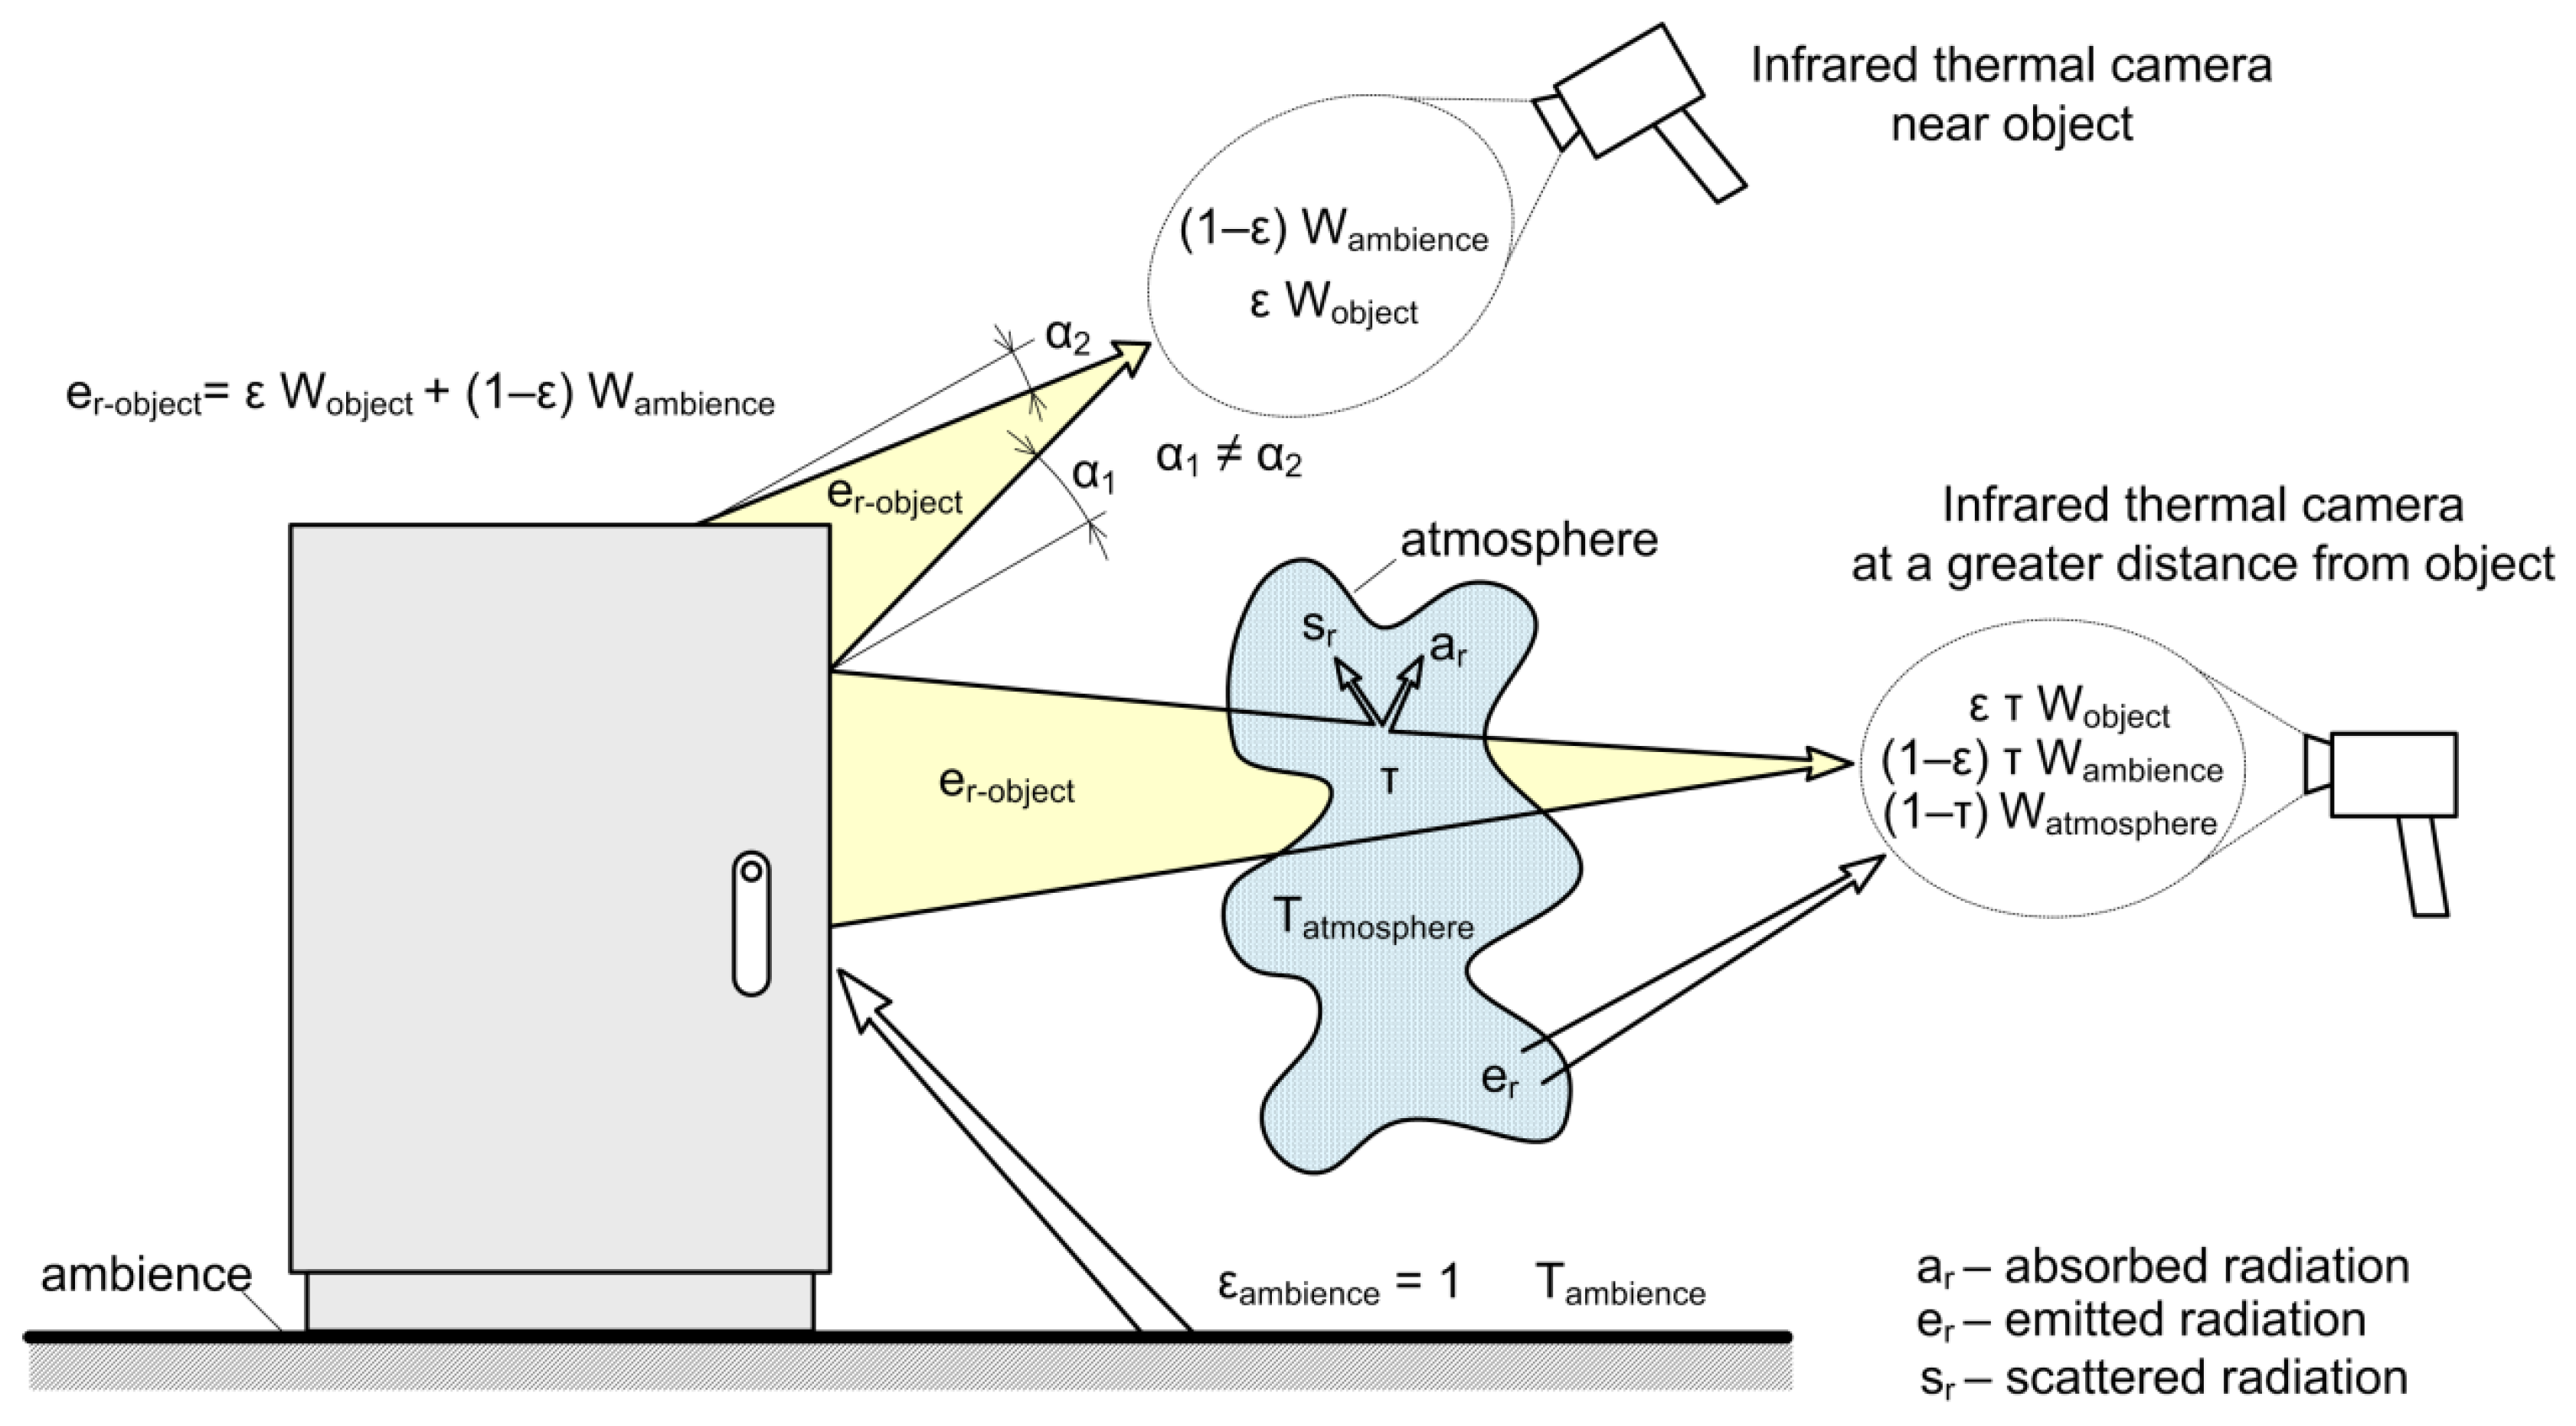
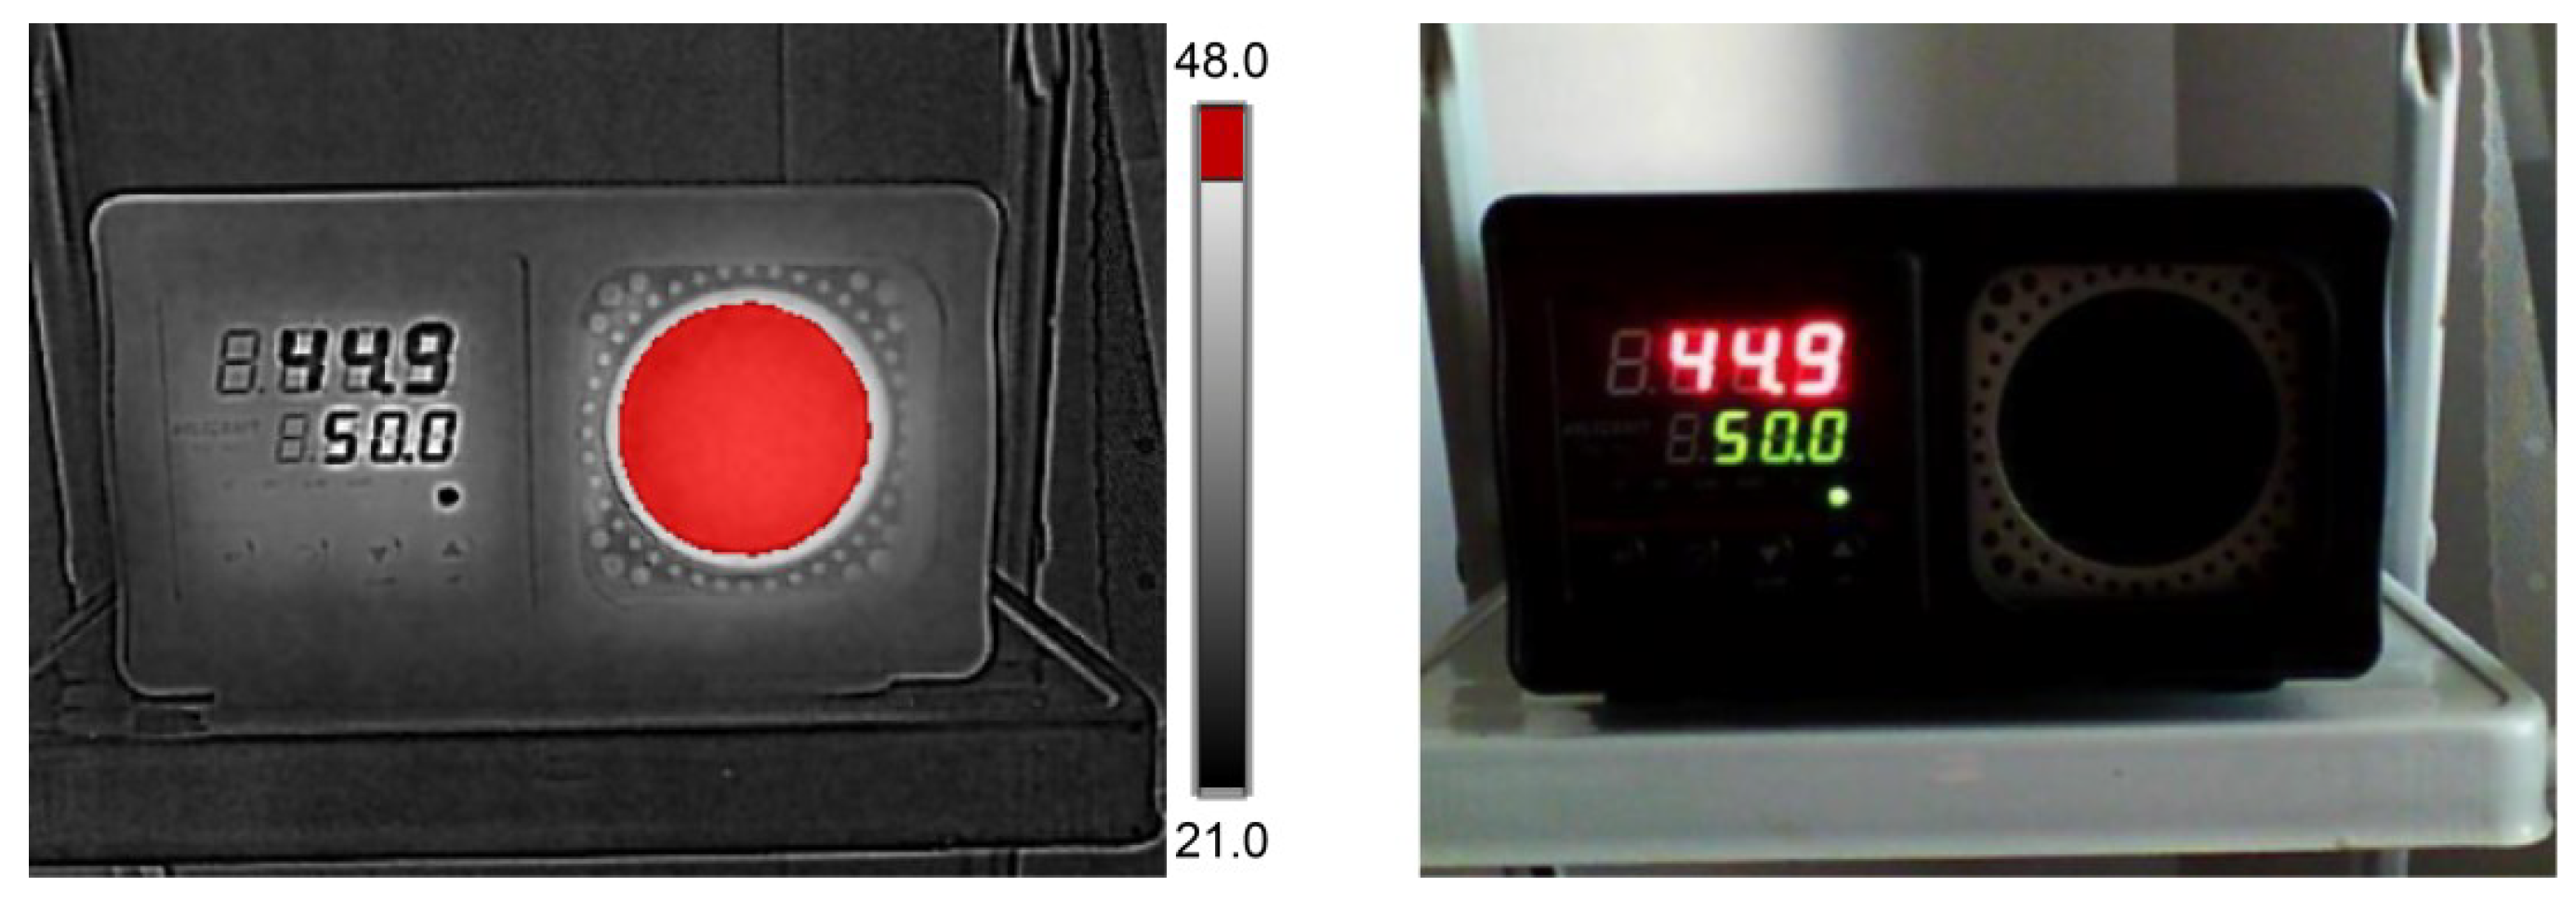
2.2.6. Radiometric Data Estimation

As mentioned in the previous subsection, the approach for temperature-anomaly detection requires full spatial radiometric data to be able to successfully analyze the observed scene and detect the presence of an anomaly. If the full radiometric data are not available, as is the case with some lesser-known camera manufacturers, it was shown in [40] that by using image-processing techniques, it is possible to accurately estimate radiometric data from a thermogram and detected temperature boundaries (minimum and maximum detected temperature) of the observed scene. Estimated data can be further used in developing an anomaly-detection algorithm.
To estimate full radiometric data, we used a white-hot IRT image as input. Pixel values of the input image were then transferred to the array, in which every element represented one pixel of the input image with the intensity in a range of 0 to 255. Temperature boundaries were detected by the IRT camera, and they will be referred to as detLTB and detHTB. By using simple linear conversion, radiometric data for every pixel from the input image was calculated with the following Equation (1):
e s t R a d D a t a = c I P m a x I P · d e t H T B d e t L T B + d e t L T B
where cIP represents the value (intensity) of the current image pixel, maxIP represents the maximum possible value (intensity) of image pixels (in this case 255), detLTB represents the detected lowest temperature boundary, and detHTB represents the detected highest temperature boundary.
After all the values were calculated and rounded to two decimal places, they were stored in a csv file, which represents the estimated radiometric data. Before using estimated data for developing an algorithm for anomaly detection, it is required to calculate the estimation error in order to confirm the estimated data are correct. For error estimation, a Flir E60bx handheld IRT camera that provides full radiometric data was used. The data provided by the camera were considered ground truth and compared to the estimated data. First, dataDiffMat was calculated by subtracting the ground-truth matrix from an FLIR camera with the estimated data using Equation (2).
d a t a D i f f M a t = g r o u n d T r u t h M a t e s t R a d D a t a
After, the minimum- and maximum-estimation errors were extracted using Equations (3) and (4), respectively.
m i n E s t E r r = m i n ( a b s ( d a t a D i f f M a t ) )
m a x E s t E r r = m a x ( a b s ( d a t a D i f f M a t ) )  
An average-estimation error was calculated as a sum of all absolute errors divided by the number of elements in a matrix, as shown in Equation (5).
a v g E r r = i = 1 m j = 1 n a b s ( d a t a D i f f M a t i , j ) m · n
The minimum calculated estimation error was 0.000 °C, the maximum was 0.077 °C, and the average error was 0.037 °C, which are great results, and the estimated results can be further used for developing an algorithm for anomaly detection.

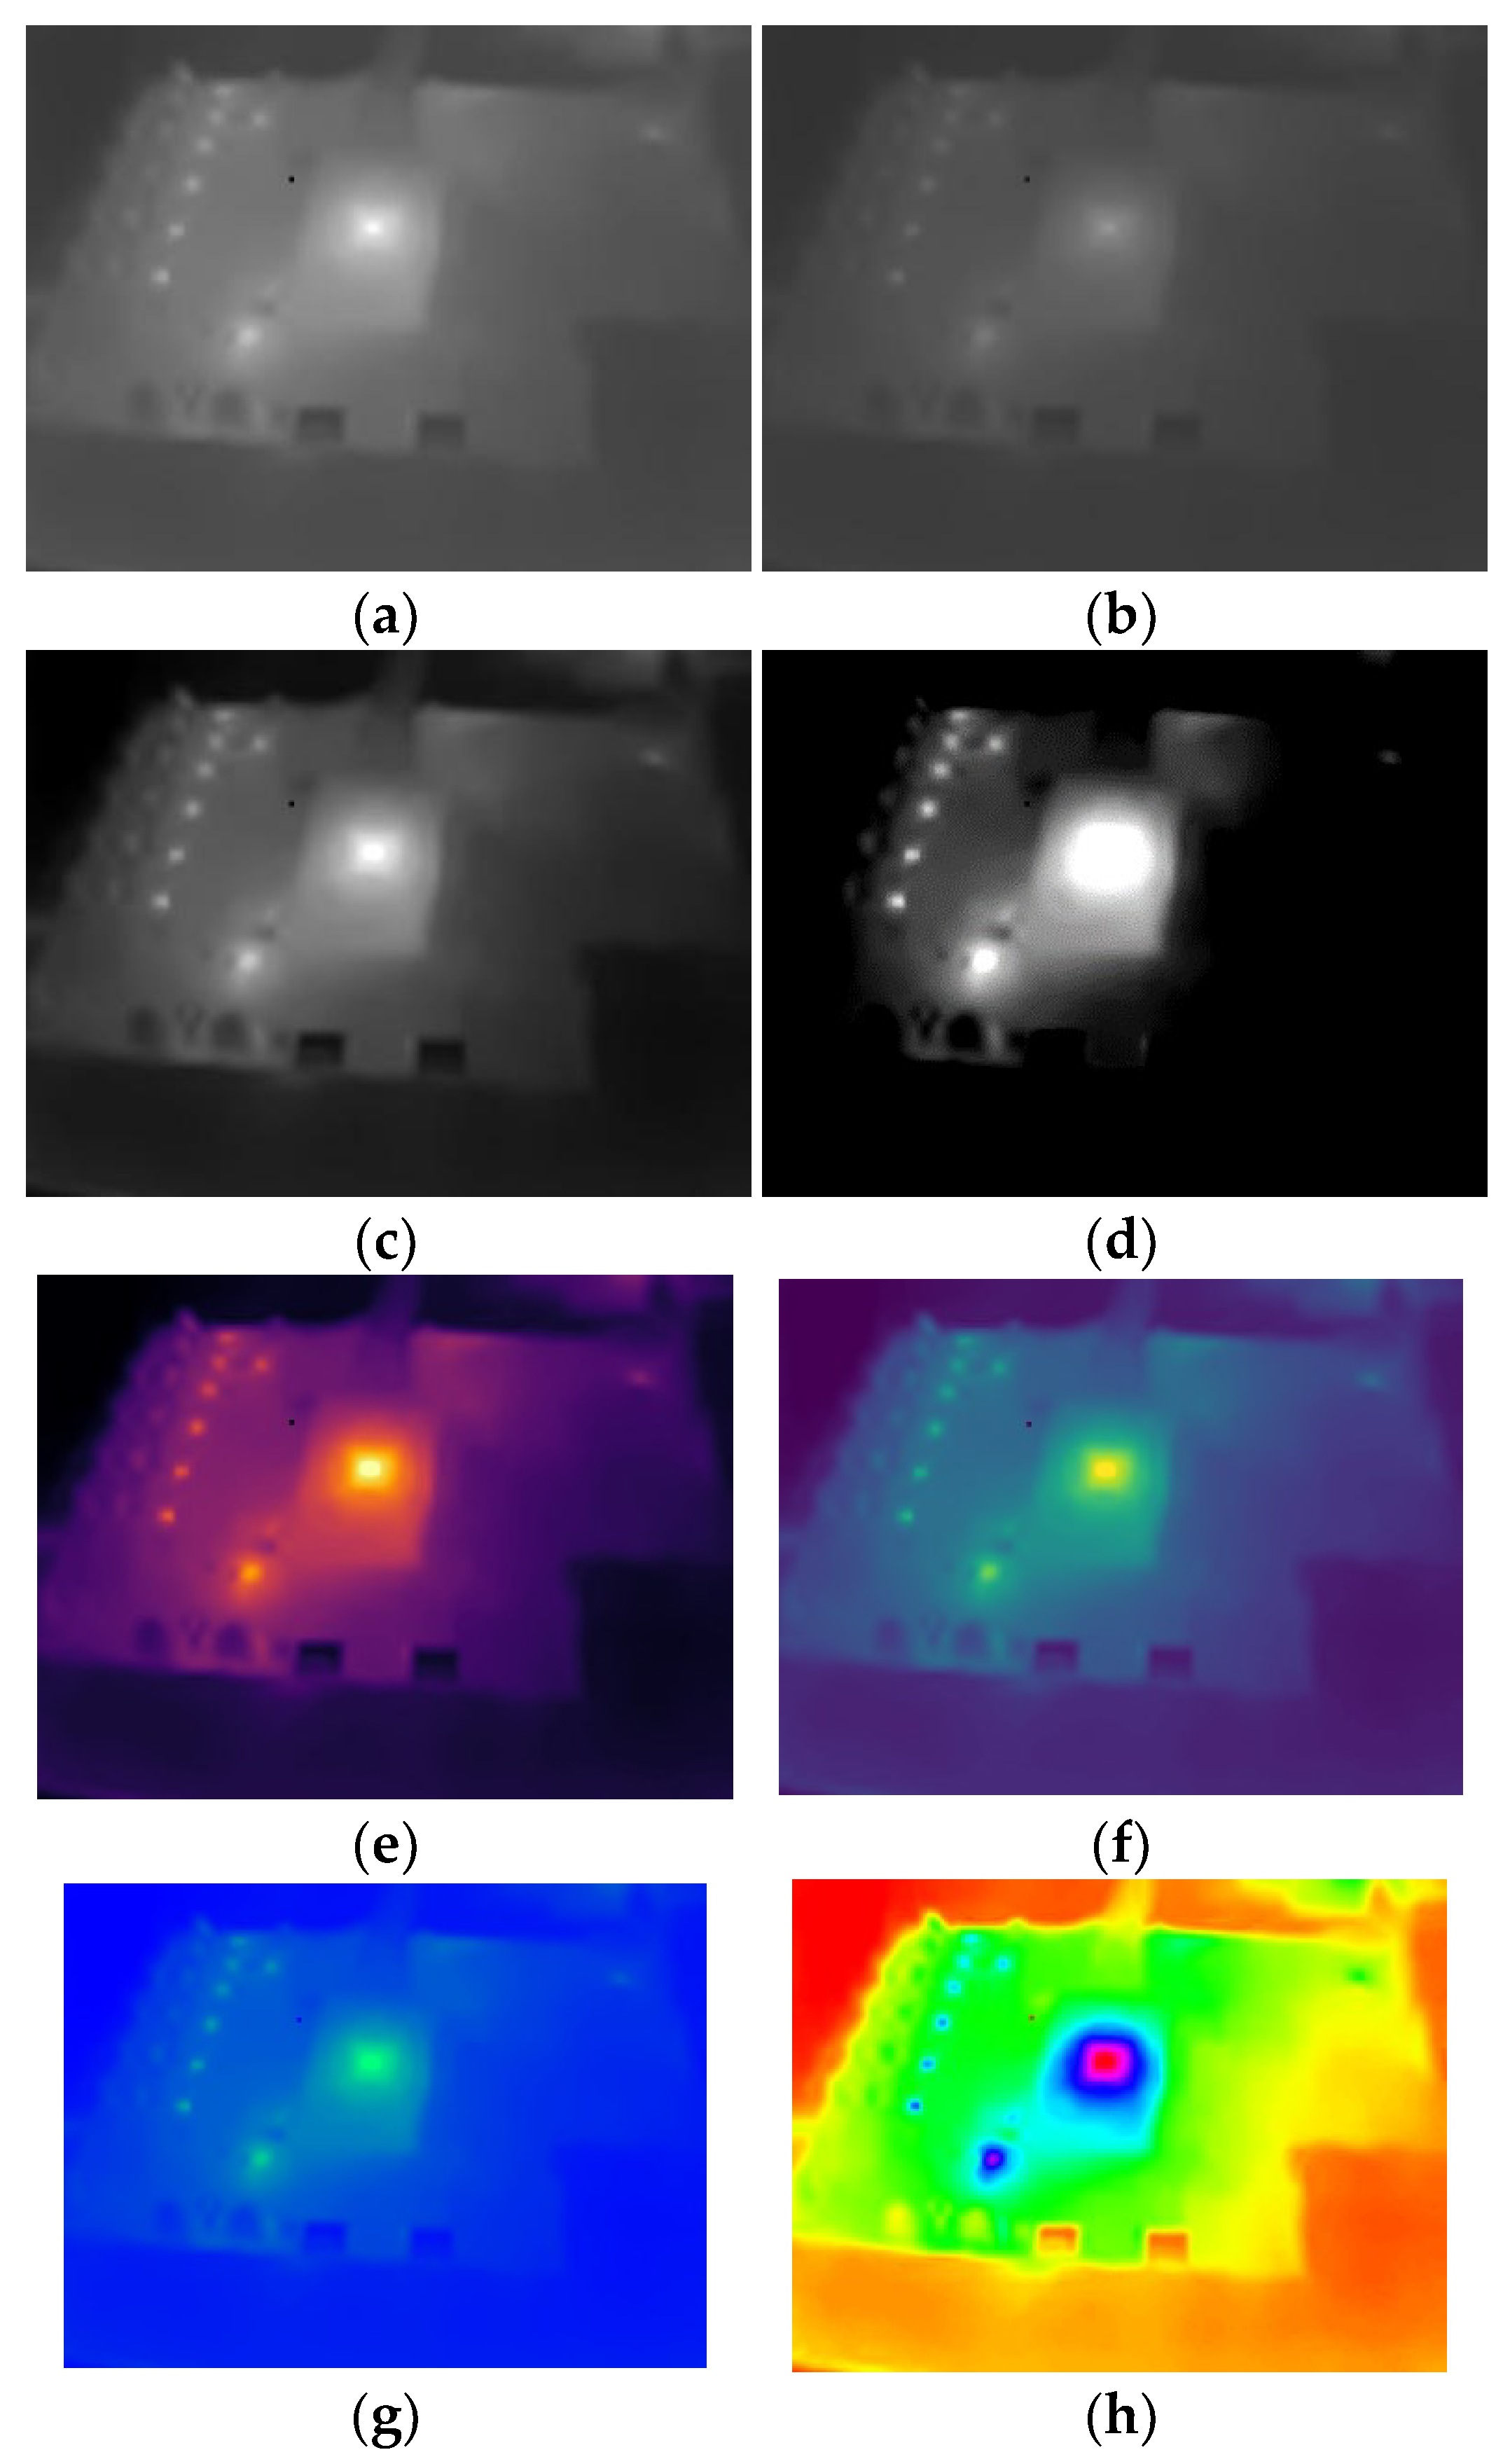
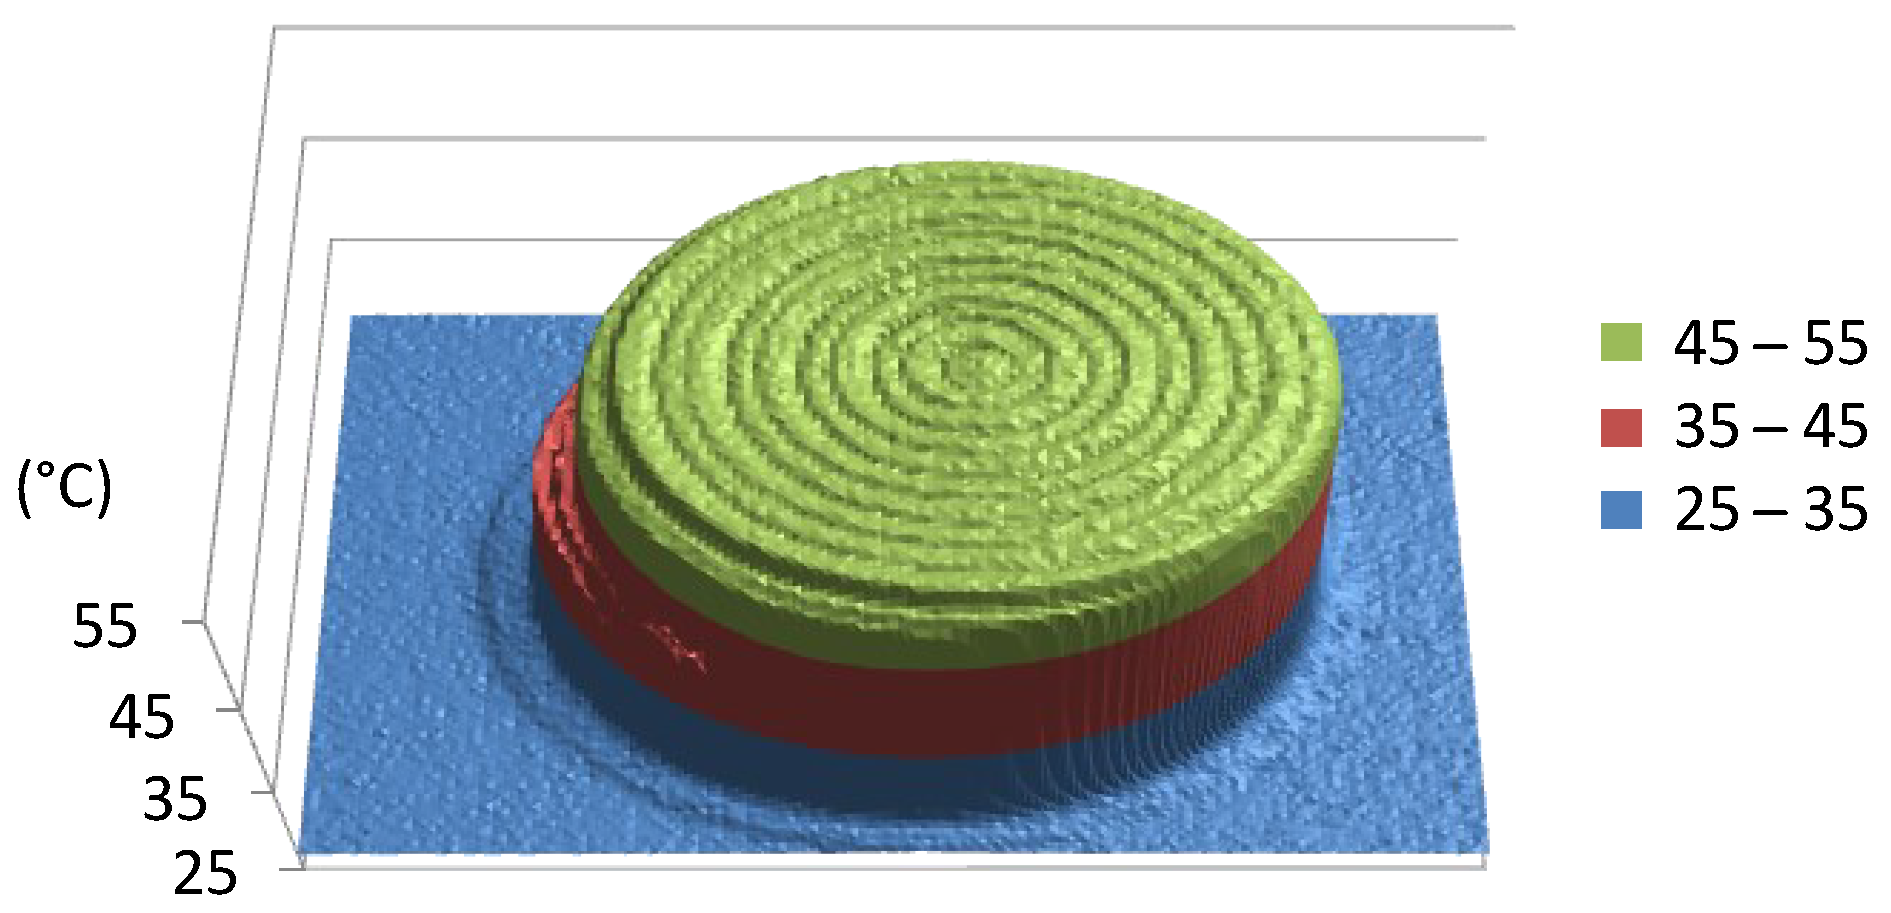
2.2.7. Generating Images from Radiometric Data

The data estimated in the previous subsection can be used to generate a thermogram not only in the original temperature range/scale but also in any desired temperature range to better understand the observed scene. First, the desired temperature range of the thermogram is defined as definedLowTempBoundary (defLTB) and definedHighTempBoundary (defHTB). Then, all values/temperatures above/below the defined threshold are set to low/high boundary. Finally, image pixel intensities are calculated according to Equation (6).
i m g P i x = e s t R a d D a t a d e f L T B · m a x P i x V a l m i n P i x V a l d e f H T B d e f L T B + m i n P i x V a l
where imgPix represents pixel intensities of a generated image (0–255), estRadData represents the estimated radiometric-data matrix, defLTB represents the defined low-temperature boundary, defHTB represents the defined high-temperature boundary, minPixVal represents the minimum intensity of a pixel in an output image (0), and maxPixVal represents the maximum intensity of a pixel in an output image (255).
In addition to the temperature range, the color map used to generate the image can also be changed to better understand the scene. Several examples of generated images are presented in Figure 17.

3. Results and Analysis of Radiometric Thermal Data

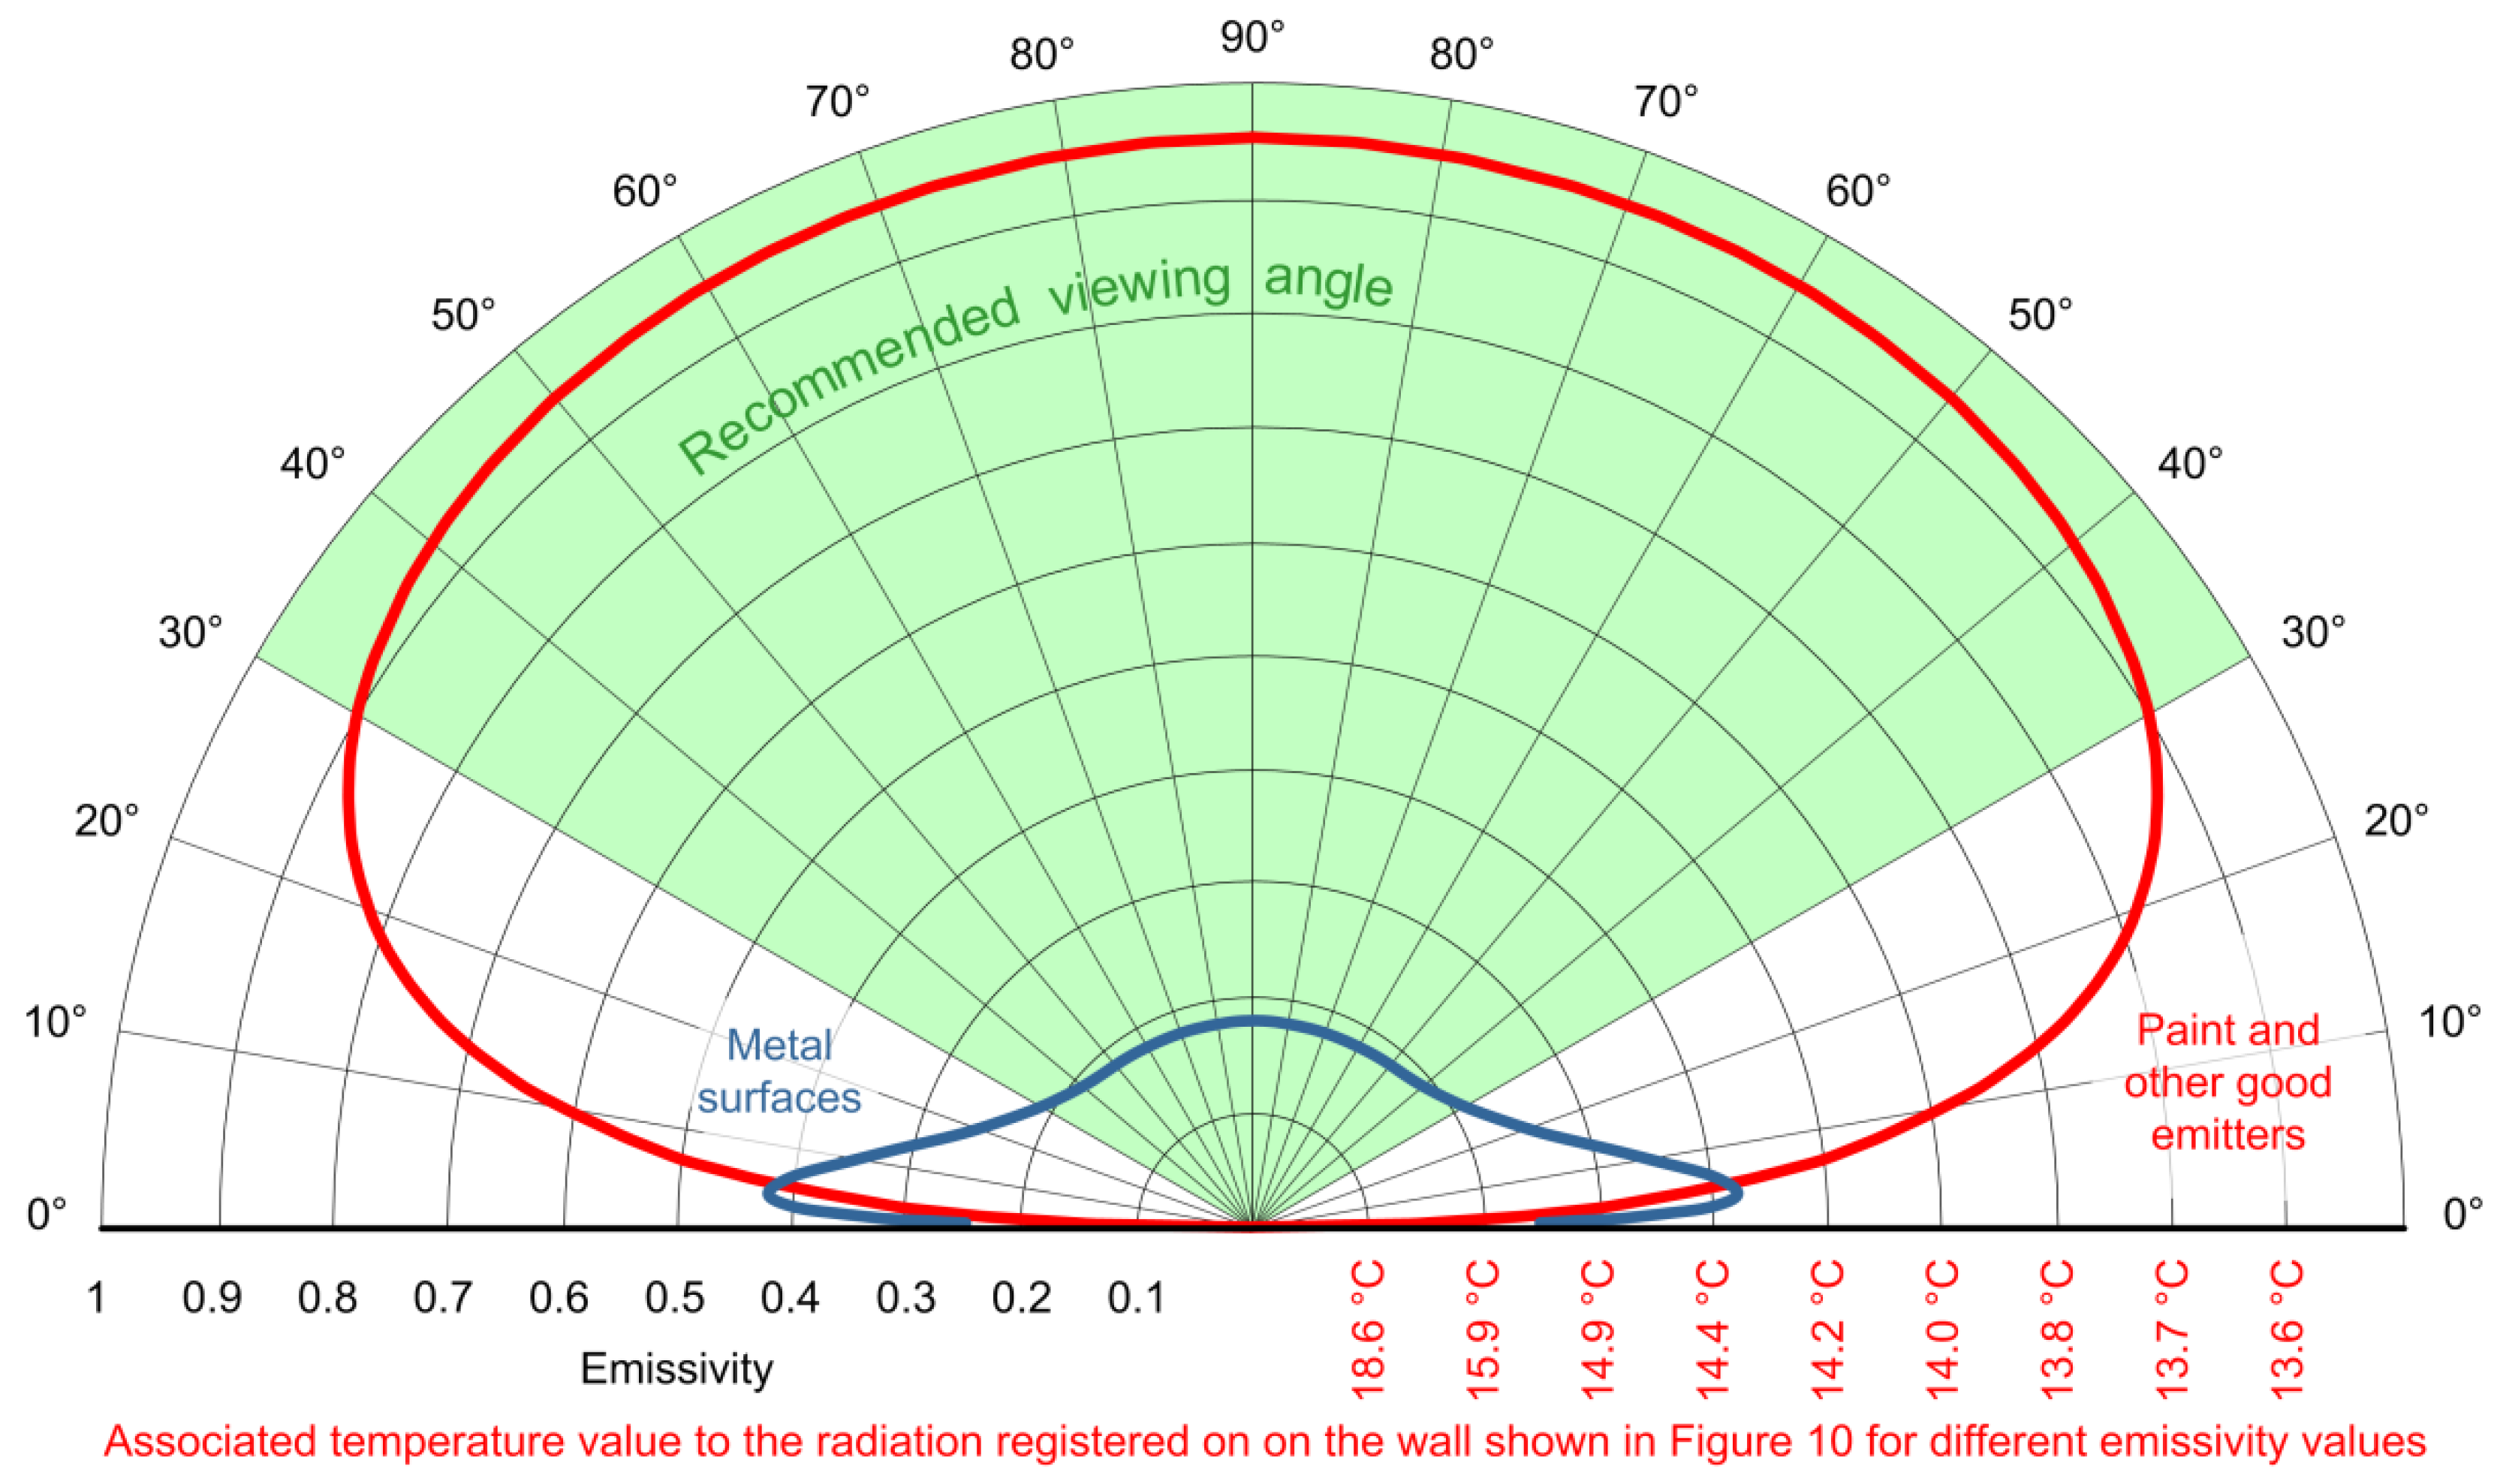
3.1. Influence of Emissivity on Radiometric Data

A developed system for proactive detection in data analysis relies on the accuracy of radiometric information. In the thermal part of the spectrum, the choice of the correct emissivity of the material plays the most important role for the determination of the real temperature value. In addition, the acquisition angle should not be neglected. Figure 18 shows the characteristic curve of the emissivity for color and good radiators in red and blue for shiny metals, which have a low emissivity. The green color indicates the angle of exposure recommended for thermographic analysis. The reason for this can be clearly seen in the behavior of the curves, which significantly change the values of the coefficients after 30°. An analysis of the sensitivity of the measurement result to different emissivity levels at a reflected ambient temperature of 13.5 °C shown in Figure 18 with the red temperature values was performed on the wall sample presented in Figure 15. We concluded that within the recommended acquisition angle of 120° the measurement error was less than 0.1 °C. A further deviation of the recording angle led to an error of 5 °C. It should be noted that the specified values for each thermogram differed considerably. There were no metal objects in the image, so an analysis of the blue emissivity characteristic of metals could not be performed. A detailed description of the directional spectral emissivity can be found in [41].

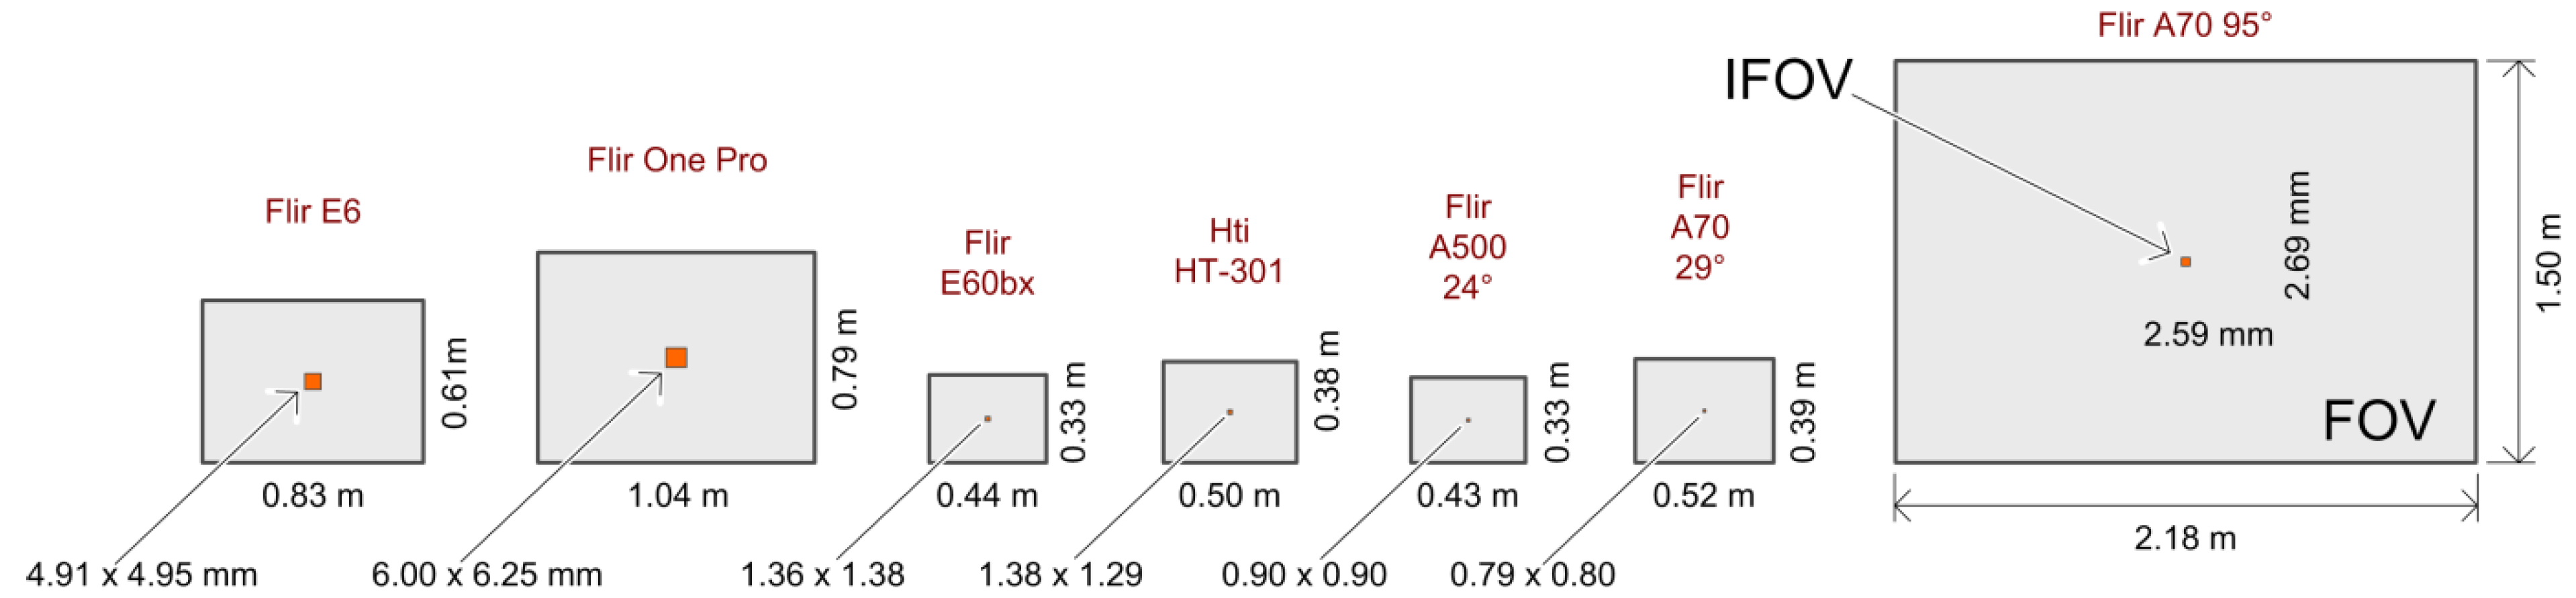
3.2. Basic Calibration When Using Several Different Cameras

Infrared thermal-imaging cameras represent a significant financial item in the overall project cost, and their price increases with resolution. Although the cost of a single pixel decreases [42], as seen in Figure 19, as resolution increases, the number of pixels increases, and so does the total cost of the camera sensor. To optimize the final product, it is planned to install a thermal-imaging camera, which is the optimum in terms of complexity of the space where the FireBot will patrol. The main technical parameters are field of view (FOV), spatial resolution (IFOV), thermal sensitivity/NETD, and accuracy in (°C) or (%) of the reading. Comparing the data from Figure 18 to the typical camera-accuracy value of ±2 °C or ±2%, we can see that the camera accuracy significantly affects the radiometric data.
The choice of camera affects the behavior of the system in which it is located. When developing an algorithm for temperature-anomaly detection using an IRT camera and the radiometric data provided by the camera, we consider that the data (temperatures) are correct or within the range of manufacturer-defined error. To ensure that these data are correct, all IRT cameras must be calibrated. Calibration is a process in which the infrared radiation that a camera detects is correlated with known temperatures. All cameras on the market are calibrated to factory specifications, but over time and due to the aging of electronics, a calibration shift is caused, and consequently, cameras produce inaccurate temperature measurements. Unfortunately, the owner of the camera cannot recalibrate the camera on their own but can determine the camera’s deviation for a certain measurement point with the help of a body with a known temperature. For that purpose, a blackbody source is used. A blackbody is a physical body with high emissivity, which means that it radiates and absorbs almost all electromagnetic radiation. The blackbody has a predefined range of temperatures it can achieve and, as such, can be used as a reference point for determining the camera’s accuracy. When talking about the manufacturer’s calibration, the correction table is directly saved in the camera’s firmware and automatically corrects camera readings, whereas in our case, the correction table was used to manually (or within our algorithm) correct detected temperatures. In this subsection, we used seven IRT cameras, presented in Table 3, and two blackbodies, presented in Table 4, to determine whether their accuracy was within the manufacturer’s margin of error and whether they can be used as such on FireBot for fast and efficient temperature-anomaly detection. All seven cameras were calibrated at seven temperature points, ranging from 27 °C to 45 °C with a 3 °C step in between. This range was chosen because it represents the temperature interval in the range of increased latent hazards, such as passive consumption of electrical equipment when overheated and triggering fire hazards. Increasingly higher temperature values automatically become an area of interest and further analysis due to their height and temperature difference relative to the environment. All measurements were repeated 10 times and the results were expressed as average values. For this reason, the values in the tables are expressed in two decimal places. It is important to note that raw camera data can be downloaded to three decimal places.
It is difficult to compare the characteristics of the cameras listed in the Table 3 from the point of view of image analysis if the parameters FOI and IFOV are not taken into account. In Figure 20 a comparison can be seen of the size of the thermogram when the cameras were 1 m away from the object to be imaged. In the middle, the field of view of the unit sensor of the IFOV sensor can be seen and compared. From this, we can conclude that in order to achieve nominal accuracy, it is important that the IFOV completely cover the area where the analyzed object is located. Furthermore, we can see that for certain applications where it is important to see a large area in a small space, the resolution itself is not as important as the optics of the camera, i.e., the angle that the camera captures.
In addition to the infrared thermal imagers listed in Table 3, two pyrometers were also used in the calibration. The reason for this was to investigate the possibility of using a pyrometer as an additional support for a targeted temperature measurement at any point exposed to a temperature outside the temperature range of thermal imagers due to fire. Compared to thermal-imaging cameras, pyrometers are inexpensive, widely available, and easy to integrate into a system. The first was the Raytek RAYMX2D with a temperature range of −30 °C to 900 °C and a measurement error of ±1 °C or ±1% of the reading; the other was the Parkside PTIA 1 with a temperature range of −50 °C to 380 °C and a measurement error of ±1.5 °C. Two different blackbodies were used during the calibration process, and their specifications are listed in Table 4.
The reason for this is thermal inertia and the time required to reach a steady state. Five hours of effective labor and two people were required to calibrate nine devices. The instruments were divided into two groups depending on the angle of the optics, paying attention to possible sources of reflected radiation and the influence of the operator. Figure 21 shows a blackbody Voltcraft IRS-350 with a set temperature value of 50 °C (green diodes) and a current value of 44.9 °C (red diodes). The active area where the camera calibration is performed is shown in red in the thermogram. The calibration process is performed when the blackbody enters a steady state. For this reason, we decided to perform the calibration in seven values, from 27 °C to 45 °C, with a step of 3 °C, which is the first larger amount compared to the specified measurement uncertainty of the camera. The specified interval covers the values for early detection of hotspots, where accuracy and precision are important. Higher temperature values quickly become noticeable, and the detection algorithm had no problems with them.
Using the raw data, Figure 22 shows the detailed temperature distribution on the active surface of another blackbody whose surface is not flat, unlike the Voltcraft. The image shows a maximum value of 50.774 °C, a minimum value of 50.006 °C, and an average value of 50.41068 °C, which was indicated on the display with a value of 50.4 °C.
In Figure 22, a circular area can be seen with slight deviations in temperature, which were not real or physically possible. This is a result of the surface geometry, which, due to the different emissivity of individual circle areas, resulted in different emissivities and different amounts of radiation while the blackbody had a steady temperature-value camera presenting slight differences in temperature values. We can conclude that the camera does not measure temperature but registers infrared radiation, based on which the temperature values are assigned in accordance with the calibration data. In addition to the changes in geometry, a change in a surface emissivity is also possible and occurs in practice (degradation in paint due to the sunlight UV exposure or partial surface oxidation). In order to take into account all influences on the measurement uncertainty of the results, the camera displays temperature values with one decimal place. During the measurement, it was necessary for the spatial resolution IFOV (Instantaneous Field of View), i.e., the viewing angle of a single pixel of the sensor, be completely within the range of the reference surface. Figure 23 shows the maximum distance the camera could be from the blackbody for the measurement to be accurate. The maximum distance of the camera was compared with the field of view (FOV) that the camera would have at the specified distance, depending on its resolution.
In the measurement, we tried to fill the frame as much as possible with the active element of the blackbody to make it easier to determine the mean, as shown in Figure 23. To determine the mean value, it was not enough to read 10 different readings from the camera, and it was necessary to change the camera for each measurement so that the fluctuations of the temperature of the blackbodies were reduced to a minimum when determining the mean value. Table 5 shows the mean values of the measurements made according to the indicated procedure.

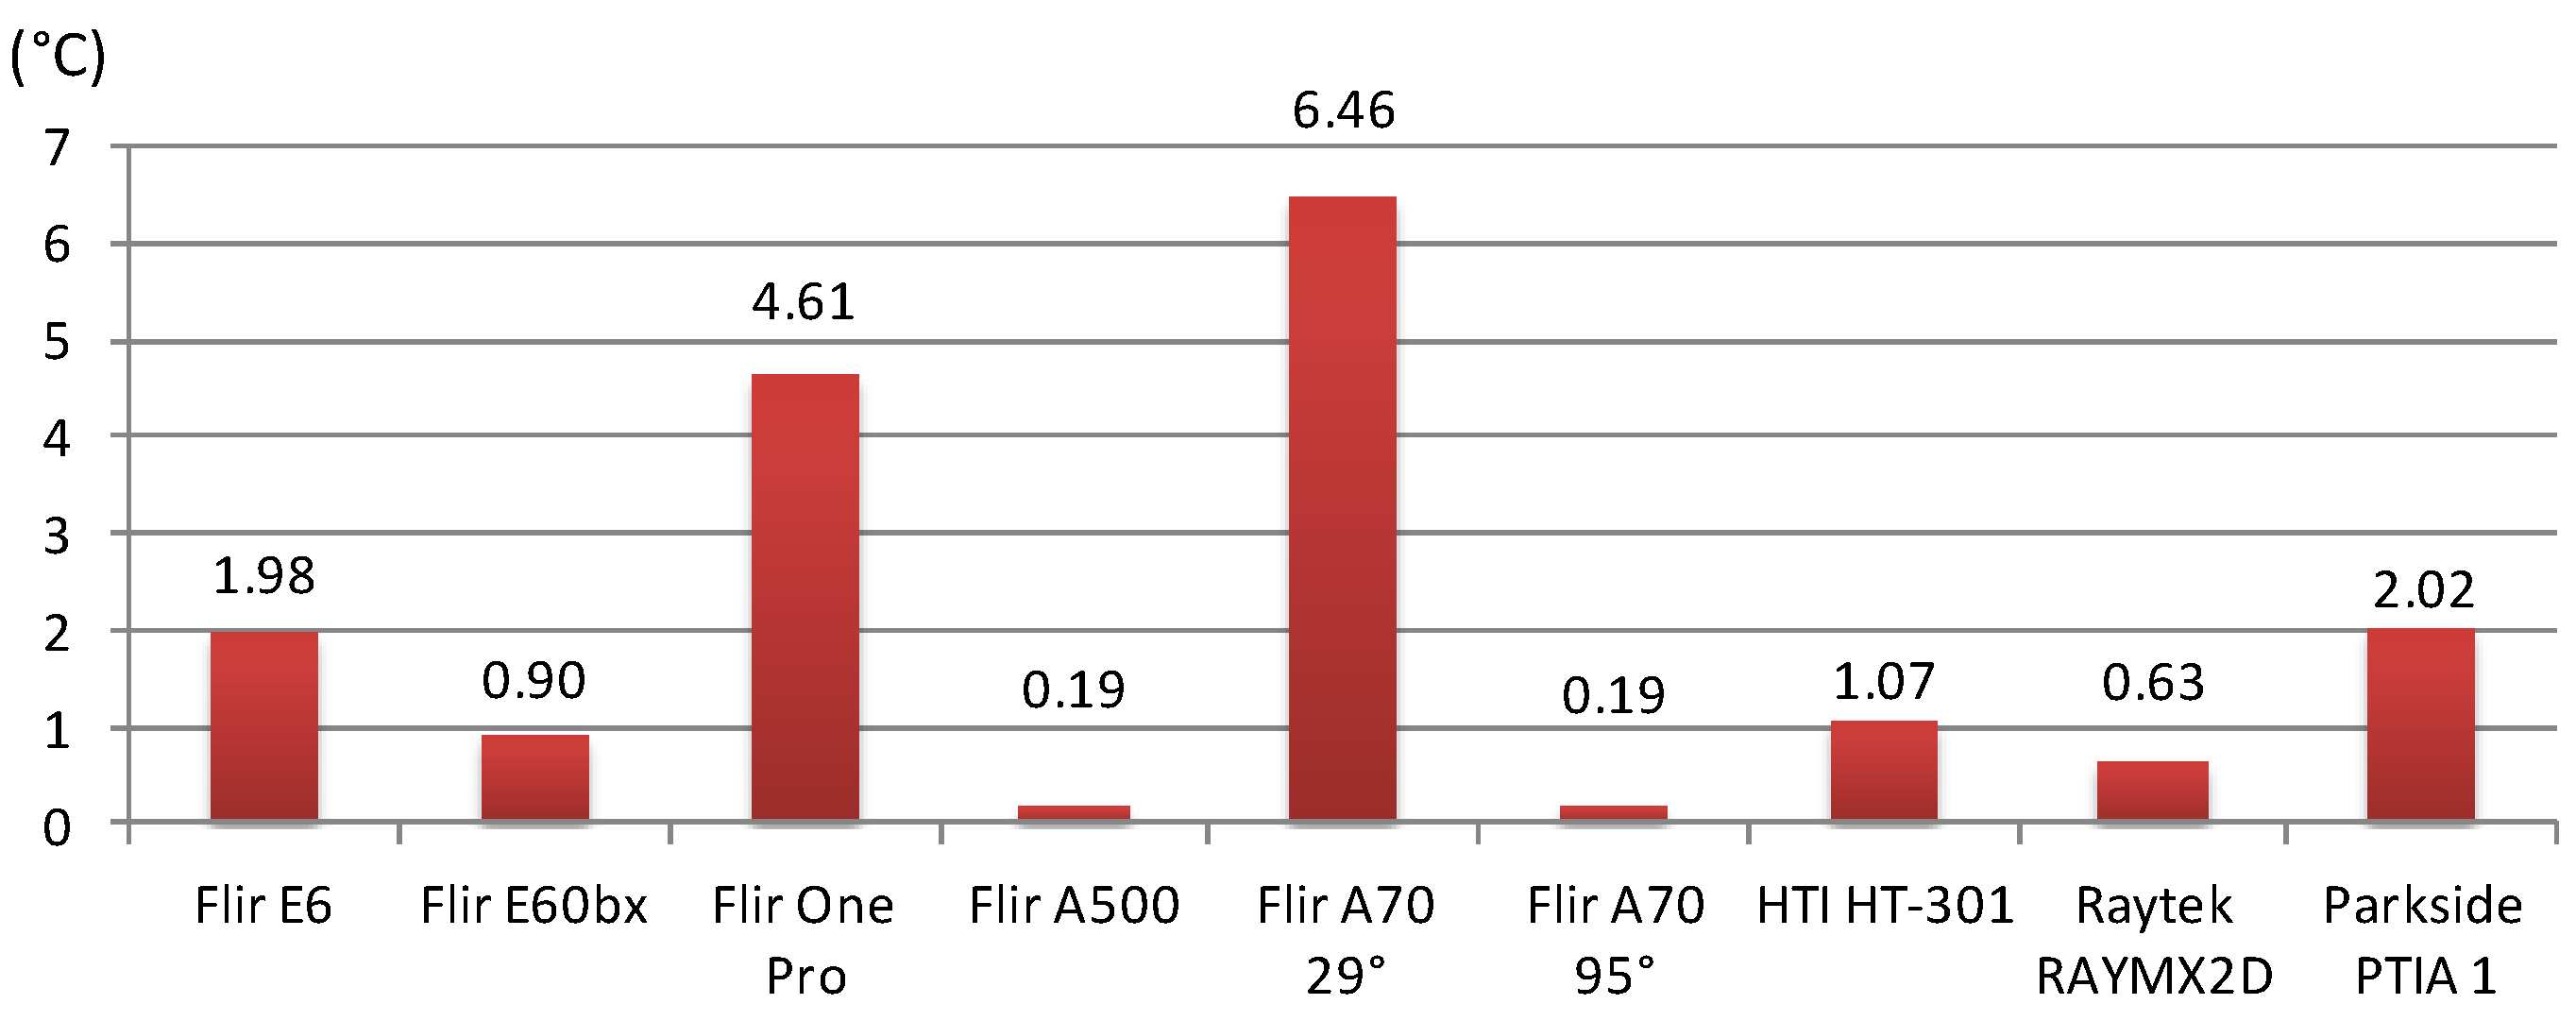
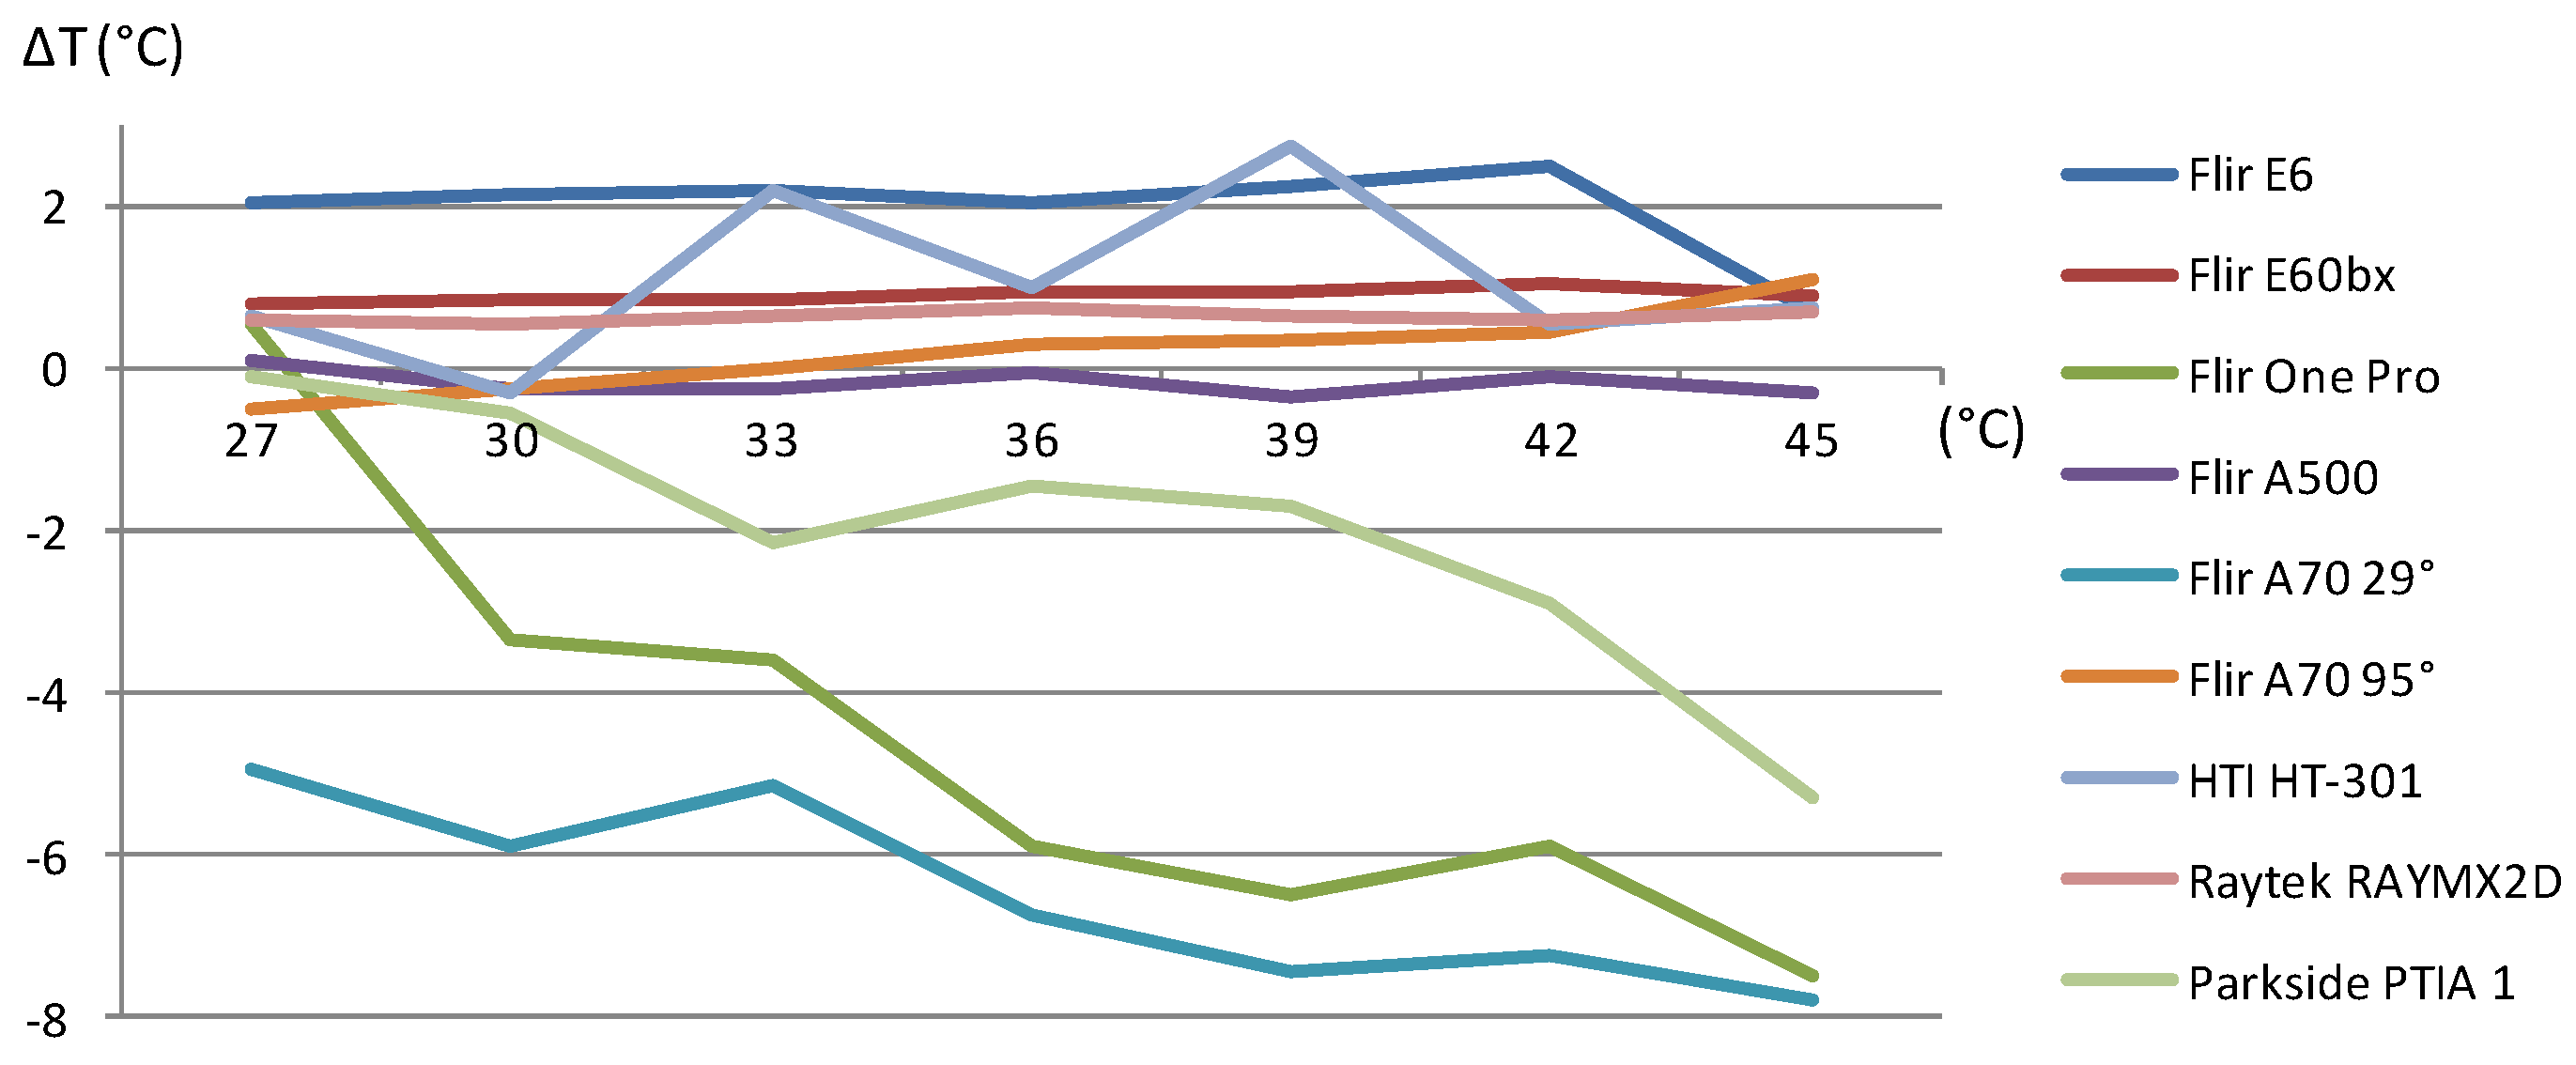
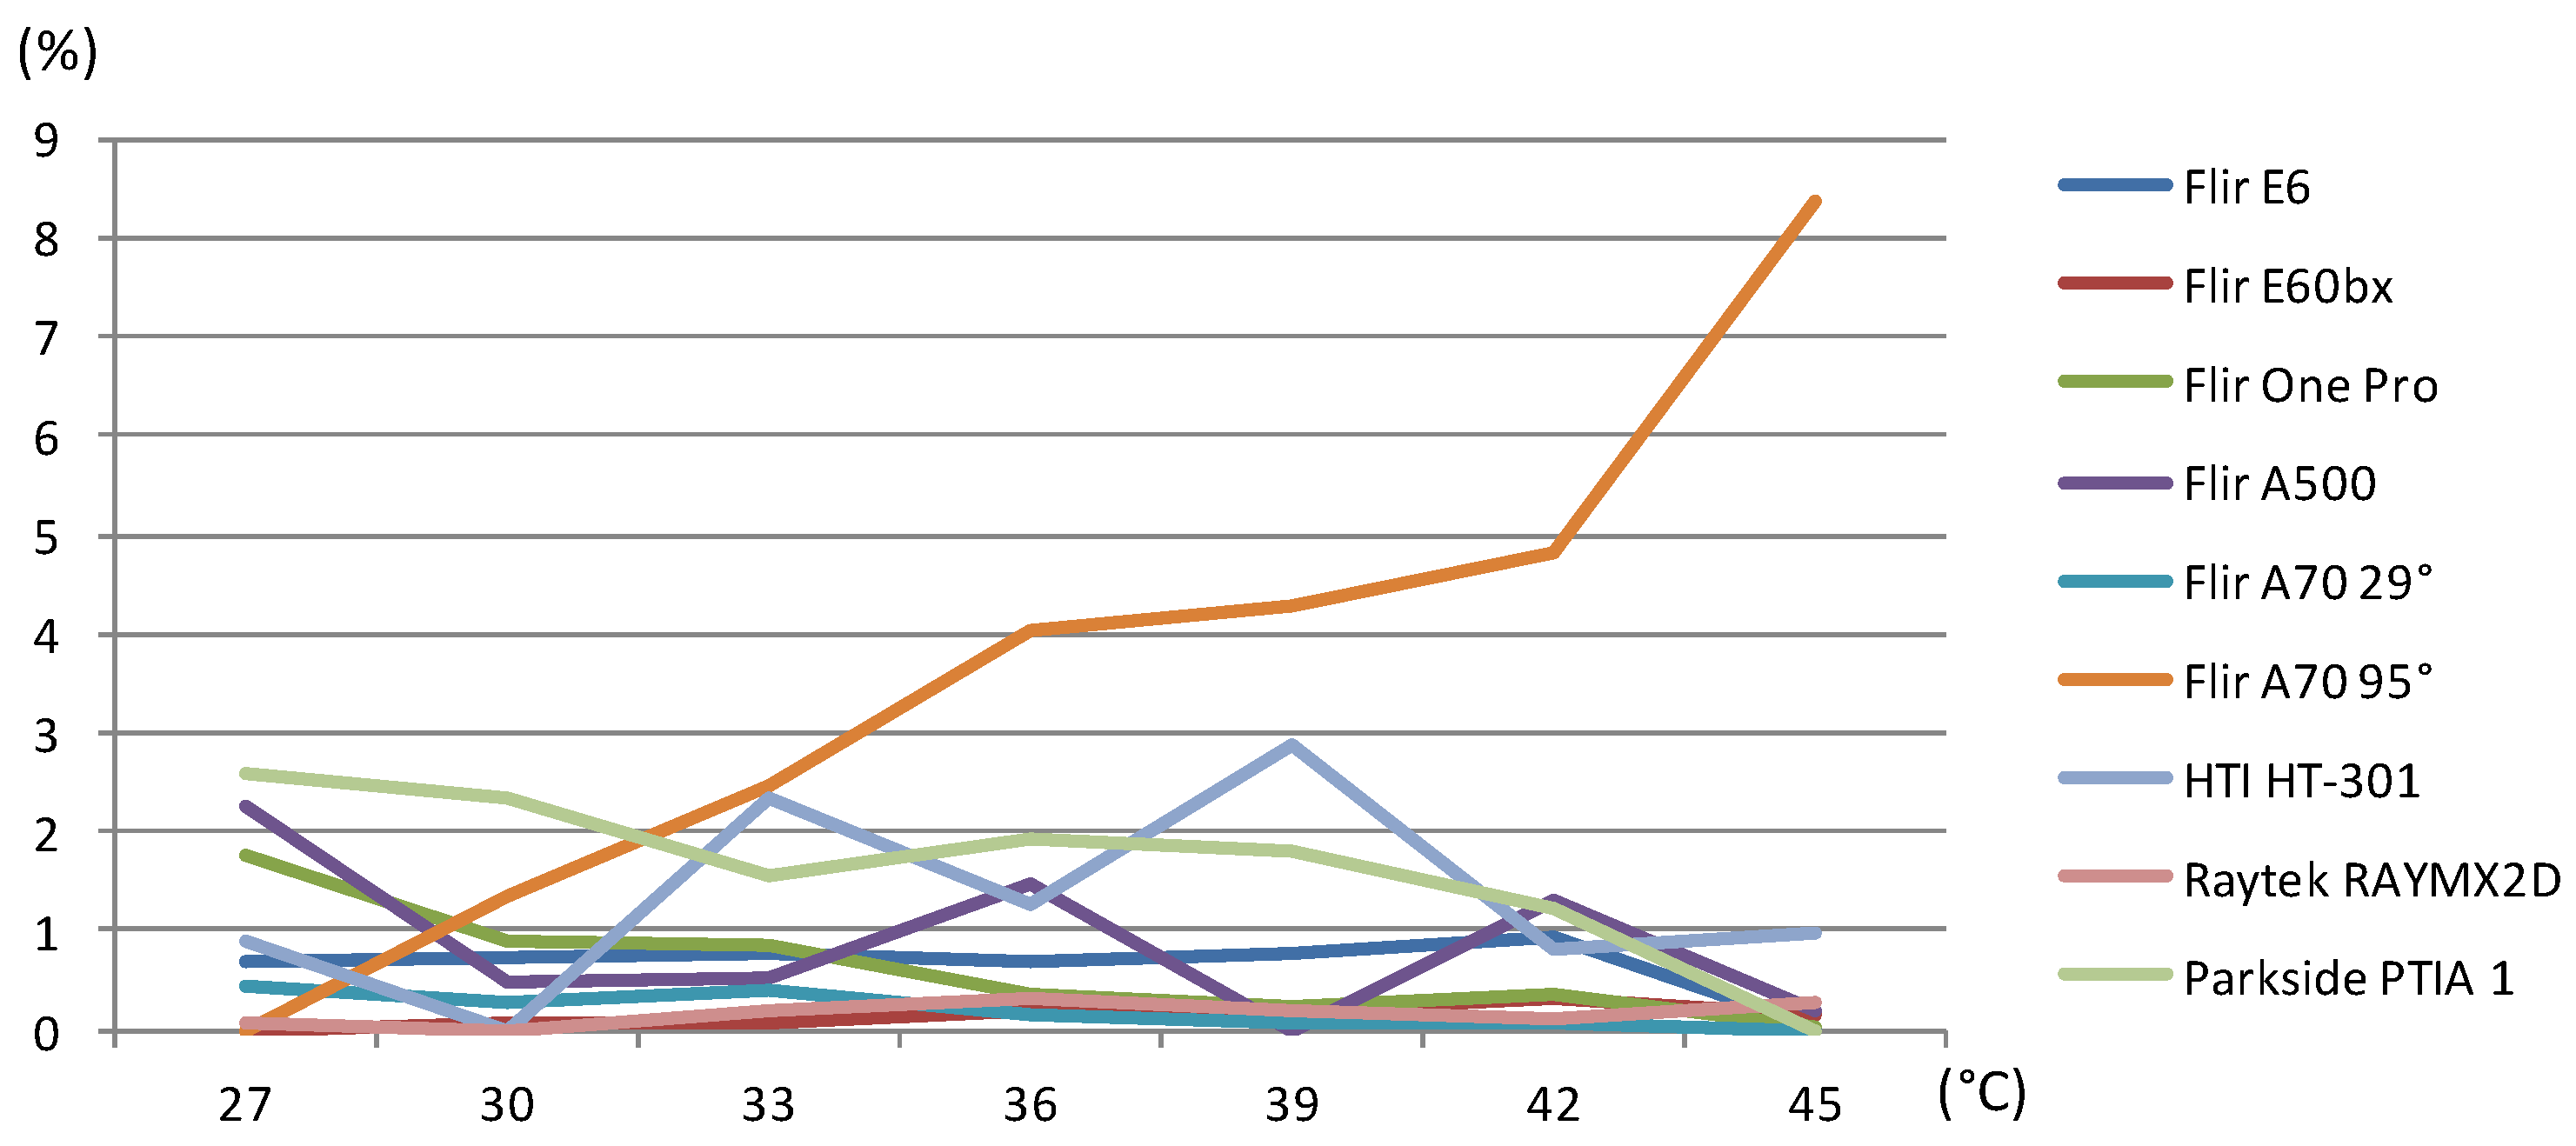
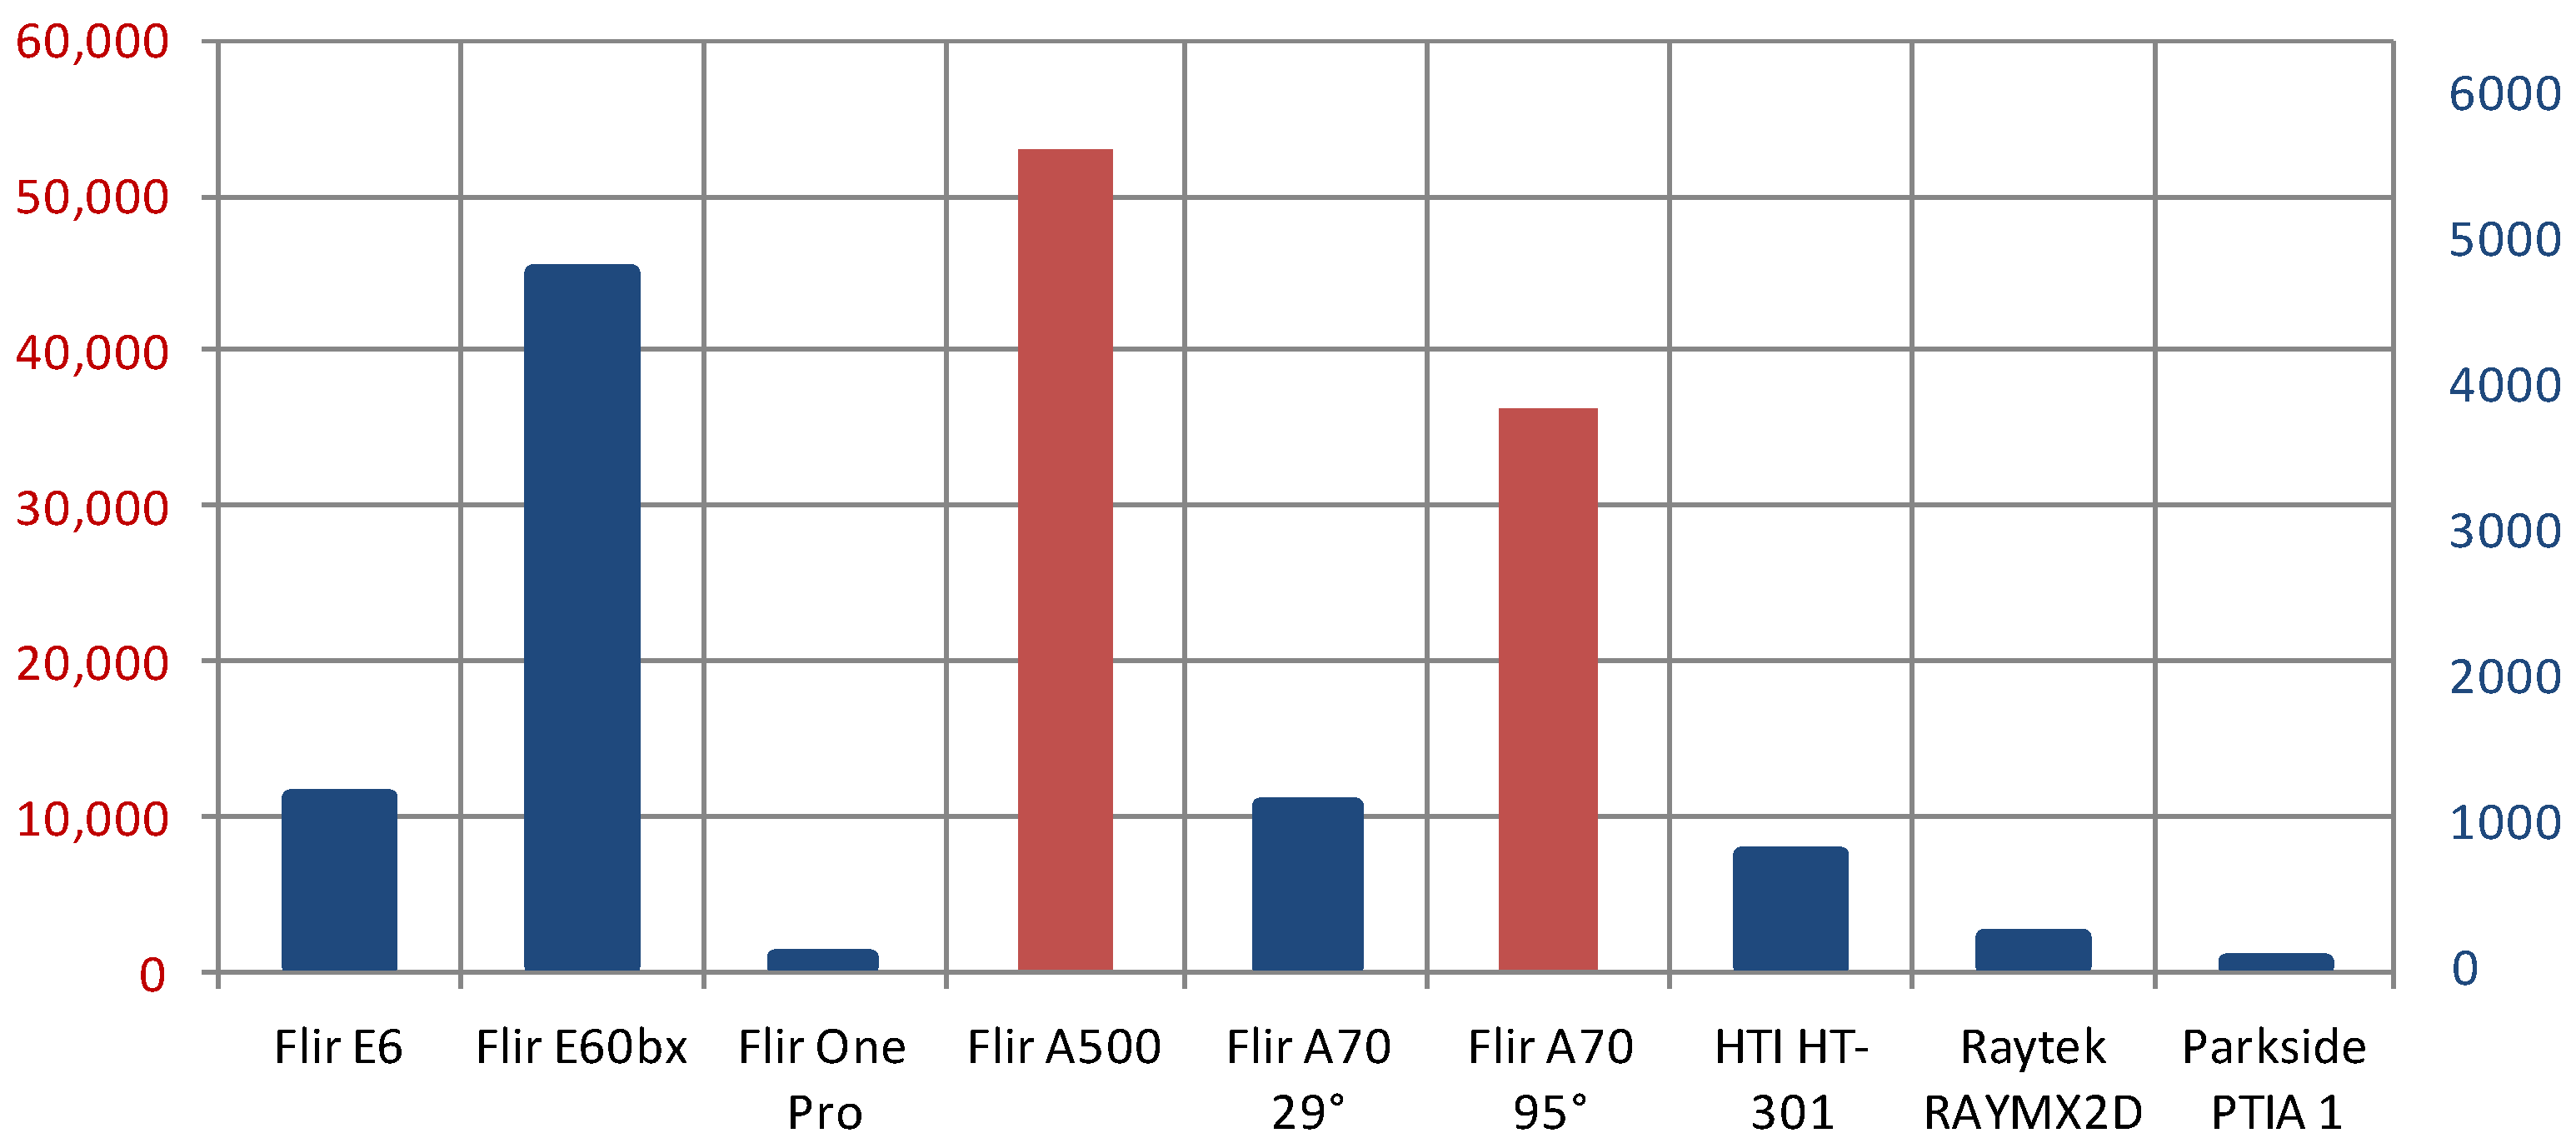
3.3. Analysis of Measurement Result Deviations

There are two basic approaches to analyzing thermographic records. One is to determine the highest temperature that the object under study can withstand. In our case, we were dealing with temperatures as high as 90 °C, which most structural- and electrical-insulating materials must withstand for a short period of time. The second approach is to determine the temperature difference between two identical objects, i.e., between a correct and an incorrect one, and to decide, based on the magnitude of the temperature difference, which method and time interval should be used to respond to the observed anomaly. It should always be kept in mind that an infrared thermal imager does not measure temperature but registers radiation. The deviation of the calibration data from the reference temperature represents an indication of correctness if all recording parameters have been entered correctly. Table 6 shows the deviations in °C and has been expanded to include information on average camera prices so that the accuracy data can be correlated with financial indicators.
If the mean value of the deviation for the individual devices is plotted, a comparison can be made with the data from Table 3. From Figure 24, it is clear that the Flir A70 (Teledyne FLIR LLC, Wilsonville, Oregon, USA) with a lens angle of 29° was not correctly factory calibrated and it is not suitable for further use. The Flir One Pro showed a deviation from the nominal accuracy of 34%, but considering the price and the purpose, which is primarily qualitative, we cannot consider it to be deficient. When the data from Table 6 were put into a graphical form, as shown in Figure 25, it was possible to clearly distinguish the cameras that were accurate and precise in terms of accuracy over the entire temperature range of the calibration.
Going one step further and analyzing the percent deviation from the mean of the deviation for each temperature, as shown in Figure 26, can lead to a false conclusion, as the most accurate camera showed an increase in deviation as the temperature increased. The above procedure can still be useful when analyzing cameras with similar characteristics, which can be seen from the characteristics of the cameras that were below 1% deviation in the class.
From Table 6 and Figure 26 it is evident that it was necessary to perform the laboratory factory calibration of the Flir A70 29° camera, whose deviation of 3.23 times greater than the specified accuracy designation indicates that factory calibration was necessary. From the above, there was a need to introduce an indicator that links the accuracy and price range of each camera. Figure 27 shows the numerical value of the price ratio in relation to the mean temperature deviation. It is expressed in USD per °C. The two cameras shown in red justified the investment’s accuracy, as determined by the calibration procedure. We left the Flir A70 29° for comparison, although we concluded that said camera is not to be used. By further analysis of the calculated indicator, it was concluded that a simple indicator that valorizes the possibility of using the optimal camera is not applicable in this case, but the decision to choose a camera must be determined by the technical characteristics of the individual application, taking into account the need for details and the need for accuracy and indicators within a narrow group of similar characteristics. The aforementioned analysis must not be performed until the minimum resolution and accuracy of the camera installed in the FireBot have been determined for the exact application, since the investment optimum must be taken into account.

4. Conclusions

Obtaining calibration data for infrared thermal-imaging cameras for implementation in the FireBot autonomous fire protection robotic system represents the starting point for optimizing the algorithm for detecting anomalies that may lead to the development of a fire. The proposed algorithm provides a clear insight into the operational performance of a self-driving autonomous solution. The proposed FireBot system-architecture diagram provides insight into the complex structure and a detailed approach for realizing the optimal technical solution. Accordingly, special emphasis is placed on the detection of the excitation maximum, which can be detected in the early phase of the anomaly. Infrared thermography was prescribed as the solution. Although this is a widely used method of non-destructive testing, the price of cameras increases significantly with increasing resolution and detection accuracy. In order to select the optimal camera, a blackbody calibration procedure must be performed. The calibration procedure indicated a defective camera and provided the necessary indicators for optimal selection depending on the complexity and specific characteristics of the space under investigation. The procedure itself and the observation of a defective camera led to the conclusion that, regardless of the specifications, camera calibration must be performed before installation in FireBot to ensure control over the installed component in addition to correcting the input data. In addition, this procedure enables faulty cameras that do not comply with factory specifications to be detected, as shown in the example of one camera analyzed in this paper.

Author Contributions

Conceptualization, J.B., H.G. and K.V.; methodology, J.B., K.V. and H.G.; software, K.V., J.B. and H.G.; validation, K.V., J.B. and J.J.; formal analysis, J.B., H.G. and K.V.; investigation, H.G., K.V., J.B. and J.J.; resources, K.V. and J.J.; data curation, K.V., H.G. and J.B.; writing—original draft preparation, K.V., H.G. and J.B.; writing—review and editing, J.B., K.V. and J.J.; visualization, J.B., H.G. and K.V.; supervision, J.B.; funding acquisition, J.B. All authors have read and agreed to the published version of the manuscript.

Funding

This work is supported by the project “Research and development of autonomous robotic fire extinguisher for prevention, early detection and fire extinguishing” under grant KK.01.2.1.02 co-financed by the European Union from the European Regional Development Fund within the Operational Programme Competitiveness and Cohesion 2014–2020 of the Republic of Croatia.

Institutional Review Board Statement

Not applicable.

Informed Consent Statement

Not applicable.

Data Availability Statement

Data are available on request from the authors.

Acknowledgments

The authors thank the editors and anonymous reviewers for their valuable comments. The authors also thank NVIDIA and Teledyne FLIR for hardware support and recognizing our work.

Conflicts of Interest

The authors declare no conflict of interest.

References

  1. Roldán-Gómez, J.J.; González-Gironda, E.; Barrientos, A. A Survey on Robotic Technologies for Forest Firefighting: Applying Drone Swarms to Improve Firefighters’ Efficiency and Safety. Appl. Sci. 2021, 11, 363. [Google Scholar] [CrossRef]
  2. Smart Robots for Fire-Fighting. A Report Encapsulating the Secondary Research and Findings from the Survey to Inform the Database of WP2–Literature Survery; European Commission: Maastricht, The Netherlands, 2018.
  3. Liu, P.; Yu, H.; Cang, S.; Vladareanu, L. Robot-Assisted Smart Firefighting and Interdisciplinary Perspectives. In Proceedings of the 2016 22nd International Conference on Automation and Computing (ICAC), Colchester, UK, 7–8 September 2016; pp. 395–401. [Google Scholar] [CrossRef]
  4. Tan, C.F.; Liew, S.M.; Alkahari, M.R.; Ranjit, S.S.S.; Said, M.R.; Chen, W.; Sivakumar, D. Fire Fighting Mobile Robot: State of the Art and Recent Development. Aust. J. Basic Appl. Sci. 2013, 7, 220–230. [Google Scholar]
  5. Khoon, T.N.; Sebastian, P.; Saman, A.B.S. Autonomous Fire Fighting Mobile Platform. Procedia Eng. 2012, 41, 1145–1153. [Google Scholar] [CrossRef]
  6. AlHaza, T.; Alsadoon, A.; Alhusinan, Z.; Jarwali, M.; Alsaif, K. New Concept for Indoor Fire Fighting Robot. Procedia Soc. Behav. Sci. 2015, 195, 2343–2352. [Google Scholar] [CrossRef] [Green Version]
  7. Varghese, S.; Paul, A.; George, B.; M.A., F.; Warier, S. Design and Fabrication of Fire Fighting Robotic Arm for Petrochemical Industries. Int. J. Ind. Eng. 2018, 5, 14–17. [Google Scholar] [CrossRef] [Green Version]
  8. Imdoukh, A.; Shaker, A.; Al-Toukhy, A.; Kablaoui, D.; El-Abd, M. Semi-Autonomous Indoor Firefighting UAV. In Proceedings of the 2017 18th International Conference on Advanced Robotics (ICAR), Hong Kong, China, 10–12 July 2017; pp. 310–315. [Google Scholar] [CrossRef]
  9. Kinaneva, D.; Hristov, G.; Raychev, J.; Zahariev, P. Early Forest Fire Detection Using Drones and Artificial Intelligence. In Proceedings of the 2019 42nd International Convention on Information and Communication Technology, Electronics and Microelectronics (MIPRO), Opatija, Croatia, 20–24 May 2019; pp. 1060–1065. [Google Scholar] [CrossRef]
  10. Spurny, V.; Pritzl, V.; Walter, V.; Petrlik, M.; Baca, T.; Stepan, P.; Zaitlik, D.; Saska, M. Autonomous Firefighting Inside Buildings by an Unmanned Aerial Vehicle. IEEE Access 2021, 9, 15872–15890. [Google Scholar] [CrossRef]
  11. Nii, D.; Namba, M.; Harada, K.; Matsuyama, K.; Tanaka, T. Application of Common-Use Temperature Sensors to Early Fire Detection. In Proceedings of the 11th Asia-Oceania Symposium on Fire Science and Technology, Taipei, Taiwan, 21–25 October 2018; Springer: Singapore, 2018. [Google Scholar] [CrossRef]
  12. Wu, Q.; Gong, L.-X.; Li, Y.; Cao, C.-F.; Tang, L.-C.; Wu, L.; Zhao, L.; Zhang, G.-D.; Li, S.-N.; Gao, J.; et al. Efficient Flame Detection and Early Warning Sensors on Combustible Materials Using Hierarchical Graphene Oxide/Silicone Coatings. ACS Nano 2018, 12, 416–424. [Google Scholar] [CrossRef] [PubMed]
  13. Erden, F.; Toreyin, B.U.; Soyer, E.B.; Inac, I.; Gunay, O.; Kose, K.; Cetin, A.E. Wavelet Based Flickering Flame Detector Using Differential PIR Sensors. Fire Saf. J. 2012, 53, 13–18. [Google Scholar] [CrossRef] [Green Version]
  14. Fonollosa, J.; Solórzano, A.; Marco, S. Chemical Sensor Systems and Associated Algorithms for Fire Detection: A Review. Sensors 2018, 18, 553. [Google Scholar] [CrossRef] [PubMed] [Green Version]
  15. Sharma, J.; Granmo, O.-C.; Goodwin, M.; Fidje, J.T. Deep Convolutional Neural Networks for Fire Detection in Images. Proc. Int. Conf. Eng. Appl. Neural Netw. 2017, 744, 183–193. [Google Scholar] [CrossRef]
  16. Barmpoutis, P.; Dimitropoulos, K.; Kaza, K.; Grammalidis, N. Fire Detection from Images Using Faster R-CNN and Multidimensional Texture Analysis. In Proceedings of the International Conference on Acoustics, Speech and Signal Processing (ICASSP 2019), Brighton, UK, 12–17 May 2019; pp. 8301–8305. [Google Scholar] [CrossRef]
  17. Li, P.; Zhao, W. Image Fire Detection Algorithms Based on Convolutional Neural Networks. Case Stud. Therm. Eng. 2020, 19, 100625. [Google Scholar] [CrossRef]
  18. Muhammad, K.; Ahmad, J.; Mehmood, I.; Rho, S.; Baik, S.W. Convolutional Neural Networks Based Fire Detection in Surveillance Videos. IEEE Access 2018, 6, 18174–18183. [Google Scholar] [CrossRef]
  19. Li, Y.; Du, X.; Wan, F.; Wang, X.; Yu, H. Rotating Machinery Fault Diagnosis Based on Convolutional Neural Network and Infrared Thermal Imaging. Chin. J. Aeronaut. 2020, 33, 427–438. [Google Scholar] [CrossRef]
  20. Kim, J.S.; Choi, K.N.; Kang, S.W. Infrared Thermal Image-Based Sustainable Fault Detection for Electrical Facilities. Sustainability 2021, 13, 557. [Google Scholar] [CrossRef]
  21. Haider, M.; Doegar, A.; Verma, R.K. Fault Identification in Electrical Equipment Using Thermal Image Processing. In Proceedings of the 2018 International Conference on Computing, Power and Communication Technologies (GUCON), Greater Noida, Uttar Pradesh, India, 28–29 September 2018; pp. 853–858. [Google Scholar] [CrossRef]
  22. Labbe, M.; Michaud, F. RTAB-Map as an open-source lidar and visual simultaneous localization and mapping library for large-scale and long-term online operation. J. Field Robot. 2019, 36, 416–446. [Google Scholar] [CrossRef]
  23. Balen, J.; Damjanovic, D.; Maric, P.; Vdovjak, K.; Arlovic, M. FireBot–An Autonomous Surveillance Robot for Fire Prevention, Early Detection and Extinguishing. In Proceedings of the Future of Information and Communication Conference (FICC) 2023, Virtual, San Francisco, CA, USA, 2–3 March 2023. [Google Scholar]
  24. Orglmeister, A. Early Fire Detection and Automatic Extinguishing in Waste-to-Energy Power Plants and Waste Treatment Plants, Waste Management. In Waste-to-Enery; Thomé-Kozmiensky, K.J., Thiel, S., Thomé-Kozmiensky, E., Winter, F., Juchelková, D., Eds.; TK Verlag Karl Thomé-Kozmiensky: Neuruppin, Germany, 2017; Volume 7, ISBN 978-3-944310-37-4. [Google Scholar]
  25. He, K.; Zhang, X.; Ren, S.; Sun, J. Deep Residual Learning for Image Recognition. In Proceedings of the 2016 IEEE Conference on Computer Vision and Pattern Recognition (CVPR), Las Vegas, NV, USA, 27–30 June 2016; pp. 770–778. [Google Scholar] [CrossRef] [Green Version]
  26. Howard, A.; Sandler, M.; Chu, G.; Chen, L.-C.; Chen, B.; Tan, M.; Wang, W.; Zhu, Y.; Pang, R.; Vasudevan, V.; et al. Searching for MobileNetV3. In Proceedings of the 2019 IEEE/CVF International Conference on Computer Vision (ICCV), Seoul, Republic of Korea, 27 October–2 November 2019; pp. 1314–1324. [Google Scholar]
  27. Tan, M.; Le, Q.V. EfficientNet: Rethinking Model Scaling for Convolutional Neural Networks. In Proceedings of the 36th International Conference on Machine Learning, Long Beach, CA, USA, 10–15 June 2019; Volume 97, pp. 6105–6114. [Google Scholar]
  28. Vdovjak, K.; Maric, P.; Balen, J.; Grbic, R.; Damjanovic, D.; Arlovic, M. Modern CNNs Comparison for Fire Detection in RGB Images. In Proceedings of the 17th International Conference on Machine Learning and Data Mining MLDM 2022, New York, NY, USA, 16–21 July 2022. [Google Scholar]
  29. Ronneberger, O.; Fischer, P.; Brox, T. U-Net: Convolutional Networks for Biomedical Image Segmentation. In Proceedings of the 18th International Conference on Medical Image Computing and Computer-Assisted Intervention (MICCAI), Munich, Germany, 5–9 October 2015; pp. 234–241. [Google Scholar] [CrossRef] [Green Version]
  30. Redmon, J.; Divvala, S.; Girshick, R.; Farhadi, A. You Only Look Once: Unified, Real-Time Object Detection. In Proceedings of the 2016 IEEE Conference on Computer Vision and Pattern Recognition (CVPR), Las Vegas, NV, USA, 27–30 June 2016; pp. 779–788. [Google Scholar] [CrossRef] [Green Version]
  31. Redmon, J.; Farhadi, A. YOLO9000: Better, Faster, Stronger. In Proceedings of the 2017 IEEE Conference on Computer Vision and Pattern Recognition (CVPR), Honolulu, HI, USA, 21–26 July 2017; pp. 6517–6525. [Google Scholar] [CrossRef] [Green Version]
  32. Redmon, J.; Farhadi, A. YOLOv3: An Incremental Improvement. arXiv 2018. [Google Scholar] [CrossRef]
  33. Bochkovskiy, A.; Wang, C.-Y.; Liao, H.-Y.M. YOLOv4: Optimal Speed and Accuracy of Object Detection. arXiv 2020. [Google Scholar] [CrossRef]
  34. Lin, T.-Y.; Maire, M.; Belongie, S.; Hays, J.; Perona, P.; Ramanan, D.; Dollar, P.; Zitnick, L. Microsoft COCO: Common Objects in Context. In Proceedings of the European Conference on Computer Vision (ECCV), Zurich, Switzerland, 6–12 September 2014; European Conference on Computer Vision. pp. 740–755. [Google Scholar]
  35. Everingham, M.; van Gool, L.; Williams, C.K.I.; Winn, J.; Zisserman, A. The Pascal Visual Object Classes (VOC) Challenge. Int. J. Comput. Vis. 2010, 88, 303–338. [Google Scholar] [CrossRef] [Green Version]
  36. Russell, B.C.; Torralba, A.; Murphy, K.P.; Freeman, W.T. LabelMe: A Database and Web-Based Tool for Image Annotation. Int. J. Comput. Vis. 2008, 77, 157–173. [Google Scholar] [CrossRef]
  37. Sekachev, B.; Manovich, N.; Zhavoronkov, A. Computer Vision Annotation Tool: A Universal Approach to Data Annotation. 2019. Available online: https://github.com/opencv/cvat (accessed on 23 February 2022).
  38. Skalski, P. Make Sense. 2019. Available online: https://github.com/SkalskiP/make-sense (accessed on 25 February 2022).
  39. Maric, P.; Arlovic, M.; Balen, J.; Vdovjak, K.; Damjanovic, D. A Large Scale Dataset For Fire Detection and Segmentation in Indoor Spaces. In Proceedings of the 2nd International Conference on Electrical, Computer, Communications and Mechatronics Engineering (ICECCME), Maldives, 16–18 November 2022. [Google Scholar]
  40. Vdovjak, K.; Maric, P.; Balen, J.; Glavas, H. Radiometric Data Estimation Using Thermogram and Comparison to the Data Provided by the Camera. In Proceedings of the 16th conference on Quantitative Infrared Thermography, Paris, France, 4–8 July 2022; pp. 440–446. [Google Scholar]
  41. Baehr, H.D.; Stephan, K. Heat and Mass Transfer, Second, Revised Edition; Springer: Berlin, Germany; Springer: New York, NY, USA, 2006; ISBN 13 978-3-540-29526-6. [Google Scholar]
  42. Corsi, C. New Frontiers for Infrared. Opto-Electron. Rev. 2015, 23, 3–25. [Google Scholar] [CrossRef]
Figure 1. Model of a final version of FireBot.
Applsci 12 11657 g001
Figure 2. The proposed FireBot system-architecture diagram.
Applsci 12 11657 g002
Figure 3. The first prototype of FireBot.
Applsci 12 11657 g003
Figure 4. Fire-detection systems in relation to time and required size of fire before triggering [24].
Applsci 12 11657 g004
Figure 5. Recall and F1-score of all four tiers (L1L4) of the evaluated networks.
Applsci 12 11657 g005
Figure 6. Comparison of all models by number of operations, number of parameters, and model size on disk.
Applsci 12 11657 g006
Figure 7. Examples of network inference on test images. A represents actual image class, P represents model-prediction class, and C represents the model’s confidence in its inference. (a) A: 1 P: 1 C: 97.21%. (b) A: 1 P: 0 C: 75.63%. (c) A:1 P: 1 C: 99.91%. (d) A: 1 P: 1 C: 50.18%. (e) A: 0 P: 1 C: 88.48%. (f) A: 0 P: 0 C: 99.99%.
Applsci 12 11657 g007
Figure 8. Performance metrics of U-Net image segmentation.
Applsci 12 11657 g008
Figure 9. Examples of image segmentation.
Applsci 12 11657 g009
Figure 10. Classification loss (top) and localization loss (bottom) of trained YOLOv5 model.
Applsci 12 11657 g010
Figure 11. Example of object detection with probabilities using YOLOv5.
Applsci 12 11657 g011
Figure 12. FireSense image-annotation tool interface.
Applsci 12 11657 g012
Figure 13. Radiation of the sun and earth by wavelengths.
Applsci 12 11657 g013
Figure 14. Components of radiation detected by the infrared thermal camera.
Applsci 12 11657 g014
Figure 15. Observed scene (top-left), threshold image (top-right), detected hotspots (bottom-left), and analyzed hotspots (bottom-right).
Applsci 12 11657 g015
Figure 16. The flowchart of the temperature-anomaly-detection algorithm.
Applsci 12 11657 g016
Figure 17. IRT images generated from estimated radiometric data (ad) and IRT images generated from estimated radiometric data using different color maps (eh). LB represents a low-temperature boundary and HB represents a high-temperature boundary. (a) Generated image: LB: 18, HB: 36. (b) Generated image: LB: 15, HB: 50. (c) Generated image: LB: 22, HB: 34. (d) Generated image: LB: 25, HB: 30. (e) Generated image: inferno cmap, LB: 22, HB: 34. (f) Generated image: viridis cmap, LB: 22, HB: 34. (g) Generated image: winter cmap, LB: 22, HB: 34. (h) Generated image: hsv cmap, LB: 22, HB: 34.
Applsci 12 11657 g017
Figure 18. Polar diagram of directional spectral emissivity of the object and influence of emissivity changes on the temperature displayed by the thermal camera Flir E60bx.
Applsci 12 11657 g018
Figure 19. Single-sensor pixel-cost evolution, source [42].
Applsci 12 11657 g019
Figure 20. Visual comparison of FOI and IFOV of individual cameras set 1 m from object.
Applsci 12 11657 g020
Figure 21. Voltcraft IRS-350 in operation.
Applsci 12 11657 g021
Figure 22. Temperature distribution on the active blackbody surface.
Applsci 12 11657 g022
Figure 23. The maximum camera distance up to which accurate measurement is possible.
Applsci 12 11657 g023
Figure 24. Average deviation in °C for the analyzed thermal cameras.
Applsci 12 11657 g024
Figure 25. Graphical representation of deviation in °C from the reference value.
Applsci 12 11657 g025
Figure 26. Percentage deviation from the mean deviation for individual cameras.
Applsci 12 11657 g026
Figure 27. Numerical indicator of the price in relation to the accuracy [USD/°C].
Applsci 12 11657 g027
Table 1. Hardware specifications of the first prototype.
Component TypeComponentApproximate Price
DrivetrainSkid steering, 4 rubber wheels and motors with encoders (40 W)USD 150
CPU (navigation)RaspberryPI 4 8 GBUSD 120
CPU
(image processing)
RaspberryPI 4 8 GBUSD 120
Battery2 × Lead 12 Ah, 5 h autonomyUSD 80
SensorsGyroscope, accelerometer, temperature, 5 × ultrasonic sensors in front + 2 on the sides, 3 × IR sensors downward facingUSD 20
Sensor-data managementArduino MegaUSD 45
LiDARRPLidar A2 (2D, 12 m range)USD 320
RGB-D cameraOrbbec Astra (640 × 480 @ 30 fps, RGB and depth)USD 150
Weight15 kg
Table 2. Hardware specifications of the final version of FireBot.
Component TypeComponentApproximate Price
DrivetrainDifferential drive, 2 rubber wheels and motors with encoders (200 W), 2 caster wheels for stability, suspensionUSD 600
CPU (navigation)Industrial PC (i7-10610U, 32 GB DDR4, 512 GB SSD)USD 1000
CPU (image processing)Nvidia Jetson Xavier AGX 64 GBUSD 1700
BatteryLiFePO4, 24 V, 100 Ah, 10 h autonomyUSD 600
SensorsGyroscope, accelerometer, temperature sensor, 3 × ultrasonic sensors in frontUSD 300
Sensor-data managementCustom electronics with CAN Bus interfaceIndoor built
LiDARRPLidar A3 (2D, 25 m range)USD 600
RGB-D cameraOrbbec Astra (640 × 480 @ 30 fps, RGB and depth)USD 150
Visual camera1080p 30 fps RGB camera with NIR area capabilitiesIndoor built
Infrared thermal camera384 × 288 30 fps with full radiometric dataIndoor built
OtherVarious gas sensors, microphone, LED reflector, laser range finderUSD 200
Fire extinguishing3 × 3 kg (powder, foam, CO2), mechanical hand, electronic nozzleIndoor built
Weight30 kg
Table 3. Comparison of infrared thermal cameras used for imaging and analysis.
SpecificationsCamera
Flir E6Flir One ProFlir E60bxHTI HT-301Flir A500 24°Flir A70 29°Flir A70 95°
IR resolution160 × 120160 × 120320 × 240384 × 288464 × 348640 × 480640 × 480
NETD60 mK70 mK45 mK60 mK40 mK45 mK60 mK
FOV45° × 34°55° × 43°25° × 19°28.2° × 21.3°24° × 18°29° × 22°95° × 74°
IFOV5.2 mrad6 mrad1.36 mrad1.28 mrad0.90 mrad0.79 mrad2.59 mrad
Spectral range7.5–13 µm8–14 µm7.5–13 µm8–14 µm7.5–14 µm7.5–14 µm7.5–14 µm
Temp. range (°C)−20 to + 250−20 to + 120−20 to + 120−20 to + 120−20 to + 120−20 to + 175−20 to + 175
Accuracy (°C) or (%) of
reading
±2 °C or ±2%±3 °C or ±5%±2 °C or ±2%±3 °C or ±3%±2 °C or ±2%±2 °C or ±2%±2 °C or ±2%
for ambient temperature 15 °C to 35 °C
Table 4. Comparison of blackbodies used for imaging and analysis.
BlackbodyVoltcraft IRS-350Flir Systems BB150-P
Temperature range50 °C to 350 °C45 °C to 150 °C
Accuracy±0.5 °C at 100 °C
±1.2 °C at 350 °C
±0.7 °C 0 to 10 °C
±0.5 °C 10 to 40 °C
Stability±0.1 °C at 100 °C
±0.2 °C at 350 °C
±0.2 °C
Emissivity of measuring area0.950.98
Operating temperature5 °C to 35 °C0 °C to 40 °C
Table 5. Temperature readings during the calibration process.
DeviceAverage Measurements for Defined Reference Points (°C)
27303336394245
Flir E629.0332.1335.2038.0541.2544.5045.70
Flir E60bx27.7730.8533.8536.9339.9543.0545.90
Flir One Pro27.5226.6329.4030.0832.5036.1037.50
Flir A50027.0729.7332.7435.9238.6441.8944.68
Flir A70 29°22.0324.0927.8729.2731.5534.7637.22
Flir A70 95°26.5029.7632.9736.2739.3242.4246.10
HTI HT-30127.6429.6735.1837.0141.7242.5345.73
Raytek RAYMX2D27.5730.5333.6536.7239.6542.6145.69
Parkside PTIA 126.9129.4430.8434.5537.3139.1239.69
Table 6. Deviation in °C from the reference value, and camera-price information.
DeviceDeviation in °C from the Reference Value, and Camera-Price InformationPrice (USD)
27303336394245
Flir E62.032.132.202.052.252.500.702259.00
Flir E60bx0.770.850.850.930.951.050.904295.00
Flir One Pro0.52−3.37−3.60−5.92−6.50−5.90−7.50259.99
Flir A5000.07−0.27−0.26−0.08−0.36−0.11−0.3210,079.00
Flir A70 29°−4.97−5.91−5.13−6.73−7.45−7.24−7.786950.00
Flir A70 95°−0.50−0.24−0.030.270.320.421.106950.00
HTI HT-3010.64−0.332.181.012.720.530.73787.00
Raytek RAYMX2D0.570.530.650.720.650.610.69124.41
Parkside PTIA 1−0.09−0.56−2.16−1.45−1.69−2.88−5.3120.80
Publisher’s Note: MDPI stays neutral with regard to jurisdictional claims in published maps and institutional affiliations.

