Abstract
Breast cancer is the most common cancer in women and the second most common cancer in the world. Digital breast tomosynthesis (DBT) is an effective medical imaging method. It can reduce the overlap of breast tissue in reconstructed images, which is beneficial to the early detection of breast cancer. DBT uses projection data from a limited range of angles and the simultaneous algebraic reconstruction technique (SART) based reconstruction method. Since the detector’s field of view (FOV) is limited, the updates of the large projection angles in SART cannot include all the voxels of the imaging target, which causes truncated projection artifacts (TPA) at the edges of the image. In this work, we use the images reconstructed by SART to perform re-projection on the virtually expanded detector panel and use a gradient calculation method to compensate for missing projection data to ensure that each update can include all the voxels. Experiments on simulation and human breast demonstrated that TPA can be effectively reduced while retaining the detailed tissue structure, thus improving the image quality at the border and recovering the obscured structural information. It might provide a better imaging result for the consequential clinical diagnosis.
1. Introduction
Digital breast tomosynthesis (DBT) is a medical imaging modality that can provide quasi-three-dimensional (3D) breast structural information. DBT can reduce tissue overlap and improve early breast cancer detection [1,2,3,4,5].
DBT uses a limited-angle Computed Tomography (CT) technique that obtains low-dose X-ray projections of the breast within a limited range of angles. Currently, there are a variety of image reconstruction methods for DBT, which can be divided into two categories: iterative methods and non-iterative methods. Non-iterative reconstruction methods mainly include the back-projection (BP) algorithm and filtered back-projection (FBP) algorithm. The BP algorithm can only yield low-contrast reconstructed images [6,7]. The FBP algorithm can attenuate the noise information in the BP algorithm by using spatial filters, but designing these filters strongly depends on the imaging and sampling geometry [8]. Iterative reconstruction algorithms are realized by refining the reconstructed images and improving the image quality through recursive calculations [9,10,11,12,13,14]. The simultaneous algebraic reconstruction technique (SART) is one of the commonly used iterative algorithms in limited-angle CT image reconstruction. It enhances the edges of the image by iteration and reconstructs more details in the reconstructed image [10,13]. The enhancement of image edges by SART depends on the selected reconstruction parameters and the number of iterations. With SART, detailed tissue structures can be revealed in DBT images clearly [11,12,13,14,15,16].
When applying SART in the limited-angle DBT system, the field of view (FOV) per projection view (PV) cannot cover the entire object due to the limitations of the X-ray source and detector. As shown in Figure 1, ray-B passing through the object cannot be received by the detector. This will exclude part of voxels in each iteration during the update and generate the discontinuous step-like artifacts at boundaries, which are called truncation projection artifacts (TPA). TPA will appear on the left and right sides of the reconstructed images, and will extend to the middle of the image as the distance between the breast slice and the digital detector increases. Through our measurement, the artifact area of the slice at 35 mm from the digital detector accounts for about 24% of the whole reconstructed image area, and the artifact area of the slice at 50 mm accounts for about 42%. Although there may not be images at the left and right sides of the reconstructed area, TPA still has a serious impact on limited angle CT. The influence of TPA can depend upon the sweep-angle, the breast size, the detector area and the acquisition pattern (continuous and step-and-shoot). TPA can seriously affect the quality of the reconstructed images and may impact the diagnoses of radiologists [9].
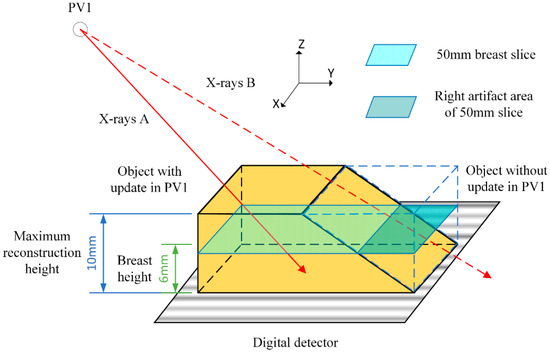
Figure 1.
During the iterative process under PV1, the ray-B passing through the object bounded by the dashed blue lines are not received by the detector and those parts of the object are not updated.
Methods of reducing TPA can be divided into two categories. The first is to artificially compensate the voxels that are not involved in the update [15,16]. By this method, Zhang proposed a local intensity equalization strategy to compensate for voxel values outside the FOV after each PV updating in SART [15]. However, the local intensity equalization strategy did not retain the structural information from the previous SART iteration. Lu proposed a diffusion-based method to reduce TPA, but the higher breast slices still contain artifacts [16]. The second method is to correct the projection data before reconstruction [17,18,19,20,21]. To extend the truncated projections, extrapolation methods were employed via polynomial functions [7], symmetric mirroring [17], cylindrical water object fitting [18] and square root function [19].
In this study, for the existing DBT system, the original reconstructed images with TPA are projected to generate a completed projection data set. In this projection process, the detector panel is virtually expanded so that it can receive all the X-rays to avoid the truncation of the projection data. These expanded projected data are used to complete the truncated parts of the original data. Furthermore, to avoid the quick variation of voxel value at truncation locations, gradient information is used to compensate for the original data from truncation locations to the edge of the data.
2. Materials and Methods
2.1. System and Data Set
The image and the geometry of the second-generation GE prototype digital tomosynthesis system for DBT imaging are shown in Figure 2. The distance from the X-ray focal spot to the rotation pivot point is 640 mm and the X-ray source rotation plane is parallel to the chest wall and perpendicular to the detector panel. Additionally, the distance between the detector panel and the bottom of the object is 20 mm. The system has a 1920*2304 matrix flat panel digital detector with a 0.1 mm × 0.1 mm pitch size, and the signals received in the experiments were provided by all the detectors. The system used a step-and-shoot design and acquired PV images with 21 angles at 3-degree increments ranging from −30 to 30 degrees [15,16].
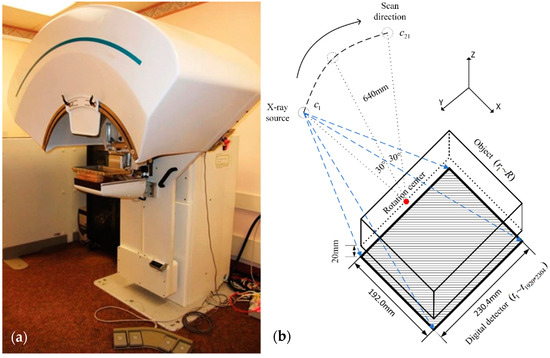
Figure 2.
(a) GE GEN2 prototype tomosynthesis system at the University of Michigan. (b) Description of DBT system structure used in the research. The top of the image is an X-ray source (60° total scanning angle, 21 projection view, 3° angular increment), the middle is a shelf for placing the measured object, and the bottom is a 1920 × 2304 digital detector.
Two types of data sets were used in our study: simulation data and human breast data. To create simulation data set, the positions of ligaments and tumors were sketched in 3D space and then the corresponding 3D images were projected to obtain projection data. Tumors and ligaments with different shapes were created in different layers to make our simulation data representative. The human breast data were obtained from the projections of full view DBT images of the Breast Cancer Screening [22]. The projection diagram is shown in Figure 3.
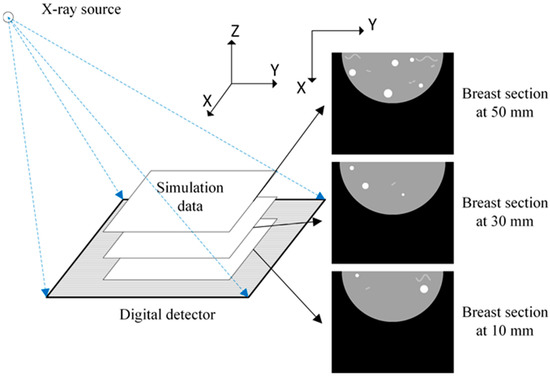
Figure 3.
Projection data generation.
2.2. Truncated Projection Artifacts
In this study, we used SART to reconstruct DBT images [11,12,13,14,15,16]. The DBT system has 21 projection angles, which means that each voxel was updated 21 times in one SART iteration. The reconstructed images were updated once for each PV. Each update traversed all detector values and updated the corresponding voxel values. For the th iteration during the processing of the PVs, the update of the linear attenuation coefficient of the voxel is defined in Equation (1) [15,16],
where is the index of detector in the detector panel; represents the index of PV; the radiation path between the center point of a detector and the X-ray source is regarded as a beam of X-ray; is the index of voxels in the reconstructed volume; is the total number of voxels that a beam of X-ray passes through; represents the weight of the th voxel when traversing to the value of the th detector in th PV, which equals to the length of the beam of X-ray intersected by the voxel; is the data detected by the th detector in th PV; is the total amount of times that the voxel updated in this iteration, and is a relaxation coefficient.
Since the X-rays are irradiated by an approximate point source and the area of the detector panel is limited, parts of the X-rays passing through the object cannot be received by the detector, which leads to truncated projection data. When the images were reconstructed using truncated projection data, the truncated parts of the object were not reconstructed. In the reconstruction of the next angle, the voxel values of the truncated parts that were not updated last time will become dim. These are the causes of the TPA at the boundaries of each FOV. The generation process of TPA in the first round of SART is shown in Figure 4.
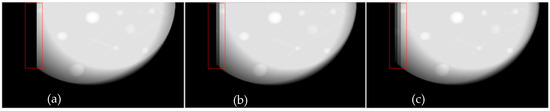
Figure 4.
(a) Breast slice for the first update in the first SART iteration. (b,c) Breast slice for the second, the third update in the first SART iteration.
After the projection data were used for image reconstruction, by observing Figure 4a–c, it can be seen that there were obvious truncations on the left side. X-rays passing through the left side of the object were not received by the detector panel, which lead to the voxel values on the left side of the image not being updated in this iteration. Thus, the pixel values on the left side of Figure 4a are all zero. During the subsequent iteration process, since some regions of the reconstruction target were assigned with non-zero values, according to Equation (1); it can be found that the difference between the actual value detected by the detector and the calculated value becomes smaller. The difference can be calculated as:
Thus, the updated voxel values will become smaller at this PV, resulting in darker stripes on the left side of the image. Therefore, in Figure 4b,c, the artifacts of gradually darkening voxel values appear in the red box in the images.
2.3. TPA Reduction Method
According to the previous description, the cause of TPA is that the FOV does not include the entire object. If the reconstructed FOV can be expanded to cover the whole target, using SART directly can reconstruct the images without TPA. To expand the FOV, not only expanding the scope of reconstruction was needed but completing the truncated parts of the original data was also required.
Firstly, SART reconstruction was performed on the original projection data. Then, the re-projection was virtually performed according to the position of the detector panel and the X-ray source. During this process, the modeling of the detector panel was expanded so that it could receive all the X-rays as shown in Figure 5. Finally, since each FOV can contain the entire imaged object, SART projection data were used to complete the original data to obtain the completed data.
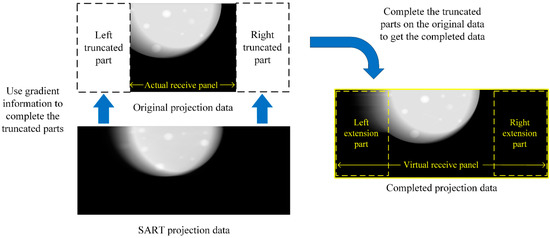
Figure 5.
The diagram of expanding the FOV.
In the following truncation data completion algorithm description diagram (as listed in Algorithm 1), we traversed each row of the original projection data to complete the pixel value of the truncated area. For each row of the projection data, is the column index of the leftmost non-zero number; represents the column index of the rightmost non-zero number. is value of the th column, th row in completed data; represents the value of same voxel in projection data, and is the value of the voxel in original data. represents the total columns of original data. For each PV, the truncation data were completed row by row.
| Algorithm 1: Complete truncation data. |
| Step 1. For each row of projection data, center-align original data with completed data as shown in step 1 of Figure 6. The values of the middle part of the completed data are defined as |
| Step 2. Find the positions of p and q at the mth row. The part from p to the left truncation boundary of the original data and the part from q to the right truncation boundary are the ranges that need to be completed. The positions and ranges are shown in step 2 in Figure 6. The projection value of the nth column, mth row is defined as: |
| Step 3. Take the gradient from the left end to the right end of the projection data and use the gradient information to complete truncation data based on the original data. When completing the left side of the data, the calculation method is defined as: |
| Step 4. To complete the right side of the data, the method is defined as: |
| The gradient reconstruction process is shown in step 3–4 in Figure 6 in projection data is |
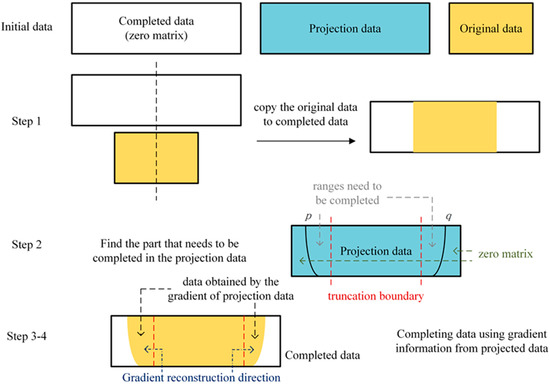
Figure 6.
The flowchart description of complete truncation data algorithm.
By comparing different projection data in Figure 5, it can be seen that the original projection data had truncation, while the SART projection data did not have truncation but contained more noise and artifacts than the original data, thus it looks blurry with no sharp margin. The completed projection data did not contain truncation and the image quality was the same as the original data. Therefore, using the completed projection data to reconstruct obtained a better result. By reconstructing the completed data, the FOVs were expanded so that each voxel would be updated 21 times in each iteration. The whole TPA reduction algorithm is described in Algorithm 2.
| Algorithm 2 Eliminate TPA. |
| Step 1. Perform SART reconstruction on the original data to obtain a reconstructed image |
| Step 2. Perform simulated projection on the reconstructed image of the SART and expand the range of the modeled detector panel to obtain the projection data without truncation. |
| Step 3. Perform data completion algorithm as in Algorithm 1. |
| Step 4. Median filter the completed data to reduce noise, which can reduce the effect of the TPA on the completed data. |
| Step 5. Perform SART reconstruction on the completed data to obtain an image without TPA. |
| Step 6. Repeat steps 2–4 to reduce the residual artifacts in higher slices. |
3. Results
3.1. Simulated Data
To observe the effectiveness of artifact removal, our research uses SART to reconstruct the original data and the completed data separately. At the same time, to demonstrate the effectiveness of our algorithm, a diffusion-based TPA elimination method is used as a comparison which uses the low-frequency information in the updated area to compensate for the un-updated area [16]. MATLAB code is used to create a three-dimensional matrix to simulate the breast image and simulate the attenuation of X-ray irradiation through the breast to create projection data. The corresponding reconstruction process is also carried out on MATLAB R2017a. In our simulation data, tumors, ligaments and other objects are included in the artifact area. We use an ellipsoid with voxel value of 0.6 to simulate the breast, curves with voxel value of 0.8 to simulate the ligaments, and spheres with voxel value of 1 to simulate the tumor. The number of iterations of SART is 5 and the relaxation coefficient λ in Equation (1) is set to 0.1.
The compressed thickness of the simulated breast was 60 mm and the selected section height is 50 mm on the Z-axis. In simulated data, the ligament was designed as a complex curve, which is helpful for us to observe the details when comparing the results with the original ones. The tumors in simulation data are spherical, which allows us to observe whether the edges of the tumor are distorted. In our study, different pixel values were designed for different tissues in the breast, representing their different X-ray absorptivity.
Figure 7 shows the results of the simulation data experiments. By comparing the images reconstructed by different TPA-removed methods in Figure 7c,d with the SART reconstructed image in Figure 7b, it can be seen that both algorithms are effective in reducing TPA. Artifact areas on the left and right sides of the breast are magnified for observation on the right of Figure 7a–d. By comparing with the real image in Figure 7a, it can be found that the image reconstructed by our algorithm in Figure 7d can better remove the influence of TPA on reconstructed image and restore breast tissue obscured by the artifacts, while the image reconstructed by the diffusion method in Figure 7c still contains some residual artifacts. After the image comparison, we completed data analysis on the experimental results. The position of the comparison line is marked with a dashed line in Figure 7a and the profiles are shown in Figure 7e,f. By comparing the pixel values reconstructed by different methods in Figure 7e, it can be found that the pixel values reconstructed by our algorithm at the left end of the selected line (around 40 mm) and the right end of the selected line (around 200 mm) is most similar to the real values. To demonstrate the effectiveness of our algorithm, we computed gradient information of the box region in Figure 7e. As shown in Figure 7f, since the real value has not changed, its gradient is zero. Among the data reconstructed by different algorithms, the gradient of the data reconstructed by our algorithm is the smallest in the artifact area. Since a sharp change in gradients should not appear in normal tissue, thus the smoothing of gradients in the image in Figure 7f also illustrates that our algorithm can reduce artifacts better and improve image quality.
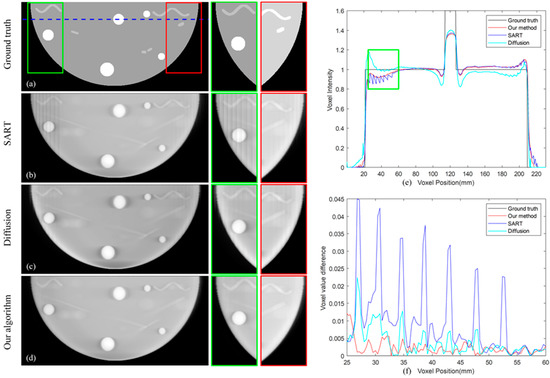
Figure 7.
(a) The real image. (b–d) Image reconstructed by SART; our proposed algorithm; diffusion-based method. (e) The selected line and its position are marked in (a). (f) The gradient information of the artifact area box in (e).
3.2. Human Breast Data
Our research projects the full view DBT images from the data set of Breast Cancer Screening [22] to obtain original human breast data.
The compressed thickness of the selected breast was 70 mm, the patient with larger breasts having been selected. This choice allowed a better observation of the influence of TPA on the images. These data were reconstructed by SART, our proposed algorithm and the diffusion method, respectively. Figure 8a–c shows the breast section with 35 mm high on the Z-axis, and Figure 8d–f shows the breast section with 51 mm high. In each iterative reconstruction, we used the same parameters as the simulated data. Since the artifact area on the right side of the image does not contain breast information, there is no artifact on the right side of the image. By visual observation, it can be found that both our algorithm and the diffusion method reduce artifacts on the left side of the image. We zoomed in on the artifact area and found that the image reconstructed by the diffusion method still contained artifacts on the left side of the image, and our algorithm can remove the artifacts more effectively, resulting in a clearer reconstructed image in Figure 8c,f. At the same time, by comparing images of different heights in Figure 8a,d, it can be found that as the height of the breast section increases, the artifacts extend from the ends of the image to the middle. With the increase of the artifact, the ability of the diffusion method to eliminate the artifact gradually weakens, resulting in the artifact in Figure 8b appearing more serious than in Figure 8e. Our algorithm overcomes this difficulty, and it can be seen that there are no obvious artifacts both in Figure 8c,f. Data analysis is performed on the dashed line in Figure 8d, and the results are shown in Figure 8g,h. It can be found from Figure 8g that no matter what method we use for reconstruction, the pixel values of non-artifact regions remain unchanged. Zoom in on the artifact area, and it can be seen from Figure 8h that our algorithm can beat smooth the voxel values, thus our algorithm can better remove artifacts and reconstruct breast images. At the same time, since the diffusion method continuously spreads the value from the updated area to the un-updated area, the voxel value at the edge of the image will become abnormal, which will affect the iteration of the image.
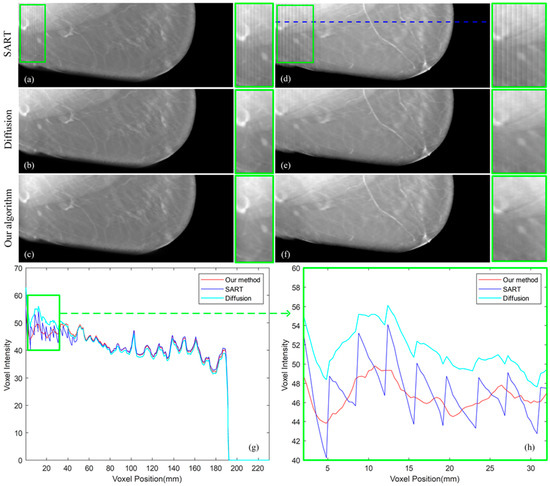
Figure 8.
(a–c) Image reconstructed by SART, diffusion method and our proposed algorithm with 35 mm high. (d–f) Image reconstructed by SART, diffusion method and our proposed algorithm with 51 mm high. (g) The selected data marked by a line in (d). (h) The artifact area in (g).
3.3. Analysis
The full angle DBT images are used as ground truth. The similarity between the ground truth and the image reconstructed by our algorithm and the similarity between the ground truth and the image reconstructed by SART are evaluated by calculating structural similarity index measurement (SSIM) to verify the effectiveness of our algorithm [23]. We use the simplified SSIM equation as follows:
where , , , , and are the local means, standard deviations, and cross-covariance for images , . is the artifact area in the ground truth image; is the artifact area in the image used to calculate the similarity with ground truth [24]. The regularization constants and are taken as 0.0001 and 0.0009 in our research.
This experiment used 20 sets of human breast data to calculate SSIM of the artifact area and the non-artifact area separately and find their ratio. The outcome is shown in Figure 9. Through the similarity comparison, it can be found that our algorithm improves the similarity between the reconstructed image and the ground truth. which suggests that our algorithm can reconstruct the objects more accurately and closer to the real objects. At the same time, our algorithm improves the similarity ratio between artifact areas and non-artifact areas, which means that our algorithm reduces the difference between the regions of the reconstructed image and decreases the effect of TPA.
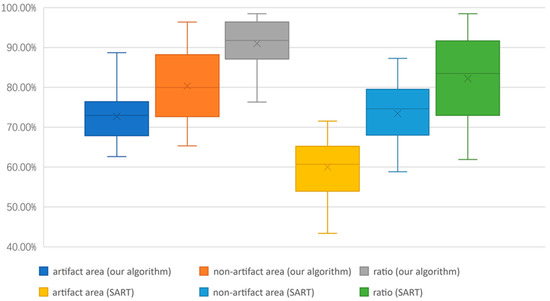
Figure 9.
Structural similarity comparison between the image reconstructed by our algorithm and by SART.
4. Discussion
Both experiments with simulated data and human breast data demonstrate that our algorithm has a better TPA removal effect and can effectively restore tissue obscured by TPA. Since the diffusion method uses the updated value of the partial area to update the voxels of entire breast images, errors will inevitably occur during the diffusion process. Although these errors will gradually decrease in the iterative process [10], they will still influence the final reconstructed image. Additionally, as the height of the breast slice increases, the un-updated area gradually expands and enlarges the errors caused by the diffusion method in high-level slices [15,16]. In contrast, our algorithm completes the truncation of the original projected data, and each update includes all voxels when we reconstruct the completed data, thereby eliminating TPA thoroughly. Furthermore, with the property of prior knowledge independent, our method can be applied in various environments without the need to adjust the parameters in the image processing.
5. Conclusions
Limited-angle CT is useful when the range of the collectable data is limited. DBT is the application of limited-angle CT in mammography [25]. DBT can produce quasi-three-dimensional images from the projections, mitigating an inherent limitation of tissue overlap, but TPA degrades the quality of the image reconstructed by the DBT system [26]. TPA arises from the truncation of projection data, and it will obscure tissue at the edges of the image and spread to the middle of the image. In this study, we propose a TPA-eliminating algorithm by completing the projection data through re-projecting the reconstructed images with TPA to a larger virtual detector plane and then recursively applying the SART reconstruction and the re-projection. The median filter was used to reduce the effects of the reconstructed artifacts on the re-projection data. Our proposed approach achieved more effective visual success in both simulated data and human breast data than diffusion method. By using our reconstruction algorithm, radiologists can discern the details in previously TPA blurred areas in images and make correct diagnoses. This study provides the possibility to improve the image quality of the limited-angle CT and extend its potential application range beyond the detection of early stage breast cancer.
Author Contributions
Methodology, J.Y.; Software, E.S.; Formal analysis, Y.W.; Investigation, P.L.C. All authors have read and agreed to the published version of the manuscript.
Funding
This research received no external funding.
Institutional Review Board Statement
Not applicable.
Informed Consent Statement
Not applicable.
Conflicts of Interest
The authors declare no conflict of interest.
References
- Bernardi, D.; Gentilini, M.A.; De Nisi, M.; Pellegrini, M.; Fanto, C.; Valentini, M.; Sabatino, V.; Luparia, A.; Houssami, N. Effect of implementing digital breast tomosynthesis (DBT) instead of mammography on population screening outcomes including interval cancer rates: Results of the Trento DBT pilot evaluation. Breast 2020, 50, 135–140. [Google Scholar] [CrossRef] [PubMed]
- Skaane, P.; Gullien, R.; Bjørndal, H.; Eben, E.B.; Ekseth, U.; Haakenaasen, U.; Jahr, G.; Jebsen, I.N.; Krager, M. Digital breast tomosynthesis (DBT): Initial experience in a clinical setting. Acta Radiol. 2012, 53, 524–529. [Google Scholar] [CrossRef] [PubMed]
- Andersson, I.; Ikeda, D.M.; Zackrisson, S.; Ruschin, M.; Svahn, T.; Timberg, P.; Tingberg, A. Breast tomosynthesis and digital mammography: A comparison of breast cancer visibility and BIRADS classification in a population of cancers with subtle mammographic findings. Eur. Radiol. 2008, 18, 2817–2825. [Google Scholar] [CrossRef]
- Conant, E.F.; Zuckerman, S.P.; McDonald, E.S.; Weinstein, S.P.; Korhonen, K.E.; Birnbaum, J.A.; Tobey, J.D.; Schnall, M.D.; Hubbard, R.A. Five consecutive years of screening with digital breast tomosynthesis: Outcomes by screening year and round. Radiology 2020, 295, 285. [Google Scholar] [CrossRef]
- Gennaro, G.; Toledano, A.; Di Maggio, C.; Baldan, E.; Bezzon, E.; La Grassa, M.; Pescarini, L.; Polico, I.; Proietti, A.; Toffoli, A.; et al. Digital breast tomosynthesis versus digital mammography: A clinical performance study. Eur. Radiol. 2010, 20, 1545–1553. [Google Scholar] [CrossRef]
- Zhu, F.; Liu, Y.; Wen, H.; Wang, T.; Fang, J.; Tang, S. Optimization of back projection with different geometry configurations of X-ray sources in digital breast tomosynthesis: A Monte Carlo simulation study. Optik 2020, 202, 163604. [Google Scholar] [CrossRef]
- Li, B.; Avinash, G.; Claus, B.; Metz, S. 3D view weighted cone-beam backprojection reconstruction for digital tomosynthesis. Medical Imaging 2007: Physics of Medical Imaging. SPIE 2007, 6510, 1567–1574. [Google Scholar]
- Rodriguez-Ruiz, A.; Teuwen, J.; Vreemann, S.; Bouwman, R.W.; van Engen, R.E.; Karssemeijer, N.; Mann, R.M.; Gubern-Merida, A.; Sechopoulos, I. New reconstruction algorithm for digital breast tomosynthesis: Better image quality for humans and computers. Acta Radiol. 2018, 59, 1051–1059. [Google Scholar] [CrossRef]
- Andersen, A.H. Algebraic reconstruction in CT from limited views. IEEE Trans. Med. Imaging 1989, 8, 50–55. [Google Scholar] [CrossRef]
- Andersen, A.H.; Kak, A.C. Simultaneous algebraic reconstruction technique (SART): A superior implementation of the ART algorithm. Ultrason. Imaging 1984, 6, 81–94. [Google Scholar] [CrossRef]
- Shen, E.; Wang, Y.; Yuan, J. Truncated Projection Artifacts Removal in Digital Breast Tomosynthesis. In Proceedings of the 2022 IEEE/ACIS 22nd International Conference on Computer and Information Science (ICIS), Zhuhai, China, 26–28 June 2022; pp. 150–155. [Google Scholar]
- Gomi, T.; Koibuchi, Y. Use of a total variation minimization iterative reconstruction algorithm to evaluate reduced projections during digital breast Tomosynthesis. BioMed Res. Int. 2018, 2018, 5239082. [Google Scholar] [CrossRef] [PubMed]
- Zhang, Y.; Chan, H.P.; Sahiner, B.; Wei, J.; Goodsitt, M.M.; Hadjiiski, L.M.; Ge, J.; Zhou, C. A comparative study of limited-angle cone-beam reconstruction methods for breast tomosynthesis. Med. Phys. 2006, 33, 3781–3795. [Google Scholar] [CrossRef] [PubMed]
- Zhang, Y.; Chan, H.P.; Sahiner, B.; Wei, J.; Hadjiiski, L.M.; Ge, J.; Zhou, C. Breast tomosynthesis reconstruction with simultaneous algebraic reconstruction technique (SART): Effect of access strategy of projection-view images. RSNA Program Book. 2006. Volume 130. Available online: https://archive.rsna.org/2007/5014627.html (accessed on 9 October 2022).
- Zhang, Y.; Chan, H.P.; Sahiner, B.; Wei, J.; Zhou, C.; Hadjiiski, L.M. Artifact reduction methods for truncated projections in iterative breast tomosynthesis reconstruction. J. Comput. Assist. Tomogr. 2009, 33, 426–435. [Google Scholar] [CrossRef] [PubMed]
- Lu, Y.; Chan, H.P.; Wei, J.; Hadjiiski, L.M. A diffusion-based truncated projection artifact reduction method for iterative digital breast tomosynthesis reconstruction. Phys. Med. Biol. 2013, 58, 569. [Google Scholar] [CrossRef][Green Version]
- Kadrmas, D.J.; Jaszczak, R.J.; McCormick, J.W.; Coleman, R.E.; Lim, C.B. Truncation artifact reduction in transmission CT for improved SPECT attenuation compensation. Phys. Med. Biol. 1995, 40, 1085. [Google Scholar] [CrossRef]
- Ohnesorge, B.; Flohr, T.; Schwarz, K.; Heiken, J.P.; Bae, K.T. Efficient correction for CT image artifacts caused by objects extending outside the scan field of view. Med. Phys. 2000, 27, 39–46. [Google Scholar] [CrossRef] [PubMed]
- Hsieh, J.; Chao, E.; Thibault, J.; Grekowicz, B.; Horst, A.; McOlash, S.; Myers, T.J. A novel reconstruction algorithm to extend the CT scan field-of-view. Med. Phys. 2004, 31, 2385–2391. [Google Scholar] [CrossRef]
- Sourbelle, K.; Kachelrieß, M.; Kalender, W.A. Reconstruction from truncated projections in CT using adaptive detruncation. Eur. Radiol. 2005, 15, 1008–1014. [Google Scholar] [CrossRef]
- Kunze, H.; Härer, W.; Stierstorfer, K. Iterative extended field of view reconstruction. Medical Imaging 2007: Physics of Medical Imaging. SPIE 2007, 6510, 1900–1911. [Google Scholar]
- Breast Cancer Screening—Digital Breast Tomosynthesis (BCS-DBT) [Data Set]. Available online: https://wiki.cancerimagingarchive.net/pages/viewpage.action?pageId=64685580#64685580bcab02c187174a288dbcbf95d26179e8 (accessed on 24 May 2022).
- Zhu, F.; Liu, Y.; Wen, H.; Wang, T.; Wang, B.; Fang, J.; Tang, S. Comparison and optimization of iterative reconstruction algorithms in digital breast tomosynthesis. Optik 2020, 203, 164033. [Google Scholar] [CrossRef]
- Wang, Z.; Bovik, A.C.; Sheikh, H.R.; Simoncelli, E.P. Image quality assessment: From error visibility to structural similarity. IEEE Trans. Image Process. 2004, 13, 600–612. [Google Scholar] [CrossRef] [PubMed]
- Kapur, A.; Carson, P.L.; Eberhard, J.; Goodsitt, M.M.; Thomenius, K.; Lokhandwalla, M.; Buckley, D.; Roubidoux, M.A.; Helvie, M.A.; Booi, R.C.; et al. Combination of digital mammography with semi-automated 3D breast ultrasound. Technol. Cancer Res. Treat. 2004, 3, 325–334. [Google Scholar] [CrossRef] [PubMed]
- Geiser, W.R.; Einstein, S.A.; Yang, W.T. Artifacts in digital breast tomosynthesis. Am. J. Roentgenol. 2018, 211, 926–932. [Google Scholar] [CrossRef] [PubMed]
Publisher’s Note: MDPI stays neutral with regard to jurisdictional claims in published maps and institutional affiliations. |
© 2022 by the authors. Licensee MDPI, Basel, Switzerland. This article is an open access article distributed under the terms and conditions of the Creative Commons Attribution (CC BY) license (https://creativecommons.org/licenses/by/4.0/).