1. Introduction
The percussive drilling process is commonly used in tunnelling and mining activities. The impact of a piston on the drill rod creates a stress wave that is transferred into the rock through the tool buttons. The rock is then fragmented and flushed out by using water or air. Unlike the situation at quasi-static indentation, the percussive drilling corresponds to a transient dynamic problem involving local high strain-rate tensile and confined compression loadings within the rock. This is the reason why the mechanical behaviour of Lingulid Sandstone needs to be investigated using dynamic experimental methods aimed at numerically simulating the behaviour of the rock under the loading induced by a percussive drilling process.
In the present study, contrary to the situation in a parallel study (static experiments) [
1], bending tests, and uniaxial compression tests have not been considered under dynamic loading. Indeed, in the bending tests certain loading-rate inertial effects are acting under dynamic loading. This leads to a potential overestimation of the bending strength deduced from the measured input force without specific data processing that takes into account the non-equilibrium state of the sample [
2]. In uniaxial compression tests, due to the high sensitivity of geomaterial strength compared to the applied confinement, inertial effects acting at high-rates may induce an artificial that provides an apparent increase of uniaxial compression strength [
3]. On the other hand, quasi-oedometric compression tests are preferred under dynamic conditions. However, as illustrated in the previously mentioned parallel study [
1], such experiments need a very large capacity servo-hydraulic press (1 MN capacity) or a large diameter SHPB (Split-Hopkinson Pressure Bar) apparatus. For instance, in previous dynamic QOC tests [
4], the input and output Hopkinson bars were 80 mm in diameter and made of high-strength steel. This provides an impact loading (
Finput = ½
ρC0A
0Vimpact) of about 1.6 MN (with a striking velocity of 16 m/s), which made it possible to achieve an axial load about 1 MN within the sample and the output bar. Unfortunately, this apparatus was unavailable in the present study. On the other hand, previous experiments performed on dry siliceous aggregate concrete (without effect of free-water pressure) [
5] and on high-strength concrete [
6] showed a limited increase of strength when the static and dynamic testing results were compared.
The above results are the reason why, in dynamic conditions, the bending technique and both quasi-oedometric and uniaxial compression testing methods were discarded in favour of other techniques, namely the spalling and the edge-on impact techniques, in an open and sarcophagus configuration.
In [
7], it is claimed that, rather than applying the same “static techniques” in “dynamic conditions”, it is better to consider specific experimental methods in view of investigating and modelling the damage processes involved in geomaterials at high rates. To do so, a classification into four types of experimental methods was proposed [
7]. This is done by separating the experimental methods for an analysis of damage processes via time-resolved observations (ultra-high-speed imaging, full field measurements); from those for post-mortem analysis at a microscopic scale (measurements of crack densities, micro-tomography analysis); from the experimental methods for parameter adjustment (flaw distribution, crack speed); and from those for numerical validation at a macroscopic scale (velocity profile measured on a free surface).
In the present study, two experimental methods were considered. The spalling technique is used to characterize the mechanical behaviour of Lingulid Sandstone under dynamic tensile loading. This technique relies on the measurement of particle velocity of the free face of a cylindrical sample thanks to a laser interferometer. Edge-On-Impact (EOI) tests were performed in an open configuration with a visualization of the targets thanks to an Ultra High-Speed Camera (UHSC) or in a sarcophagus configuration to visualize the fracturing pattern after impact. The experimental set-up and the results obtained are presented below, as well as the numerical study of EOI tests. The numerical and experimental results are then compared in order to determine whether the chosen constitutive model, with material parameters determined as described above, is sufficient to make accurate predictions regarding the mechanical behaviour at EOI testing. To the author’s knowledge, such an approach based on the chosen constitutive model has not been undertaken previously for Lingulid Sandstone.
2. Spalling Tests
The Spalling test operating with a single Hopkinson bar is a common testing technique used to investigate the dynamic tensile strength of concrete and rocks [
8,
9,
10]. This apparatus is based on a single Hopkinson bar that is used to apply a dynamic load to the sample (
Figure 1). A cylindrical striker hits the bar and produces an incident compressive wave that travels along the bar towards the other end, where a cylindrical sample is placed. At the bar-specimen interface, a part of the signal is reflected and the other part is transmitted. The transmitted compressive pulse is reflected as a tensile wave that propagates along the opposite direction when it reaches the sample free end. At the point where the reflected tensile pulse exceeds in amplitude the compressive pulse, a dynamic tensile loading develops within the sample, leading to its tensile failure. This technique allows for the investigation of geomaterial tensile responses at strain rates ranging from 30 to 150/s [
11,
12].
In this work, the tested samples are 45 mm in diameter and 140 mm in length (
Figure 2a,
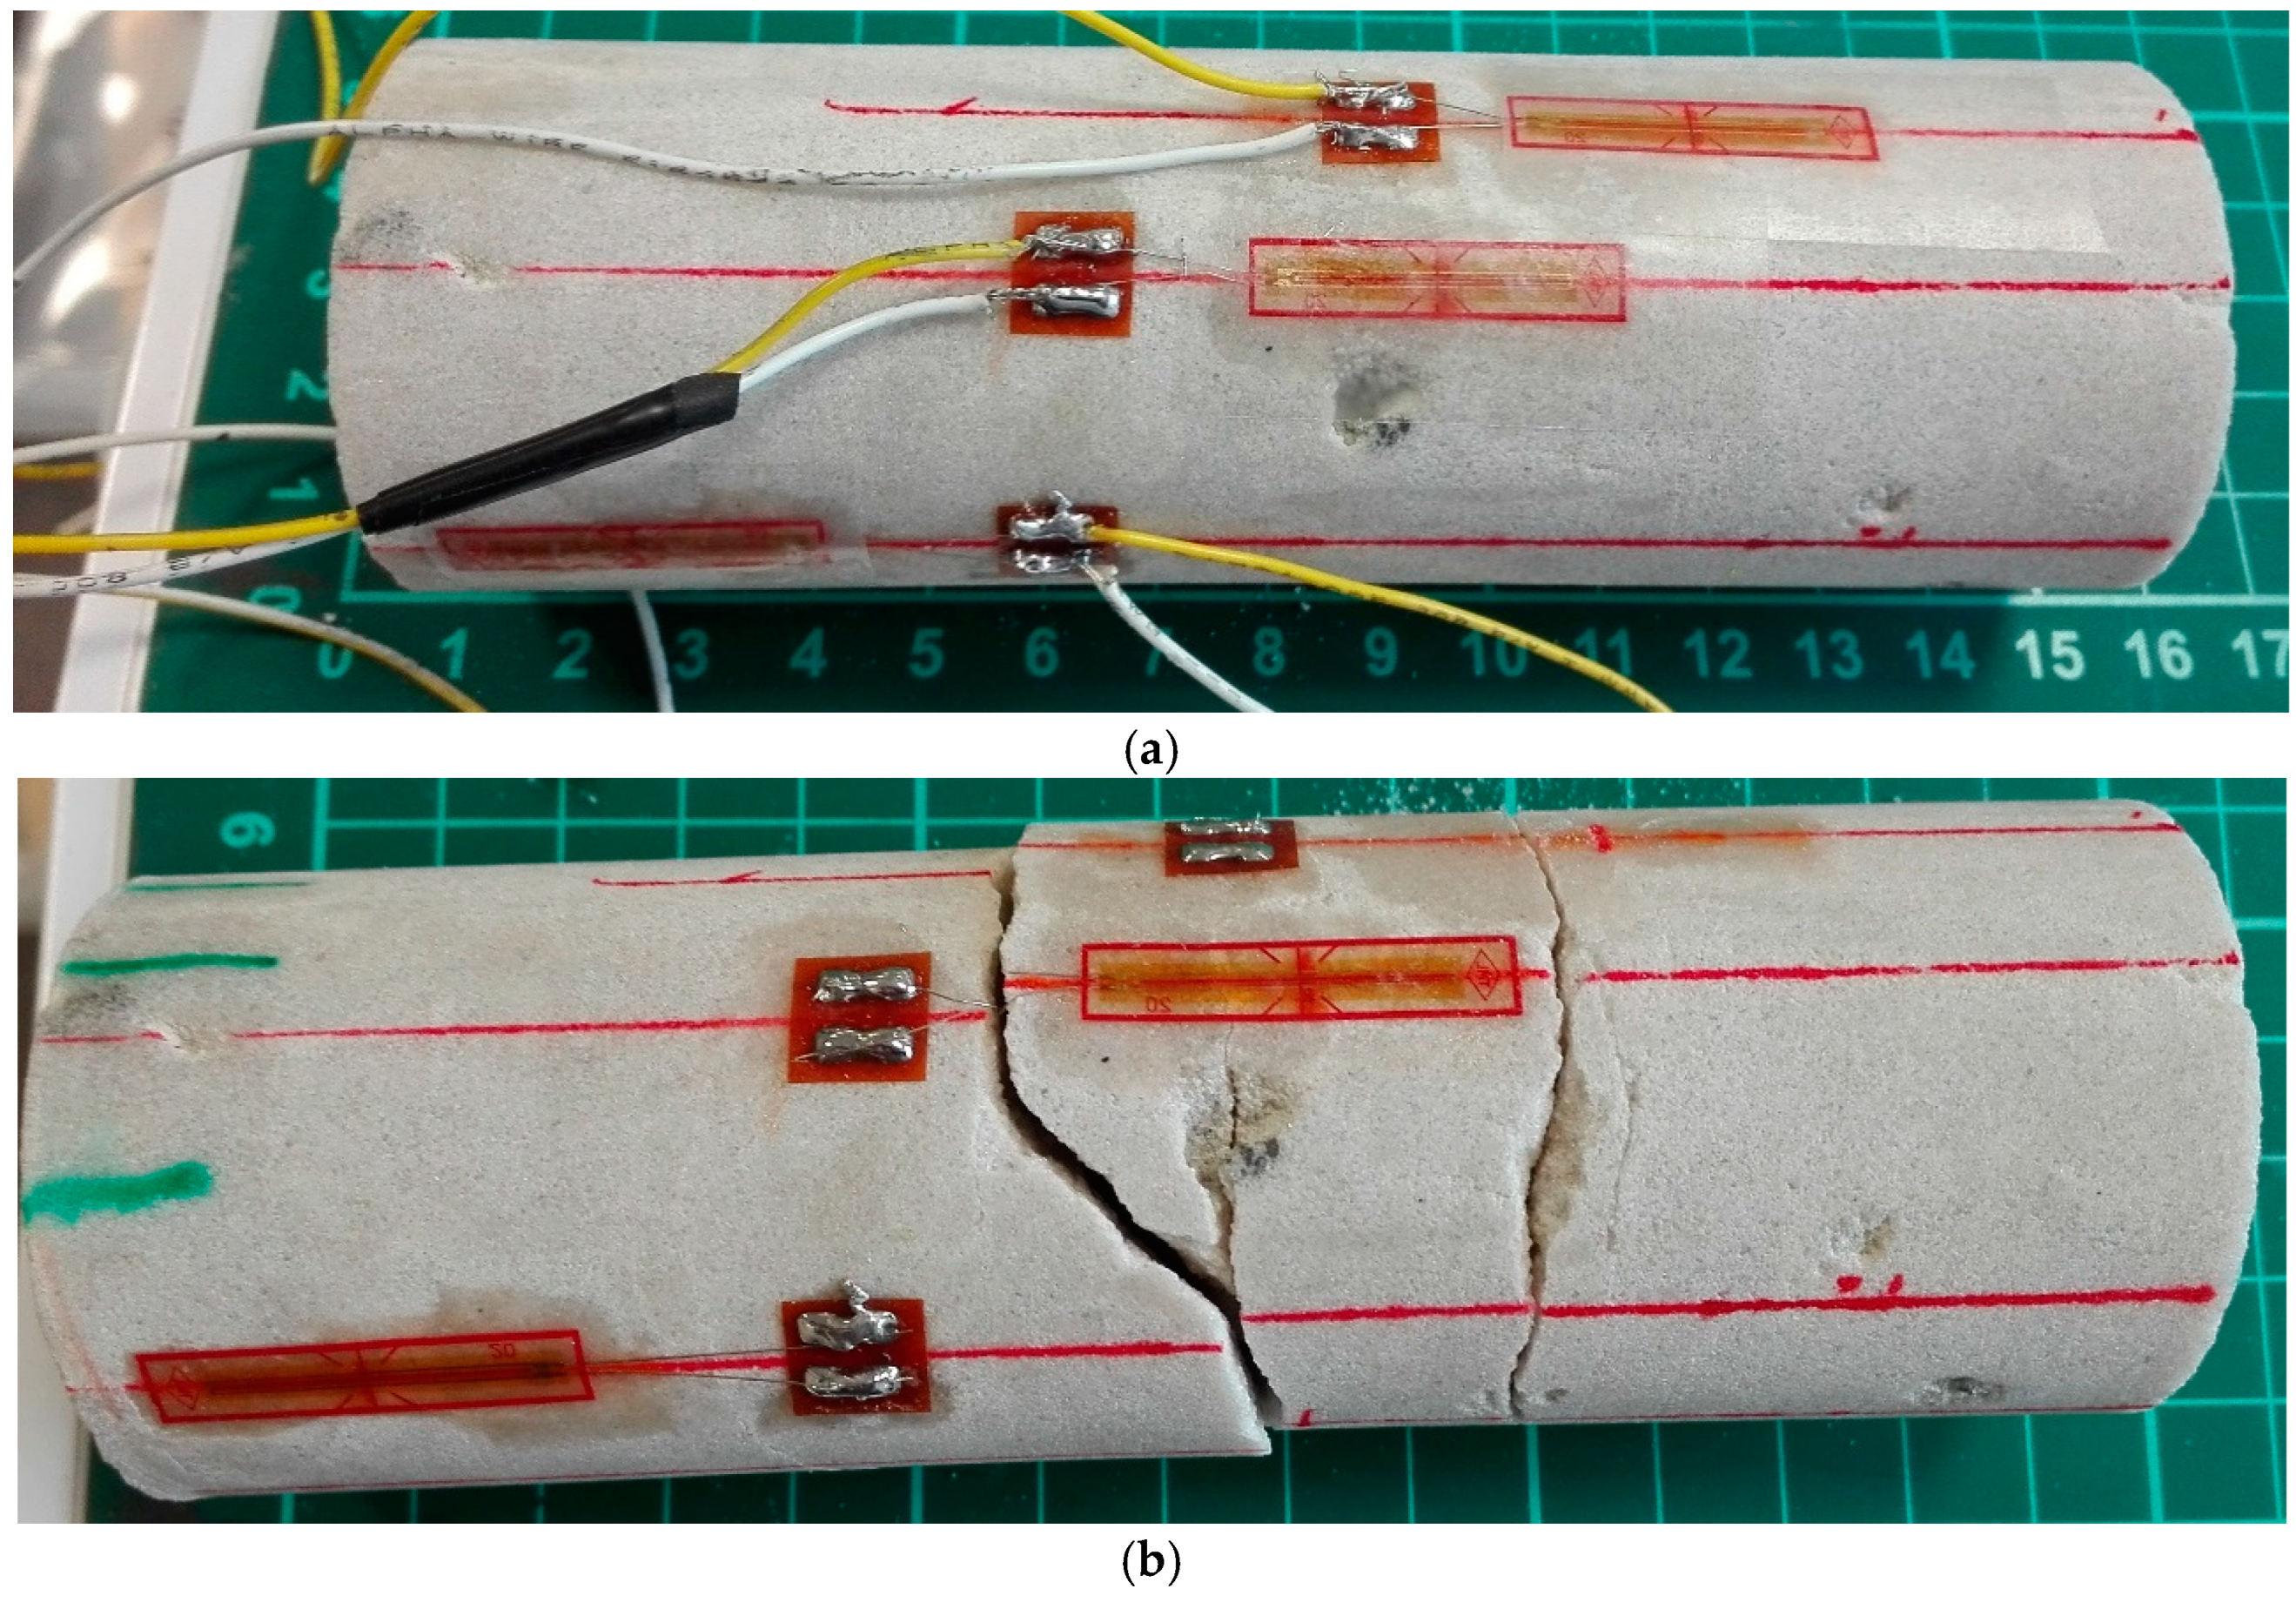
Table 1). The top and bottom surfaces are rectified to guarantee a perfectly flat contact with the input bar as well as to avoid a non-uniaxial reflected wave on the free end. Strain gauges are glued on the cylindrical surface of the sample at different positions. In particular, one gauge
is placed at
from the contact surface, and two gauges,
and
, are glued at
and
from the free end. The first strain gauge is used to characterise the compressive pulse applied to the sample while the two gauges closer to the free end provide the strain-rate information within the vicinity of the expected failure plane. On the sample free end, an optical reflector of several millimetres in size is positioned, towards which a laser interferometer (1.5 Mhz bandwidth) is pointed to measure the material particle velocity throughout the test. All pointwise measurement systems are connected to the high-resolution data acquisition system (Adwin-Pro II). Complementary to pointwise measurements, time-resolved full-field measurements are obtained using an ultra-high-speed camera to film a speckle pattern on the sample surface (
Figure 3). For this purpose, the Kirana camera [
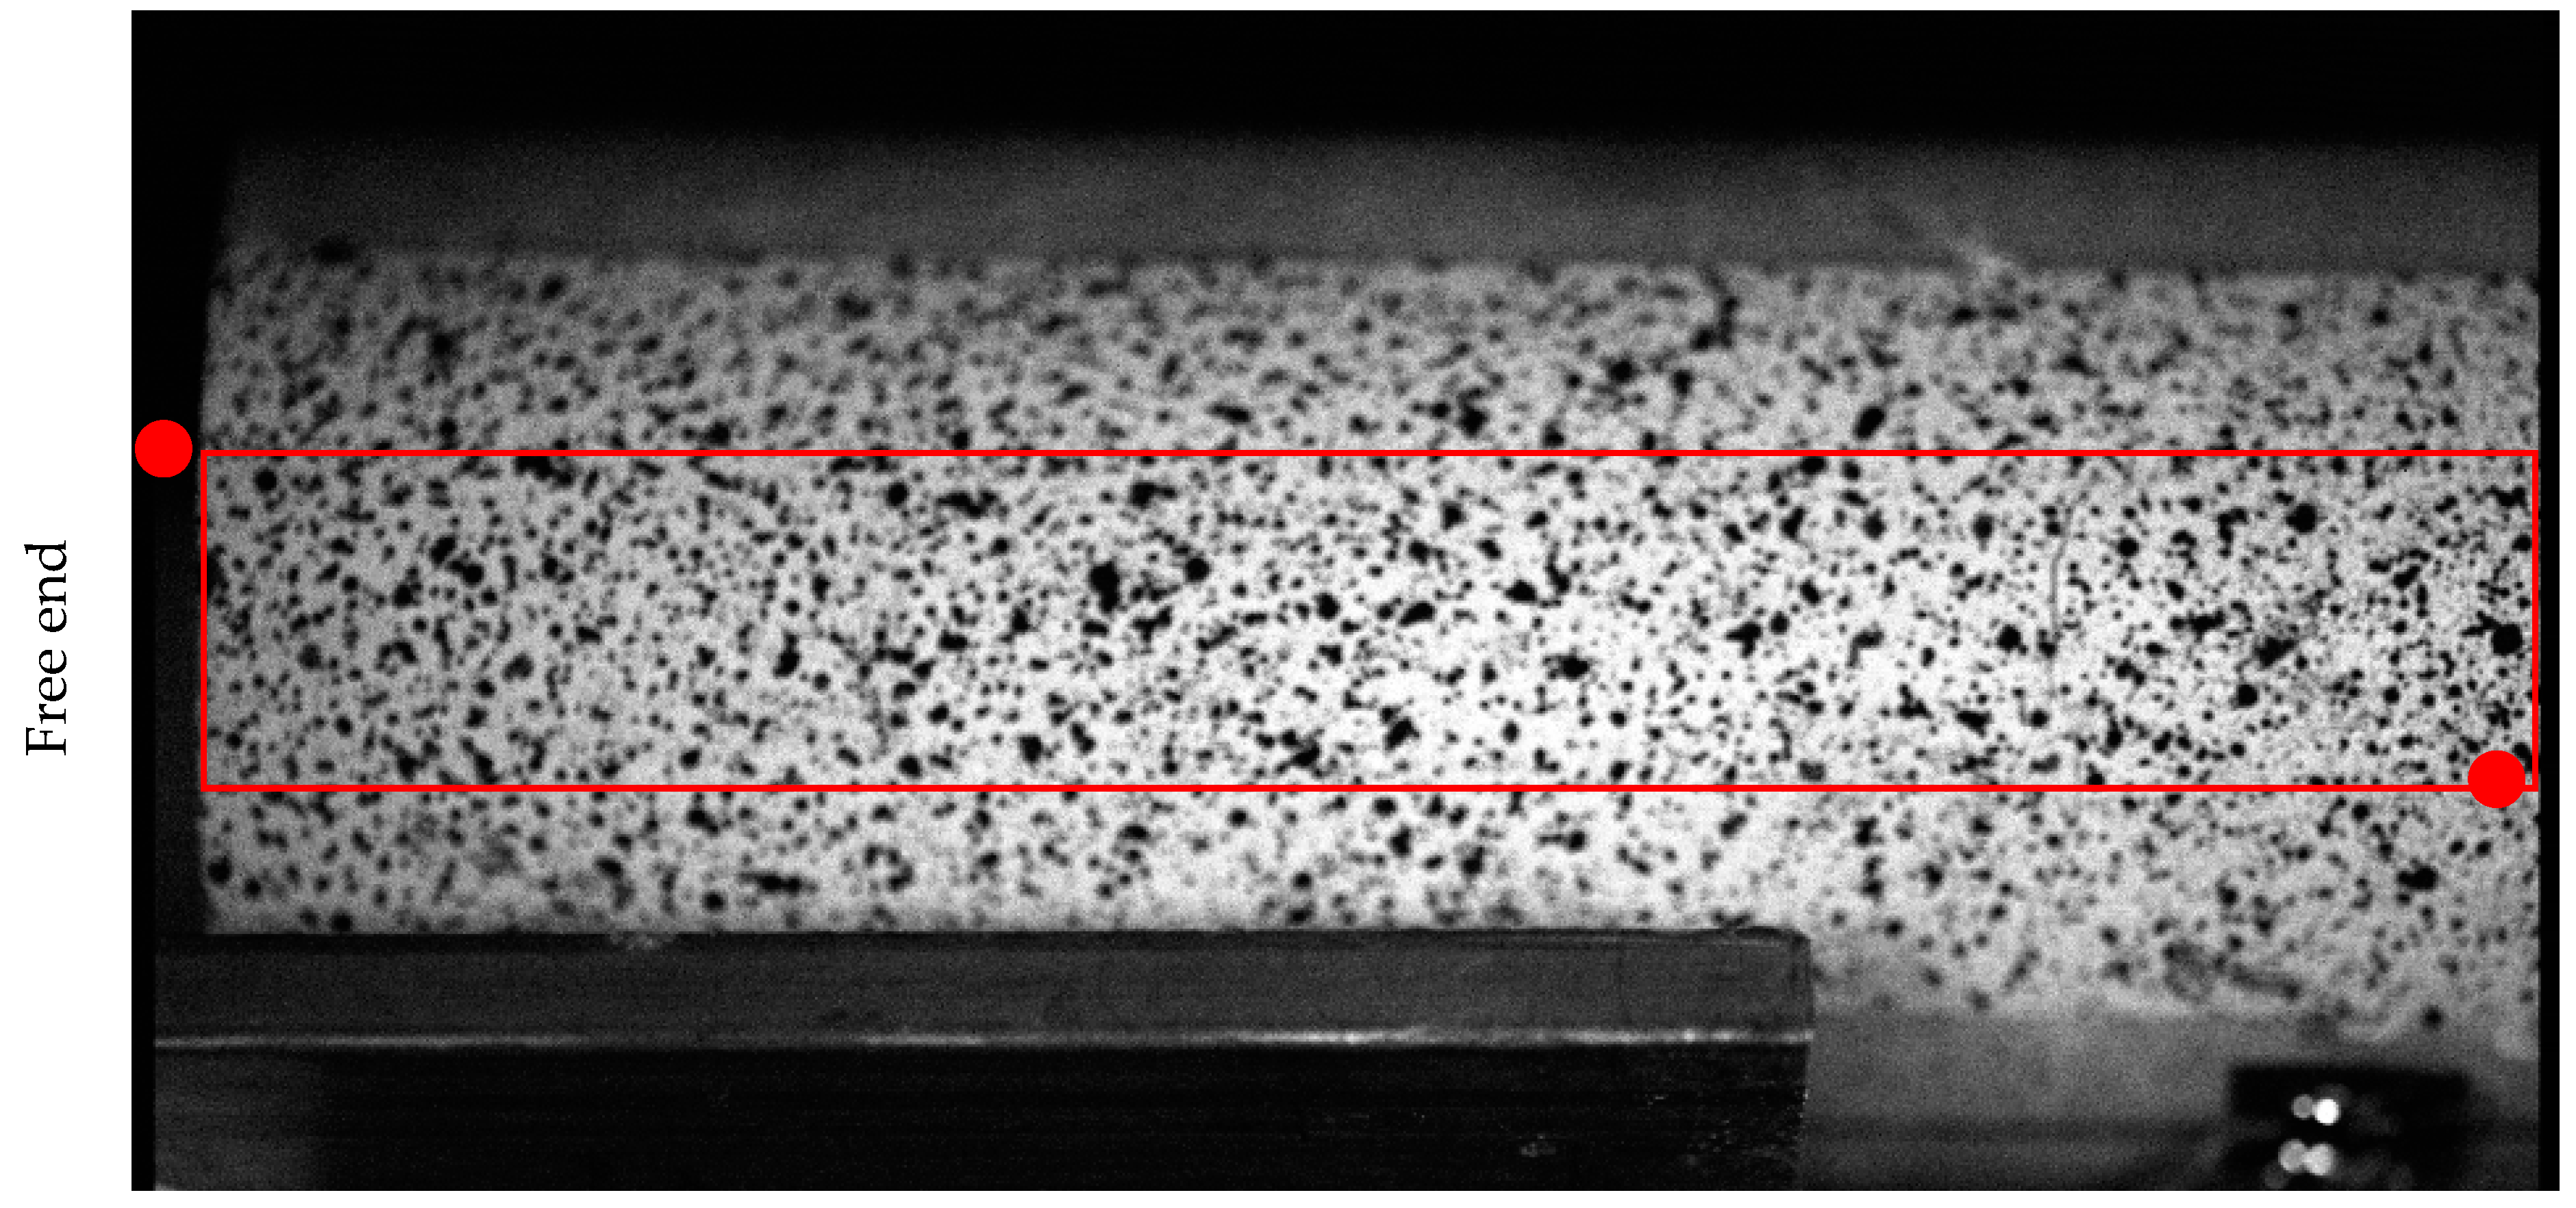
13] equipped with a macro lens (105 mm Sigma macro 2.8f) is used, with the acquisition speed set to 2 Mfps. The imaging system offers 180 frames, each having 924 × 768 pixels count. The laser interferometer is used to trigger the camera recording. The camera’s onboard memory allows for images can be captured before and after the trigger signal and thus both the compressive and the tensile stage of the loading were recorded by adjusting the number of frames. The exposure time was set to 200 ns to reduce any motion blur; two flash power sources targeted at the bar-projectile interface was used to supply high illumination to the image scene. The obtained images are then post-processed using a finite element-based digital image correlation method [
14,
15] to obtain the displacement fields on the sample surface throughout the test. The region of interest is first selected based on the depth-of-field observation and then subdivided into zones of interest of 16 × 16 pixels in size. The image scale resolution was set to 9.7 px/mm, providing one displacement measurement point every 1.6 mm and a total observation length of about 90 mm, recording more than half of the sample starting from the free end. In order to reduce the effects of spatial noise, the diffuse approximation method [
16] is applied with a second order polynomial over eight points to derive the axial strain field from the displacement data.
The dynamic tensile strength is evaluated by considering the spall strength provided by Novikov’s formula (Equation (1)) [
17] and the pullback velocity (
). The pullback velocity is the difference between the maximum particle velocity on the free end and the particle velocity at the first rebound. However, this quantity is used under the assumption that the constitutive law of the material is governed by linear elasticity before reaching the ultimate tensile strength.
Generally, the wave velocity
(Equation (2)) is computed from the difference between the time corresponding to the maximum value of the signal given at the strain gauge
and the time corresponding to the maximum value of velocity measured on the free end. The values of
listed in
Table 2 appear smaller than the expected values deduced from Equation (2) when considering the mean density of the Lingulid sandstone samples (2380 Kg/m
3) and the mean compression Young’s modulus (32.06 GPa,
Table 2 [
1]) deduced from quasi-static uniaxial compression tests (
Table 2 [
1]). Finally, given that structural defects may have influenced the wave propagation in spalling tests, the wave speed (
= 3670 m/s) provided by the mean value of Young’s modulus and density of uniaxial compression tests was considered in the data processing of the spalling tests (Equation (2)).
The experimental data of the spalling tests are shown in
Table 2 and depicted in
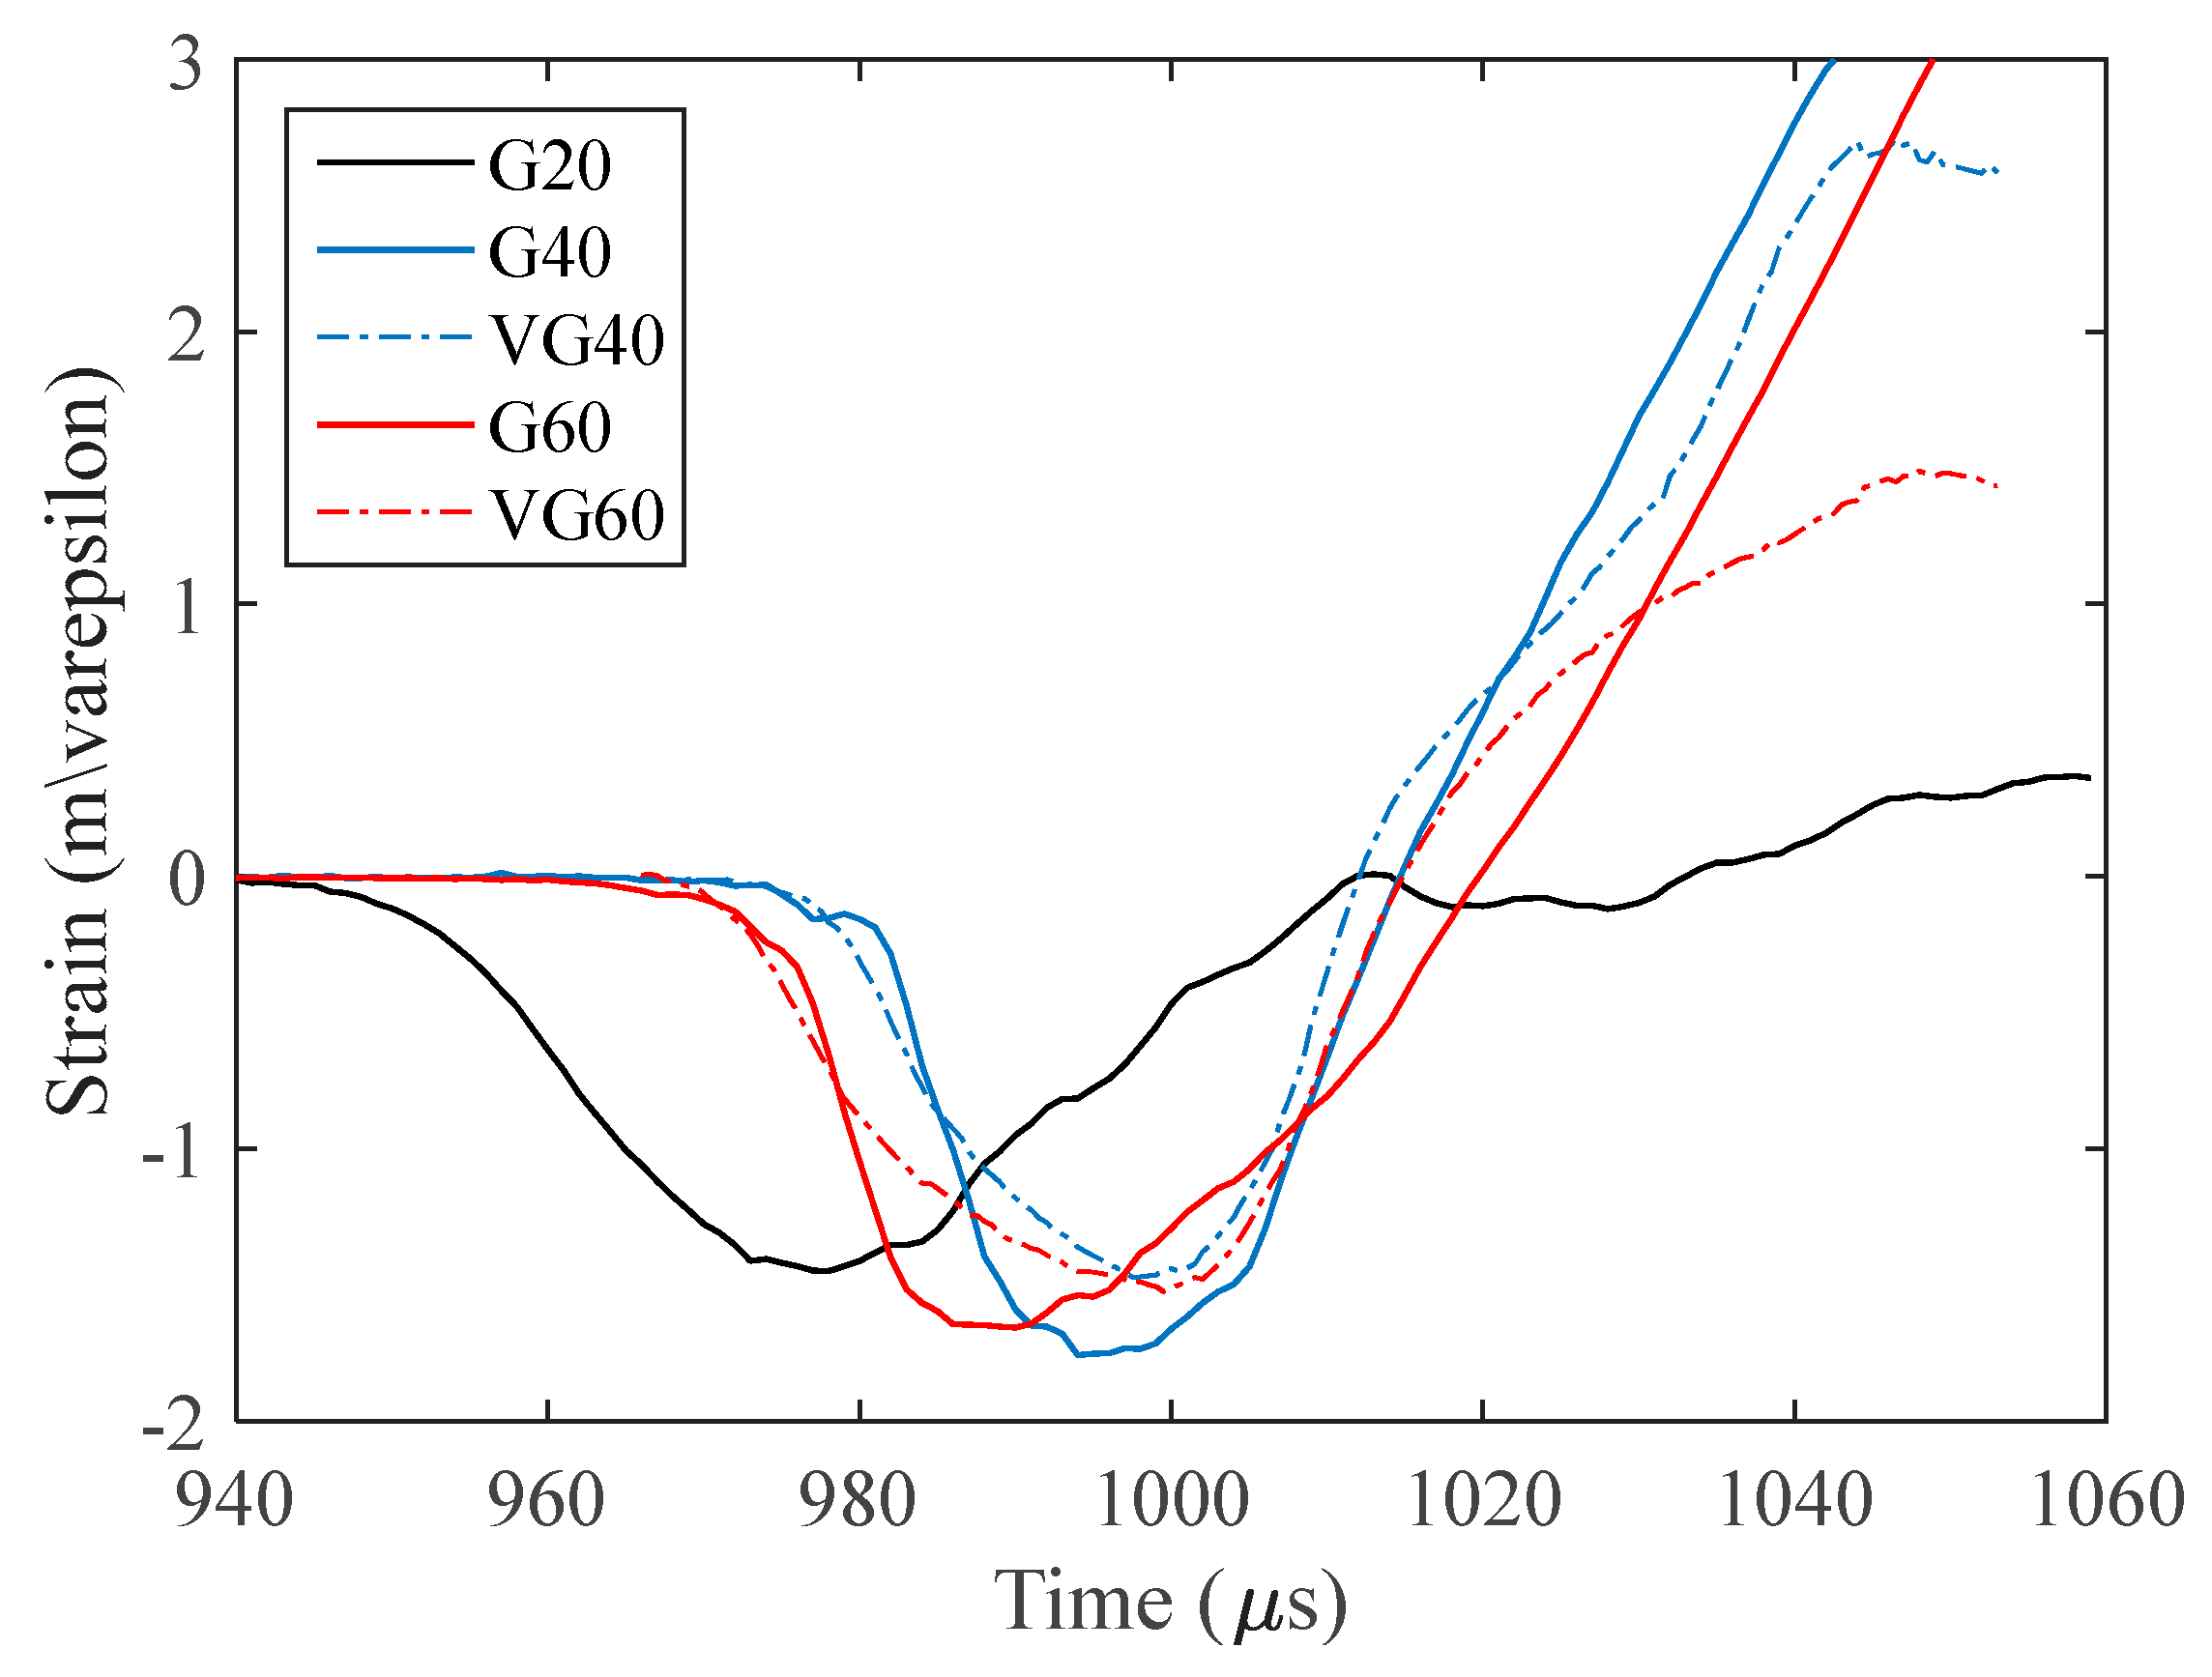
Figure 4. The results pertinent to both strain gauges and the virtual gauges from the full field strain data, at the corresponding positions, are presented. A change of the compressive wave is clearly observed by comparing the compressive part of the signal at gauges
,
, and
(
Figure 4). In addition, there is a certain discrepancy between the strain gauge and virtual gauge measurements due to the presence of a non-uniform failure through the sample cross-section (see failure pattern on
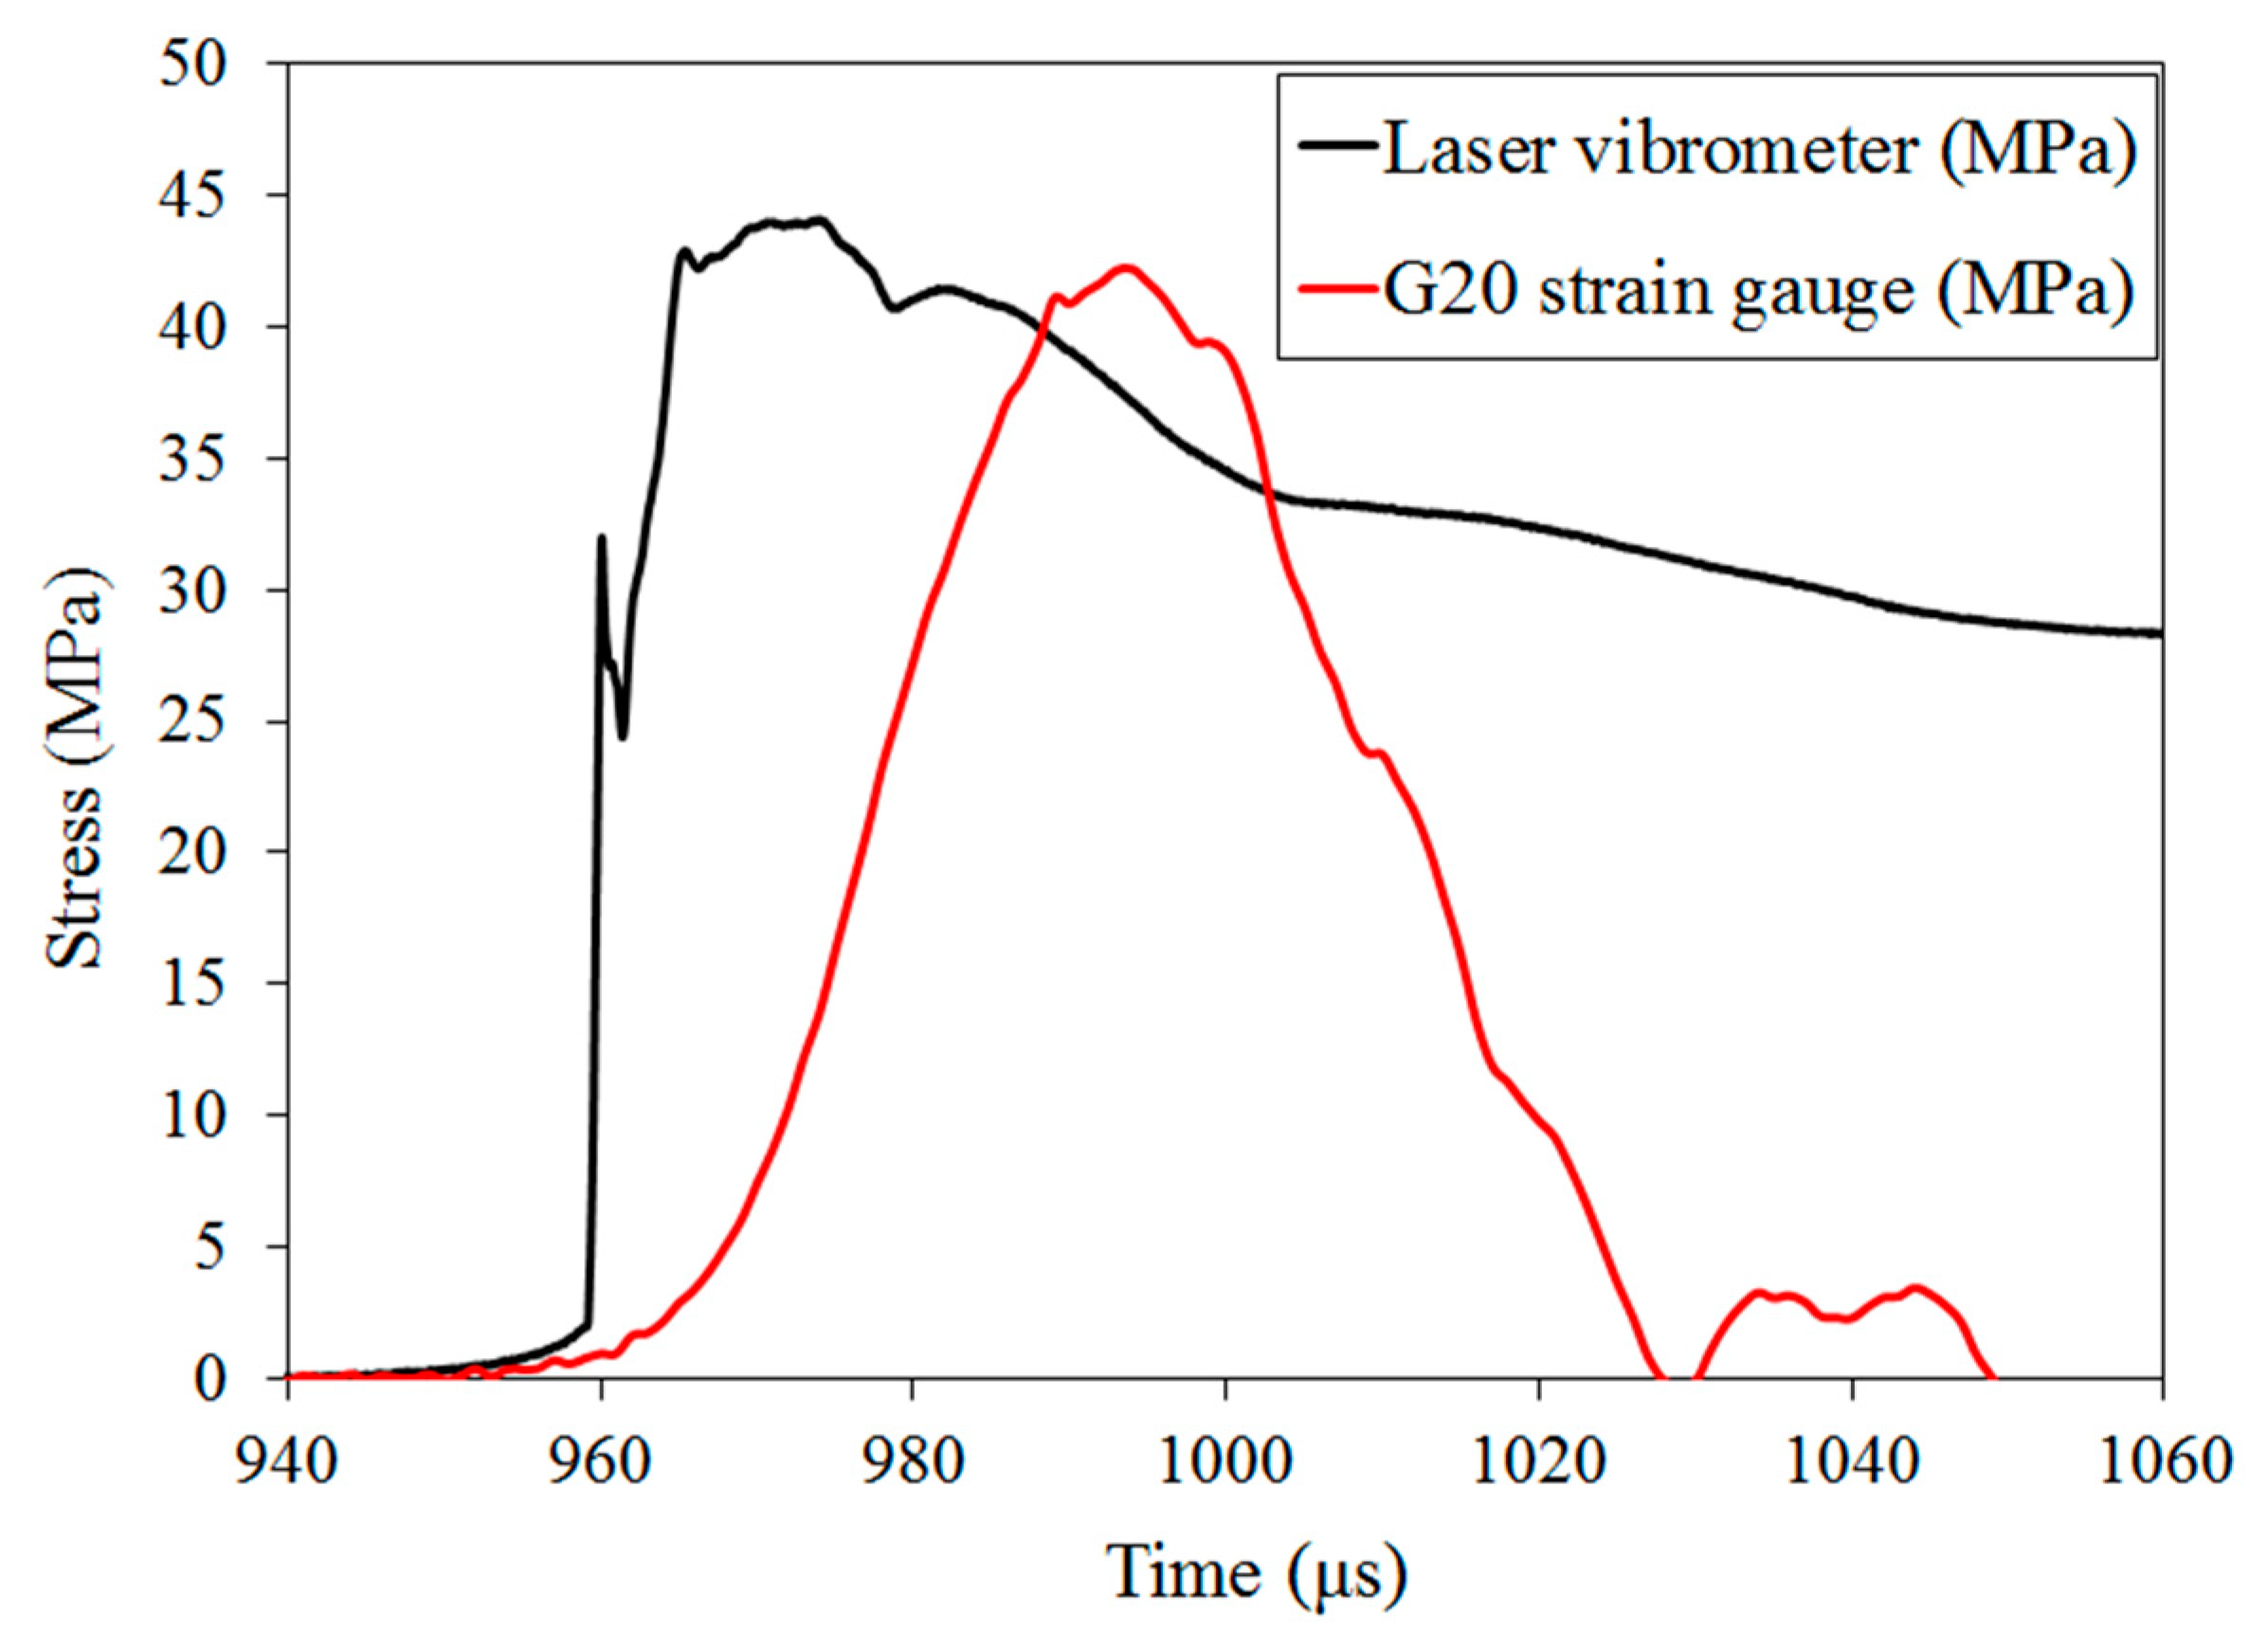
Figure 2b). Furthermore, the nominal stress calculated from the rear face velocity as
was compared to the nominal stress obtained from the gauge
determined from the product
(
Figure 5) considering the density (
= 2380 Kg/m
3), 1D wave speed (
= 3670 m/s), and Young’s modulus (
E = 32.06 GPa) provided in [
1]. It is observed that the rising part of the curve calculated from the rear face velocity is much stiffer than the nominal stress obtained from the gauge. This behaviour can be explained by the closure of pre-existing defects (micro-cracks or structural cracks) during wave propagation [
10,
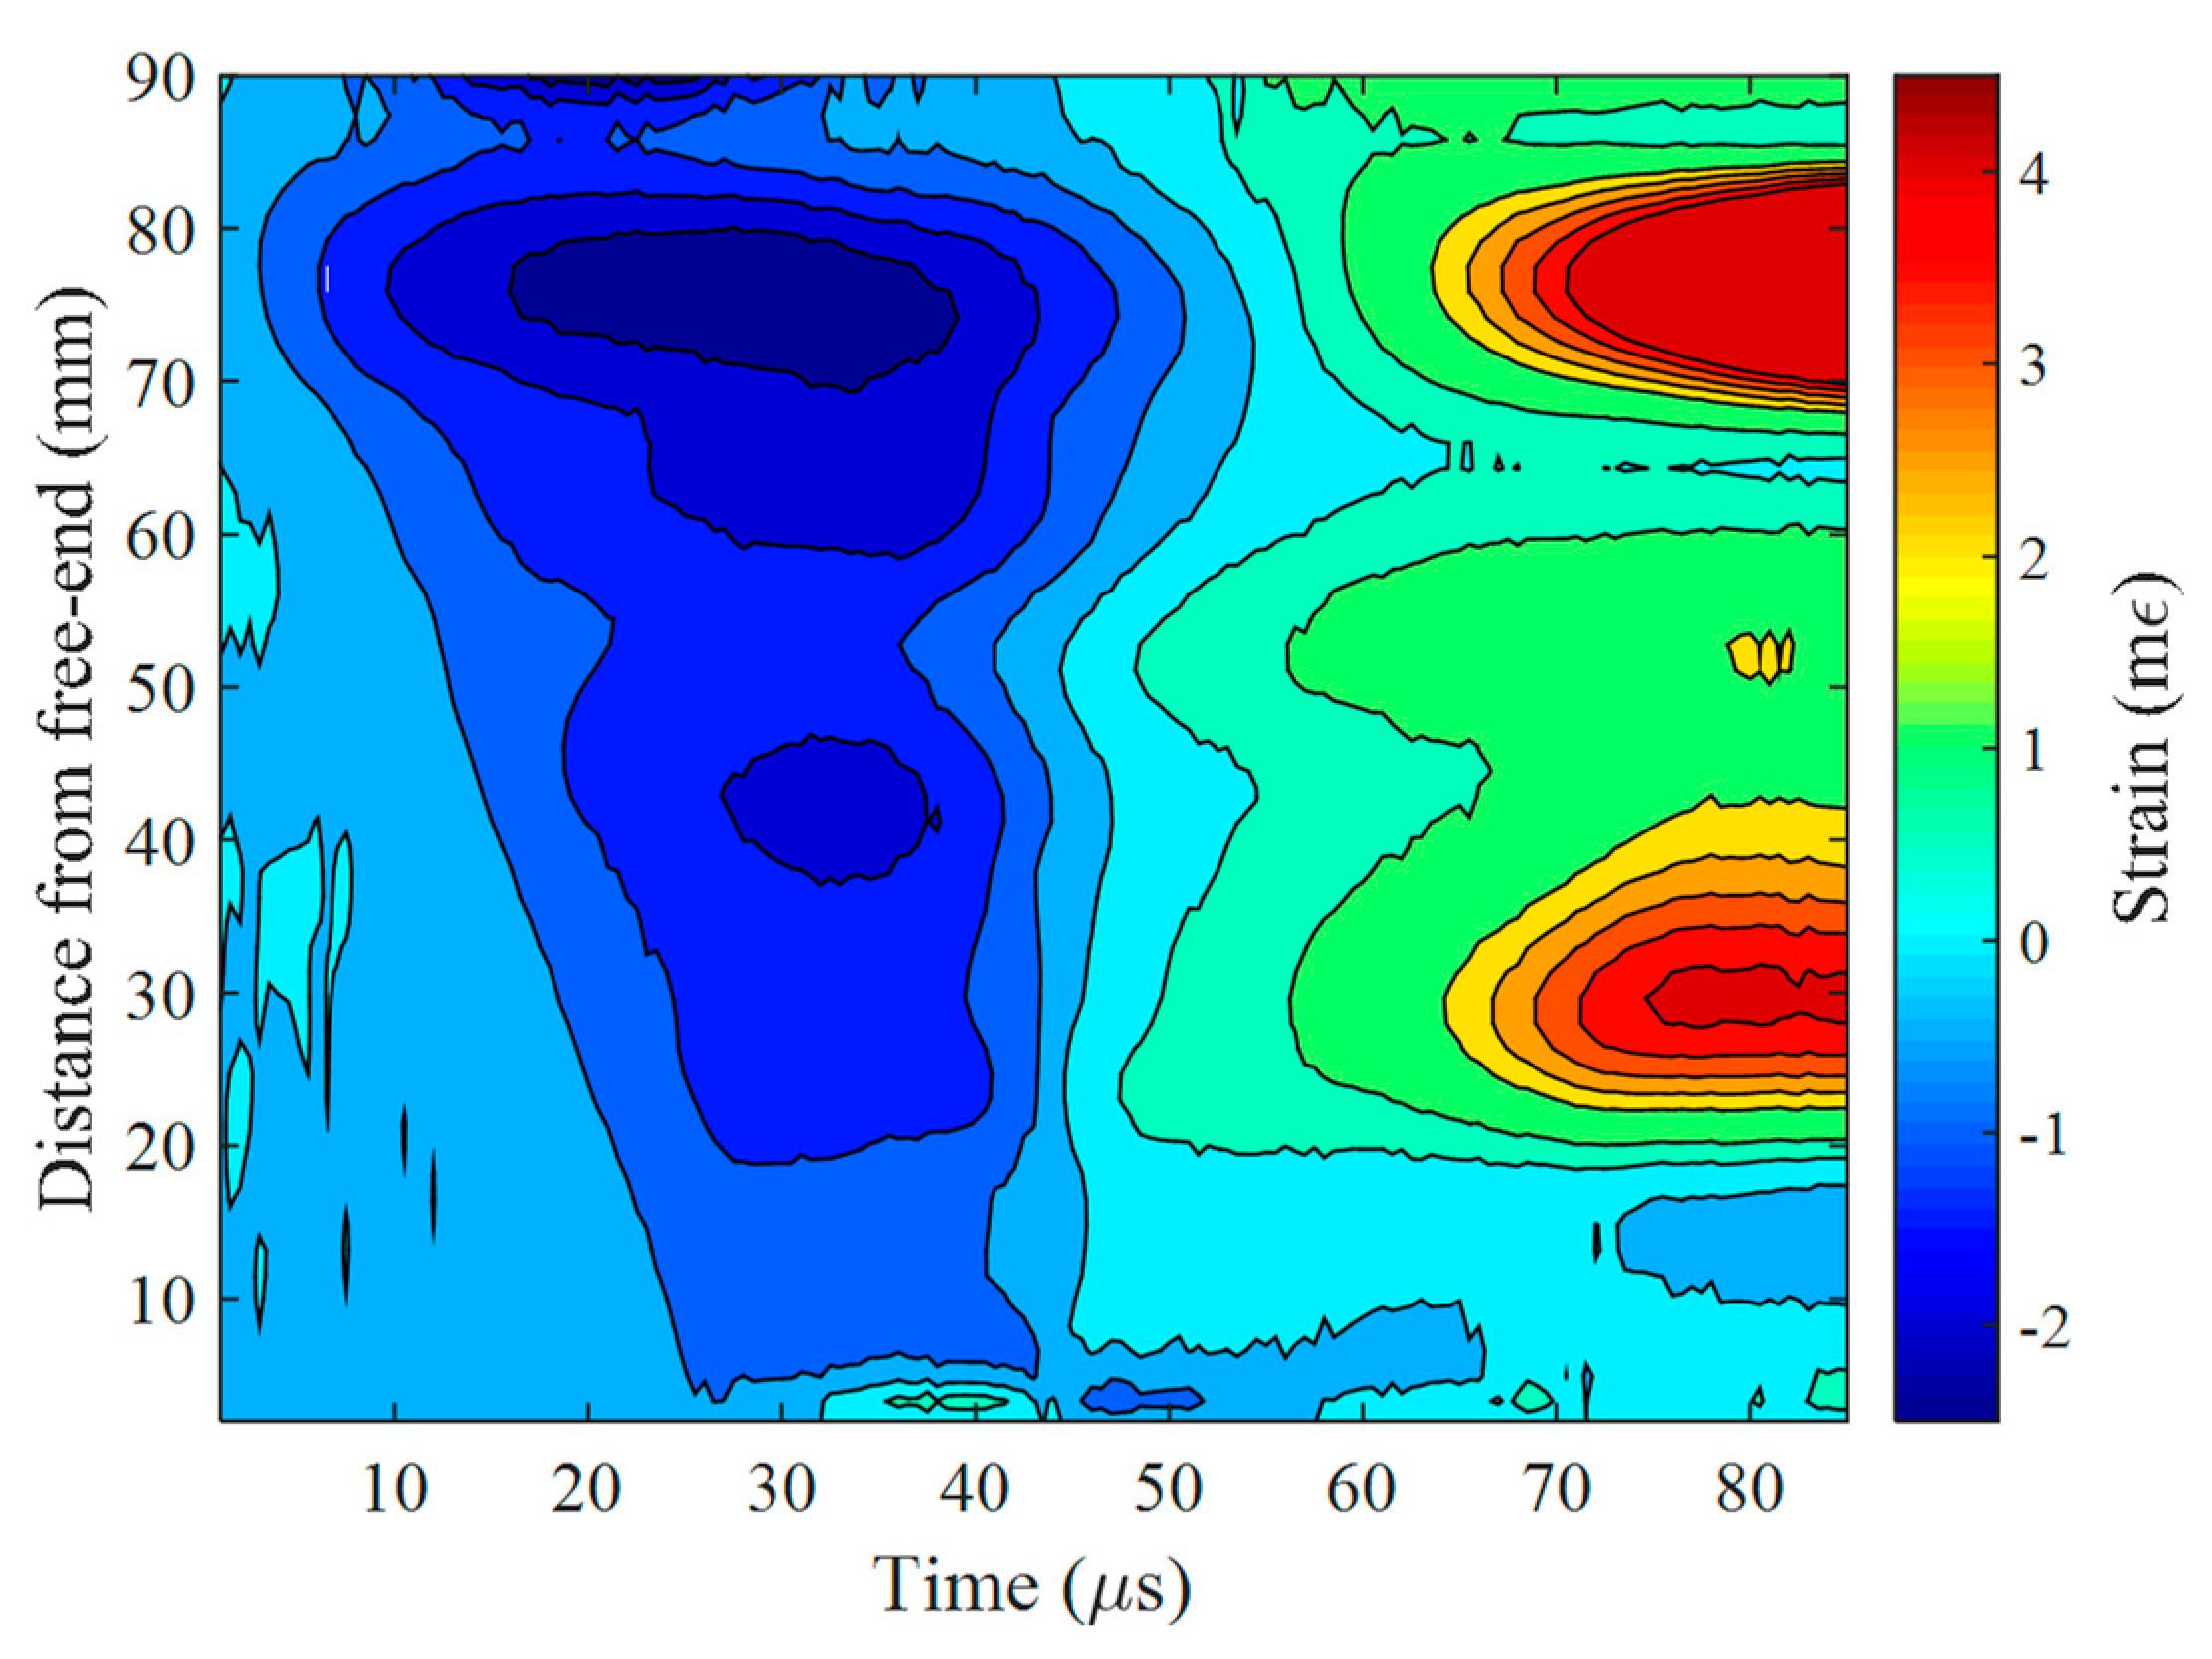
18] which can also be observed as heterogeneous deformation in the compressive part of the loading by analysing the space-time field plot of the section average axial strain in
Figure 6. These zones could indicate the locations of pre-existing cracks (structural defects). From the measured pullback velocity
, the dynamic tensile strength is deduced
to be compared to the quasi-static tensile strength of the tested sandstone
.
3. Edge-On Impact Tests
The edge-on impact (EOI) test aims to investigate the damage modes under impact loading [
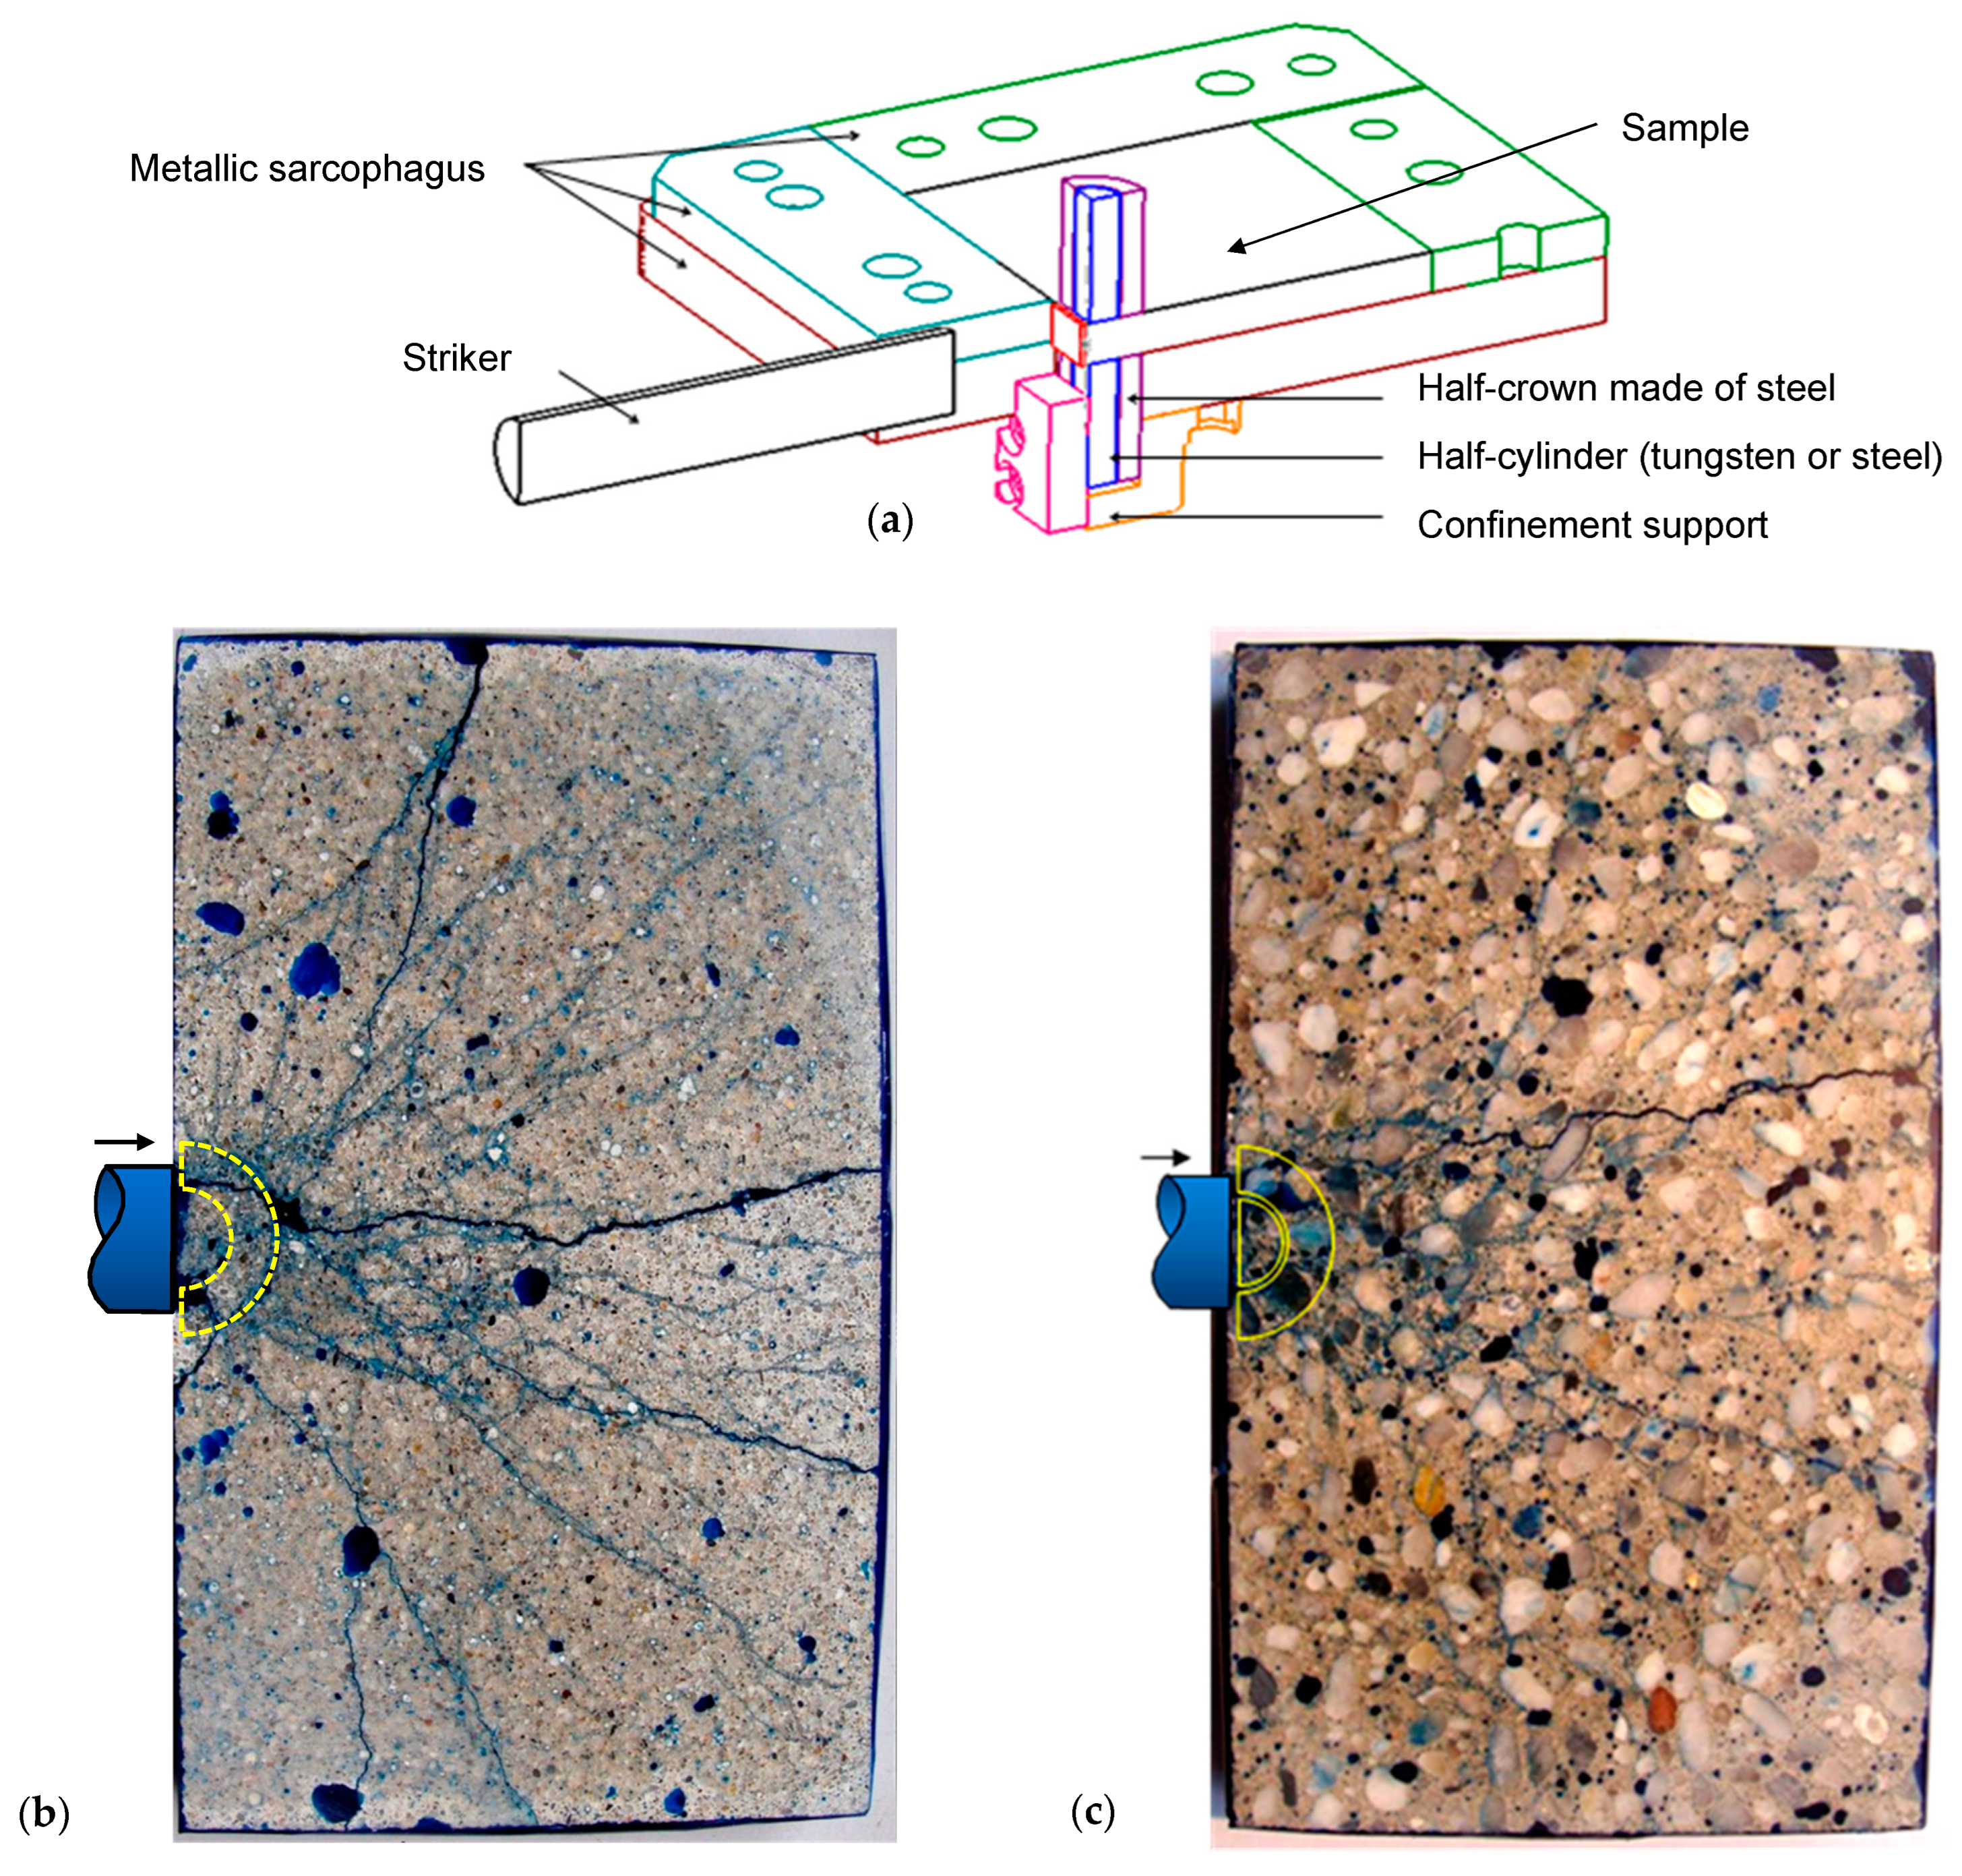
19]. The test is based on the impact of a metallic cylindrical projectile (generally made of steel or an aluminium alloy) that hits a target (concrete, rock, or ceramic tile) on its edge. This test can be performed in two different configurations: the open configuration and the sarcophagus configuration. In the free (open) configuration, the target is visualized using an UHS camera. In the second configuration, the target is encased in a metallic box. In this way, all of the fragments are kept in the same position after impact, making it possible to study the fragmentation pattern (
Figure 7a). However, a small gap (a few tens of mm) is imposed between the metallic box and the target to ensure that the sarcophagus has no influence on the damage process within the impacted target. Results of EOI experiments conducted in open configuration with an ultra-high performance concrete (UHPC) and in sarcophagus configuration with 3 types of concrete—an UHPC, a microconcrete, and a common concrete—tested in wet and dry conditions are reported in [
7]. In these experiments, multiple fragmentation with numerous oriented cracks resulting from tensile hoop stresses was observed (
Figure 7b,c).
A dynamic confinement system is used in both open and sarcophagus configurations to restrain the compressive damage near the impact point and to favour the propagation of the incident wave leading to the tensile damage. This dynamic confinement system can be composed of two half-cylinders and two half-crowns placed in contact with the lateral surfaces near the impact area.
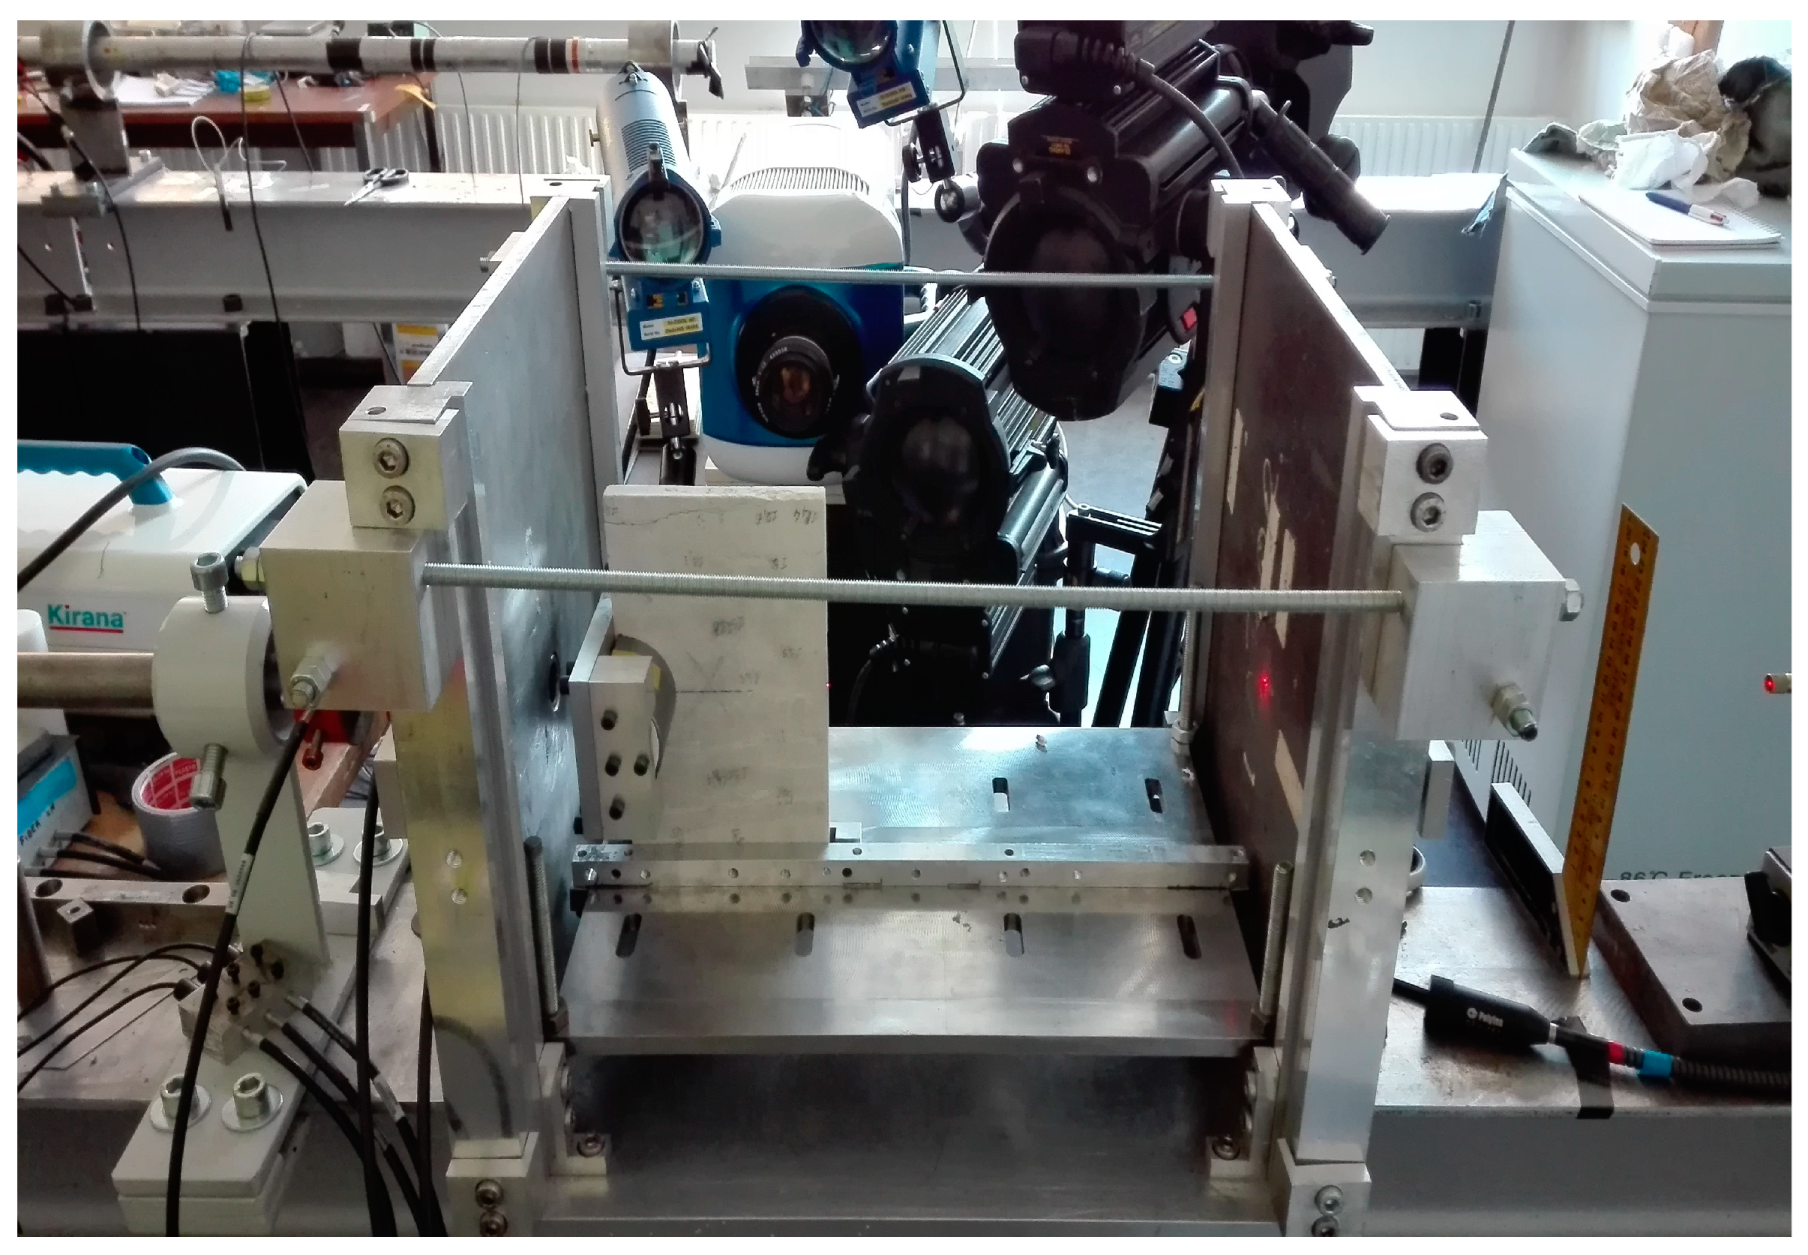
The set-up used as an open configuration in the present work is illustrated in
Figure 8. The dimensions of each target are reported in
Table 3. The target is impacted by a cylindrical projectile, 20.1 mm in diameter and 40 mm in length, made of a high-strength aluminium alloy (elastic limit of about 450 MPa). The dynamic confinement system is composed of two half-cylinders, each 30 mm in diameter and 50 mm in length, and two half-crowns, 31 mm in inner diameter, 60 mm in outer diameter, and 52 mm in length, all made of steel. When the projectile strikes the target, a compressive divergent wave propagates from the impact area through the target, leading to a complex transient dynamic loading made of radial compression stresses and tensile hoop stresses. In the present work, the projectile velocity was set to
in the EOI test performed in open configuration and to
in the EOI test performed in sarcophagus configuration.
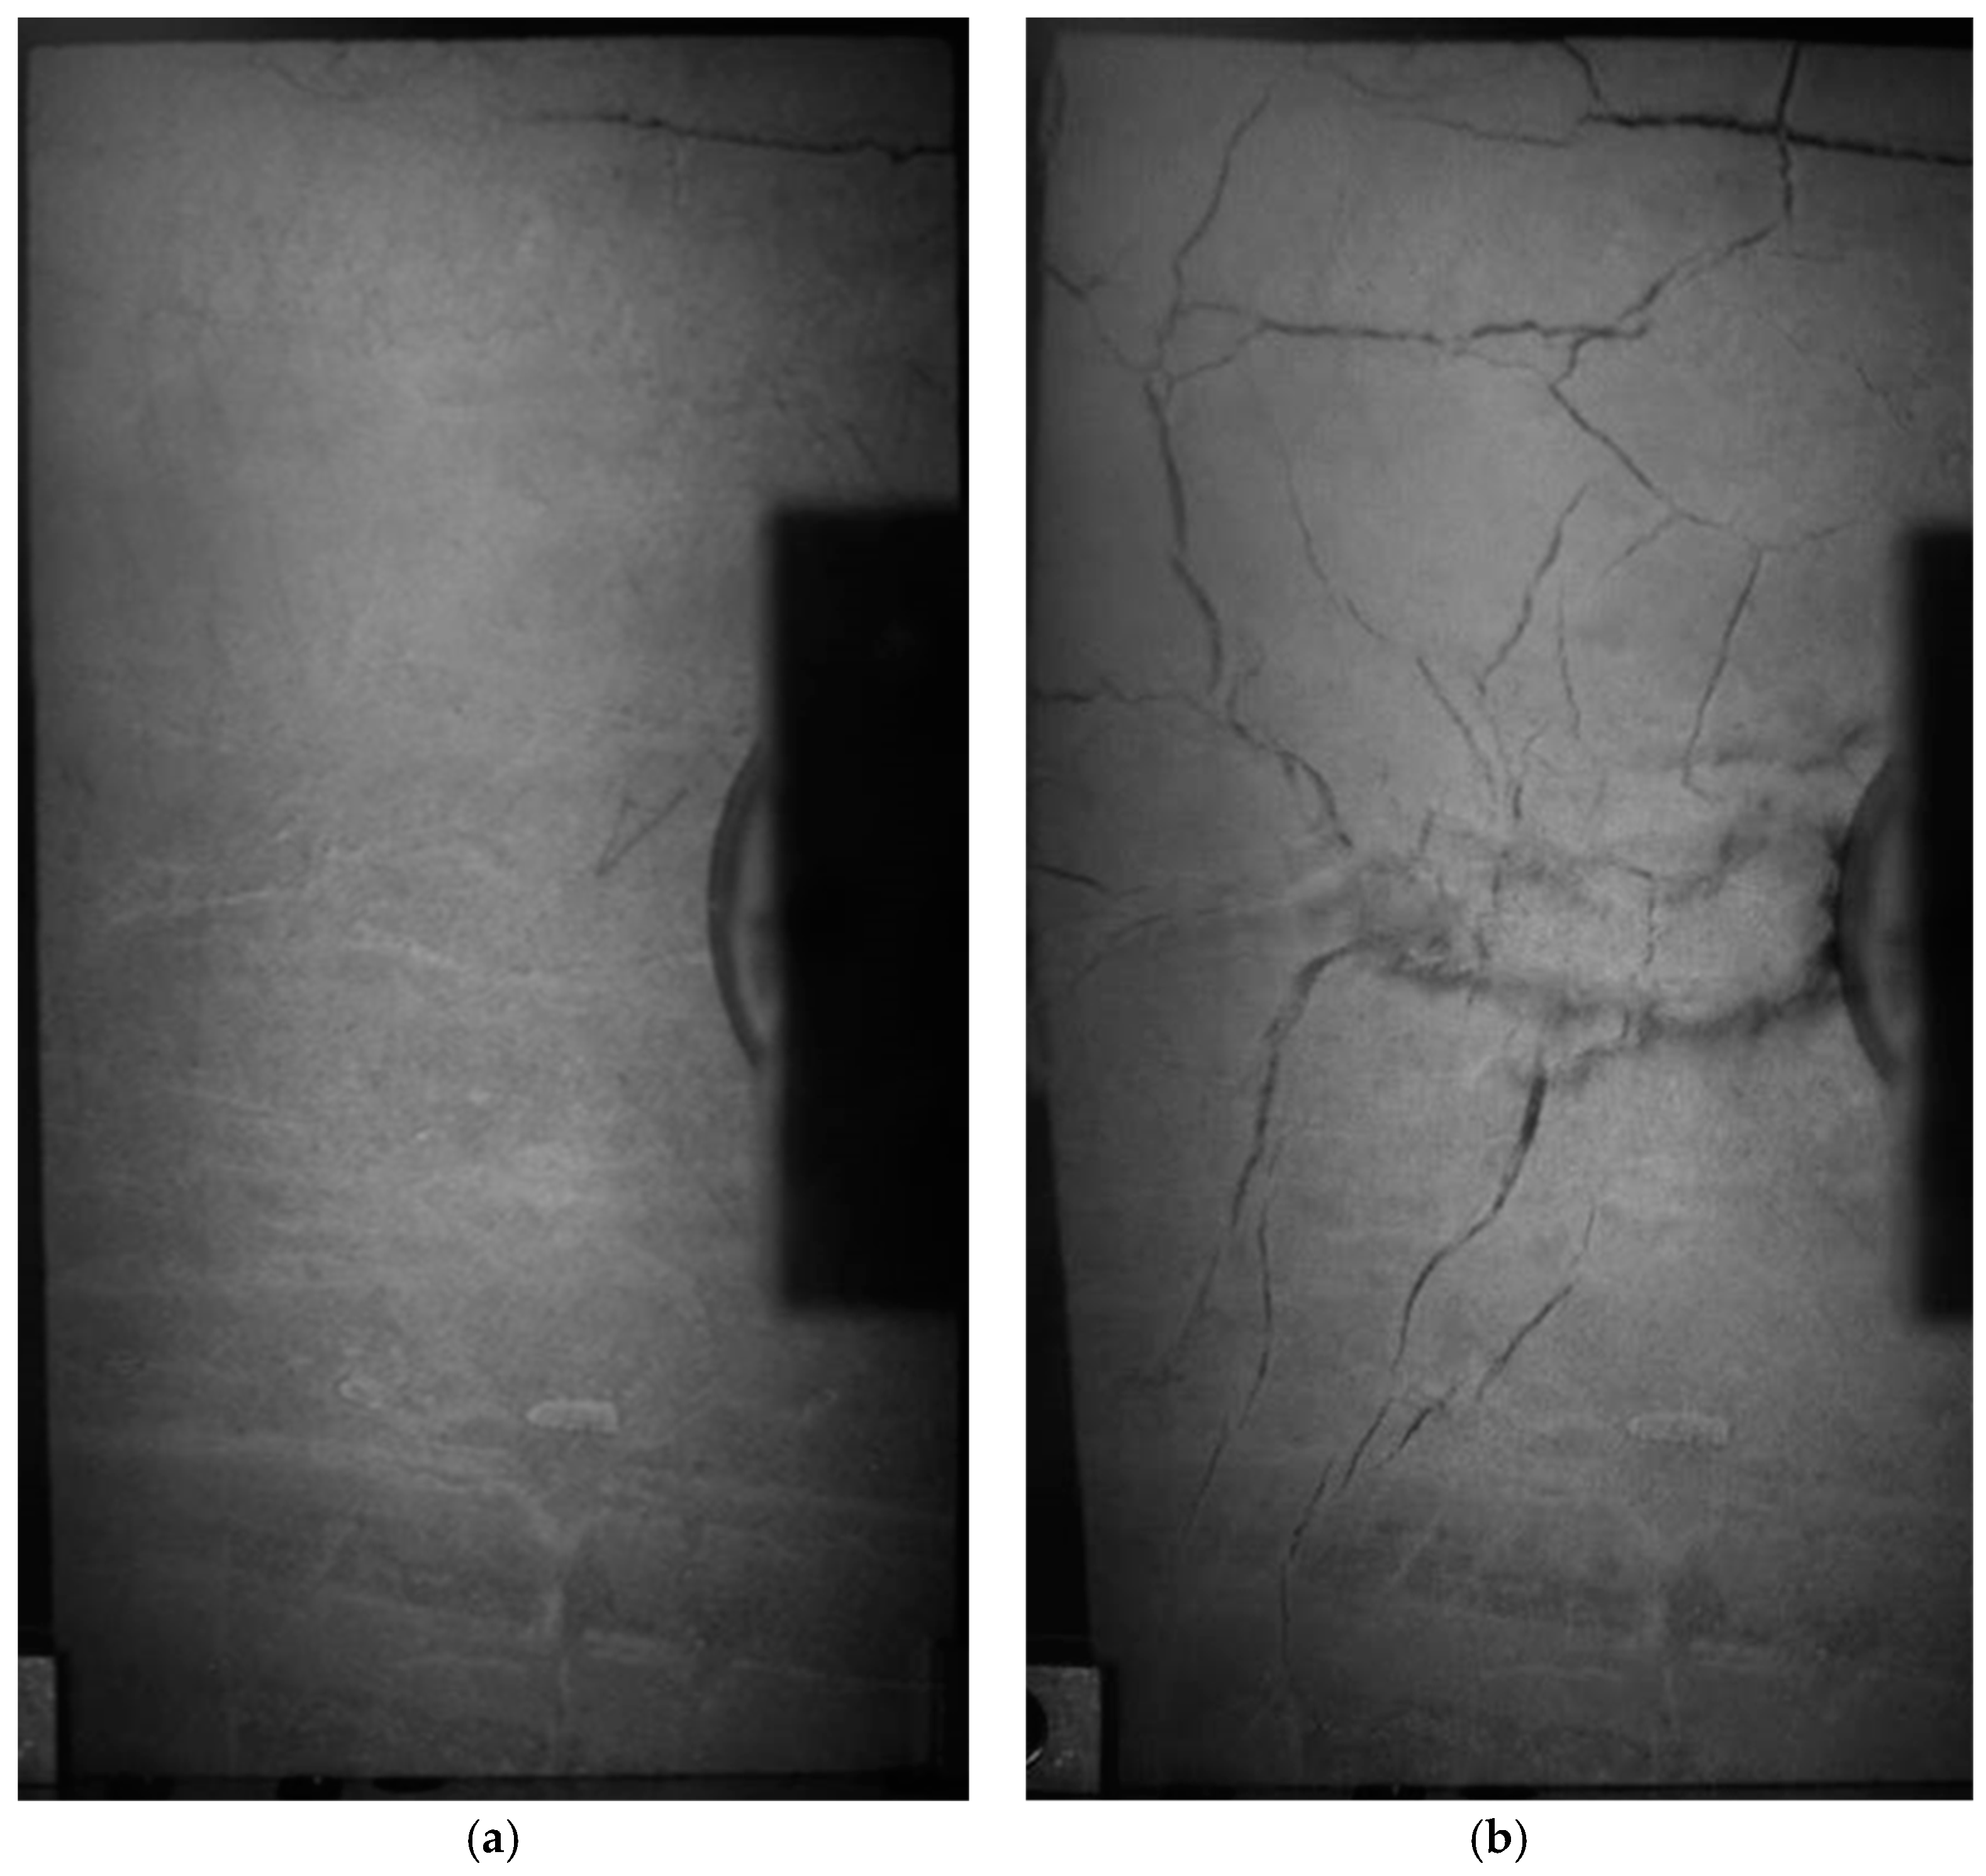
A Kirana ultra-high-speed camera providing 180 pictures with a resolution of 924 × 768 pixels was used in an open configuration with a recording frequency set to 400 kfps. The camera is triggered with a laser interferometer directed to the centre of the target’s rear-edge, with a triggering level set to 2 m/s. Two pictures of the specimen are shown in
Figure 9a before impact and in
Figure 9b after fragmentation in an open configuration. The fragmentation process has a typical duration of
. Already before impact a number of structural defects can be observed. These structural defects seem to favour certain failure paths after impact. Smoke was also ejected from a few fracture surfaces located in the centre of the target. The smoke would correspond to very fine powder induced by frictional mechanisms when pre-existing structural defects are loaded in mode II under compression loading, generating a slip on the crack lips.
In addition, a large number of cracks are observed after impact without clear preferential orientation, whereas radial cracks are usually observed in edge-on impacts performed in geomaterials without pre-existing structural defects [
19,
20] (
Figure 7). In conclusion, the damage pattern appears to be strongly influenced by the pre-existing structural defect network that seems to have weakened the impacted target.
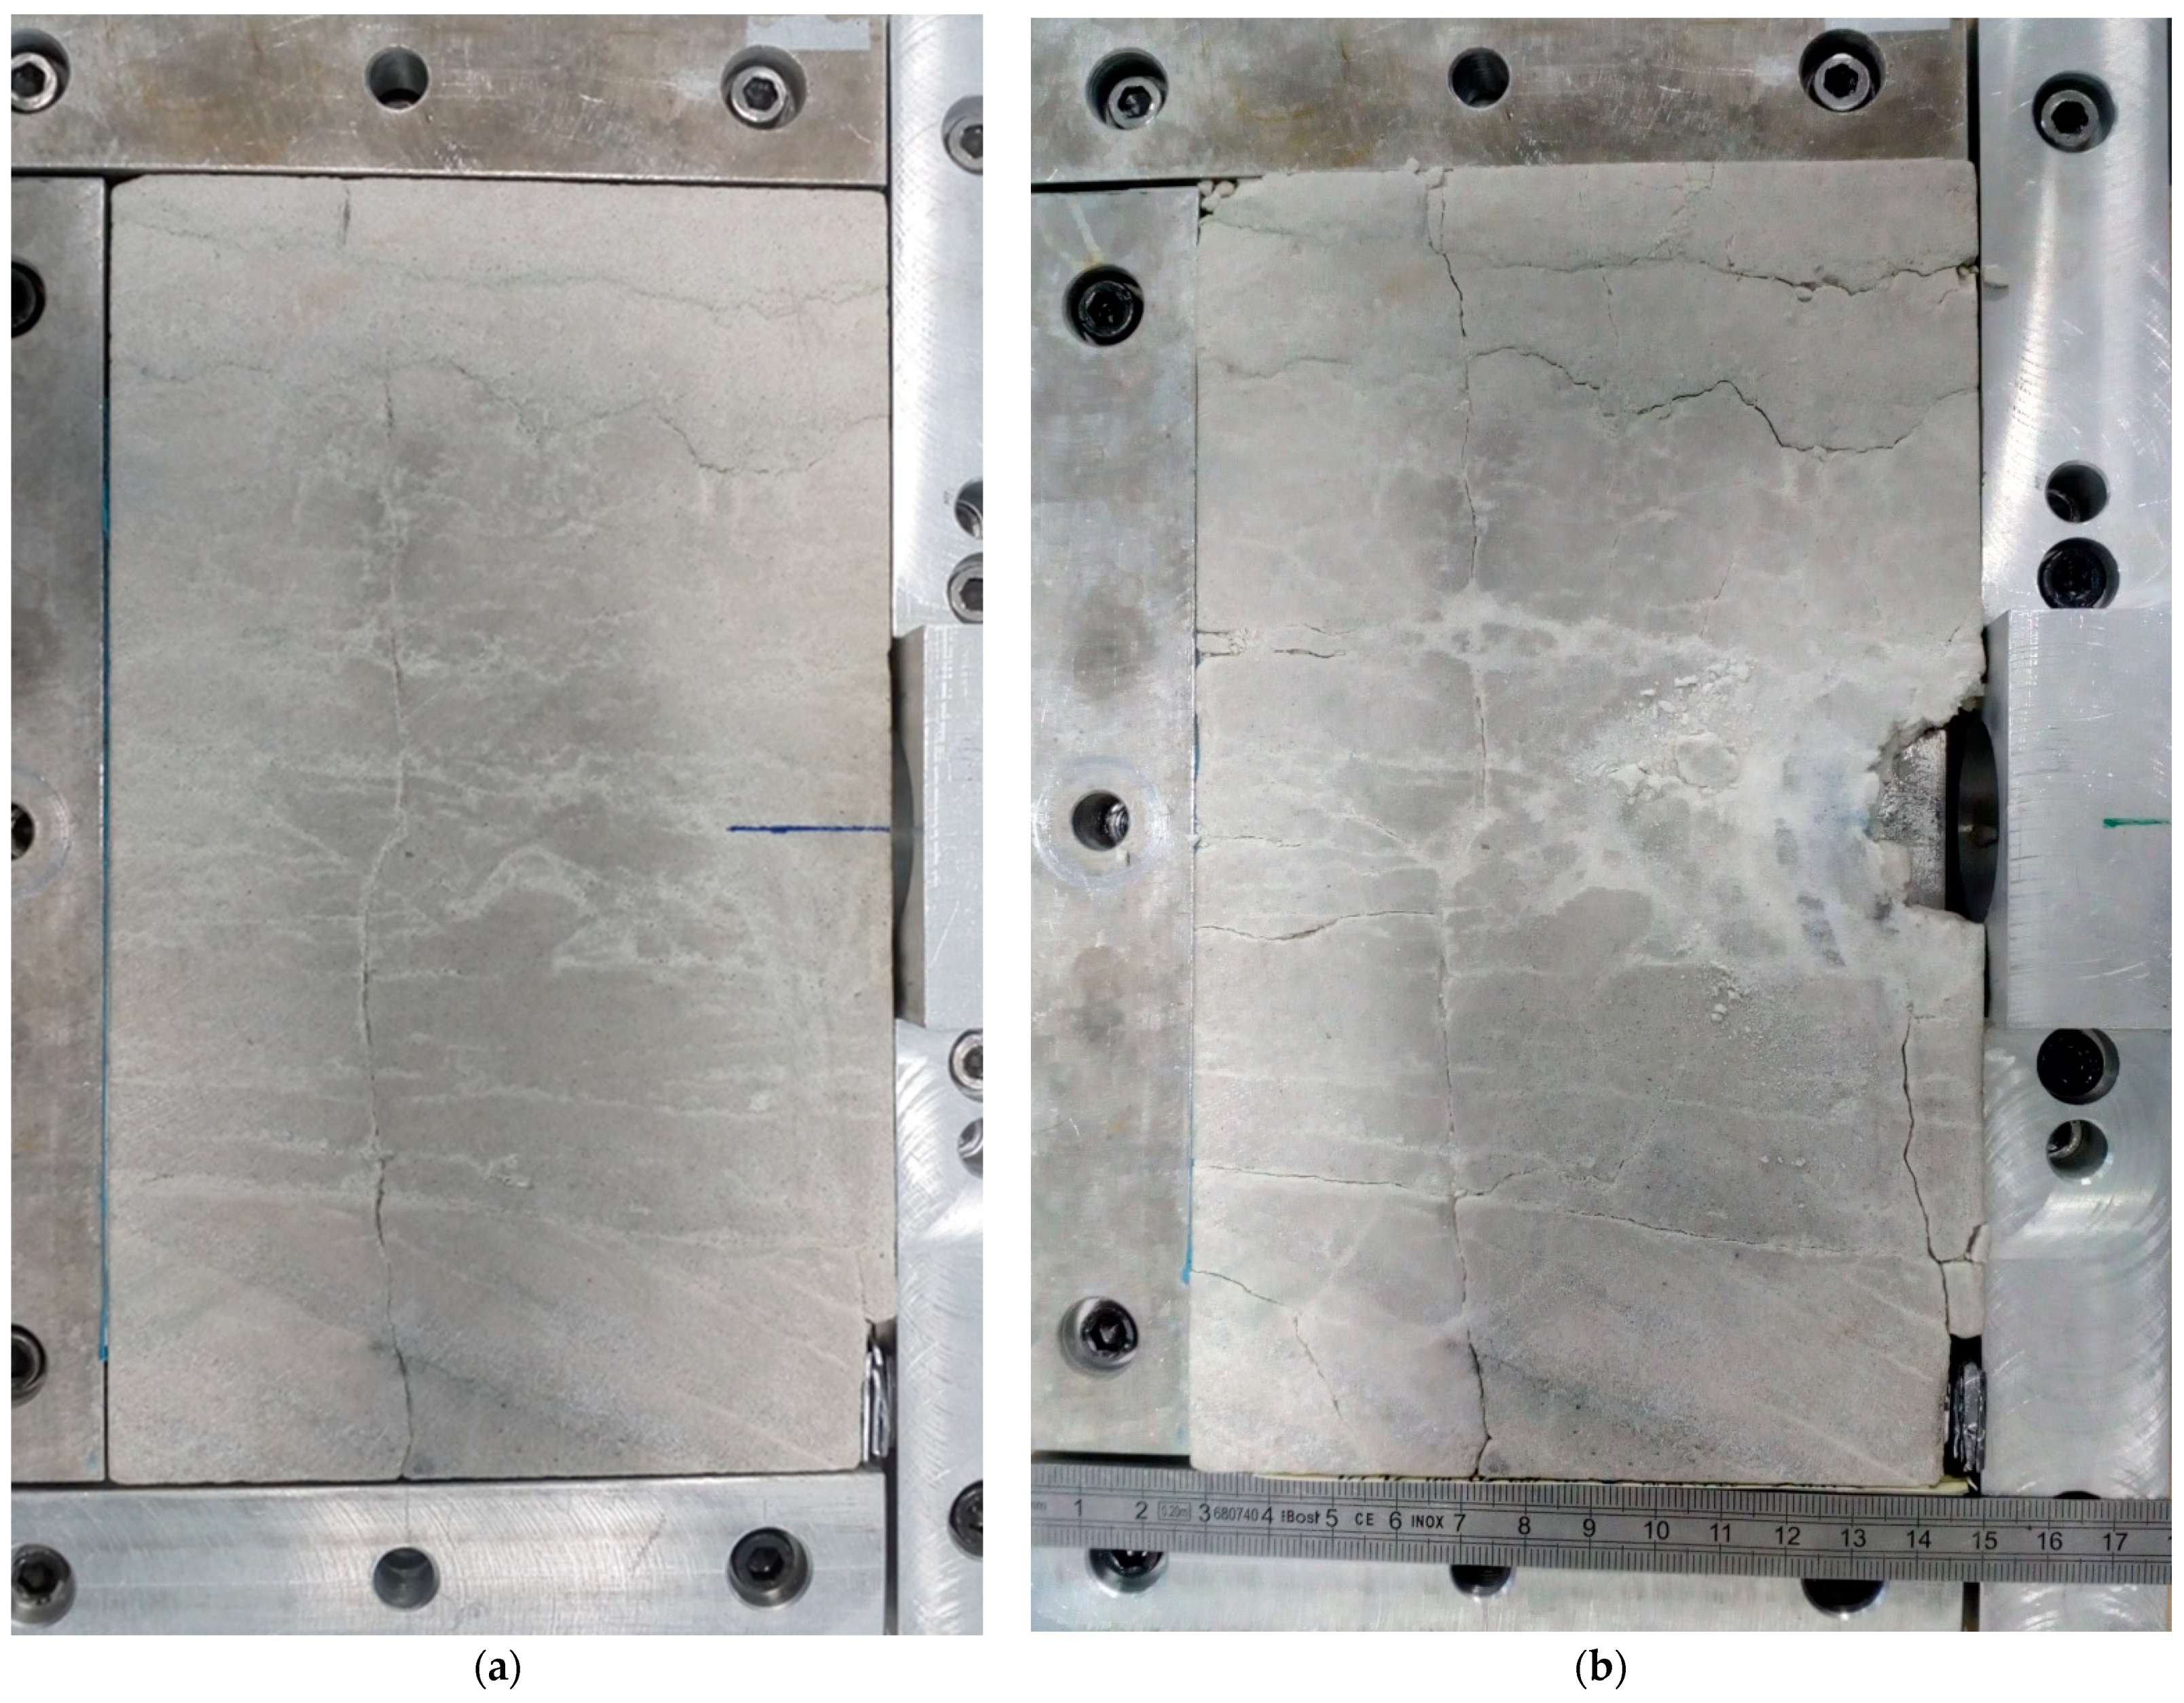
The same test was performed in a sarcophagus configuration at almost the same impact velocity. Again, pre-existing structural defects are clearly observed prior to impact (
Figure 10a). These structural defects can be separated into two families: black and white structural defects. Black structural defects would correspond to very low cohesion strength surfaces, whereas white structural defects might correspond to higher cohesion strength defects. After impact (
Figure 10b), the black structural defects are clearly opened, while the white structural defects are partially opened. In addition, a fine white powder is again visible in the centre of the target, just beyond the confinement system. Furthermore, the cracking density seems to be much higher in the vicinity of the dynamic confinement system.
In conclusion, these experiments have highlighted the importance of the pre-existing cracks in the material on the fragmentation process at high strain rates. Pre-existing defects play the role of “fuse” favouring the opening of pre-existing cracks in mode I and the sliding of cracks in mode II while also preventing the fragmentation of the material from less critical defects.
4. Numerical Analysis of EOI Test and Spalling Test
The edge-on impact experiments performed in an open configuration were numerically simulated with the Abaqus-explicit Finite-Element code. The target, 200 mm in height, 120 mm in width, and 14 mm in thickness, is impacted by a cylindrical projectile (D20.1 × H40) made of a high-strength aluminium alloy. The confinement system is represented by a half cylinder, 60 mm in diameter and 52 mm in length, made of high-strength steel. The half-cylinder is 1 mm shifted from the target front edge, as in the experiments. The three solids are meshed with “C3D8R” eight-node solid brick elements with reduced integration and a mesh size of 1 mm to 2.5 mm. The two symmetry planes associated with the problem made it possible to only analyse a quarter of the projectile-target configuration. The projectile and confinement system are modelled considering an elastic-perfectly-plastic behaviour with the parameters reported in
Table 4.
A first numerical simulation of the EOI test was conducted with the objective of analysing the stress field induced by the impact loading. To do so, the KST model was considered for the target. The parameters related to the volumetric and deviatoric responses were identified from quasi-oedometric compression tests reported in [
1] (
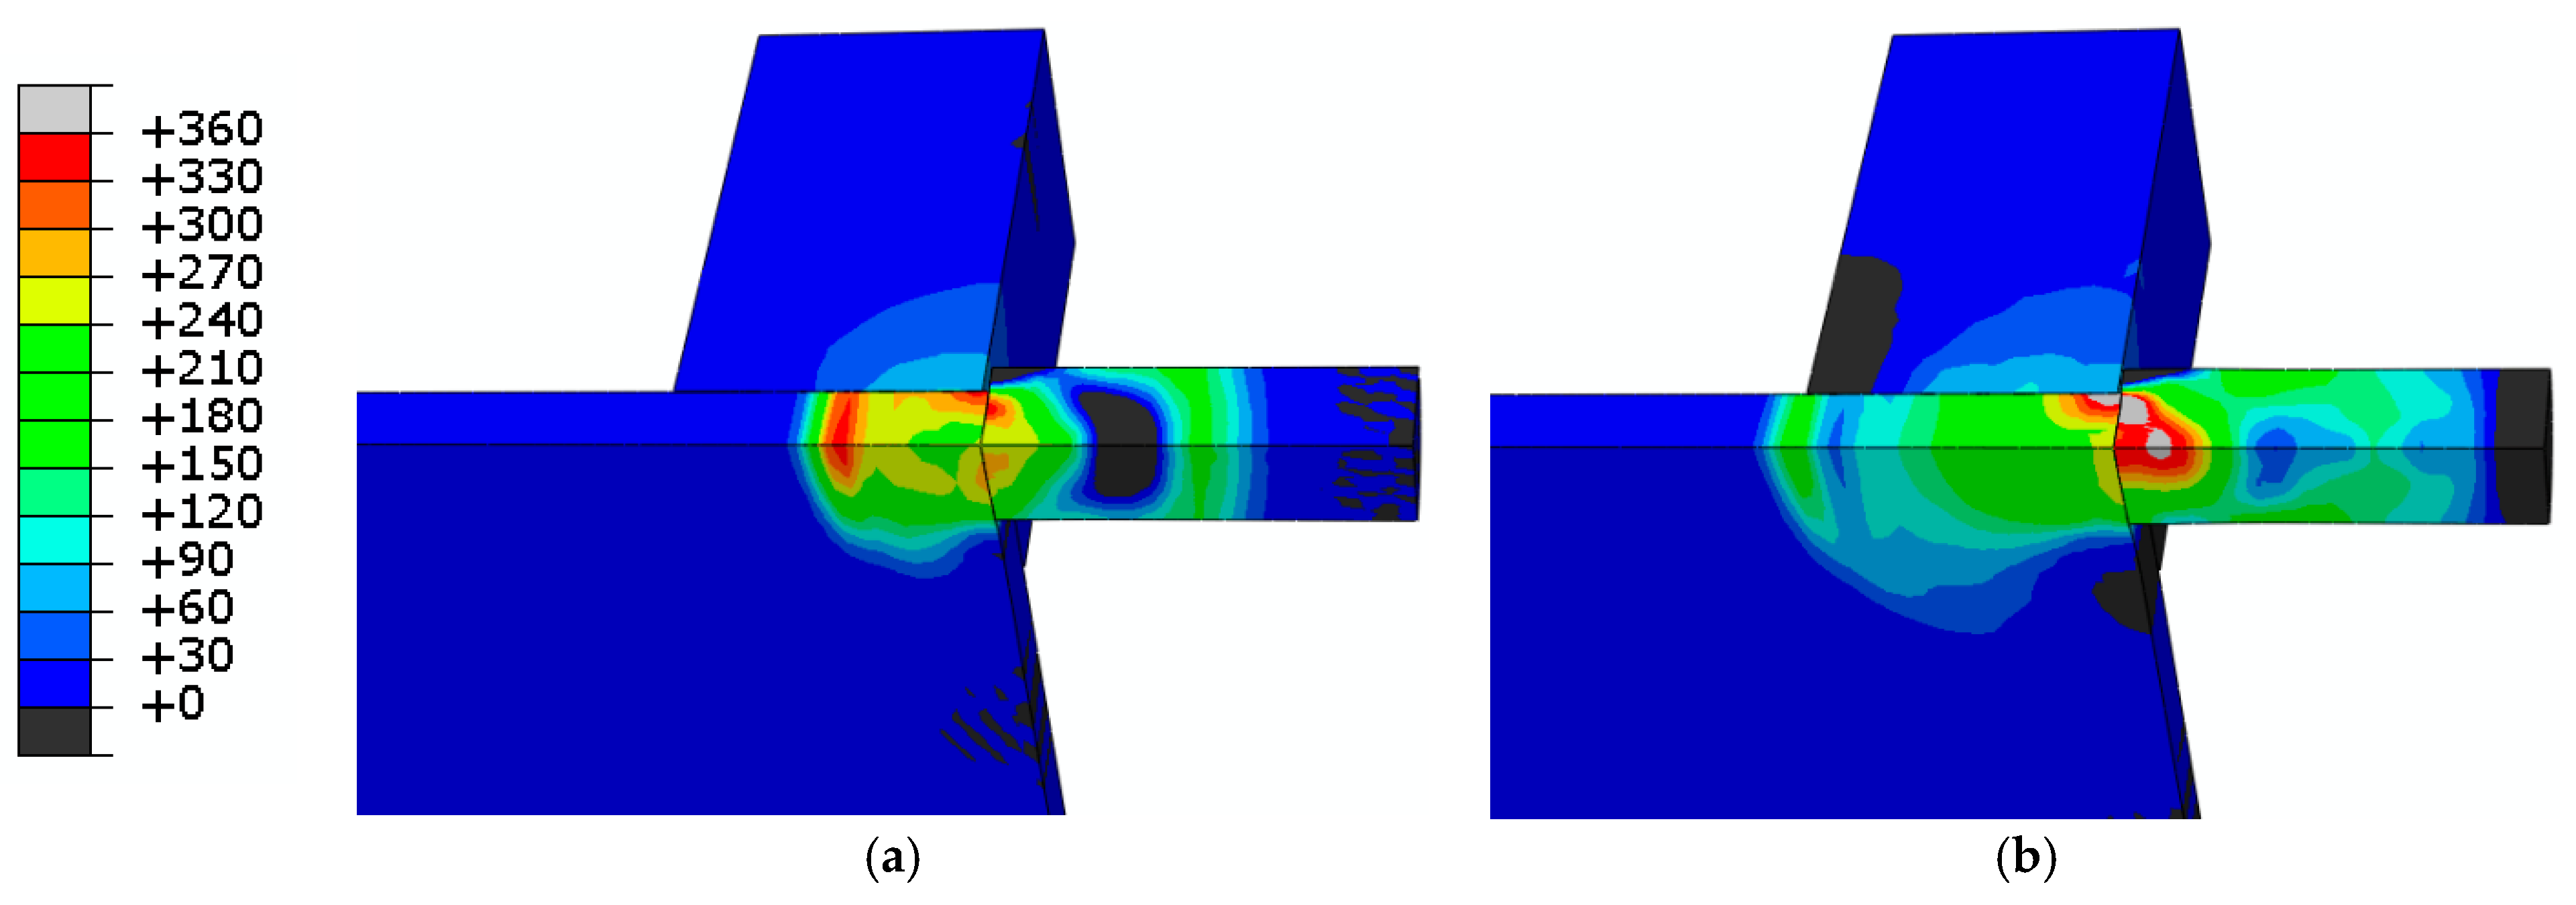
Table 4). Pressure as high as 360 MPa is observed at 4 µs beneath the confinement system (
Figure 11a). However, pressure rapidly goes down to 180 MPa at 8 µs (
Figure 11b). It can be concluded that the quasi-oedometric compression tests provided a calibration of the KST model in the correct range of pressure. It is also observed that the minimum value of volumetric strain does not exceed −0.8% beyond the confined area, which corresponds to a level of hydrostatic pressure less than 120 MPa. This matches a quite low level of compaction and shearing deformation. Therefore, in the second midsection of the target, a minimal amount of compression damage is expected. However, according to
Figure 12a,b a wide field of tensile stresses spreads out the target beyond the confined area. These tensile stresses mainly correspond to hoop stresses in a cylindrical frame centred on the impact point. Given the amplitude of tensile stresses (up to 24 and 33 MPa, respectively, at 20 µs and 36 µs) and the range of measured strengths in 3-point bending tests (from 0.673 to 2.989 MPa), a large network of radial cracks can be expected in the absence of structural defects.
This assumption is confirmed by the second numerical simulation performed in order to illustrate the potential influence of a single structural defect on the final damage pattern of the target. Two calculations, with and without a structural defect, were conducted in which the KST-DFH model was used as the constitutive model for the target. The DFH model is a micromechanical model that provides a description of the multiple fragmentation processes involved in brittle materials at high strain rates in terms of crack inception, crack propagation, and obscuration of critical defects from propagating cracks. The main DFH model parameters are, on the one hand, the parameters driving the density of critical defects. The Weibull parameters identified from 3-point bending tests are used as input in the DFH model for this purpose. On the other hand, a set of parameters driving the growth of obscuration zones is defined. The volume of obscuration zones is related to
S, a shape parameter, and to the crack speed that is assumed to be constant (
Vcrack =
kC0) where k is a dimensionless parameter and
C0 the 1D wave speed defined in Equation (2). These parameters and other parameters of the DFH model are summarized in
Table 4.
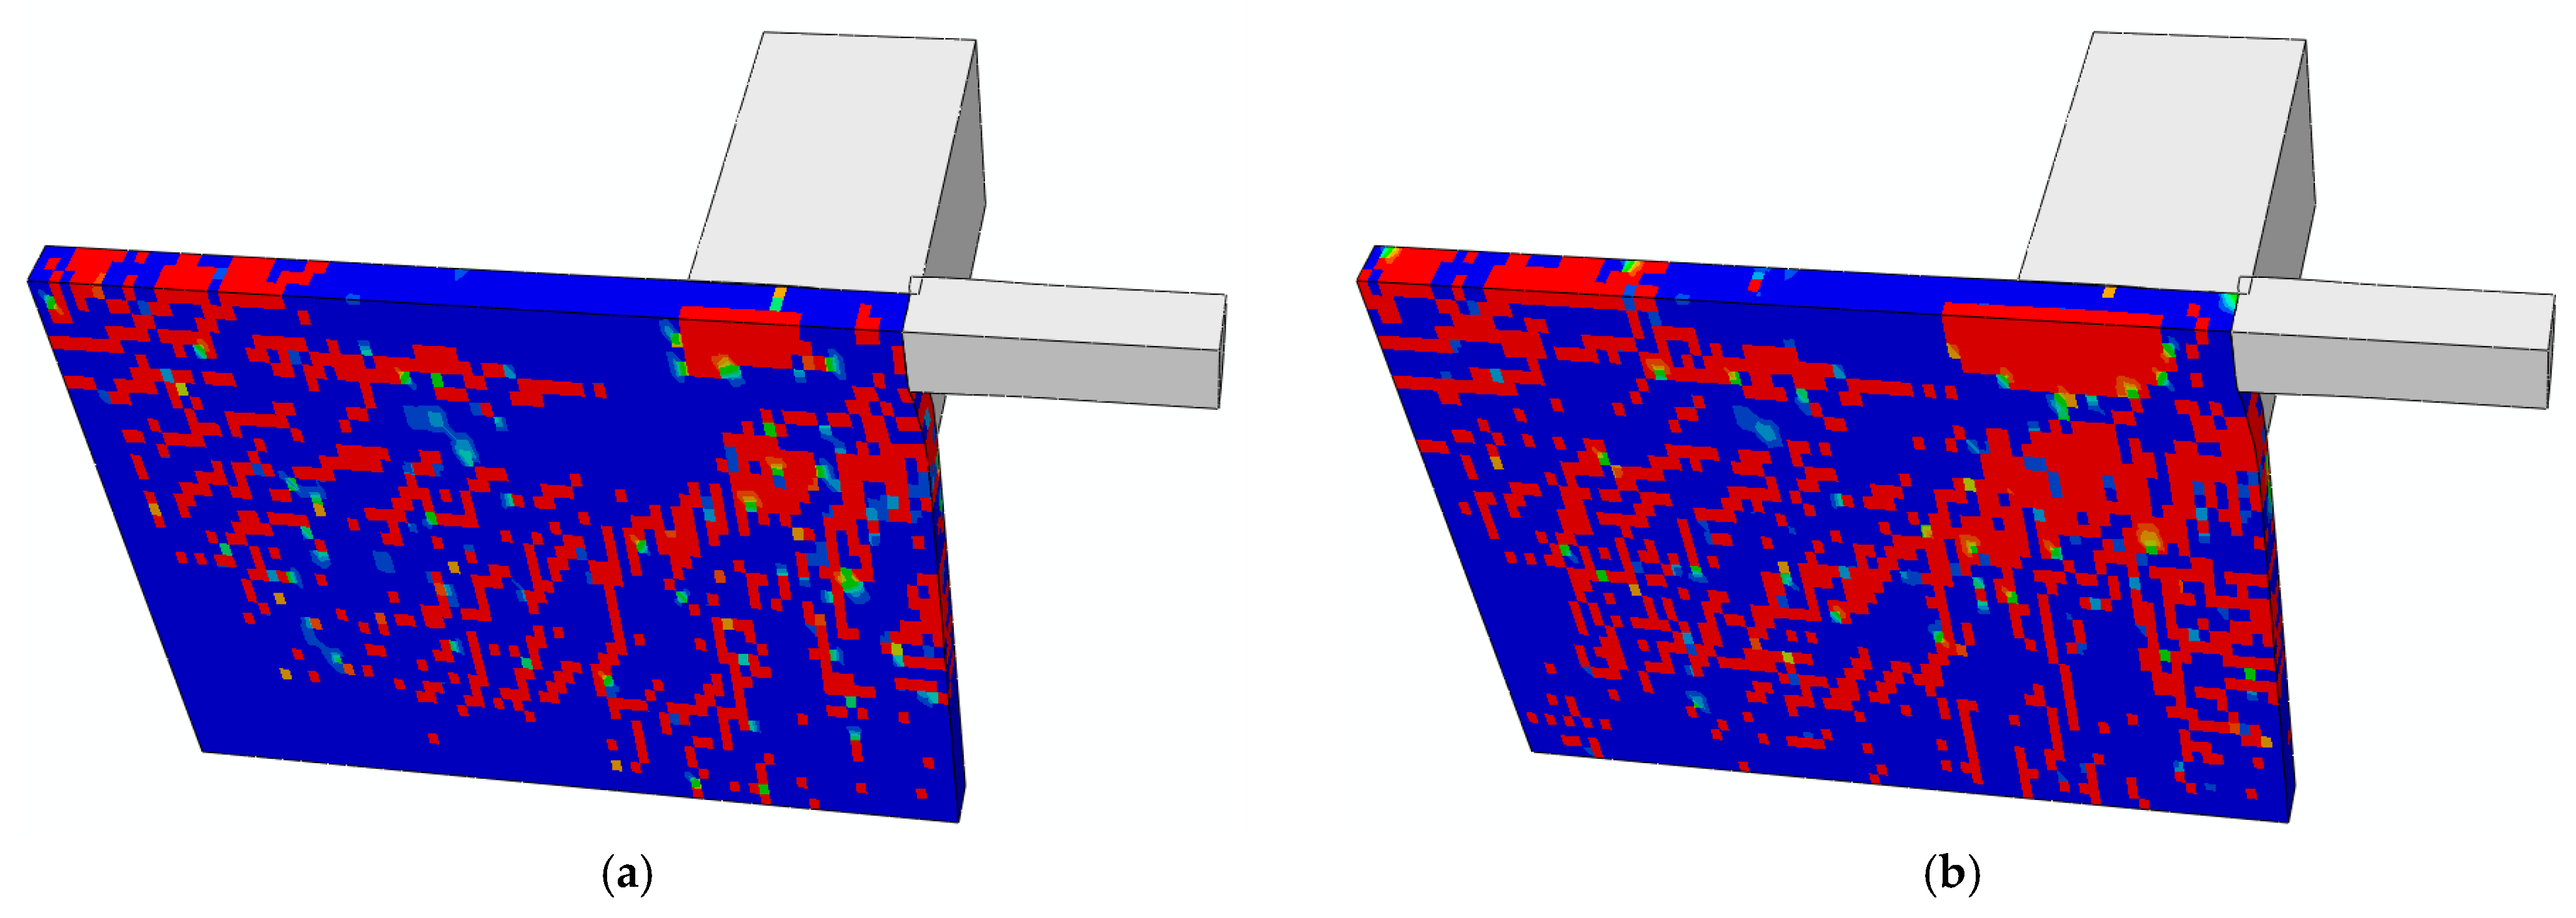
Figure 13a,b show the damage variable
D1 associated with the first principle stress in the case with no structural defect. A large network of cracks oriented mainly radially in a cylindrical frame, centred on the impact point, is observed mainly in the second mid-part of the target. These numerical predictions appear to strongly differ from observations from the ultra-high-speed camera and from the post-mortem observations made in the sarcophagus configuration (
Figure 9 and
Figure 10). Indeed, whereas large pre-existing defects favour the opening of cracks in mode I and the sliding of cracks in mode II no evidence of a radial cracking network can be found. In order to explain the gap between experimental and numerical results the following explanations can be suggested:
- -
Assume that the structural defects alone contribute to the failures during the 3-point-bending tests. In such a situation, the Weibull parameters related to strength distribution of intrinsic defects (non-structural defects) could be strongly underestimated. This would result (in the numerical simulations) in an overestimation of damage related to these defects (lack of identification).
- -
Structural defects could have played a role of a fuse, preventing the triggering and propagation of cracks from intrinsic defects (obscuration mechanism)
- -
Structural defects could have prevented the compression wave from propagating through the target (impedance failure mechanism)
- -
Radial crack openings are too small to be seen
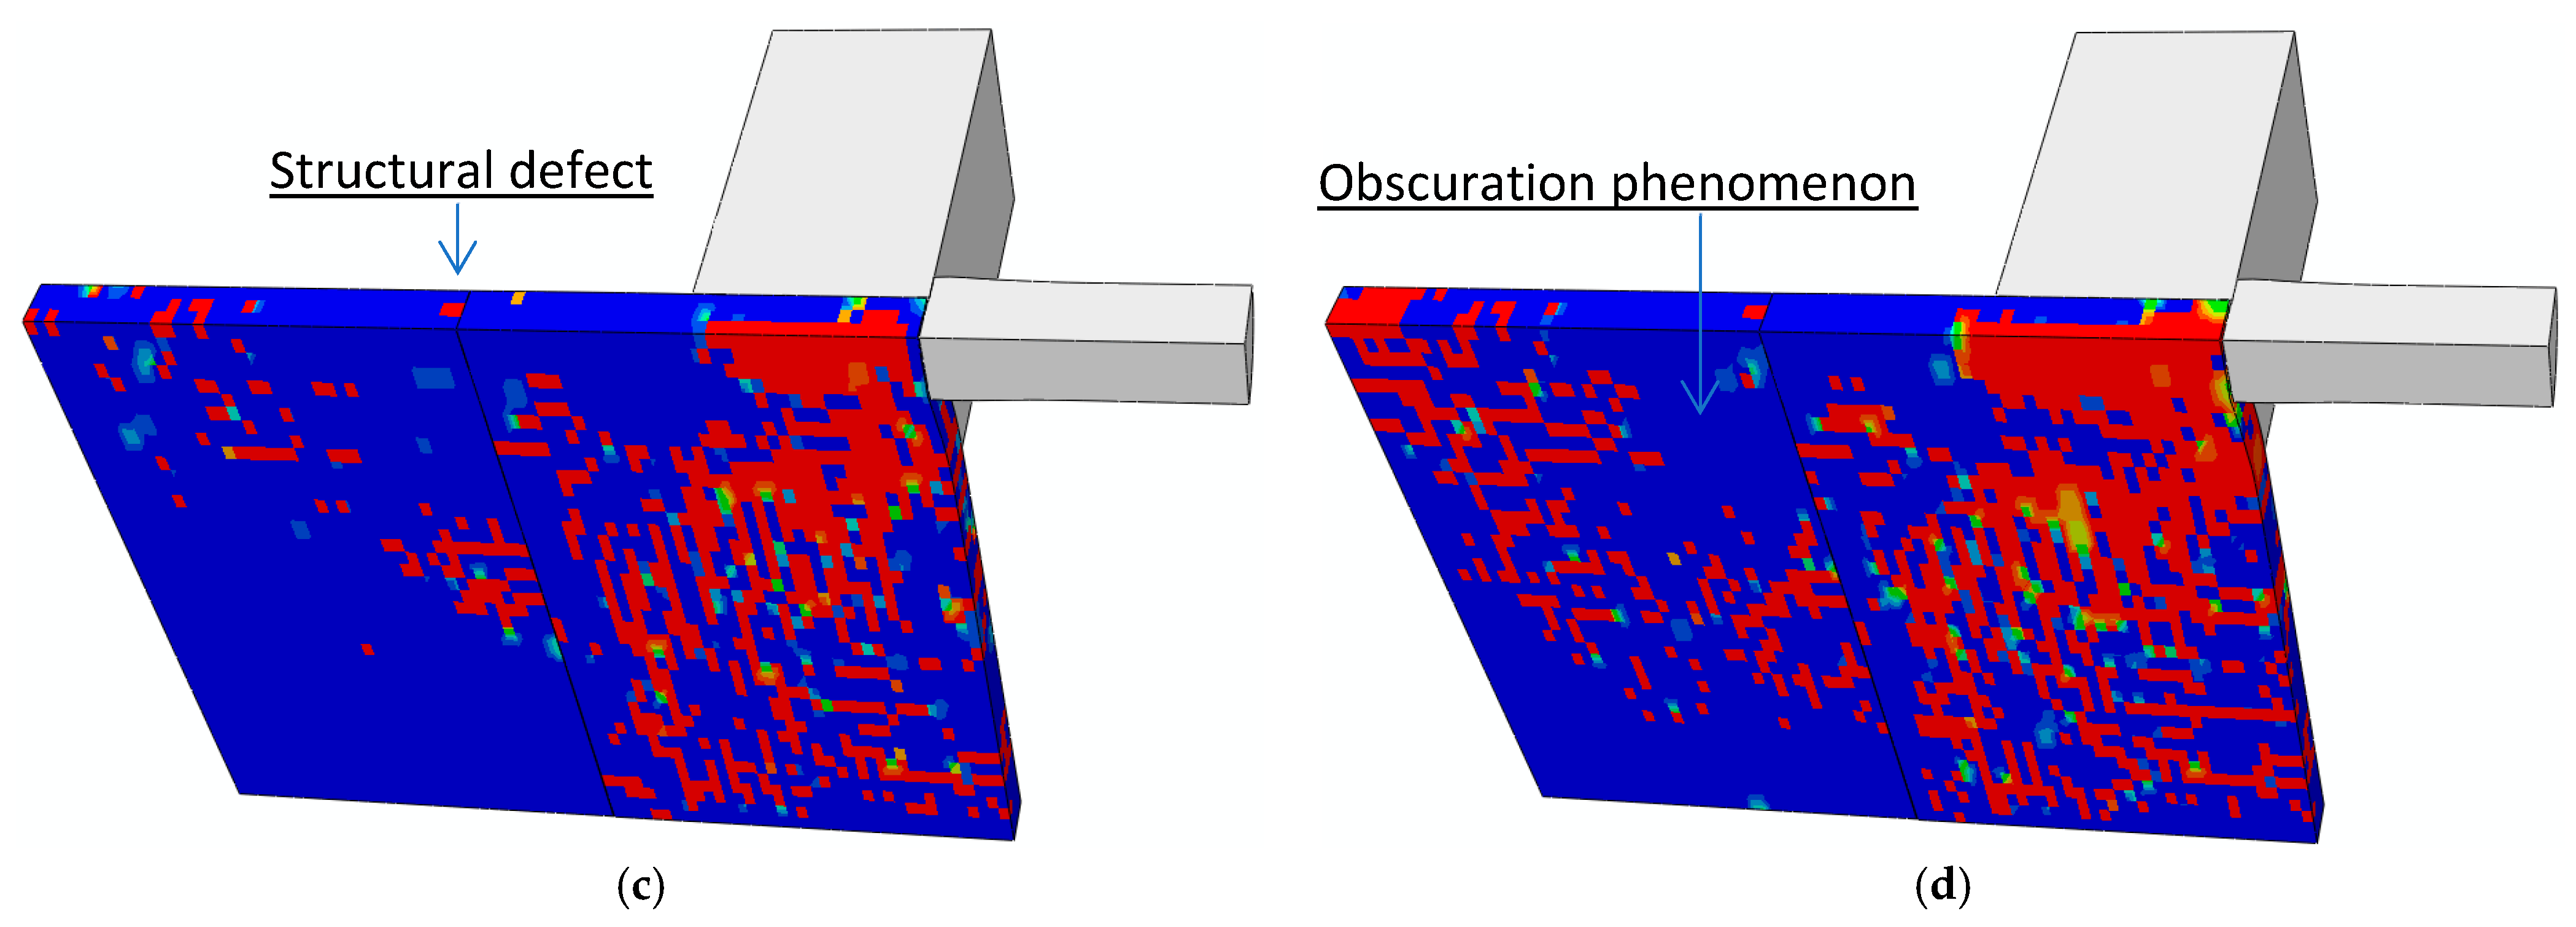
A combination of several of these assumptions is possible, even if the first three assumptions seem to be the most likely to occur. A final numerical simulation including a single structural defect was developed in an attempt to demonstrate the potential influence of a structural defect (
Figure 13c,d). To do so, the mesh of the target was split into two parts, both of which were modelled with the KST-DFH model while considering the parameters used in the previous numerical simulation. The splitting plane corresponds to a gap of 0.1 mm located halfway between the front edge and the rear edge (
Figure 13c). This value was defined assuming that the curve foot in uniaxial compression tests (with an initial strain ranging from 7 × 10
−4 to 1.4 × 10
−3) would correspond to one or two horizontal structural defects with an opening of 0.1 mm (the sample length being 140 mm). The field of damage variable
D1 associated with the first principle stress is illustrated in
Figure 13c (T = 40 µs) and
Figure 13d (T = 48 µs). Several observations can be made:
- -
At T = 40 µs, the amount of damage is strongly reduced in the second part of the target. However, due to impedance breakage, a few short cracks develop in the first part of the target close to the midplane, following a longitudinal (axial) orientation (perpendicularly to the splitting plane).
- -
At T = 48 µs, whereas in the area far from the structural defect the amount of damage tends to what was observed without structural defect (
Figure 13a,b) the area close to the structural defect remains likely undamaged. This demonstrates that structural defects might prevent or at least reduce the growth of damage in their vicinity.
Finally, it can be concluded that the influence of structural defects cannot be ignored. This concerns the identification strategy of model parameters (Weibull parameters) as well as their explicit representation in the numerical modelling.
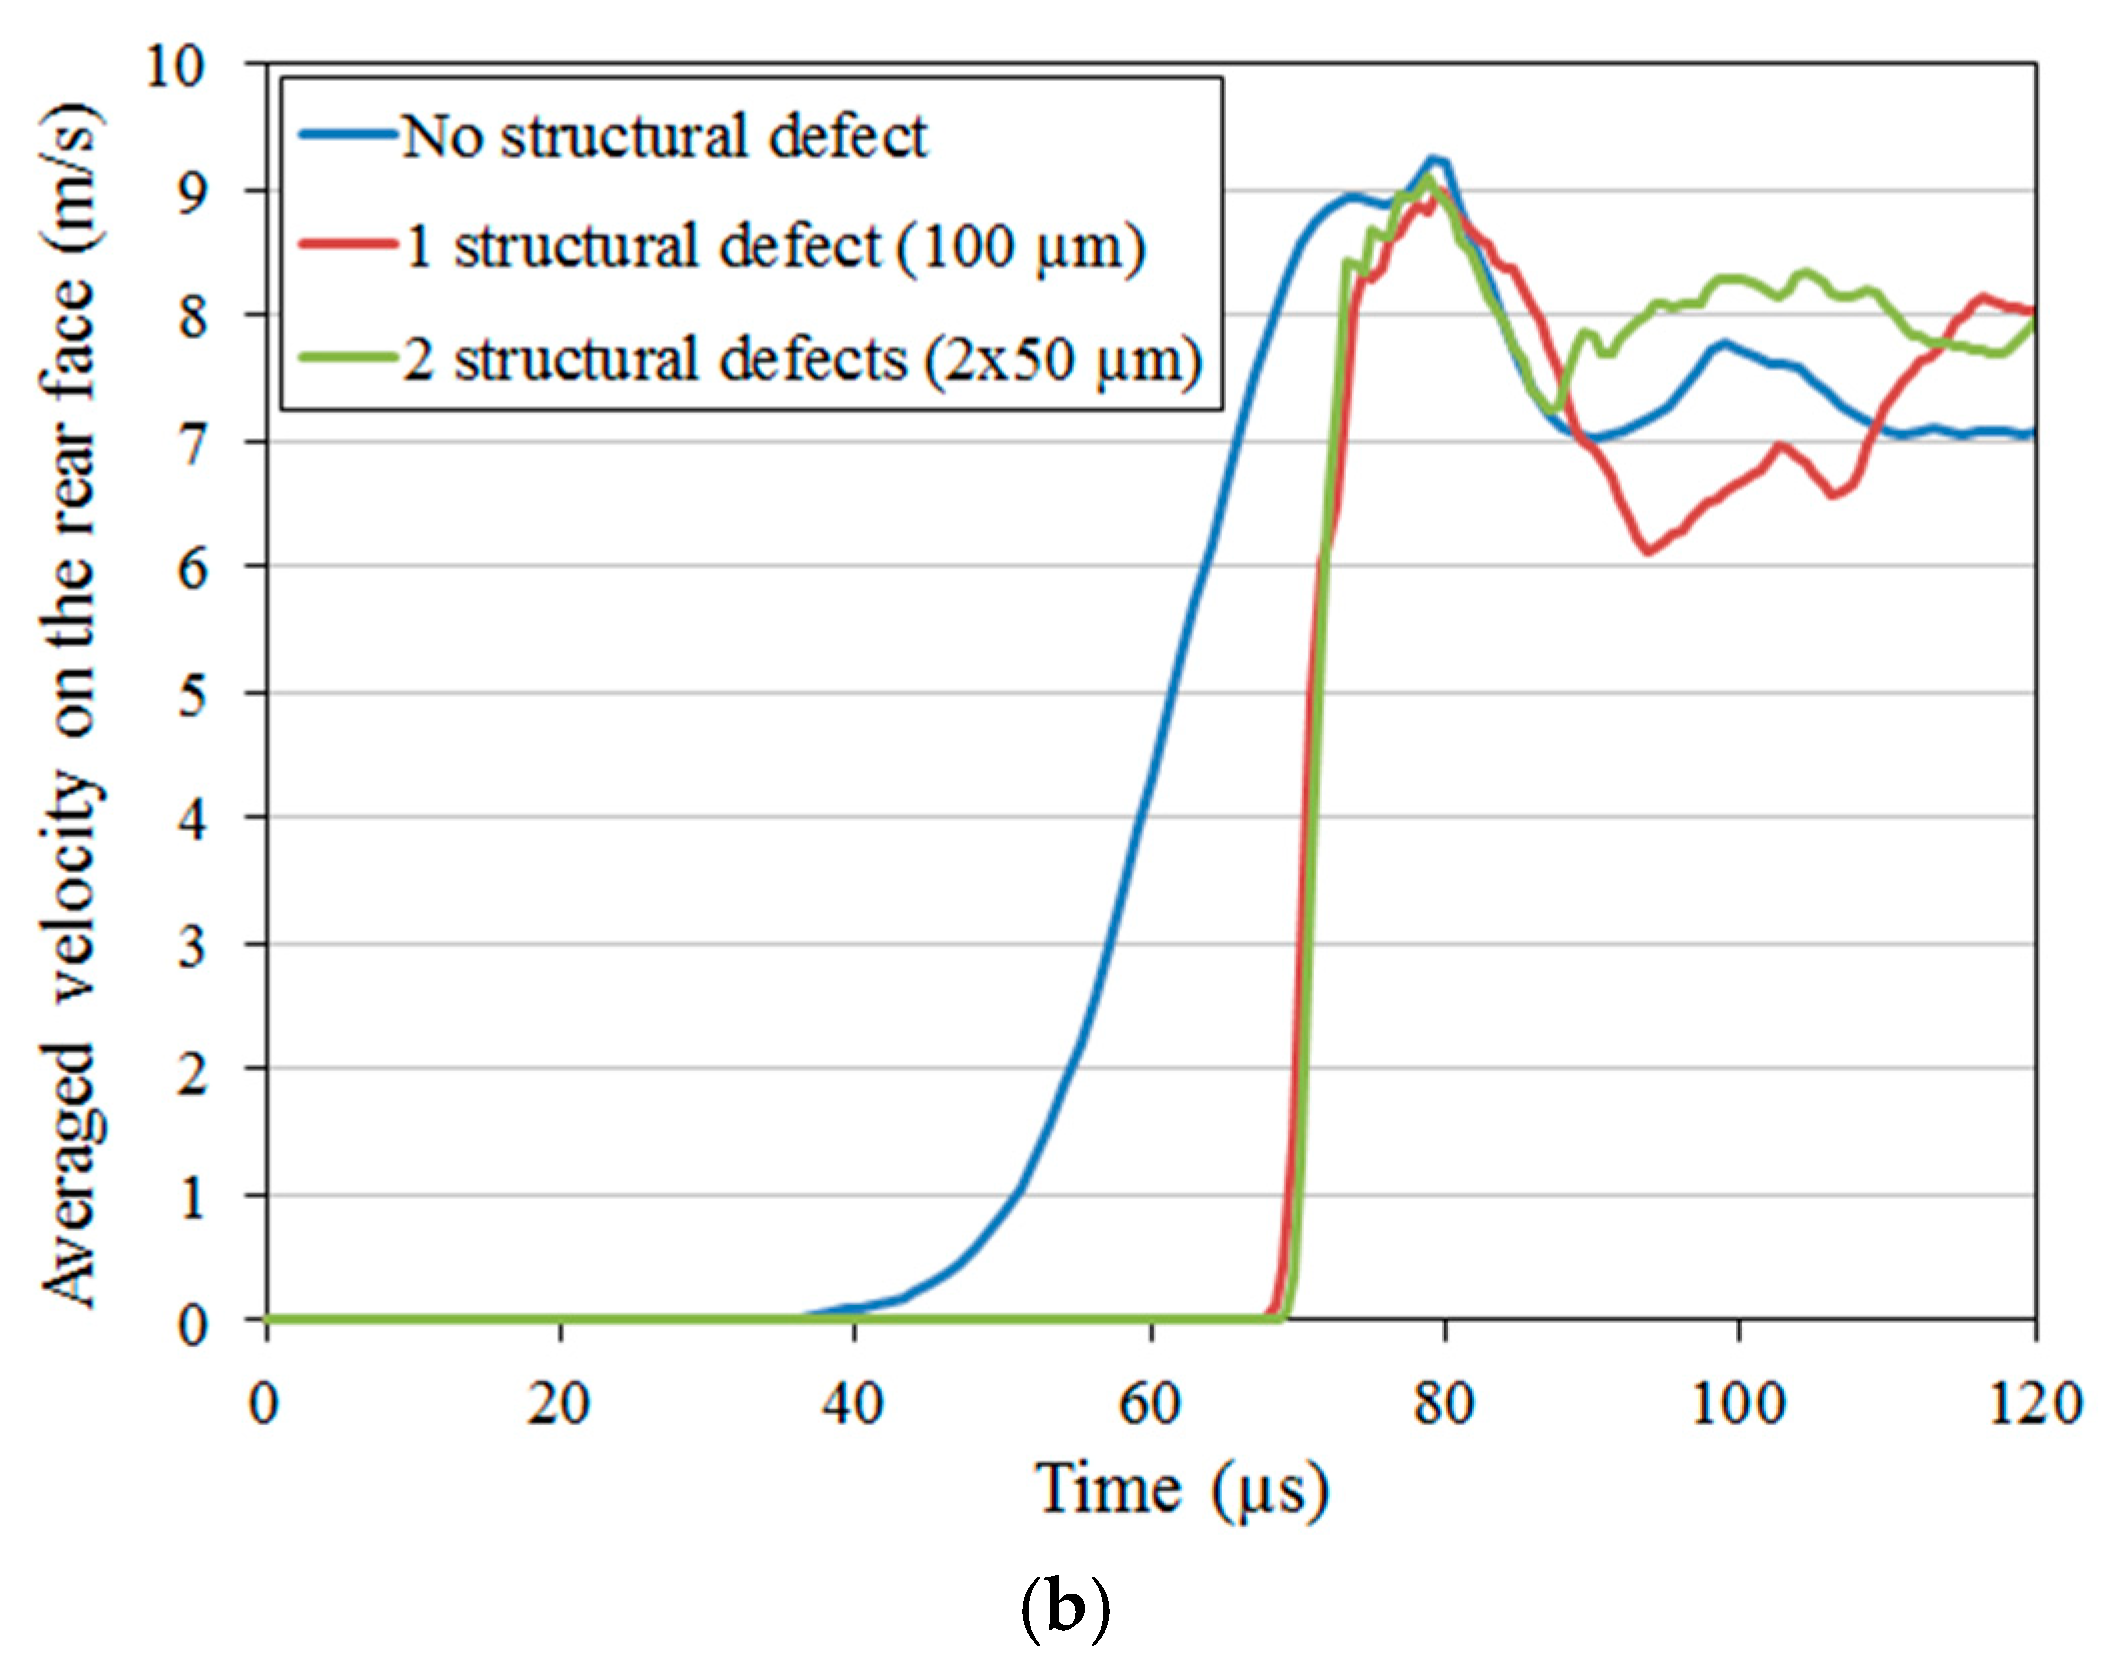
Finally, a series of numerical simulations of the spalling test was conducted with the Abaqus-explicit Finite-Element code to evaluate the possible effect of one or two structural defects on wave propagation and on the resulting velocity profile measured on the sample rear free surface. To do so, a cylindrical sample, 140 mm in height, 46 mm in diameter, was meshed with “C3D8R” eight-node solid brick elements with reduced integration and a mesh size of about 2 mm. The compression pulse depicted in
Figure 5 (G20 strain gauge) was used as a pressure pulse applied to the sample surface (left side in
Figure 14a). The KST-DFH model was used as the constitutive law for the Lingulid sandstone. In the first numerical simulation, no structural defect was considered, whereas a single structural defect and two structural defects were considered, respectively, in the second and third numerical simulations. The structural defect that corresponds to a gap of 100 µm is located at 60 mm from the rear face in the second calculation. In the third calculation, two gaps of 50 µm each, located at 30 and 60 mm from the rear face, are considered (
Figure 14a).
The numerical results in terms of the velocity profile averaged on the rear surface of the sample are reported in
Figure 14b. In the first numerical simulation, a smooth rising front and descending front up to the rebound with a similar shaped profile to the applied pressure pulse are noted. On the contrary, the two calculations performed with one or two structural defects show a sharp rising edge resulting from a shock generated when the two or three blocks come into contact. In addition, a smaller pull-back velocity (difference between maximum velocity and velocity at rebound) is observed in the third calculation (Δ
Vpb = 1.85 m/s) compared to the second calculation (Δ
Vpb = 2.86 m/s). It results from the entrapped wave in the second block, located in between the two structural defects. Finally, the third calculation gives a result closer to the experimental value (Δ
Vpb = 1.65 m/s, test n°2). In conclusion, both calculations with a structural defect enable us to explain that, in spalling experiments, the rising part of the pulse calculated from the rear face velocity was much stiffer than the nominal stress obtained from the G20 strain gauge.
5. Conclusions—Dynamic Testing and Numerical Modelling
In the present study two types of dynamic experiments have been developed to improve the understanding of wave propagation and damage modes in the Lingulid sandstone rock when subjected to impact or impulsive loading. The experimental results can be summarized as follows:
Spalling tests have been conducted to characterize the dynamic tensile strength of the sandstone rock. However, structural defects are observed to play a major role during compression wave propagation by strongly stiffening the compression wave and reducing the time corresponding to the rising edge. The wave velocity cannot be computed from the difference between the time corresponding to the maximum value of the signal given from the strain gauge near the contact surface and the time corresponding to the maximum value of velocity measured on the free end. In the present work, strain rate was estimated from full-field measurements using DIC-processing applied to pictures from an ultra-high-speed camera. Further, the strength provided by Novikov’s formula is observed to be much higher than the static strength provided by bending tests.
Edge-on-impact tests have been performed in open and sarcophagus configurations. Pre-existing structural defects are again observed to favour the opening of macro-cracks in mode I and the sliding of macro-cracks in mode II leading to energy dissipation by friction. The pre-existing cracks are also restricting the fragmentation of the material originating from less critical defects.
To complement the experimental results, a numerical investigation was developed to better understand the state of confinement and tensile loading applied to the EOI target when subjected to impact and to the spalled sample. In particular, the numerical investigation aims to evaluate the expected amount of damage (EOI test) and the rear face velocity profile (spalling test) with and without structural defects. The numerical results can be summarized as follows:
The numerical simulation of the EOI test involving only the KST model illustrates the large increase of pressure present beneath the confinement system. This justifies the calibration procedure of the KST model based on quasi-oedometric compression experiments (pressure-range up to 360 MPa).
The numerical simulation of the EOI test also predicts that a large network of radial cracks can be expected in the absence of structural defects.
The result above is confirmed based on a numerical simulation in which the target of the EOI test is modelled with the coupled KST-DFH plasticity-damage model. Indeed, in the absence of a structural defect, a large amount of damage is predicted, whereas the growth of damage is clearly reduced when a structural defect is implemented in the form of a small gap of 0.1 mm in thickness.
Finally, numerical simulations of a spalling test performed considering one or two structural defects represented by one or two small gaps of total thickness 0.1 mm allow explaining the sharp rising edge observed on the velocity profile measured on the sample rear face.
In conclusion, according to the dynamic experimental results and the numerical analysis, pre-existing structural defects play a major role in wave propagation and damage modes. These defects are notorious in the material at issue and will have to be accounted for in any numerical simulation of industrial processes involving Lingulid sandstone (such as percussive drilling), as well as in the identification strategy of constitutive models.

