Article

Test of Broken Suspender Specimen and Equivalent Static Calculation Method for Half-Through and Through Concrete-Filled Steel Tubular Arch Bridges

College of Civil Engineering, Fuzhou University, Fuzhou 350108, China
*
Author to whom correspondence should be addressed.
Appl. Sci. 2022, 12(22), 11619; https://doi.org/10.3390/app122211619
Submission received: 15 October 2022 / Revised: 29 October 2022 / Accepted: 8 November 2022 / Published: 16 November 2022
(This article belongs to the Special Issue New Technologies of Steel and Concrete Bridges)

Abstract

:
In response to the frequent collapse of main girders caused by the breakage of suspenders on half-through and through arch bridges, a test specimen has been designed and fabricated with a through concrete-filled steel tube (CFST) arch bridge as the engineering background. A new electromagnetic disconnect trigger is employed to realize the rapid suspender breakage in the test specimen. Dynamic response tests of the residual structure of the arch bridge after suspender failures employing the test specimen have been carried out. A finite element model accounting for the suspender breakage dynamic process has been constructed by implementing ANSYS/LS-DYNA, and the results of the test and finite element analysis are compared. In order to simplify the dynamic response calculation process of the residual structure after hanger failures, the dynamic coefficient is introduced, and an equivalent static calculation method (ESCM) considering the dynamic effect of the suspender fracture is presented. Eleven kinds of CFST standard arch bridges with different spans are constructed, the static and dynamic effects of the standard arch bridge with various dynamic coefficients are compared, and then their corresponding dynamic coefficients for various suspender fractures are determined. The obtained results reveal that the proposed electromagnetic suspender breakage trigger can realize the hanger fracturing within 0.1 s, which accurately simulates the fracture process of an actual bridge suspender, and the influence on the value of the dynamic coefficient can be ignored when the duration for suspender fracture is less than or equal to 0.15 s. The influence of suspender fracture on the displacement and stress of the longitudinal beam is more notable than those of the arch rib. In particular, the long suspender breakage has the highest influence on the displacement and stress of the longitudinal beam and arch rib. The fracture of the second short suspender has a remarkable impact on the suspender force of the adjacent hanger. When the ESCM is utilized to assess the mechanical behavior of the half-through and through CFST arch bridge, the dynamic coefficients of the longitudinal beam (suspender) were evaluated to be, conservatively, 1.8 (1.8) and 1.8 (1.7), respectively.

1. Introduction

Half-through and through concrete-filled steel tubular (CFST) arch bridges are broadly exploited in China, and as their service life grows, the high-strength steel suspenders (referred to as suspenders) [1] connect the bridge deck system to the arch ribs break more frequently for various reasons. Some bridges have suffered from serious accidents due to the lack of robustness of the suspension deck system, leading to bridge collapses and even car damage. For instance, in 2001, the Xiaonanmen Bridge in Yibin, Sichuan collapsed due to the fracture of short suspenders at both ends [2]. In 2011, a bridge deck collapsed because of the fracture of the second suspender of the main span of the Kongque River Bridge in Korla, Xinjiang [3], and in 2019, a bridge collapsed continuously as a result of the fracture of the sixth suspender from the right of the Nanfang’ao Cross Harbour Bridge in Taiwan [4].
According to the structure and force characteristics of CFST-base arch bridges, the suspension deck system can be divided into three major types, as demonstrated in Figure 1. The first type of deck system is often utilized in the arch girder combination system, whose robustness is best. The second type of deck system is supported by a crossbeam with a stiffened longitudinal beam, which has better robustness. The third type of deck system is without a longitudinal beam, whose robustness is the worst [5]. The third type of bridge deck system is mostly employed in several half-through and through arch bridges with suspender-breaking accidents. According to the learned experiences and lessons from China’s engineering practice, the Technical code for concrete-filled steel tubular arch bridges [6] states that the third type of bridge deck system is no longer allowed. In fact, it is stipulated that such a system should be appropriately strengthened and reconstructed according to the service conditions of the bridge. However, due to the lack of sufficient theoretical basis and specific calculation methods, the existing bridge design codes also lack specific requirements on the relevant robustness design theory and calculation methods; hence, the robustness design of suspension deck systems for half-through and through arch bridges is limited to conceptual design.
In recent years, the problem of bridge deck collapse caused by broken suspenders of the half-through and through CFST-base arch bridges has also attracted extensive attention from researchers. Starossek suggested that the continuous collapse analysis method, similar to that of suspension bridges, should be employed to examine the suspender breakage of half-through and through arch bridges [7]. There are some people who exploited the finite element method (FEM) to analyze the static and dynamic responses of the remaining structures when different suspenders were broken. Further, the effects of load, damping ratio, and suspender breaking time on the dynamic characteristics of suspender breaking were taken into account [8,9,10,11,12]. Additionally, the other scrutinized the suspender fracture process and bridge structure failure mode by implementing the FEM. It was revealed that the robustness of the suspension bridge deck system of the through CFST arch bridge is the main reason to prevent severe consequences such as beam falling after suspender breaking, and then the safety of the corresponding bridges was evaluated [13,14,15,16]. Yu and Minaei carried out the scale specimen test of tied-arch bridges to examine the influence of single suspender fracture on the residual suspender internal force of tied-arch bridges [17,18].
To sum up, at present, scholars often use static and dynamic FEMs or specimen tests to analyze the suspender failure of half-through and through arch bridges. However, the existing static methods often directly remove the broken suspender from the FEM and inversely apply the suspender force of the broken suspender to the anchorage point of the arch rib and bridge deck system for analysis, which cannot consider the dynamic effect when the suspender is broken. The existing literature on the suspender-breaking scrutiny based on the dynamic FE analysis is aimed at a specific arch bridge, the universality of the research results needs to be verified, and the dynamic analysis method is complex, which is inconvenient to be exploited in the actual bridge design. In only a few suspender-breaking specimen test explorations, the process of the sudden suspender breaking of the actual bridge cannot be appropriately simulated by burning or cutting the suspender, and the scale of the test specimen is too small, affecting the dynamic response results due to the size effect.
To avoid the size effect of the existing small-size specimen test, a large-scale test specimen of a CFST arch bridge with a main span of 20 m is designed and fabricated for the suspender rupture test. To solve the problem that the instantaneous fracture of the actual arch bridge suspender cannot be simulated by burning or cutting the suspender in the existing model test, a cable-breaking trigger device using an electromagnet fixture is proposed. The dynamic response test of the residual structure of the arch bridge after the occurrence of the suspender breakage is carried out. In this way, the dynamic response mechanism of the remaining structure during suspender breaking is revealed. Aiming at the problem that the correctness of the existing finite element analysis method for simulating suspender fracture cannot be verified, through the comparative scrutiny of the test and the FE analysis results, the dynamic response of the residual structure that occurred during the suspender breakage is determined. A reasonable FEM-base model for this crucial process is developed. In view of the existing static calculation methods that cannot consider the dynamic effect when the suspender is broken, based on the comparative analysis of the static and dynamic results, the equivalent static calculation method (ESCM) considering the suspender fracture process is established. To make the research results of this paper more universal, the half-through and through CFST standard arch bridges are established, based on the static and dynamic analysis results when the suspension of a CFST standard arch bridge is broken, and the dynamic coefficients in the ESCM are determined. The research results of this paper can be applied to the design and reinforcement of new and existing half-through and through CFST arch bridges.

2. The Broken Suspender Specimen Test of the Through CFST Arch Bridge

2.1. Specimen Design

Considering a CFST through rigid-frame tied-arch bridge has a span of 128 m in length as the engineering background, the arch axis adopts a catenary line, the arch axis coefficient is 1.167, and the span ratio is 1/5. The arch rib is a CFST structure. There are 23 pairs of suspenders for the bridge arch ribs. Each suspender consists of 85 galvanized, high-strength, low-relaxation, pre-stressed steel wires with a diameter of 7 mm.
In the present work, the real bridge is employed as a prototype. By considering the equivalent principle of similar specific stiffness and the test conditions, the scale test specimen is designed according to the scale of 1:6.4. The arch bridge span of the specimen is 20 m, the span ratio is 1/5, the interval between the two arch ribs is 2.86 m, and the general layout of the test specimen are illustrated in Figure 2. According to the similarity ratio and equivalent principle of stiffness, the truss arch rib is equivalent to a single circular pipe arch rib. The rib section includes Φ325 × 9 steel tubes, and the pipe has not been filled with concrete. A lateral brace is arranged at each of the quarter points of the arch rib by utilizing Φ168 × 6 steel tubes.
According to the test specimen production requirements, the bridge deck system and the distribution form of the scale test specimen are appropriately adjusted, see Figure 3. The bridge deck system of the test specimen is composed of reinforced concrete beams in the longitudinal and transverse directions. The distance between the axes of two nearby longitudinal beams is 2.86 m, the bridge deck system is simply supported, and rubber bearings are arranged at the ends of the longitudinal beams. The axis-to-axis distance of each cross-beam is 1.72 m, and there exist 11 cross-beams in the whole bridge. The test specimen eliminates the actual bridge deck and employs concrete blocks for counterweighting. The longitudinal and transverse cross-section dimensions of the test specimen in order are 32 cm × 18 cm and 46 cm × 23 cm.
The test specimen suspender adopts a single 7Φ5 pre-stressed steel strand. There are 11 pairs of suspenders in the whole bridge with a longitudinal spacing of 1.72 m. Each end of the cross-beam has been suspended by a suspender connecting to the arch rib. The consisting suspenders are specified as 1# to 11# from the left arch foot to the right (see Figure 2a).
The abutment is composed of reinforced concrete, whose dimensions are determined by appropriate scaling. The arch rib is welded to the pre-buried steel plate of the abutment to form a consolidation. The height of the pedestal is set equal to 1.00 m, the arch and pedestal are connected by the anchor rod, and the pedestal is properly connected to the ground via the screw.
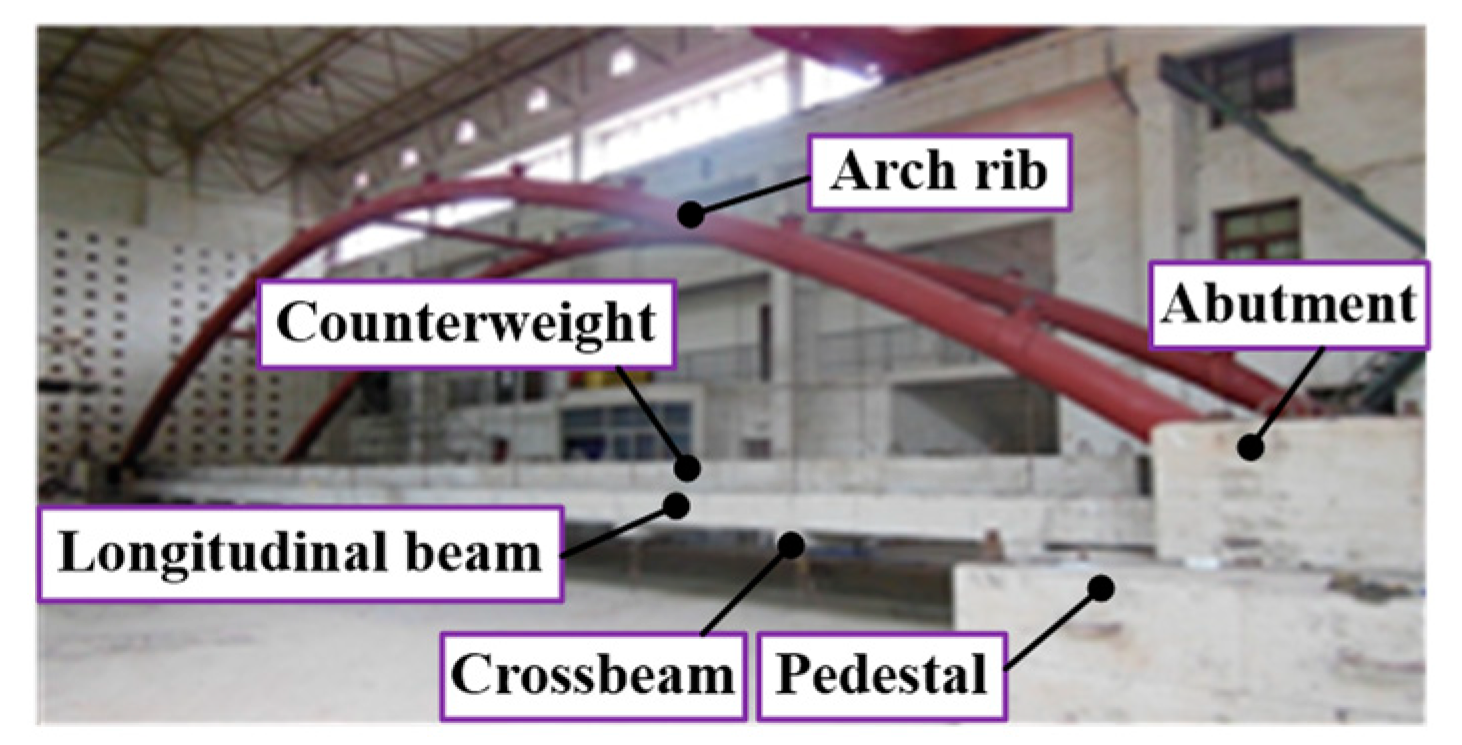
The photo of the test specimen is illustrated in Figure 4.

2.2. Transient Fracture Simulation of the Suspender

At present, the methods for simulating suspender breaks include the shearing method [19], the burning method, and the mechanical breaking method. The first two cannot control the time of the suspender breakage, and the breaking process takes a long time. The latter is difficult to operate remotely, and the interference to the suspender is large. It should be noticed that the suspender breakage in the actual bridge is a transient process. In order to simulate this process more accurately in the test, we design a new suspender breakage-triggering device based on the principle of electromagnetic control.
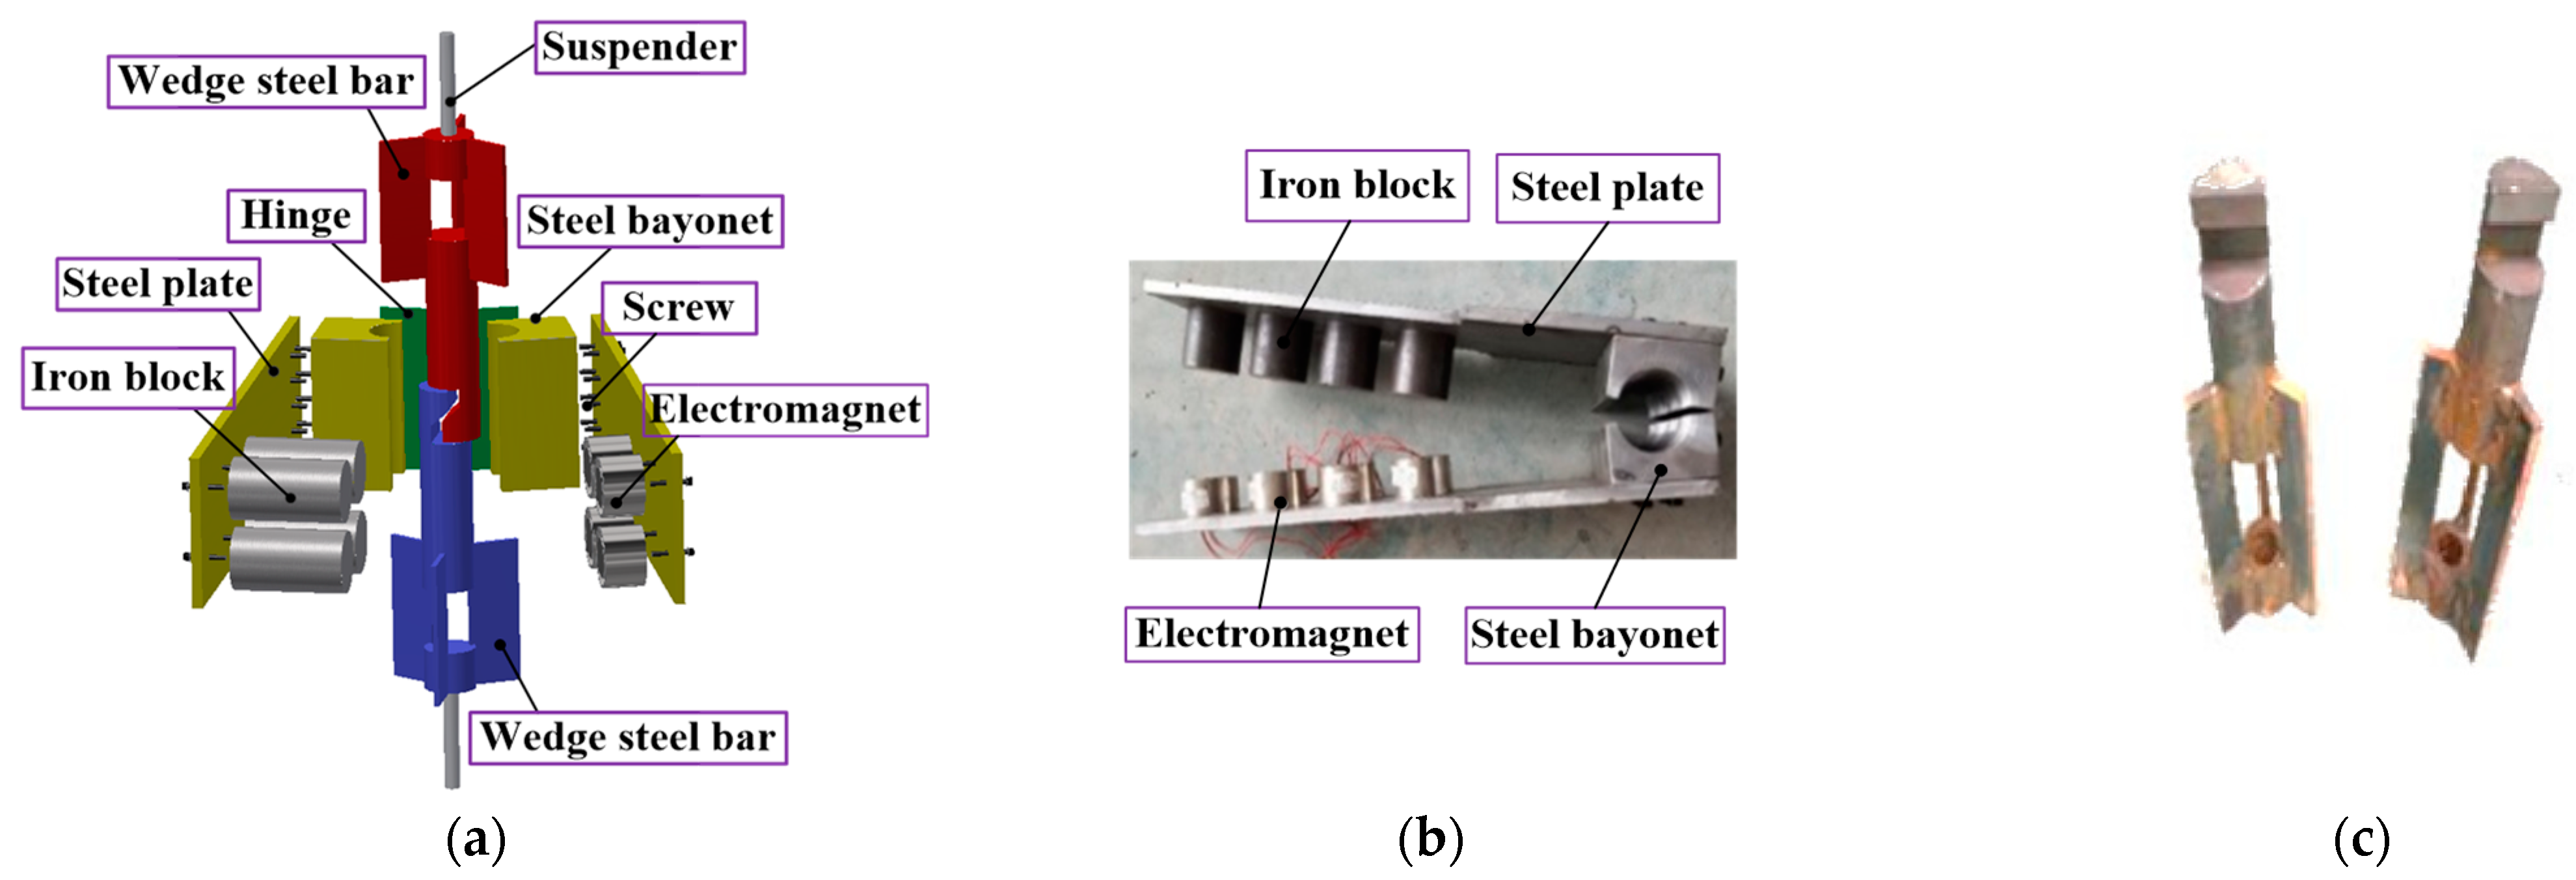
The suspender-breaking trigger device is mainly composed of two wedge-shaped steel blocks and electromagnetic clamps, as presented in Figure 5. The structures of the two wedge-shaped connecting steel bars are identical; one end is connected with the stay suspender, and the wedge-shaped openings at the other end enable the two wedge-shaped connecting steel bars to fully engage. The electromagnet clamp is composed of two steel force arms (steel plates). One end of the two steel force arms is connected by a hinge. A hole-like bayonet is reserved at the connecting end of the hinge for the wedge-shaped connecting rod to pass through. The other end of the steel force arm is, respectively, fixed with an electromagnet and an iron holding block. When energized, it can provide a loop-wrapping force for the wedge-shaped steel blocks that are occluded together, so that the upper and lower wedge-shaped steel blocks can remain in close contact under the tension of the suspender. If the electromagnet is cut off, the electromagnet loses its grip force as well as the restraining effect on the wedge-shaped steel block. Then, the two wedge-shaped steel blocks slide down under the suspender force and the self-weight, thus rationally simulating the sudden breakage of the suspender.
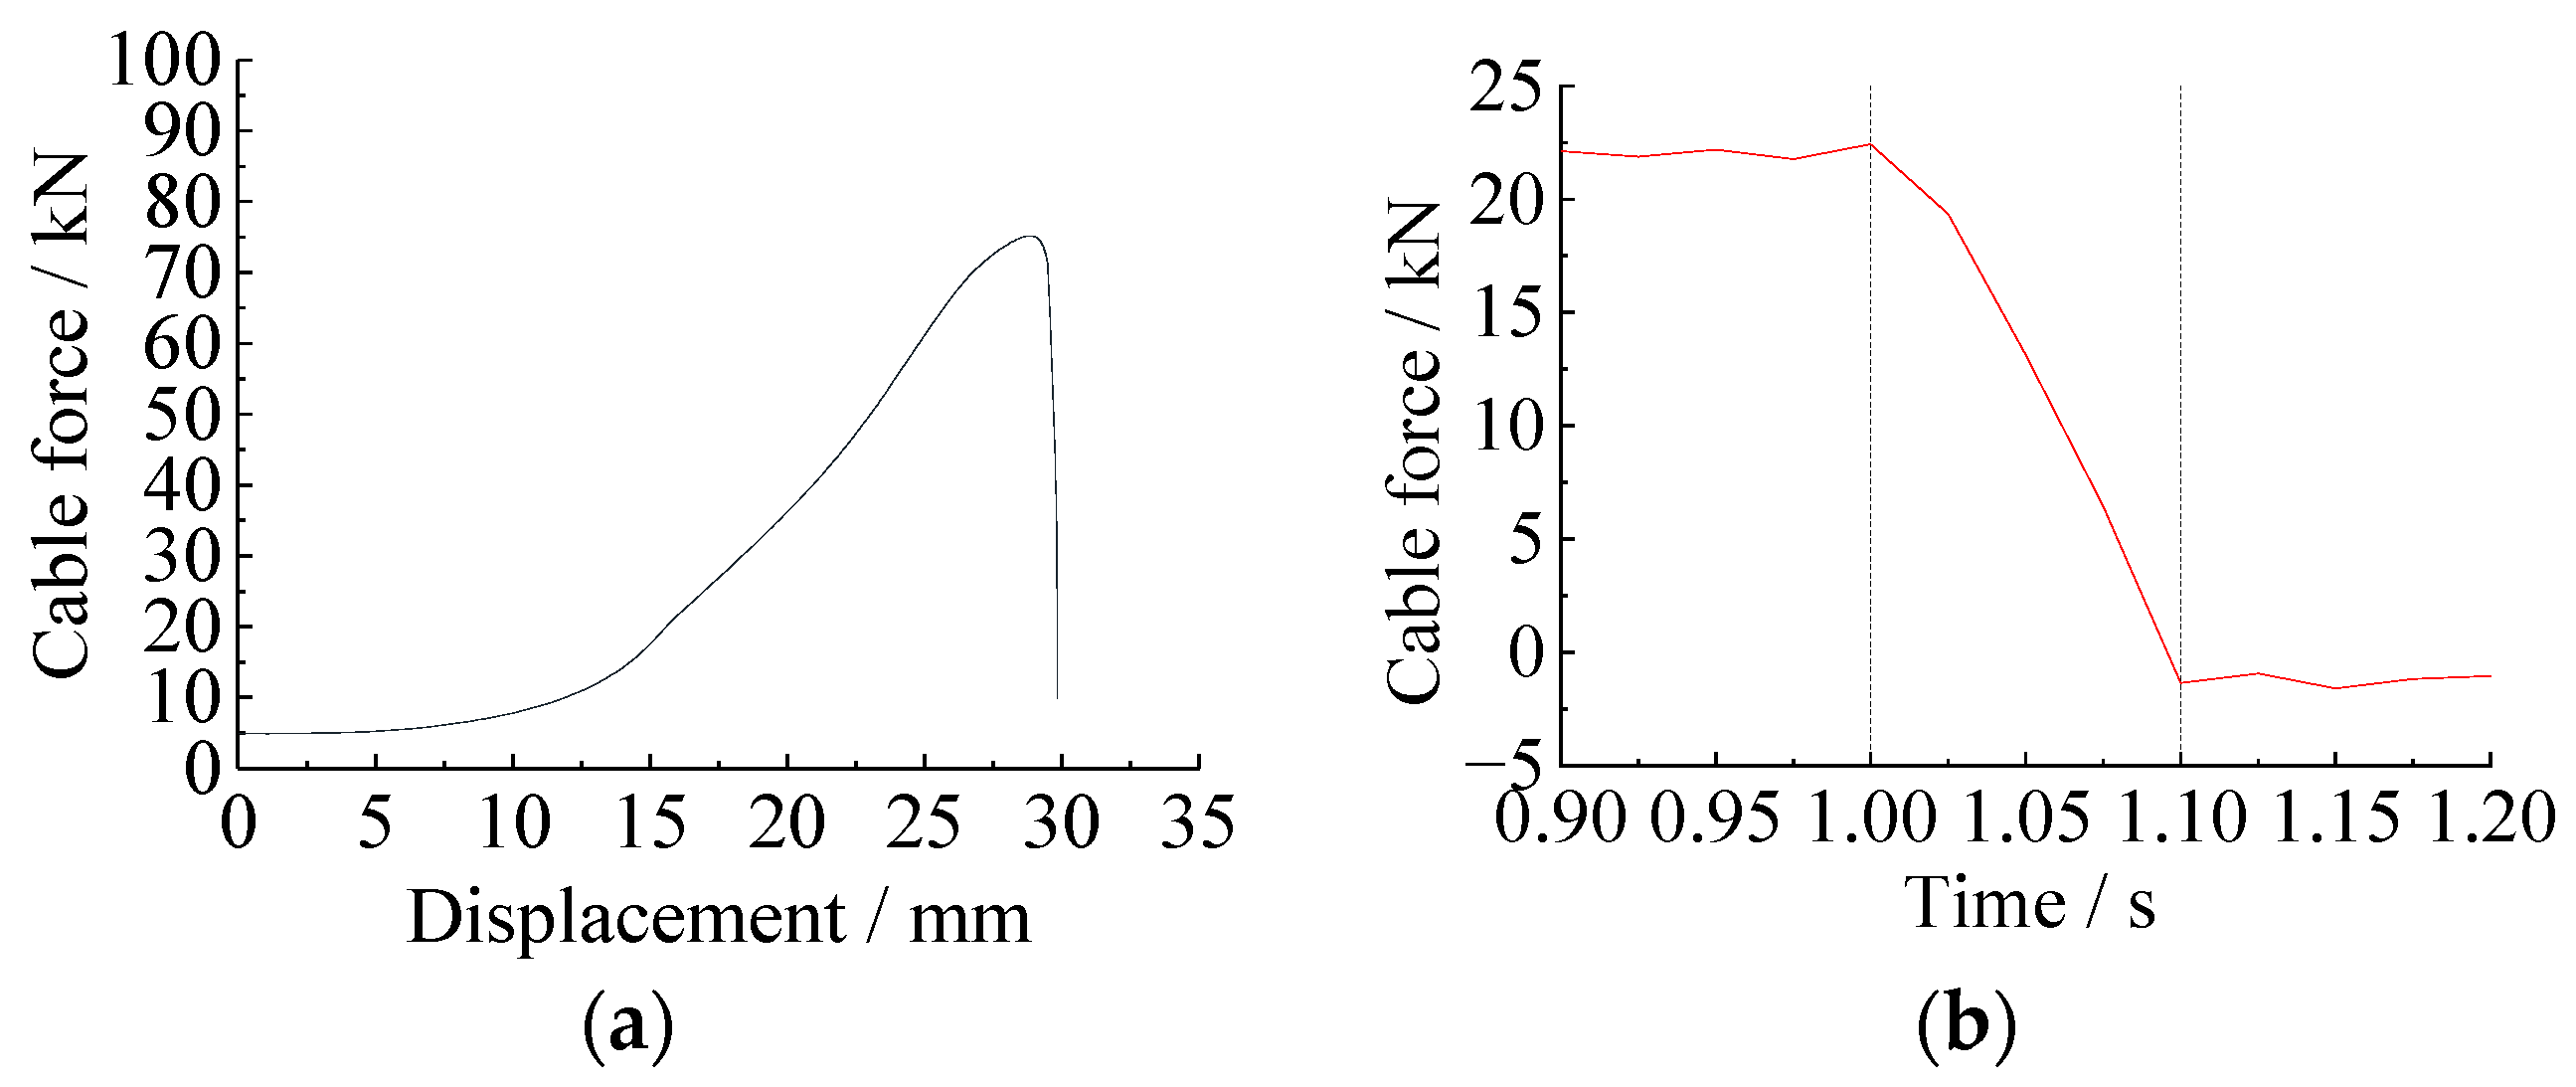
In order to validate the feasibility of the suspender breakage trigger, the load capacity and suspender breaking performance of the trigger are appropriately. Figure 6a show presents the load–displacement curve of the trigger during loading. It is detectable that the ultimate tensile force of the suspender in the energized state of the electromagnetic clamp reaches 80 kN, which is much larger than the maximum tensile force of the suspender in the specimen test. In Figure 6b, the pulling force is set equal to the maximum tensile force value of 22 kN in the specimen test. When the power is disconnected, the electromagnetic fixture rapidly opens, the two wedge-shaped steel blocks separate and fall off, and the pulling force vanishes within 0.1 s. It is implied that the proposed suspender breakage trigger can simulate the rapid breaking process of the suspender, and the time passed for the suspender breakage process in the specimen test is regarded as 0.1 s.

2.3. Suspender Fracture Condition

Before conducting the suspender fracture test, the bridge deck is loaded with weights, where the exerted weight force on the bridge is determined according to the similarity ratio of the actual bridge to the suspender of the test specimen. The similarity ratio of the suspender stress of this test is set equal to the one. Under the constant load, the stress of each suspender in the real bridge is around 200 MPa. According to the suspender parameters of the test specimen, the length, width, and height of the concrete block in order are 18, 2.2, and 0.31 m, and it is placed on the bridge deck beam (see Figure 7).
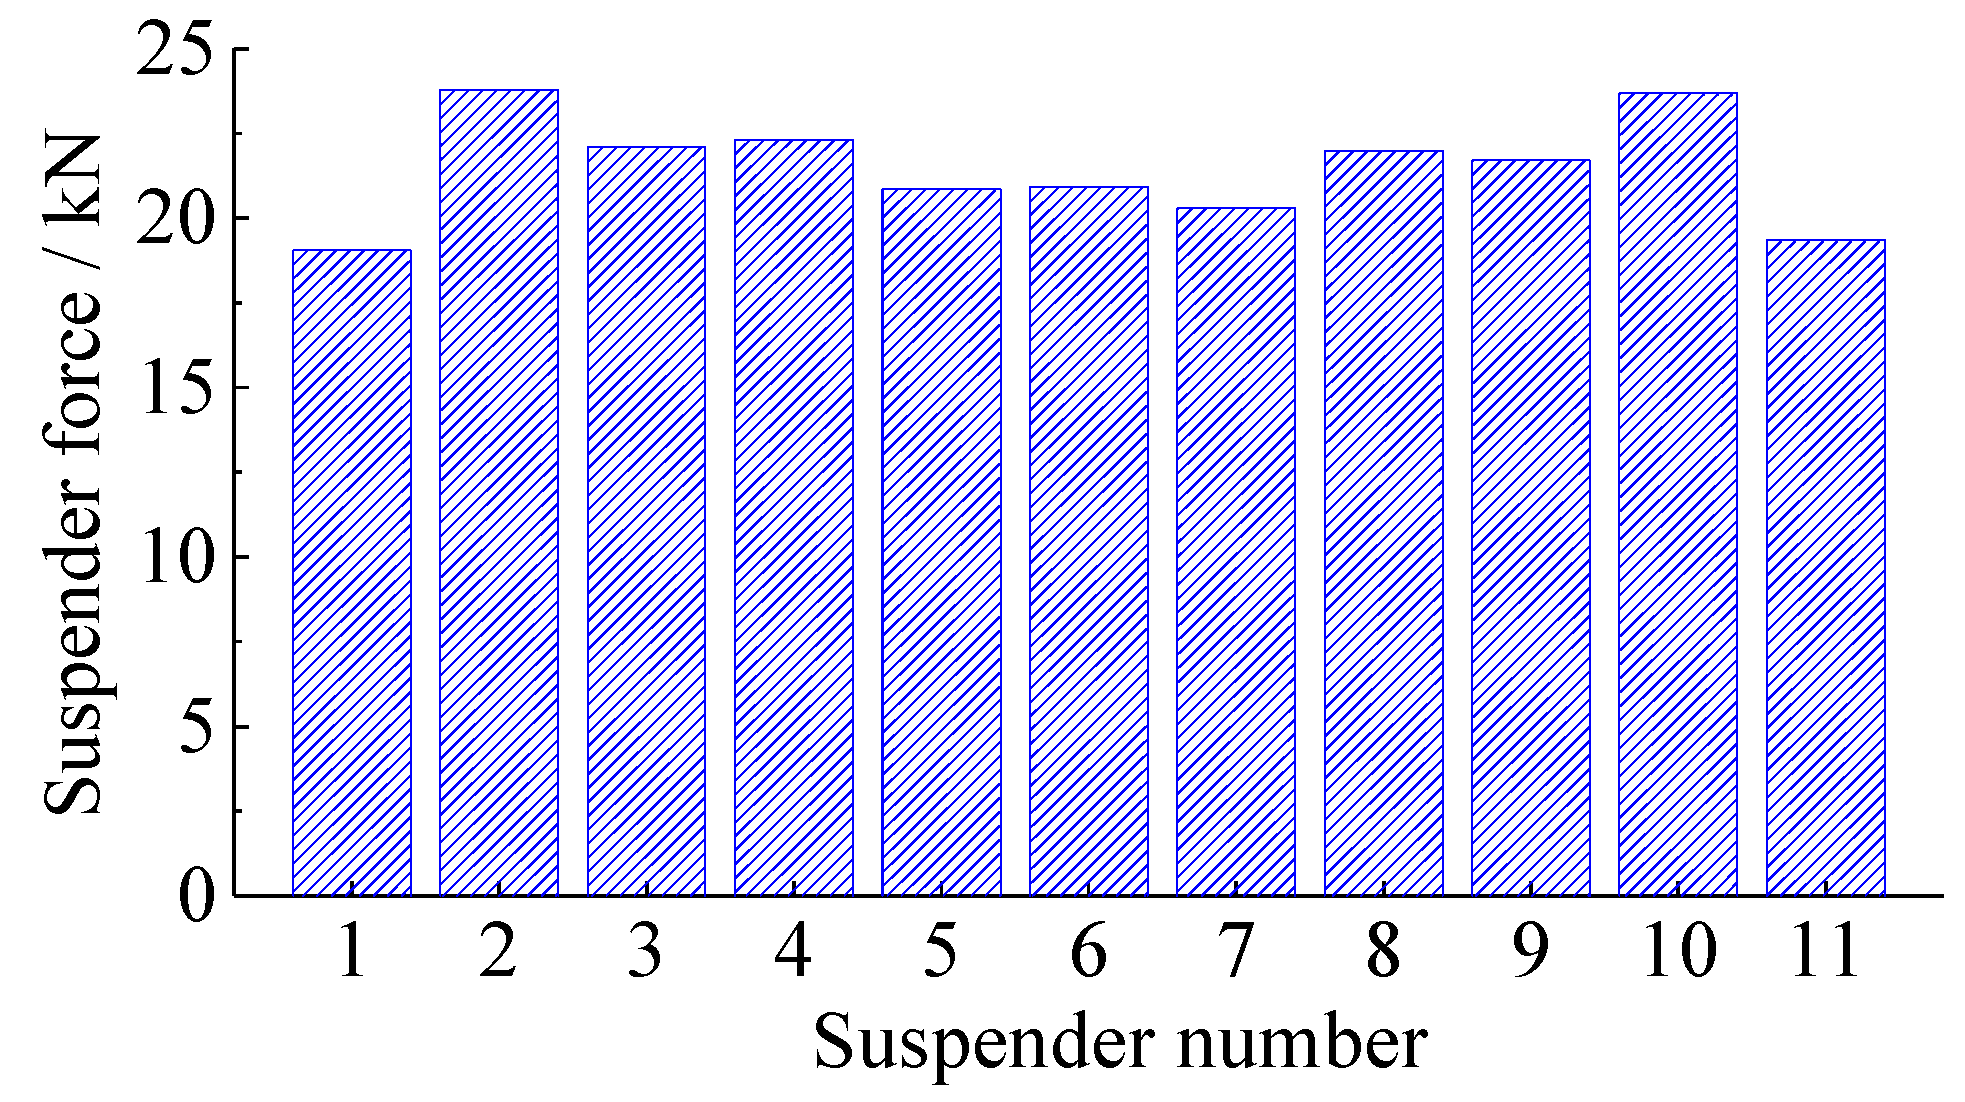
The suspender force with constant load is demonstrated in Figure 8. The main cause of the suspender breakage is stress corrosion [20]. Owing to the symmetry of the main structure with respect to the longitudinal and transverse directions, arch bridges are basically symmetrical with constant and live loads. Therefore, a simultaneous rupture of suspenders at both ends of a beam often occurs in the practical suspender breakage of bridges. In the present paper, tests on 1# to 6# are performed to examine the dynamic effect on the residual structure of the lower arch bridge under the suspender breakage condition. It is assumed that the two suspenders at the ends of the same cross-beam would break simultaneously in the suspender experiments.

2.4. The Layouts of the Measuring Points

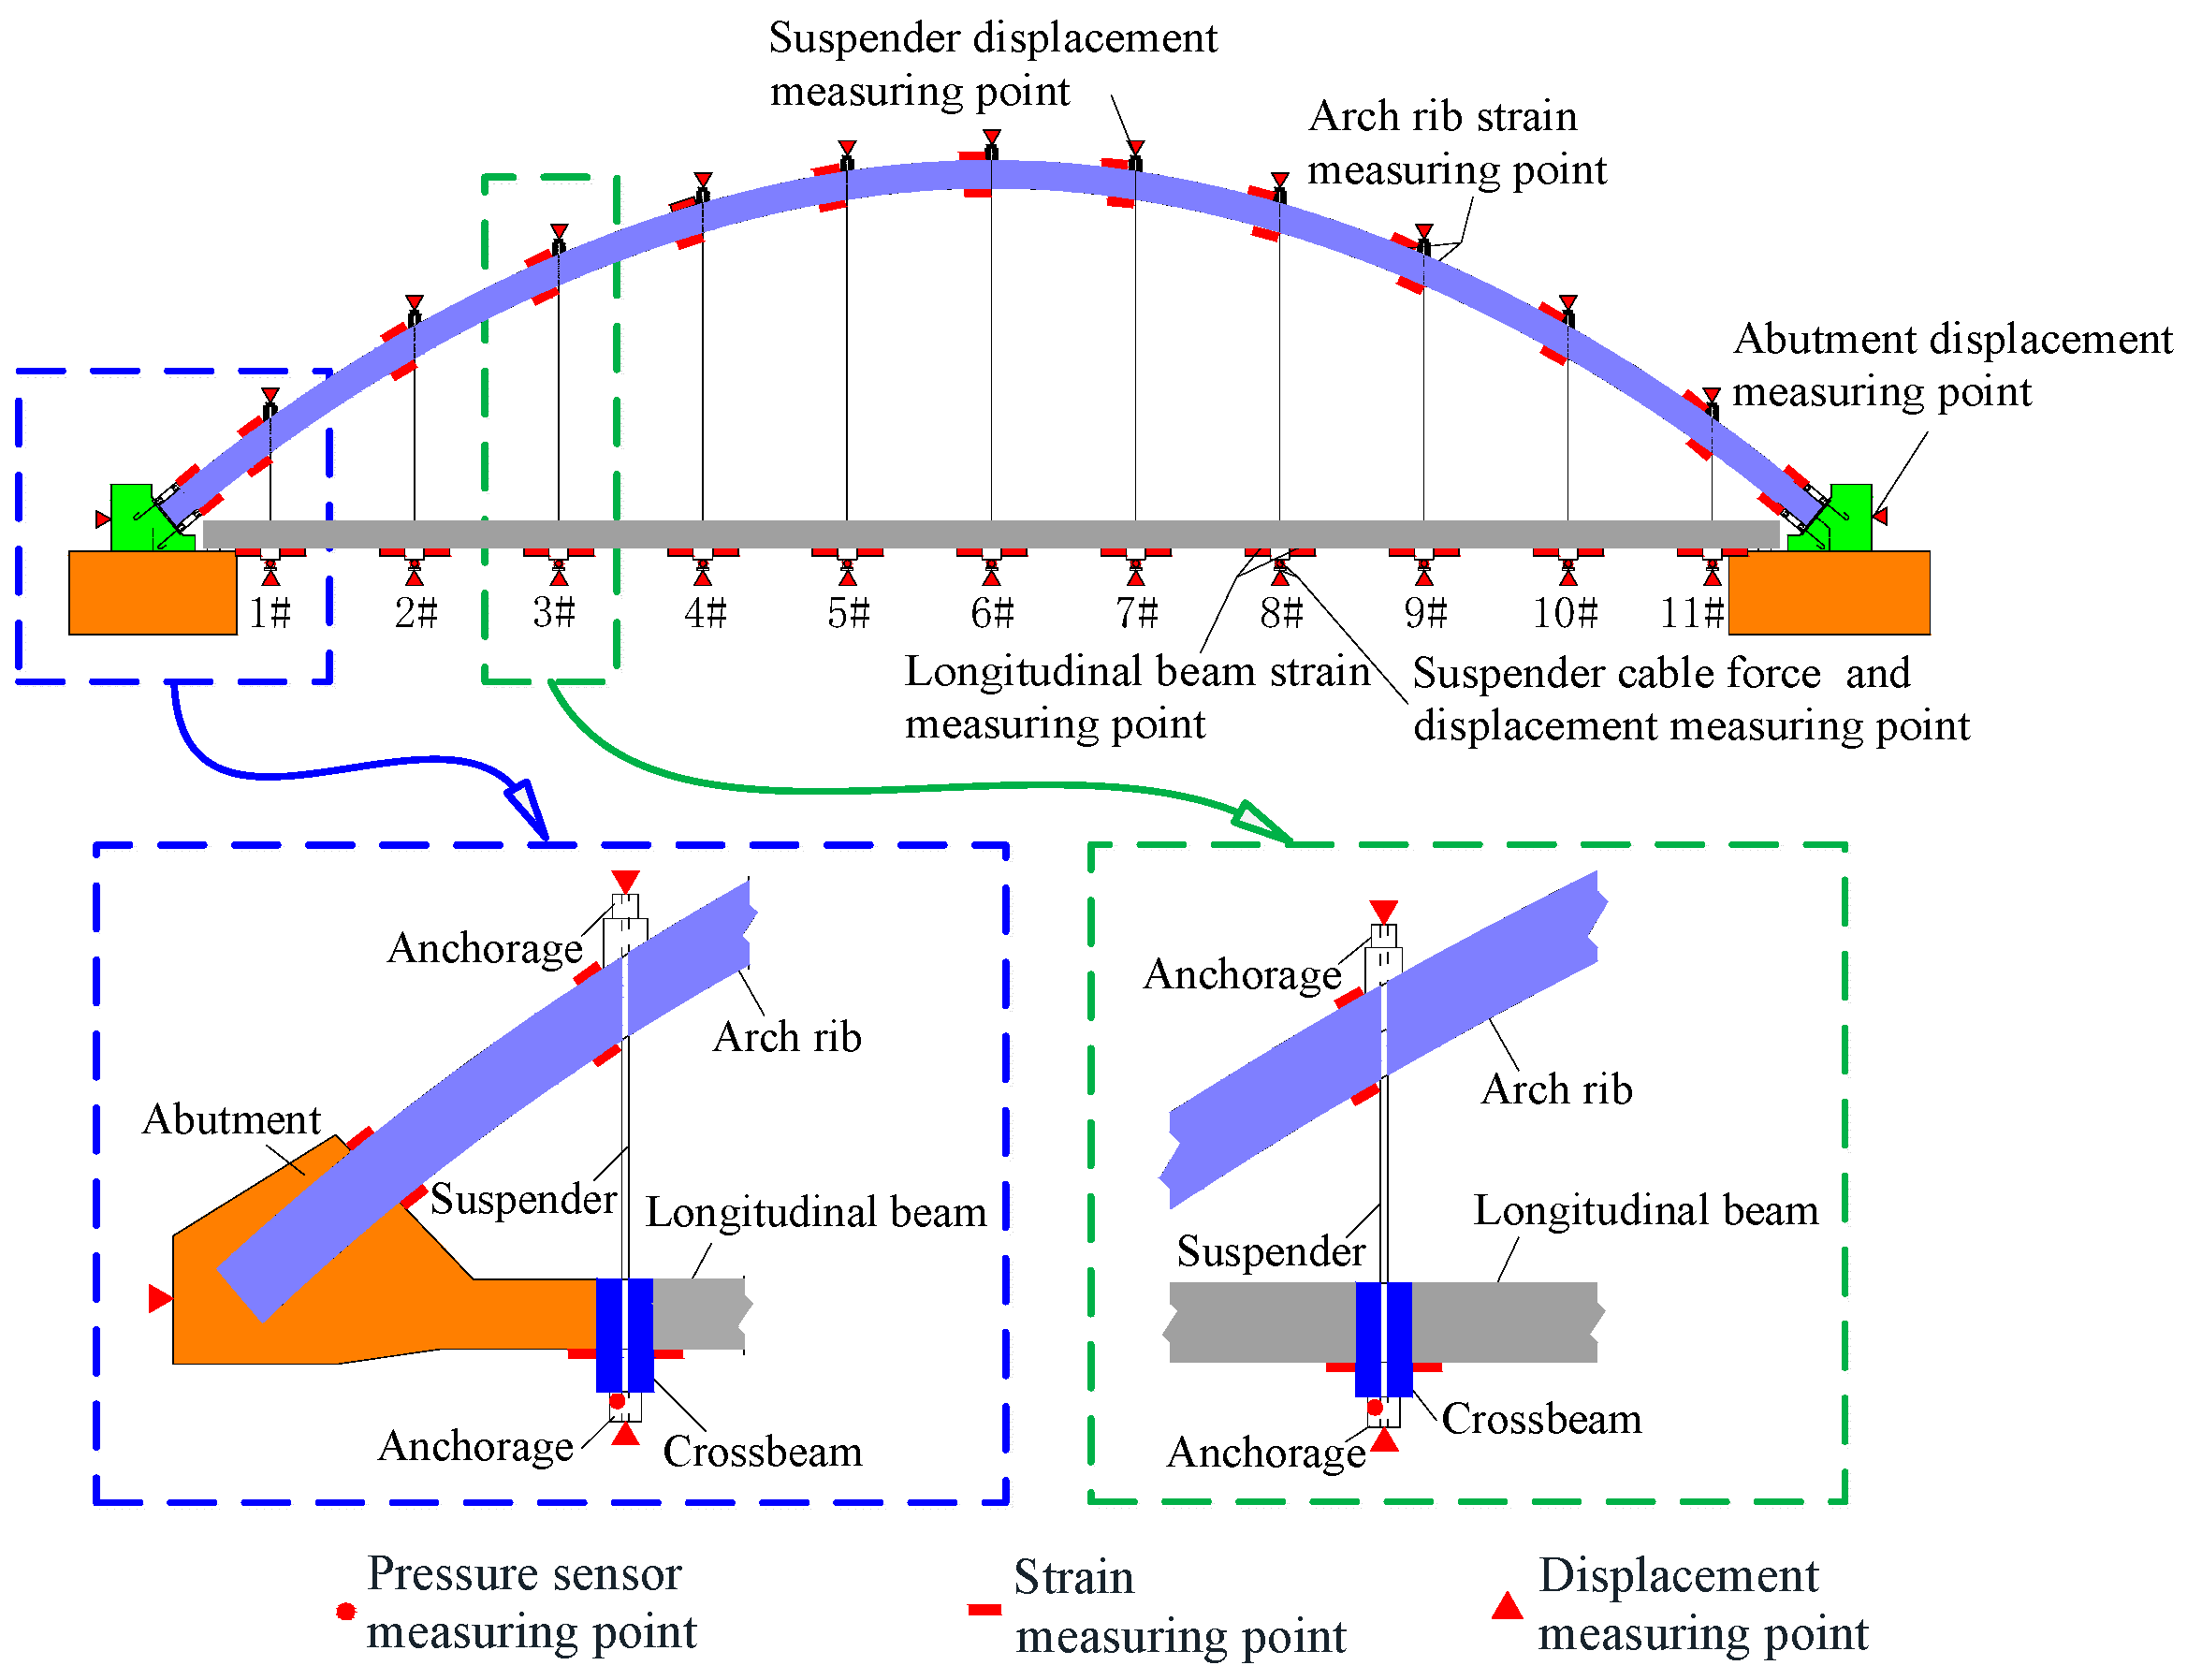
The layout of the measuring points of the test specimen has been presented in Figure 9. A pressure sensor is employed to control the tension of the suspender and acquire the suspender force variation for the remaining suspenders during the suspender rupture. A pressure sensor is installed at the beam anchoring point of each suspender. The displacement meters and strain gauges are exploited to measure the displacement and strain of the arch rib and bridge deck system during suspender fracture. These measuring tools are installed at the anchor points of the arch rib and beam of the suspender, two strain measuring points are set in the arch foot of each arch rib, and one horizontal displacement measuring point is set in each arch foot. Due to the symmetrical conditions of both loading and geometry, the strain measuring points are installed on the single-side longitudinal beam and the arch rib of the specimen. In the present test, 22 and 26 strain measuring points are installed for the bridge deck system and arch rib, respectively, and 13 and 11 displacement measuring points in order are installed for the arch rib and bridge deck system.

3. The FEM-Base Model Accounting for the Suspender Breaking Process

3.1. Establishment of the FE Model

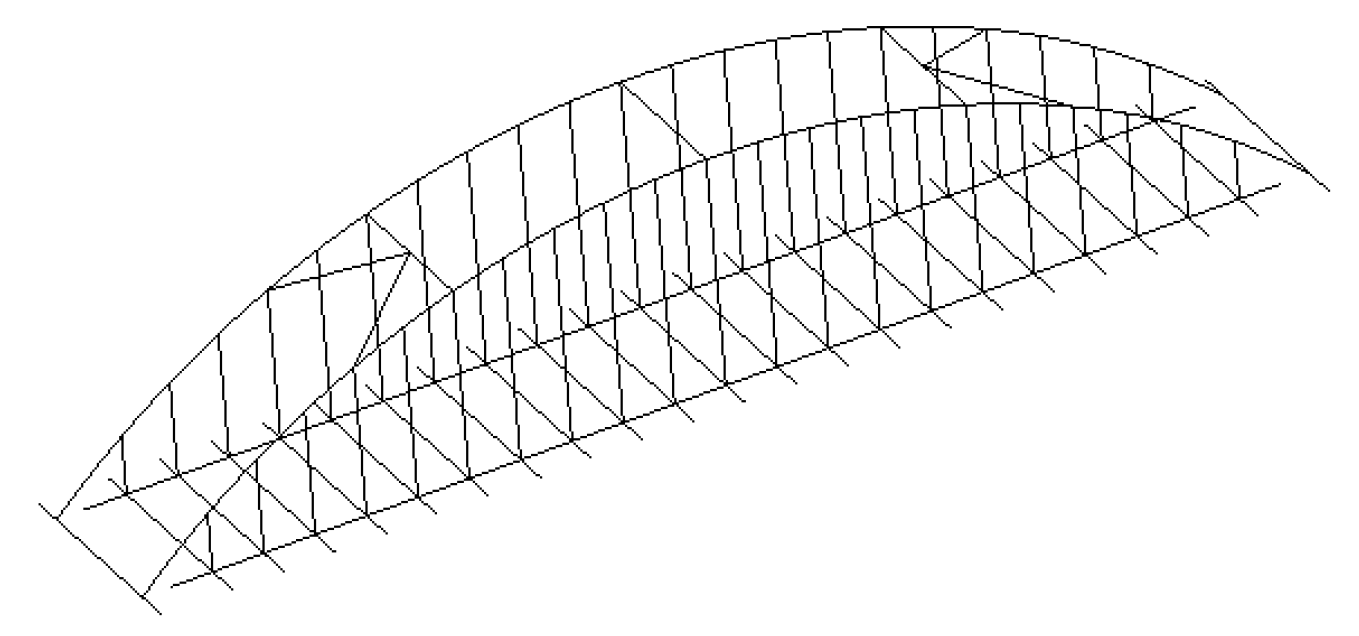
The FEM-base model of the test scale specimen has been established by implementing the ANSYS/LS-DYNA explicit dynamic analysis program, which is demonstrated in Figure 10. In the full-bridge model, each arch rib, longitudinal beam, and transverse beam in order are divided into 48, 44, and 4 units, all of which are simulated by employing the element type of Beam161. For each suspender, only one unit suspender-like element (i.e., with the capability of tensioning and without bearing the compressive stress) of type Link167 is exploited. The weight is applied to the beam nodes through the concentrated mass weight forces by using the element Mass166. The measured results from the material experiments are exploited for choosing the material properties, such as the density and elastic modulus. The boundary conditions should be imposed based on the actual constraints, where the arched foot is the consolidation boundary, and the stiffened beams at both ends are simply supported.

3.2. Suspender Fracture Simulation

The contact–collision nonlinear processing function in the ANSYS/LS-DYNA software is exploited to simulate the whole process of suspender breakage. The degree of change for the dynamic performance of the scale test specimen before and after suspender breakage under each working condition is then obtained. The whole process of the suspender breakage simulation by employing the ANSYS/LS-DYNA can be divided into the following two major stages: Firstly, the internal force f0 of the suspender unit to be simulated is evaluated under the constant load through implicit calculation; secondly, the failure suspender unit is removed, and a pair of time-varying loads (i.e., the curve functions f) are applied to the unit ends, as demonstrated in Figure 11. In the implicit calculation, the calculation model is appropriately set equivalent to the original structure acted upon by static structure forces. When the static solution of the whole structure is obtained, the program exploits the internal force condition as the initial state for the explicitly dynamic analysis. Since the load remains unchanged during the implicit analysis and it is independent of the duration, the implicit solution time is set as 1.0 s in all given simulations [21]. Further, the break time in the calculation (Δt) is taken as 0.1 s based on the test results obtained for the suspender-breaking trigger device.
The structural damping essentially works based on the consumption of the vibration energy of the system, which further affects the structural vibration. In the dynamic analysis of the half-through and through arch bridges accounting for the suspender breakage, reasonable damping can be utilized to enhance the calculation accuracy. However, there exists no consistent methodology to determine such a structural damping value. Herein, the Rayleigh damping model is employed as the viscous damping calculation method for the half-through and through arch bridges. In the performed analyses, the damping ratios corresponding to the first and second modes of the half-through and through arch bridges are considered as 0.03 [22].

4. Test and FE Analysis

The suspender fracture has a great impact on the stress and displacement of the longitudinal beam and arch rib at the suspension point of the broken suspender, as well as the suspender forces of suspenders adjacent to the broken suspender. For this purpose, 1# and 6# as broken suspenders (see Figure 2 for the number of suspenders), and the short and long ones, as well as their adjacent suspenders, are taken as illustrative examples. The stress and displacement response of the broken suspenders at the suspension point of the arch rib and the longitudinal beam during the suspender breaking are of high concern. The resulting stresses in tension and compression are specified by positive and negative signs, respectively, while the upward and downward displacements are identified by the positive and negative signs, respectively.

4.1. Displacement Dynamic Response Analysis

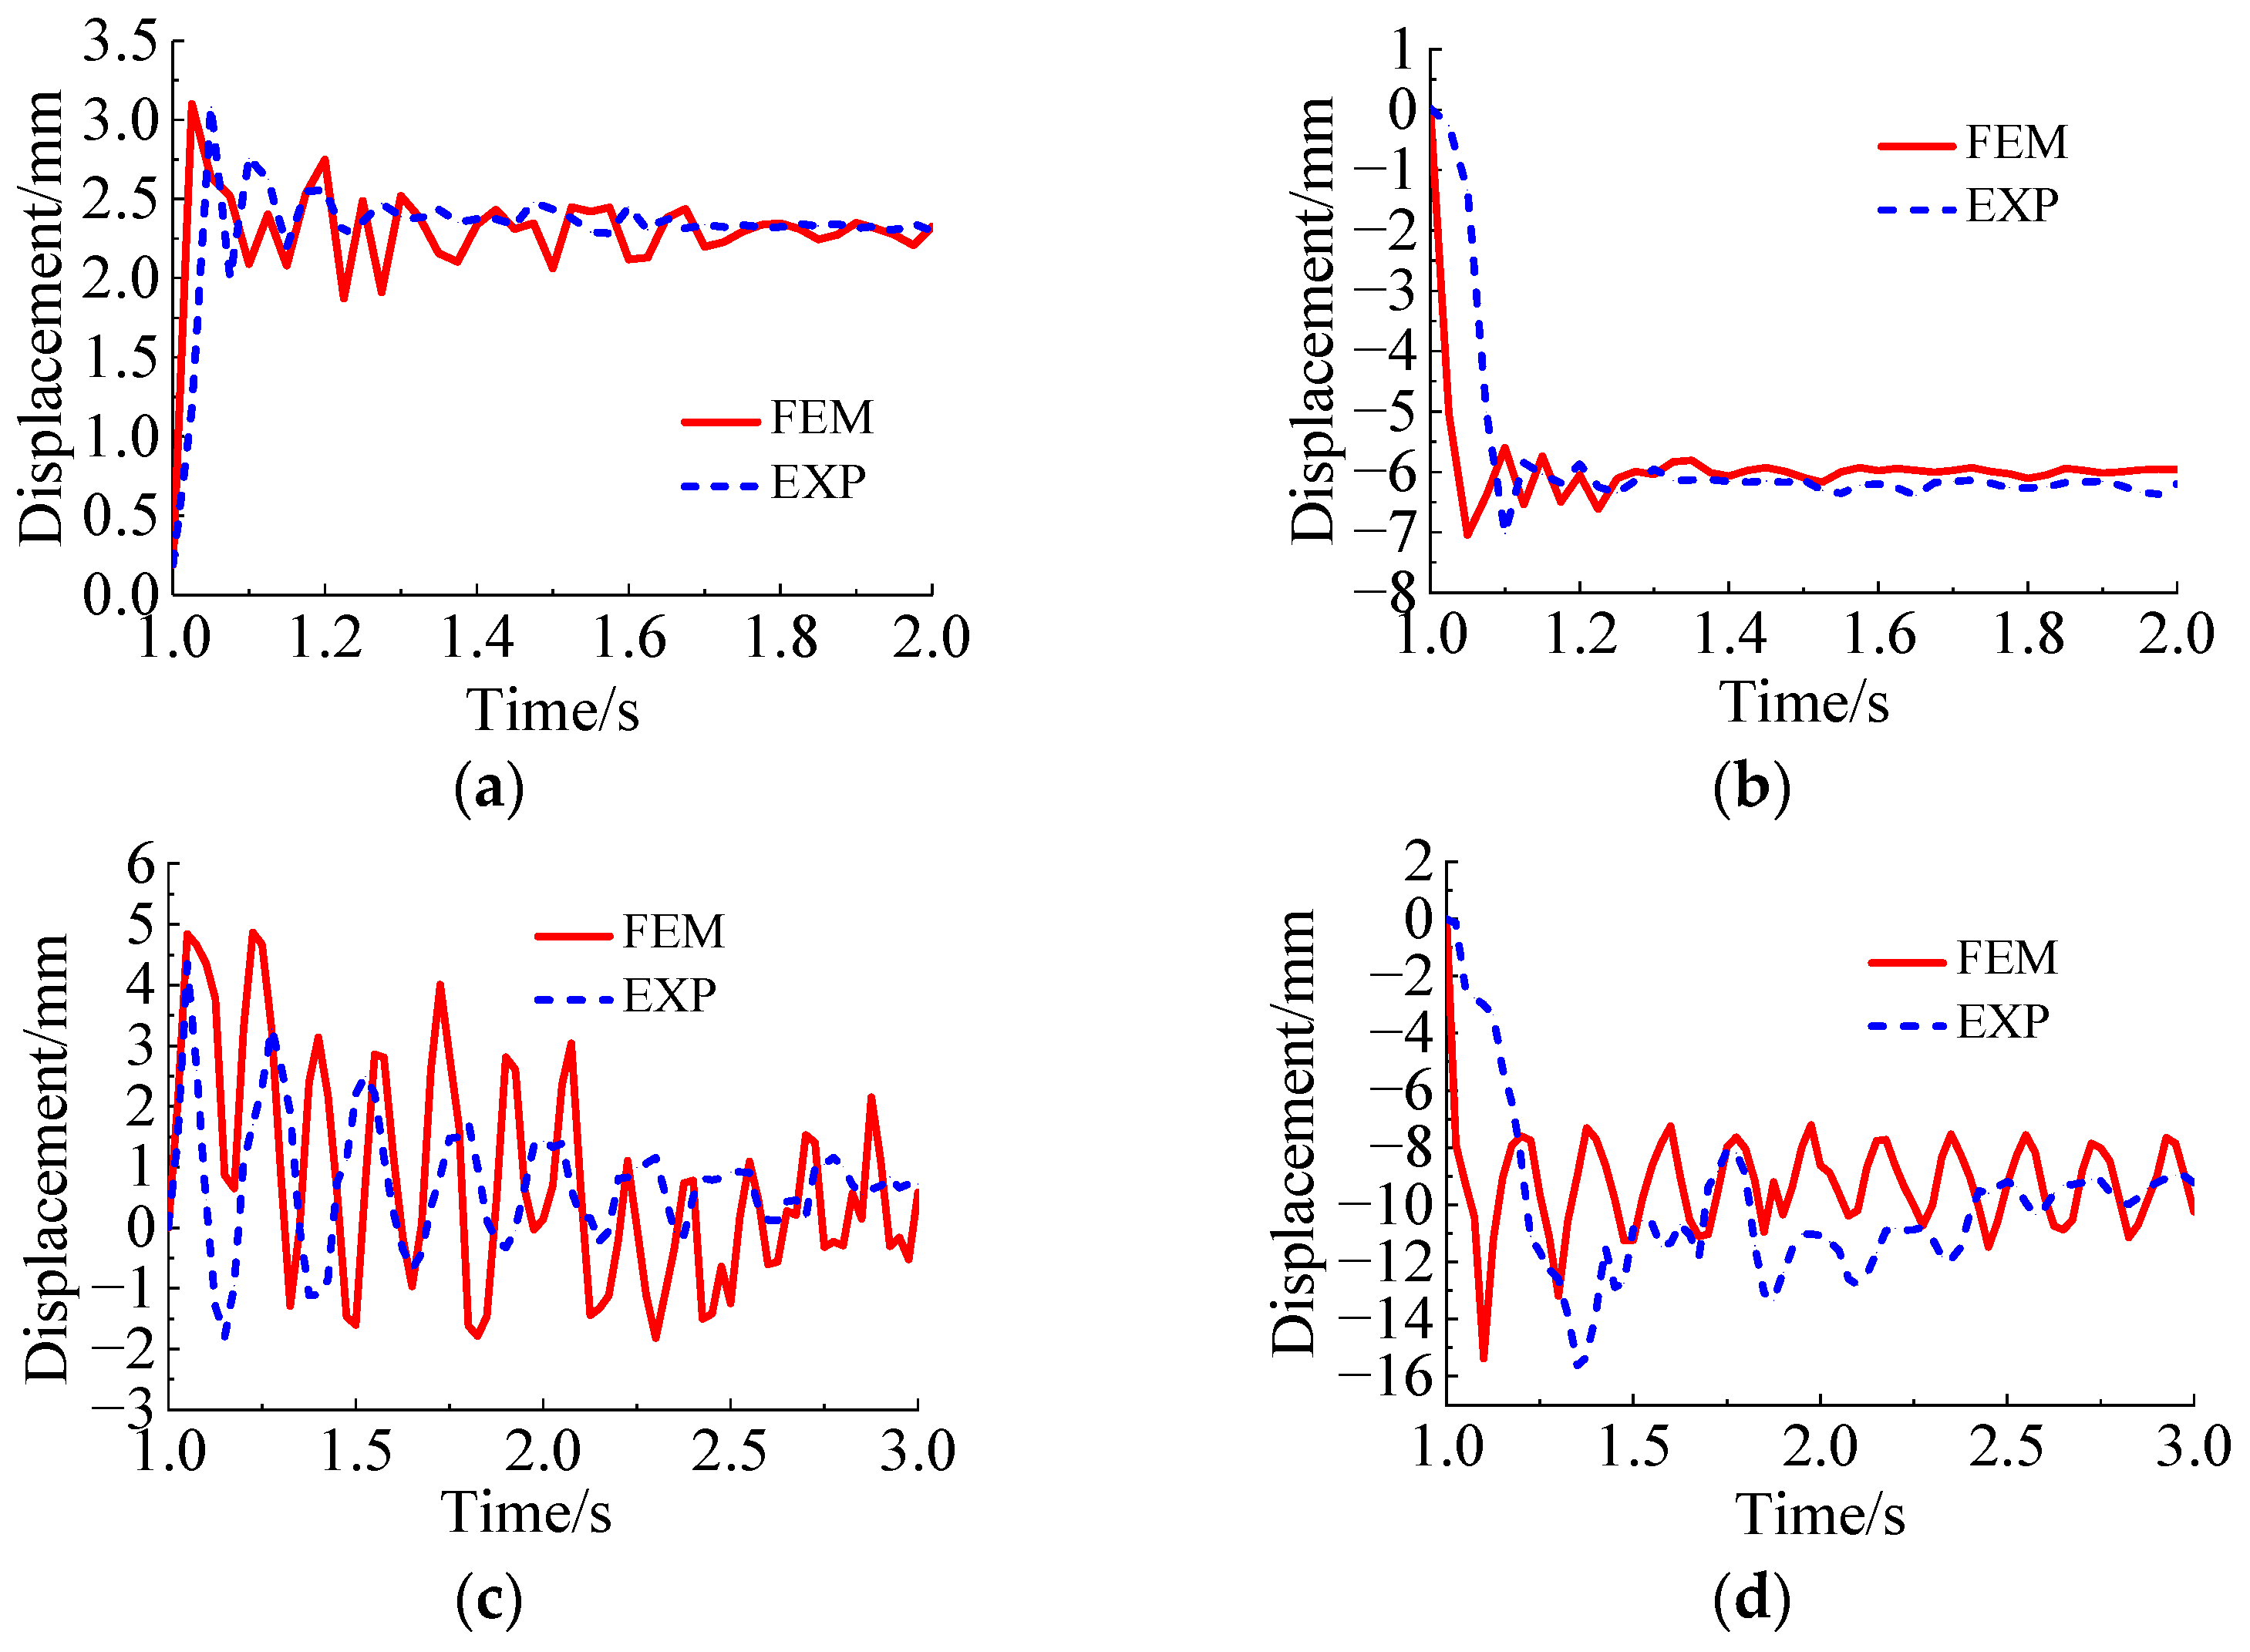
When the 1# short suspender and the 6# long suspender are broken, respectively, the displacement response of the arch rib and bridge deck system can be presented in Figure 12. It is observed that the displacement variations of the arch ribs would be small, and the measured maximum values are 3.05 mm and 4.35 mm, respectively, while the displacement changes the of main beams are fairly large, and their measured maximum values are −7.02 mm and −15.61 mm, respectively. From the results provided above, it can be seen that for the arch bridge structure base on the second type of suspension bridge deck system, the influence of the suspender fracture on the displacement of the bridge deck system is greater than that of the arch rib. This issue is attributed to the fact that the longitudinal beam is a multi-point elastic support structure. When the suspender is broken, the elastic support of the longitudinal beam suddenly decreases, which will produce a large disturbance and result in a large displacement in the longitudinal beam. For the arch rib structure, when the suspender breaks, the arch rib is still a complete consolidation structure at both ends, so the suspender fracture has little disturbance.
When each pair of suspenders is broken, the maximum measured displacement response of the arch rib and bridge deck system has been presented in Figure 13a. The plotted results reveal that when the 1# short suspender to the 6# long suspender is broken in turn, the maximum displacement response of the bridge deck system and the arch rib increases gradually, and the growing amplitudes are 2.22 and 1.43 times, respectively. The main reason is that the in-plane stiffness of the bridge deck system and arch ribs gradually lessens from the support positions at both ends to the mid-span point. As a result, the dynamic effect would be more apparent when the long suspender is broken; as the overall stiffness of the arch rib is large, the growing trend of the maximum displacement response of the arch rib is not noticeable.

4.2. Stress Dynamic Response Analysis

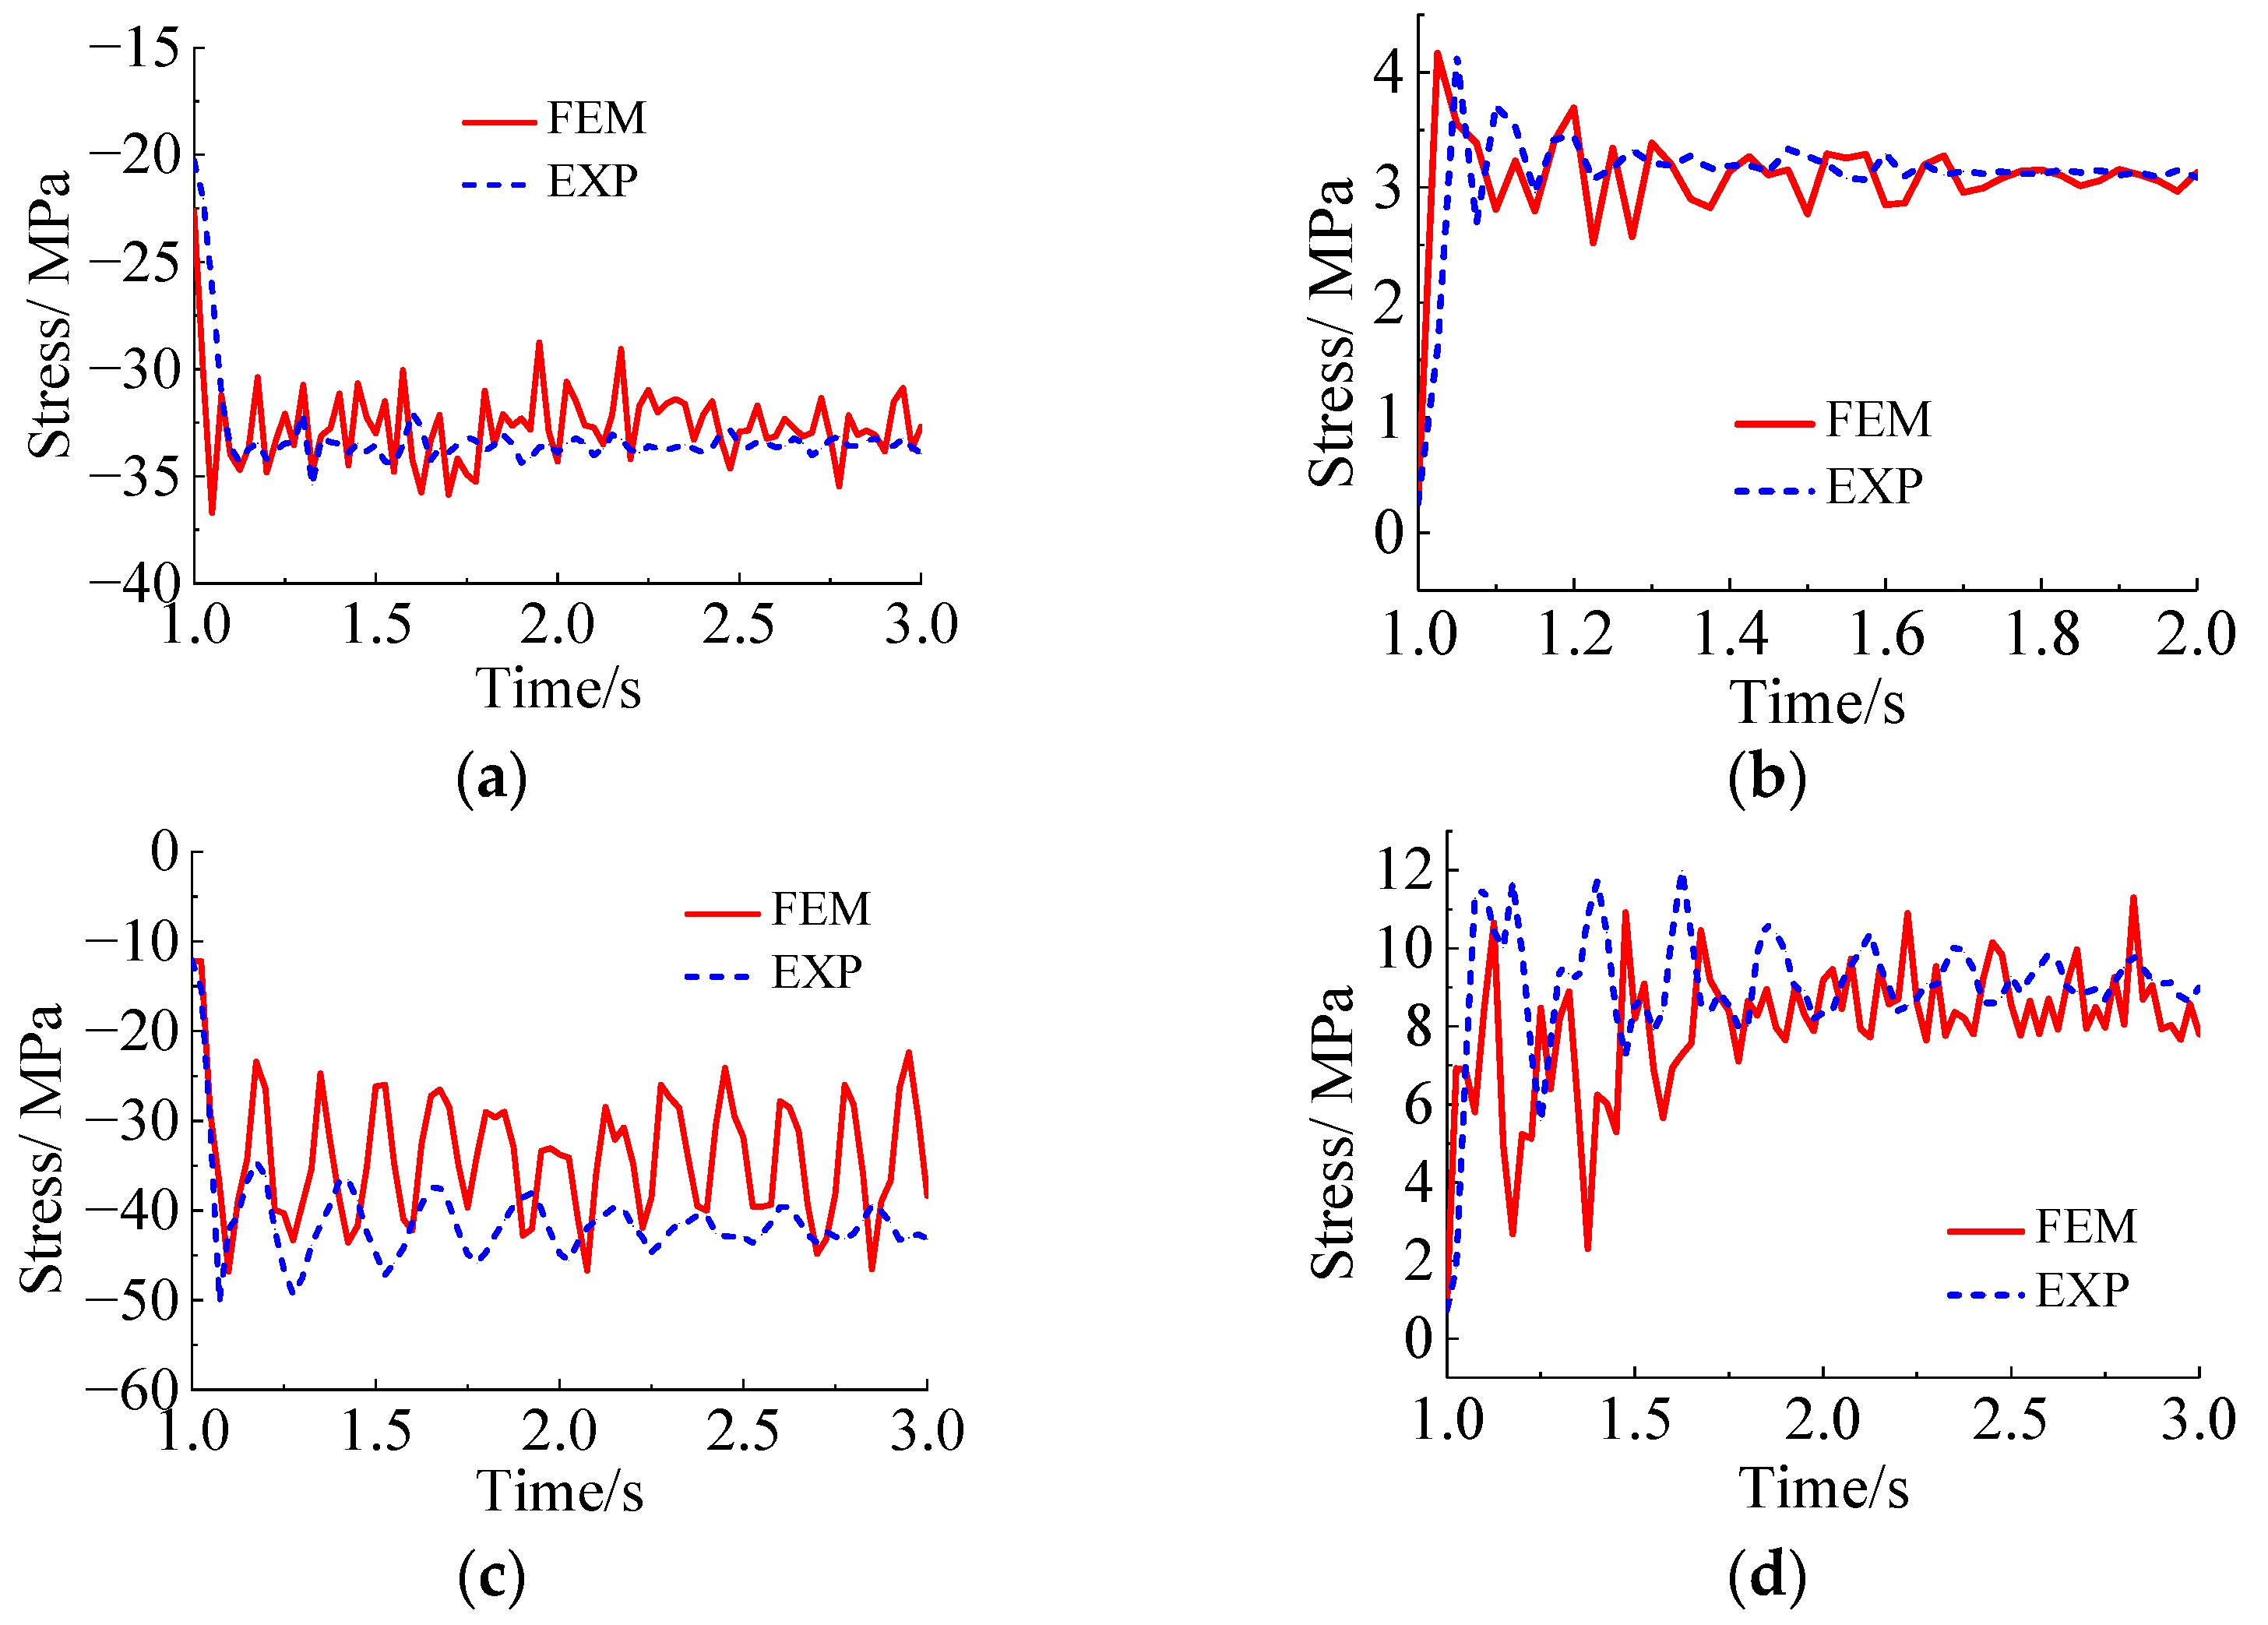
For the case of breakage of the 1# and 6# suspenders, respectively, the stress response of the arch rib and bridge deck system has been presented in Figure 14. The demonstrated results indicate that the stress variations of the arch rib are large, such that their maximum values are reported to be −35.41 MPa and −50.16 MPa, respectively. Additionally, the stress changes of the main beam are relatively small, and their corresponding maximum values due to the breakage of the above-mentioned suspenders are 4.14 MPa and 11.97 MPa, respectively. Since the stresses of the arch ribs at the 1# and 6# suspenders under the action of the dead load are −75.24 MPa and −63.28 MPa, respectively, there is still a certain safety margin for the arch ribs composed of Q345 steel. However, for the bridge deck system with C50 concrete, the 4.14 MPa and 11.97 MPa tensile stresses caused by the fracture of the 1# and 6# suspenders may lead to the cracking or even fracture of the longitudinal beam. According to the results provided above, for the arch bridge structure with the second type of suspension bridge deck system, although the influence of the suspender fracture on the arch rib stress is much greater than that on the bridge deck system, the impact of the suspender fracture on the longitudinal beam stress is greater than that on the arch rib from a structural safety standpoint.
When each pair of suspenders is broken, the maximum stress response of the arch rib and bridge deck system can be obtained per the plotted results in Figure 13b. The obtained results reveal that the maximum value of the stress response of both the arch ribs and deck system magnifies gradually when the suspenders 1# to 6# break. Actually, the effect of a long suspender break on the stresses in the arch ribs and the deck system is greater than the breakage of a short suspender. The main reason is basically the same as that given in Section 3.1 regarding the influence analysis of the displacement response during the suspender breaking.

4.3. Suspender Force Dynamic Response

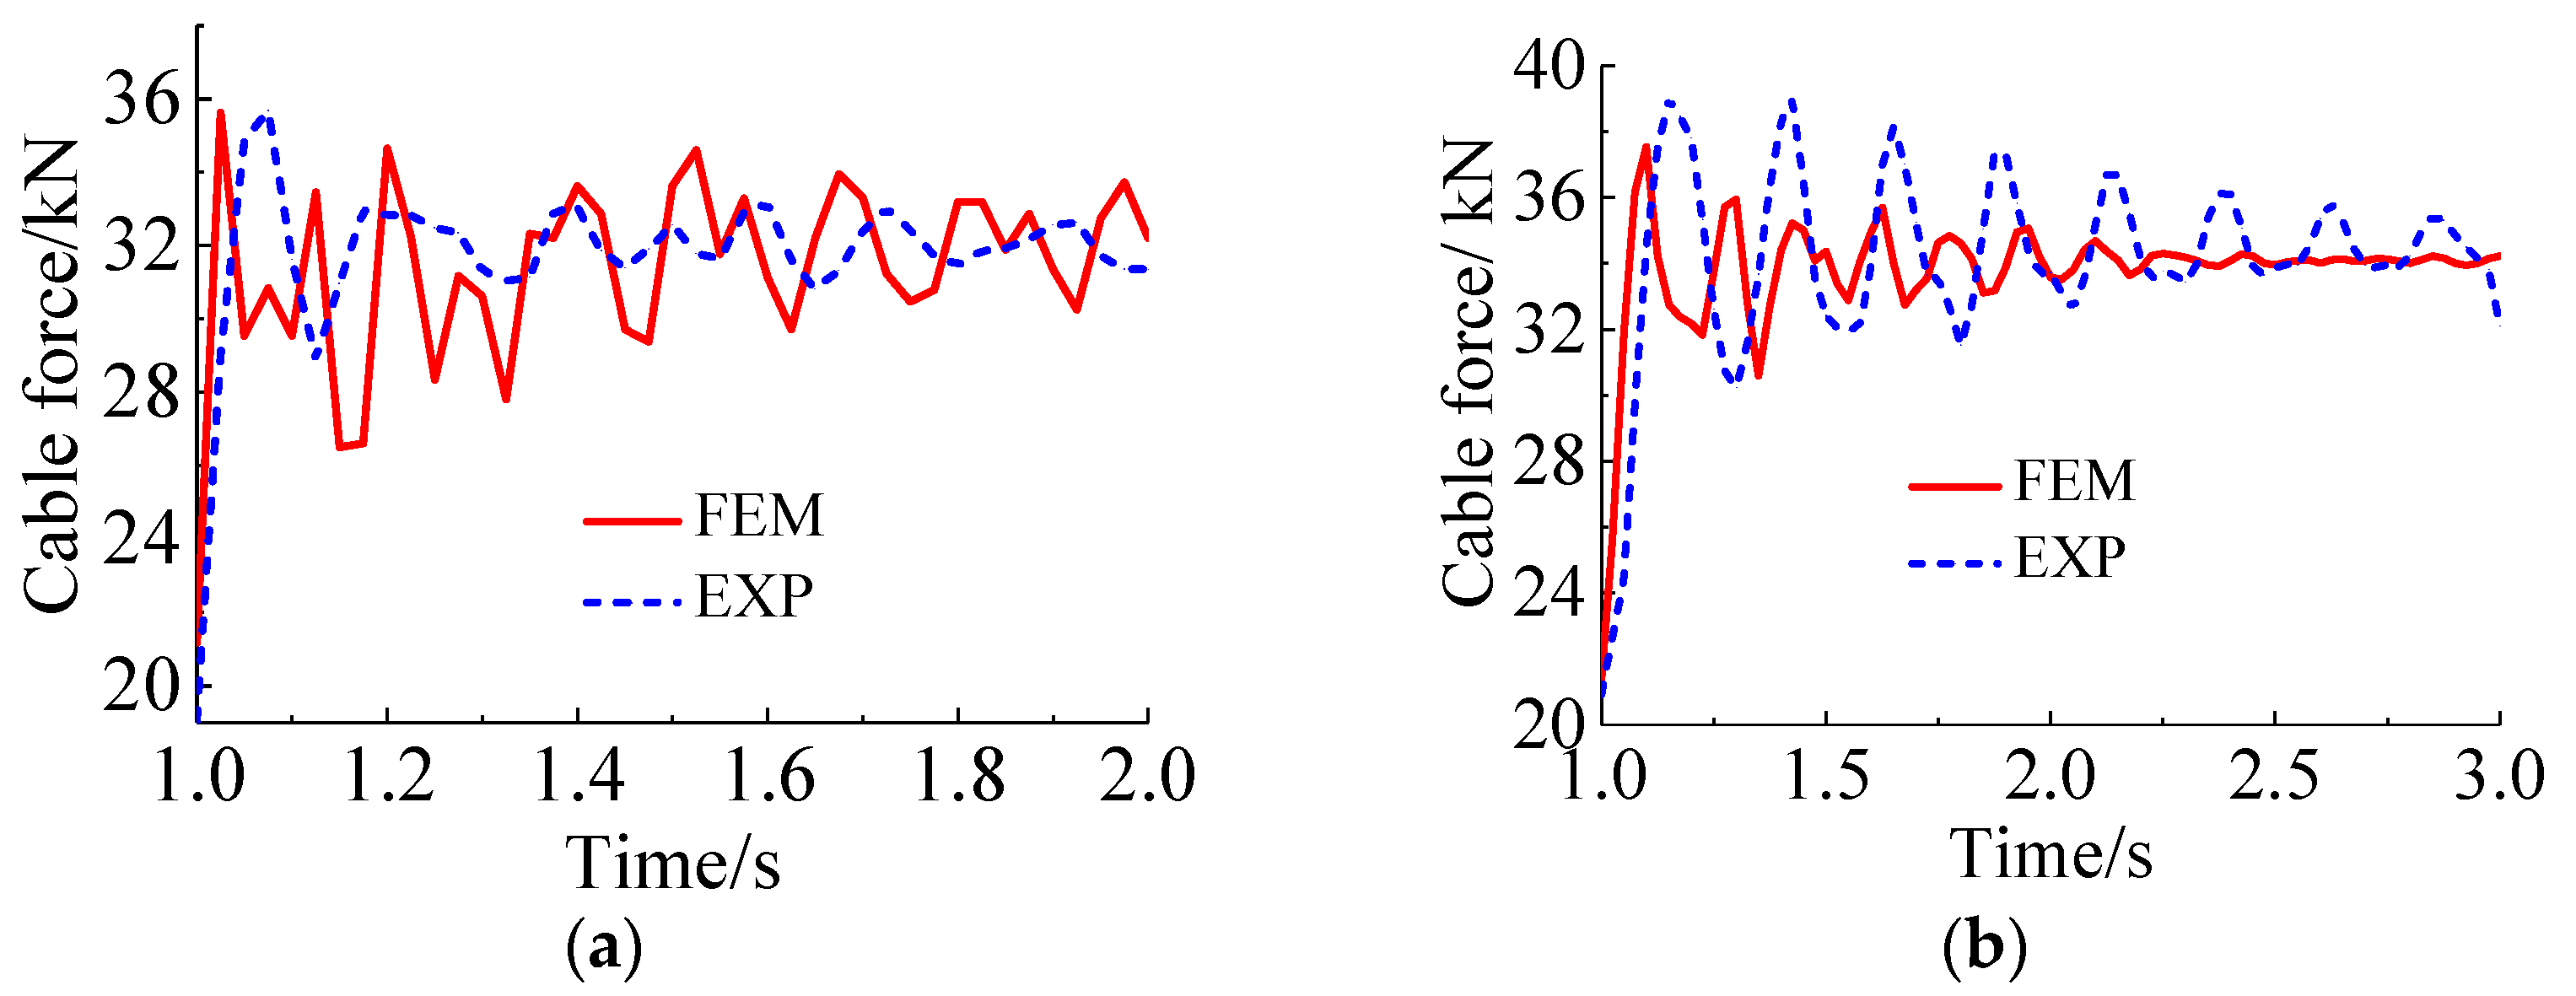
For the case of fracture occurrence in the 1# and 6# suspenders, respectively, the time history plots of the suspender force of the adjacent suspenders have been demonstrated in Figure 15. The maximum measured values of the adjacent suspenders’ suspender force when suspenders 1# and 6# broke are obtained as 35.68 kN and 37.54 kN, respectively. The maximum values of the suspender force response of the suspender adjacent to the broken suspender due to the breakage of different suspenders have been shown in Figure 16.
The plotted results reveal that when each suspender breaks separately, the resulting dynamic effect on the adjacent suspenders is similar, and the maximum suspender force increment percentage of the suspenders adjacent to the broken suspender is in the range of 70% to 85%. For instance, when the 2# secondary short suspender breaks, the adjacent 3# suspender is the most unfavorable, and the maximum suspender force reaches 40.07 kN. The main reason is that the 1# suspender is closer to the arch foot, and its corresponding suspender force due to the dead load is smaller than that of other suspenders, resulting in the suspender force of the 2# suspender being slightly larger than that of other suspenders. As a result, the dynamic effect on the elastic field of the adjacent suspenders represents the most influence due to the suspender breakage.

4.4. Accuracy Verification of Finite Element Model

In Section 4.1 and Section 4.3, when the 1# short suspender and the 6# long suspender break, respectively, the time history of the displacement and stress of the arch rib and the longitudinal beam at the broken suspender obtained from the specimen test and FE analysis, as well as the time history plots of the suspender forces of the suspenders adjacent to the broken suspender are relatively similar. The maximum displacement and stress of the arch rib and bridge deck system due to the suspender breakage obtained from the test and FEM as well as the maximum suspender forces of the suspenders adjacent to the broken suspender have been provided in Table 1 and Table 2. Table 1 and Table 2 display that, due to the fracture of the long and short suspenders, the maximum relative error between the test results and those of the FEM does not exceed 11%. It implies that the proposed FE modeling approach accounting for the fracture process of suspenders has good accuracy.

5. Equivalent Static Method Considering the Suspender Fracture Process

5.1. Development of an Equivalent Static Method Accounting for the Suspender Breakage

From the above test and FEM results, it can be seen that under the impact load of the suspender fracture, the displacement and stress responses of various components of the arch bridge oscillate to different degrees, and the resulting dynamic responses reach a maximum value in a short period. After a few seconds, the aforementioned responses tend to be stable, and the displacement and stress of each member after stability would be far less than the maximum value generated in the fracture process of the suspender. Therefore, the dynamic coefficient, μD, is introduced to the model for assessing the dynamic response of the residual structure in the suspender fracture process. Subsequently, an efficient equivalent static method considering the fracture process of the suspender is proposed.
In Figure 17, the elements of the proposed equivalent static method accounting for the suspender fracture process are schematically displayed. For this purpose, an external load ND is applied to the arch rib and the main beam at the broken suspender simultaneously. Under the externally exerted force, the static effect of each structural element of the arch bridge is consistent with the maximum dynamic response considering the suspender fracture process. The magnitude of ND is essentially determined based on the initial suspender force N0 and the dynamic coefficient before breaking the suspender μD as follows:
ND = μDN0

5.2. Construction of the Half-Through and Through CFST Standard Arch Bridges

In order to make the proposed ESCM suitable for the calculation and analysis of the broken suspenders of various half-through and through CFST arch bridges, it is necessary to evaluate widely representative dynamic coefficients μD. To this end, this section is aimed to carry out parametric statistics analysis on the existing half-through and through CFST arch bridges and then construct the half-through and through CFST standard arch bridges. On this basis, a systematic assessment of the dynamic response of the half-through and through CFST standard arch bridges under the action of sling fracture will be given, leading to the determination of the representative dynamic coefficient μD in the proposed ESCM for the half-through and through CFST standard arch bridges.
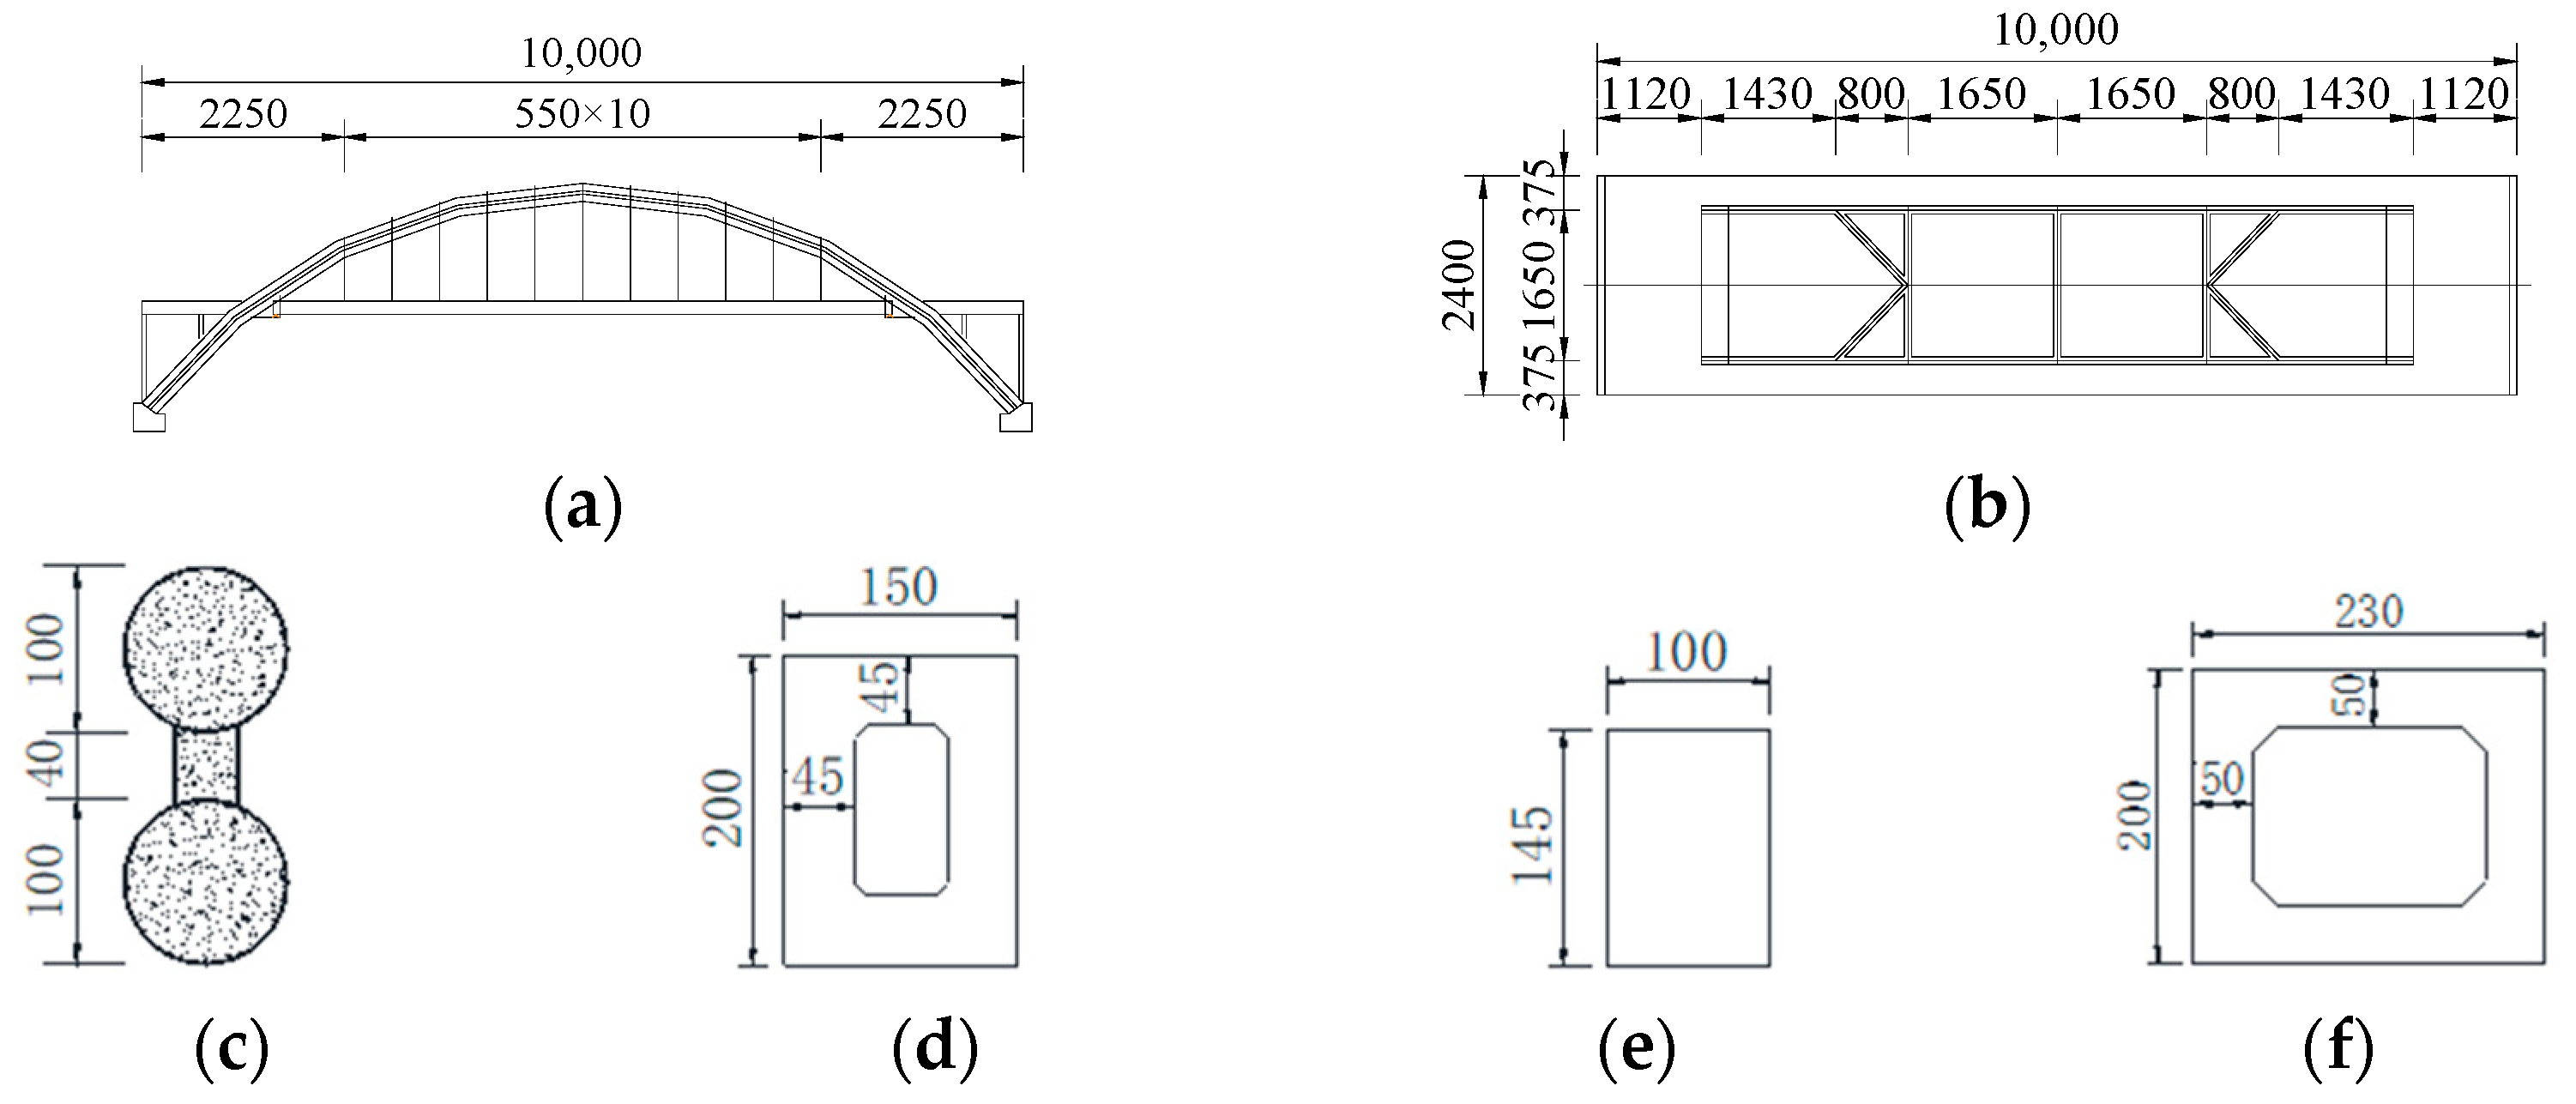
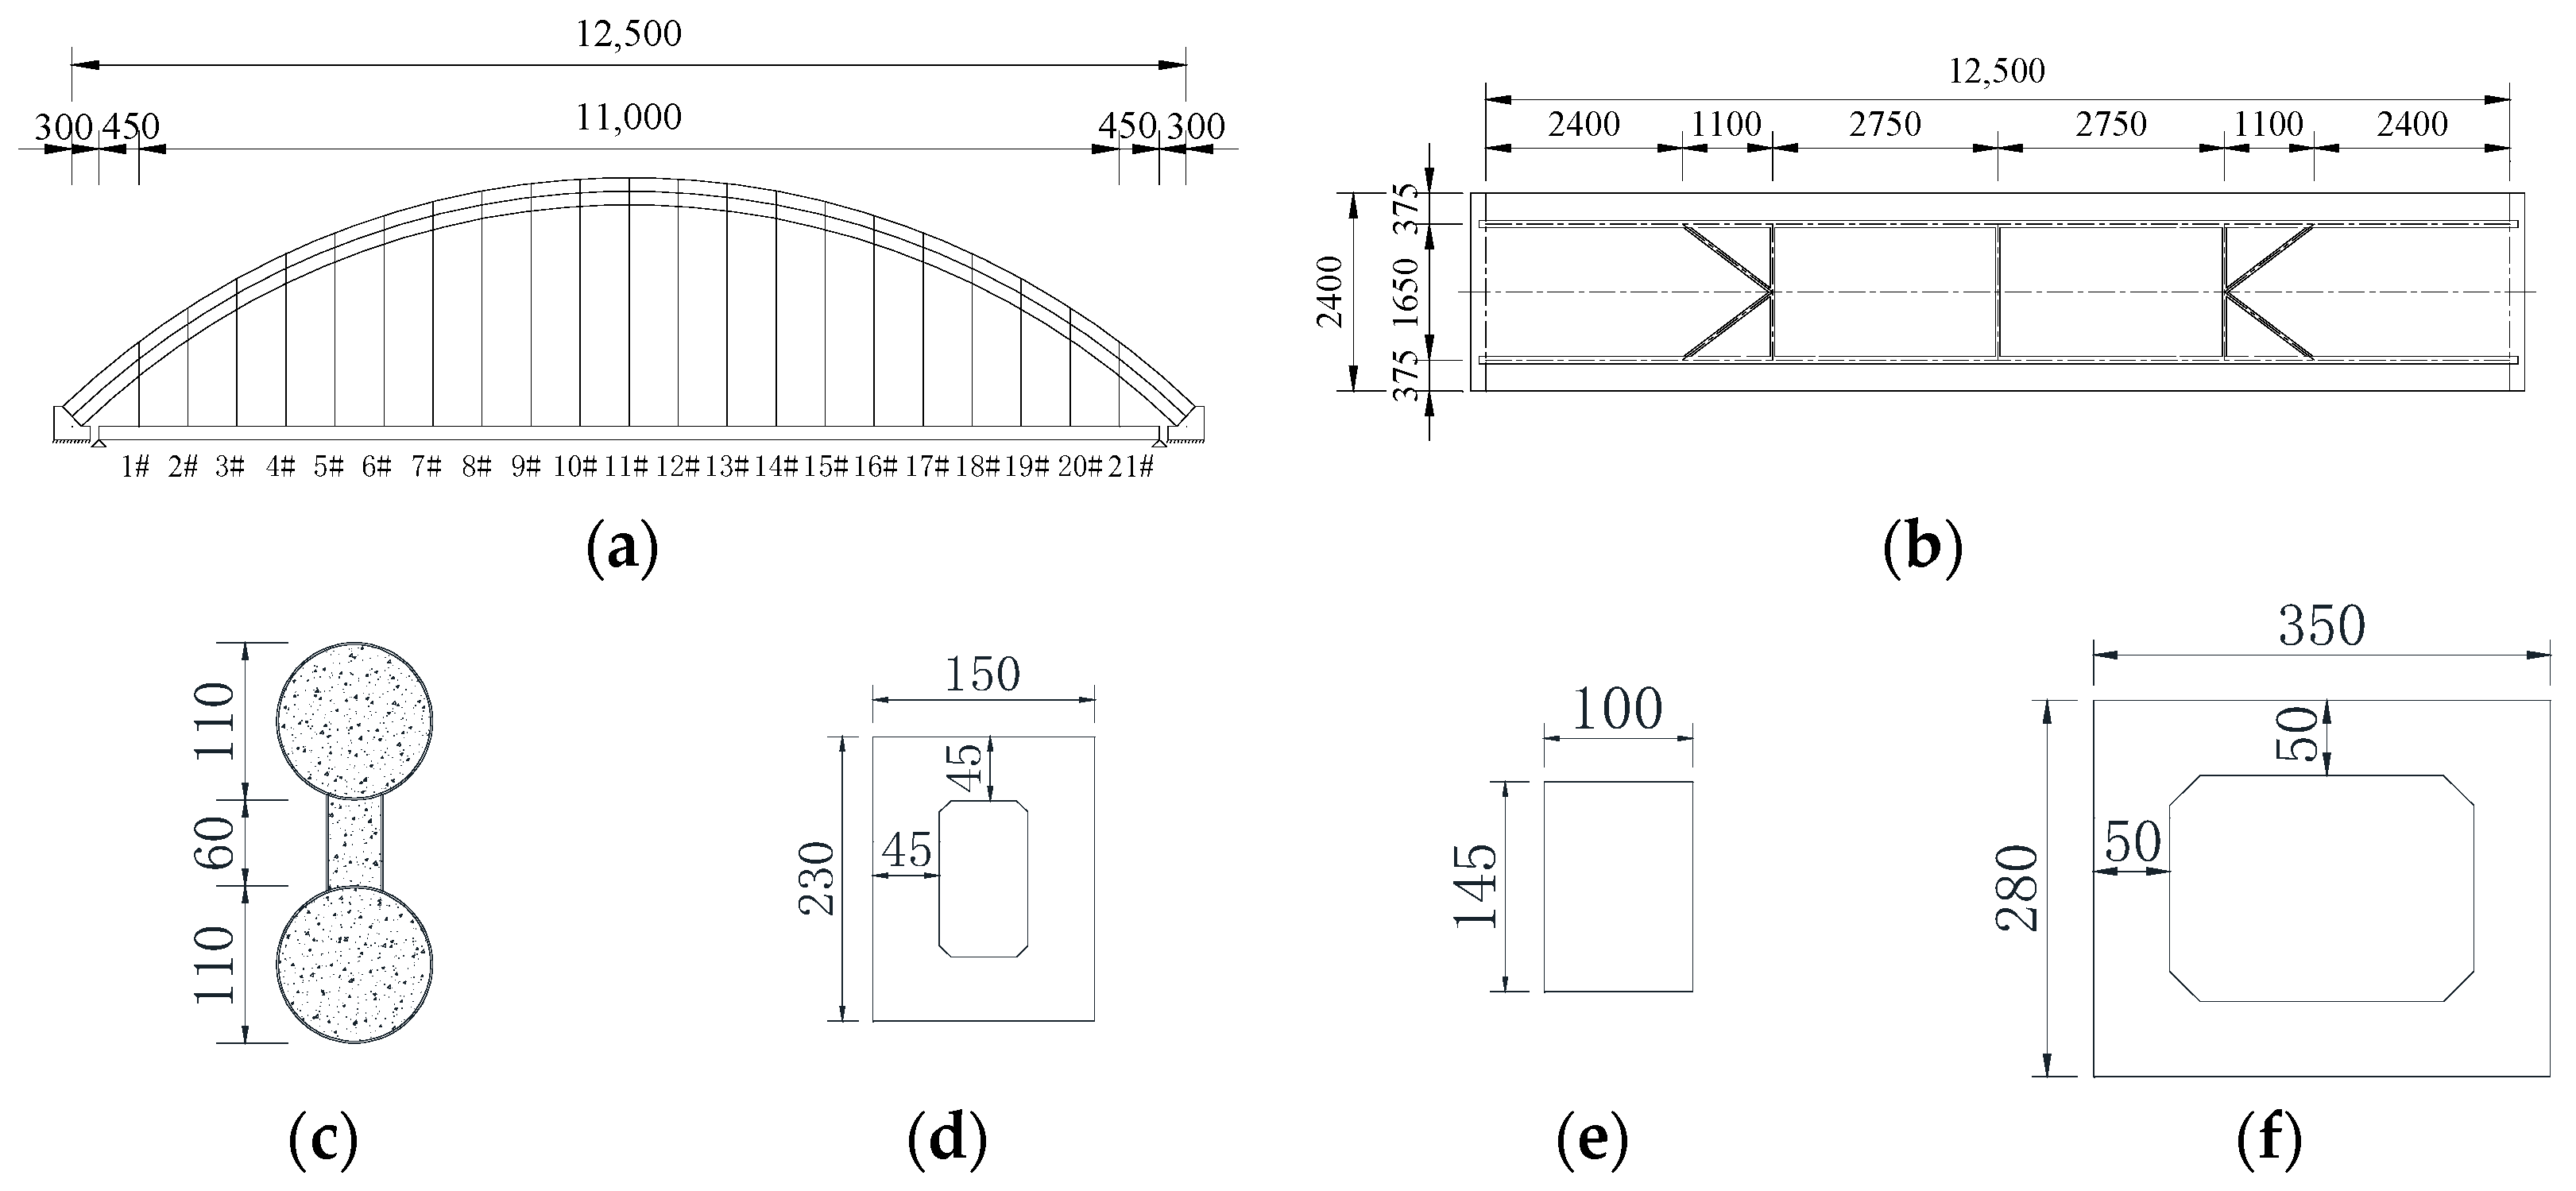
Herein, the relevant data of 80 half-through and 62 through CFST arch bridges built in China are collected. Through the statistical analysis of the structural parameters of these bridges, the half-through CFST standard arch bridges with spans of 100, 150, 200, 250, and 300 m as well as the through CFST standard arch bridges with spans of 85, 95, 105, 115, 125, and 135 m are rationally constructed. Further, the design compound checking calculation is carried out to make the standard arch bridge meet the requirements of the design specifications [6,23].
Let us take the half-through CFST arch bridge of span 100 m and the through CFST arch bridge with a span of 125 m as examples, where their corresponding general layouts and main component cross-sections have been demonstrated in Figure 18 and Figure 19.

5.3. The Value Analysis of the Dynamic Coefficient

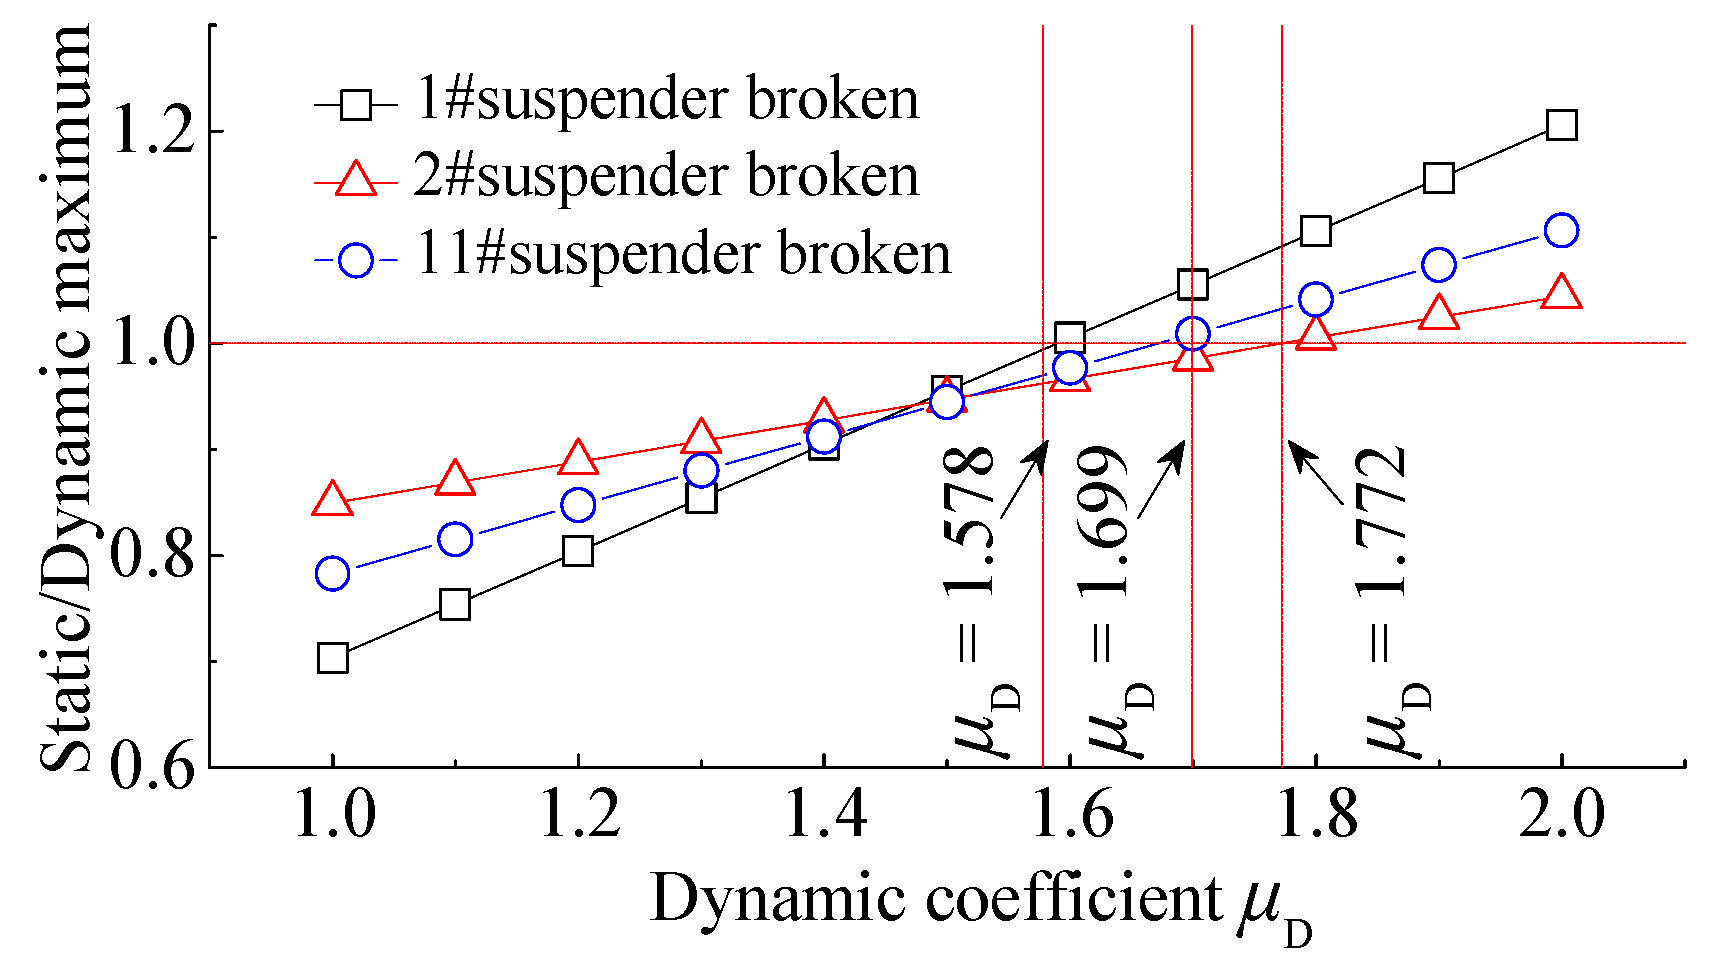
According to the given analysis in Section 3, the influence of the suspender fracture on the displacement and stress of the bridge deck system is greater than the arch rib. After the suspender fracturing, the arch rib still has a certain degree of safety, and the bridge deck system may crack or even fracture. The influence of each suspender breakage on the suspender force of the suspenders close to the broken suspender is somehow similar. Therefore, as long as the equivalent static analysis results of the longitudinal beam and suspenders are equivalent to the corresponding results of the dynamic analysis, the safety of the bridge due to the suspender breakage can be guaranteed. In addition, because the fracture of the long suspender has the largest impact on the displacement and stress of the longitudinal beam, and the fracture of the sub-short suspender has a large impact on the suspender force of the suspender, three cases of short suspender, sub-short suspender, and long suspender fracture are considered for the value analysis of the dynamic coefficient (μD) in this part.
Let us take into account the 125 m through CFST standard arch bridge constructed in Section 4.2 as an example and assume that the dynamic coefficient increases from 1.0 to 2.0 when the suspender breaks. The static analysis of the standard arch after the suspender breaking is carried out according to the method explained in some detail in Section 4.1. Subsequently, the maximum values of the static analysis results are compared with the dynamic analysis results, and thereby, a reasonable value for the dynamic coefficient (μD) is obtained.

5.3.1. The Influence of Suspender Breaking Duration on Dynamic Coefficient

According to the given analysis in Section 2.2, the previous analysis, no matter the establishment of ESCM, or the test and finite element calculation carried out, the suspender breaking duration is 0.1 s. However, in practical projects, suspender breakage generally occurs in a moment, and the existing research has not given the specific duration of suspender breakage. Therefore, this section will take 0.2 s, 0.15 s, 0.1 s, 0.05 s, and 0.01 s as suspender breaking durations to analyze the influence of suspender breaking duration on the value of the dynamic coefficient.
The time history plot of the stress of the longitudinal beam in different suspender breaking durations for the case of breakage of the 11 suspenders of 125 m through CFST standard arch bridge has been demonstrated in Figure 20a, and the maximum dynamic response corresponding to each working condition in Figure 21a. For the longitudinal beam, the maximum stress increases with the shortening of the suspender breaking duration. It can be seen from Figure 21a that when the suspender breaking duration is shortened from 0.2 s to 0.1 s, the maximum stress increase is 10.1%, while when the suspender breaking duration is shortened from 0.1 s to 0.01 s, the increase is only 3.1%. Therefore, it can be considered that when the duration of suspender breakage is less than or equal to 0.1 s, the influence on the value of the longitudinal beam dynamic coefficient can be ignored. The time history plots of the suspender force in different suspender breaking durations of the suspenders adjacent to the broken suspender when the 2# sub-short suspender breaks can be calculated, as presented in Figure 20b, and the maximum dynamic response corresponding to each working condition in Figure 21b. For adjacent suspenders, the maximum stress increases with the shortening of the suspender breaking duration, as presented in Figure 21b, when the suspender breaking duration is shortened from 0.2 s to 0.15 s, the maximum stress increase is 8.8%, while when the suspender breaking duration is shortened from 0.15 s to 0.01 s, the increase is only 4.1%. Therefore, it can be considered that when the duration of the suspender breakage is less than or equal to 0.15 s, the influence of the duration of the suspender breakage on the value of the longitudinal beam dynamic coefficient can be ignored.

5.3.2. The Equivalent Dynamic Response of the Longitudinal Beam

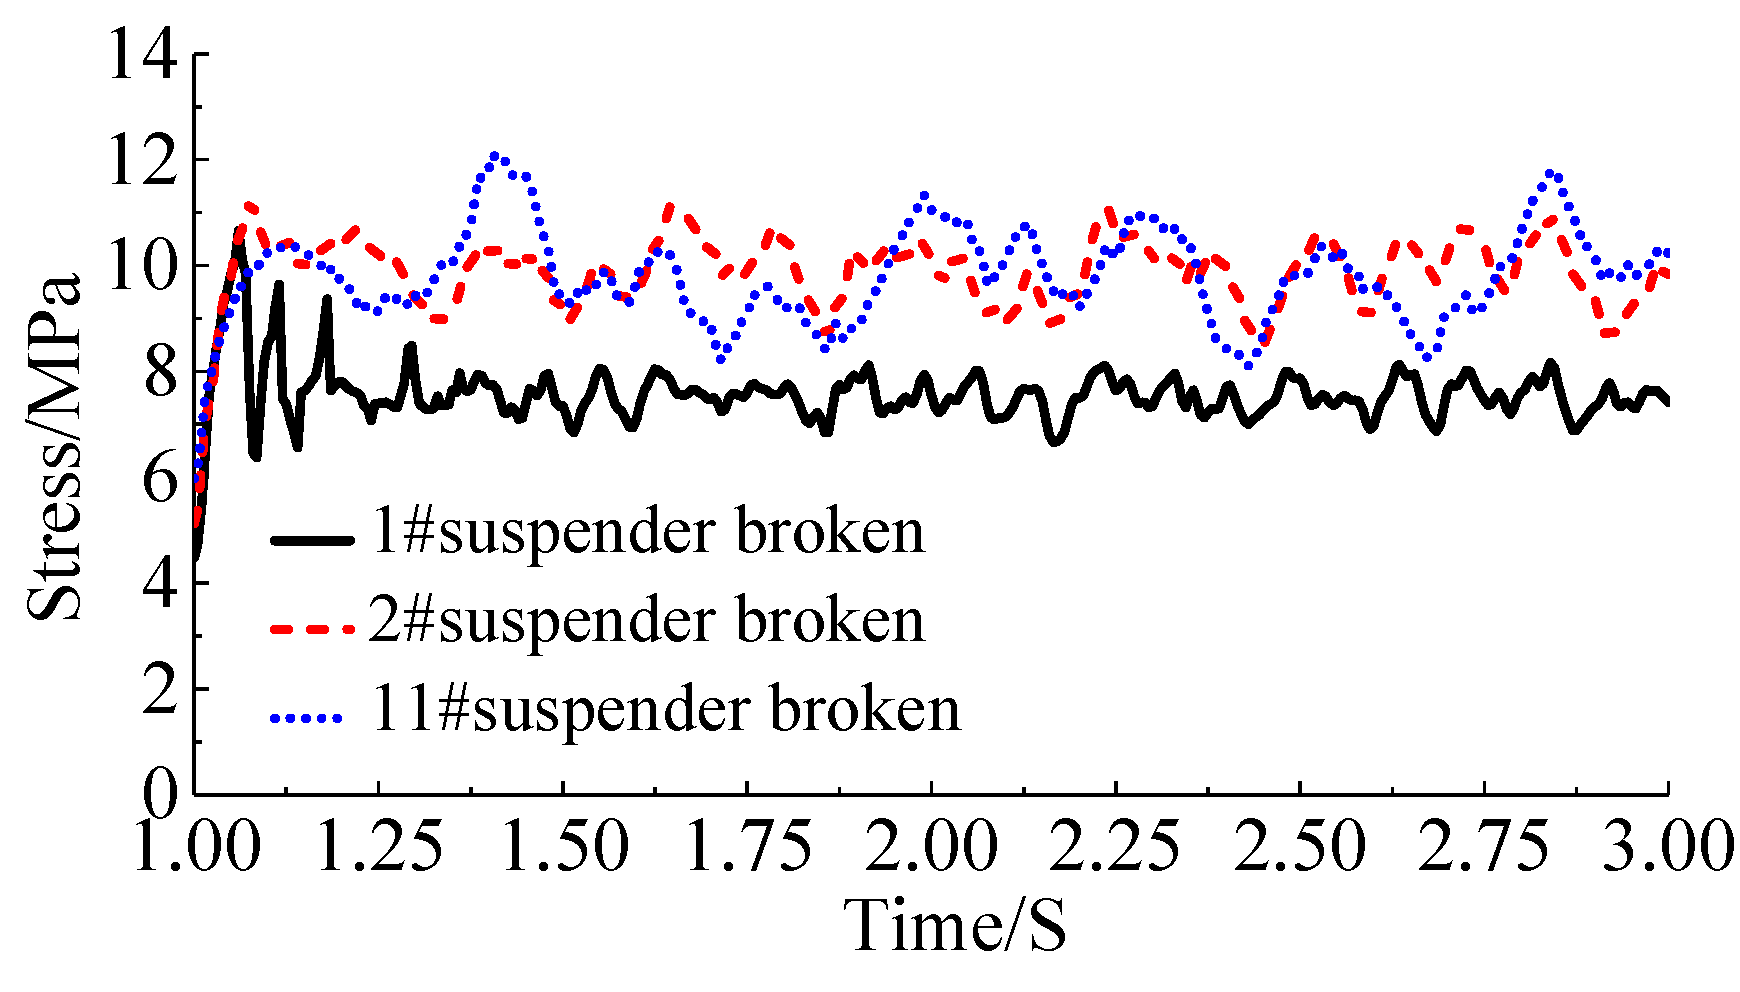
The time history plot of the stress of the longitudinal beam for the case of the breakage of the 1#, 2#, and 11# suspenders of the 125 m through CFST standard arch bridge has been demonstrated in Figure 22. The plotted graphs clearly show that the maximum resulting stresses are 10.661, 11.187, and 12.137 MPa, respectively. For different dynamic coefficients, the ratio of the equivalent stress of the longitudinal beam obtained by static analysis to the maximum stress due to the suspender breakage has been demonstrated in Figure 23. For the longitudinal beam, when the short suspender, second short suspender, and the long suspender are ruptured, and the dynamic coefficients would be 1.578, 1.699, and 1.772, respectively, the stress of the longitudinal beam at the broken suspender calculated by the equivalent static method is consistent with the maximum value of the dynamic analysis result.

5.3.3. The Equivalent Dynamic Response of the Suspender

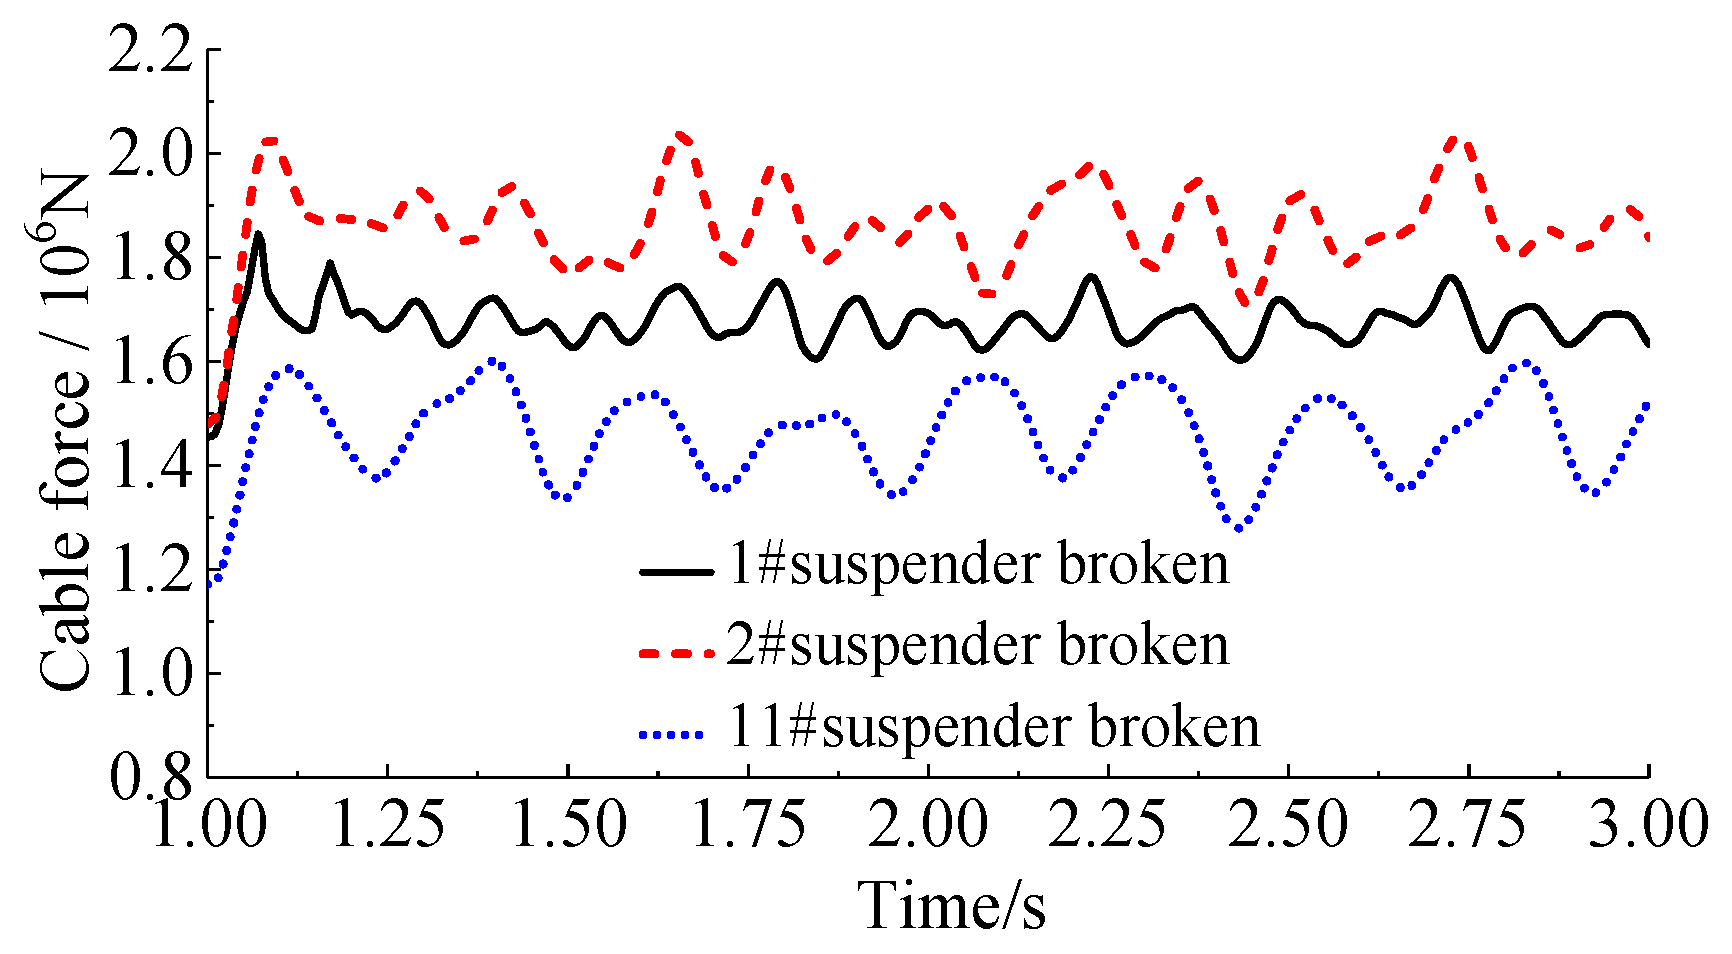
Due to the rupturing of the 1#, 2#, and 11# suspenders of the 125 m through CFST standard arch bridge, the time history plots of the suspender force of suspenders adjacent to the broken suspender can be calculated, as presented in Figure 24. The demonstrated results apparently display that the maximum suspender forces because of the breakage of the above-mentioned suspenders in order are 1.82 × 10⁶, 2.03 × 10⁶, and 1.60 × 10⁶ N. In order to evaluate various dynamic coefficients, the ratio of the equivalent suspender force of the suspender obtained by the static analysis to the maximum suspender force due to the suspender breakage should be carefully assessed, as displayed in Figure 25. It is observable that for the suspenders adjacent to the above-mentioned broken suspenders when the dynamic coefficients in order are considered as 1.578, 1.672, and 1.649, the suspender force calculated by the equivalent static method would be consistent with the maximum value of the dynamic calculation results.

5.4. The Value Determination of the Dynamic Coefficient

By utilizing the same analysis procedure explained above, the dynamic coefficients of the half-through and through CFST standard arch bridges with various spans due to the suspender breakage are calculated. The predicted results for the case of rupturing of the short, sub-short, and long suspenders have been presented in Figure 26 and Figure 27. The demonstrated graphs display that when the ESCM accounting for the suspender fracture process is employed for the analysis of half-through and through CFST arch bridges, the dynamic coefficients of the consisting longitudinal beams can be safely taken into account as 1.8; while those of suspenders would be 1.8 and 1.7, respectively.

6. Conclusions

(1)
A suspender-breaking trigger device composed of a wedge-shaped steel block and electromagnet clamp is proposed. The trigger device can break the suspender within 0.1 s and accurately simulate the suspender fracture process of the real bridge. Additionally, when the suspender break duration is less than or equal to 0.15 s, the influence of the suspender break duration on the value of the dynamic coefficient can be ignored.
(2)
The displacement and stress maximum variations of the deck system (arch rib) are 7.02 mm (3.05 mm) and 4.14 MPa (−35.41 MPa) when the 1# suspender is broken, respectively. The displacement and stress maximum variation of the deck system (arch rib) are 15.61 mm (4.35 mm) and 11.97 MPa (−50.16 MPa) when the 6# suspender is broken, respectively. This reveals that the influence of the suspender fracture on the displacement and stress of the longitudinal beam is much greater than that on the arch rib. The fracture of the long suspender has a great influence on the displacement and stress of the longitudinal beam and arch rib.
(3)
The error between the finite element analysis and the test results is within 11%. The proposed FE modeling method can accurately simulate the suspender fracture process and can be extended to the dynamic response analysis of suspension bridge deck systems of both half-through and through CFST arch bridges accounting for the suspender fracture process.
(4)
The dynamic coefficient is introduced to consider the dynamic effect of the suspender-breaking process. Thereafter, the equivalent static method for both half-through and through CFST-based arch bridges accounting for the dynamic effect of the suspender breaking is established. Through the comparative analysis of the static and dynamic results of eleven different span half-through and through CFST standard arch bridges with various suspenders breaking, it is observed that when the ESCM is employed, the dynamic coefficients of the longitudinal beams (suspenders) can be conservatively taken as 1.8 (1.8) and 1.8 (1.7), respectively.
(5)
In this paper, an equivalent static calculation method for half-through and through concrete-filled steel tubular arch bridges considering the process of suspender fracture is established, and the conservative value of the dynamic coefficient is determined. Subsequently, the influence of important parameters such as the stiffness of the longitudinal girder and arch rib on the dynamic coefficient will be studied.

Author Contributions

K.C., Q.W., J.L. and H.W. conceived and designed the experiments; K.C. and Q.W. performed the experiments and analyzed the data; K.C. and Q.W. contributed reagents/materials/analysis tools; and K.C. wrote the paper. All authors have read and agreed to the published version of the manuscript.

Funding

This research was funded by the National Key Research and Development Program of China (No. 2017YFE0130300) and the National Natural Science Foundation of China (No. 52078137, 51678154).

Data Availability Statement

The data presented in this study are available on request from the corresponding author.

Acknowledgments

The tests were conducted at Fujian Provincial Key Laboratory on Multi-Disaster Prevention and Mitigation in Civil Engineering at Fuzhou University. The support provided by the laboratory staff is gratefully acknowledged.

Conflicts of Interest

The authors declare no conflict of interest.

References

  1. Haag, J.; Reguly, A.; Strohaecker, T. Effect of tensile overloads on fatigue crack growth of high strength steel wires. Mater. Des. 2013, 52, 190–195. [Google Scholar] [CrossRef]
  2. Liu, J.F.; Li, Y.B.; Zhang, Q.W. Mechanical behavior of damaged strand suspender with asymmetric broken wires in arch bridges. J. Tongji Univ. (Nat. Sci.) 2019, 47, 451–457. [Google Scholar]
  3. Chen, B.C.; Fan, B.H.; Yu, Y.G.; Wu, Q.X.; Huang, J.Z. Robustness design of concrete-filled steel tube arch bridges. Bridge Constr. 2016, 46, 88–93. [Google Scholar]
  4. Huang, F.H. Vulnerability Analysis of Through Concrete-Filled Steel Tube Arch Bridge; Hefei University of Technology: Hefei, China, 2021. [Google Scholar]
  5. Fan, B.H.; Chen, B.H.; Wu, Q.X. Technical condition evaluation of half-through and through arch bridges considering robustness. Bridge Constr. 2018, 48, 64–68. [Google Scholar]
  6. GB 50923-2013; Technical Code for Concrete-Filled Steel Tube Arch Bridges. China Communications Press: Beijing, China, 2013.
  7. Starossek, U. Avoiding Disproportionate Collapse of Major Bridges. Struct. Eng. Int. 2009, 19, 289–297. [Google Scholar] [CrossRef] [Green Version]
  8. Zoli, T.P.; Steinhouse, J. Some Considerations in the Design of Long Span Bridges against Progressive Collapse; HNTB Corp.: New York, NY, USA, 2010; Volume 1, pp. 6–14. [Google Scholar]
  9. Zoli, T.P.; Woodward, R. Design of long span bridges for cable loss. IABSE Symp. Lisbon 2005, 90, 17–25. [Google Scholar]
  10. Li, Y.; He, S.H. Research on robustness performance of shallow type arch bridge based on suspender damage. J. Hefei Univ. Technol. 2014, 37, 1254–1258. [Google Scholar]
  11. Jiang, R.J.; Francis, T.K.A.; Wu, Q.M. Improved hanger design for robustness of through-arch bridges. Proc. Inst. Civ. Eng.-Bridge Eng. 2013, 166, 193–204. [Google Scholar] [CrossRef] [Green Version]
  12. Ruiz, T.A.M.; Aparicio, A.C. Response of under-deck cable-stayed bridges to the accidental breakage of stay cables. Eng. Struct. 2009, 31, 1425–1434. [Google Scholar] [CrossRef] [Green Version]
  13. Wang, Z.M.; Hu, X.L.; Gu, C.K.; Ruan, X. Research on structural robustness for single cable loss in combination. Struct. Eng. 2012, 28, 50–54. [Google Scholar]
  14. Jin, X.L.; Yang, Y.; Qian, K. Research on Force Performance of Cable Breaking on Cable-stayed Bridges Applied Mechanics and Materials. Appl. Mech. Mater. 2014, 644, 5061–5064. [Google Scholar] [CrossRef]
  15. Wu, Q.X.; Yu, Y.G.; Chen, B.C. Dynamic analysis for cable loss of a rigid-frame tied through concrete-filled steel tubular arch bridge. J. Vib. Shock. 2014, 33, 8–13. [Google Scholar]
  16. Shao, G.; Jin, H.; Jiang, R.; Xu, Y. Dynamic Response and Robustness Evaluation of Cable-Supported Arch Bridges Subjected to Cable Breaking. Shock Vib. 2021, 2021, 6689630. [Google Scholar] [CrossRef]
  17. Yu, Y.G. Study on Robustness of Suspended Floor System in Half-Through and Through Arch Bridges; Fuzhou University: Fuzhou, China, 2015. [Google Scholar]
  18. Minaei, A.; Daneshjoo, F.; Goicolea, J.M. Experimental and numerical study on cable breakage equivalent force in cable-stayed structures consisting of low-relaxation seven-wire steel strands. Structures 2020, 27, 595–606. [Google Scholar] [CrossRef]
  19. Qiu, W.; Jiang, M.; Zhang, Z. Responses of self-anchored suspension bridge to sudden breakage of hangers. Struct. Eng. Mech. 2014, 50, 241–255. [Google Scholar] [CrossRef]
  20. Loto, C.A. Stress corrosion cracking: Characteristics, mechanisms and experimental study. Int. J. Adv. Manuf. Technol. 2017, 93, 3567–3582. [Google Scholar] [CrossRef]
  21. Samiei, K.; Peters, B.; Bolten, M.; Frommer, A. Assessment of the potentials of implicit integration method in discrete element modelling of granular matter. Comput. Chem. Eng. 2012, 49, 183–193. [Google Scholar] [CrossRef]
  22. Clough, R.W.; Penzien, J. Dynamics of Structures. In Computers and Structures; McGraw-Hill College: New York, NY, USA, 2003. [Google Scholar]
  23. JTG/T D65-06-2015; Specifications for Design of Highway Concrete-Filled Steel Tubular Arch Bridge. China Communications Press: Beijing, China, 2015.
Figure 1. Three types of the bridge deck system structure: (a) first type; (b) second type; (c) third type.
Applsci 12 11619 g001
Figure 2. Overall layouts of the test specimen (unit: cm): (a) vertical view; (b) lateral view; (c) plane view.
Applsci 12 11619 g002
Figure 3. The test specimen of the bridge deck system (unit: cm).
Applsci 12 11619 g003
Figure 4. Photo of the test specimen.
Applsci 12 11619 g004
Figure 5. The suspender rupture trigger device: (a) general view of the installation; (b) magnetic fluxer clamps; (c) wedge steel bar.
Applsci 12 11619 g005
Figure 6. Feasibility test of the suspender rupture trigger device: (a) load–displacement curve; (b) suspender force-break suspender time curve.
Applsci 12 11619 g006
Figure 7. Schematic representation of the counterweight block load: (a) counterweight load (unit: cm); (b) counterweight stack on site.
Applsci 12 11619 g007
Figure 8. The suspender forces of different suspenders under constant loading.
Applsci 12 11619 g008
Figure 9. The layout of the measuring points.
Applsci 12 11619 g009
Figure 10. ANSYS/LS-DYNA model of the through CFST standard arch bridge with a main span of 125 m.
Applsci 12 11619 g010
Figure 11. Schematic representation of the FE simulations of the suspender fracture: (a) dynamic simulation of the suspender break; (b) the time-load curve.
Applsci 12 11619 g011
Figure 12. The time history plots of displacement due to the long and short suspenders fracturing: (a) displacement of the arch rib when the 1# suspender breaks; (b) displacement of the bridge deck when the 1# suspender breaks; (c) displacement of the arch rib when the 6# suspender breaks; (d) displacement of the bridge deck when the 6# suspender breaks.
Applsci 12 11619 g012
Figure 13. The maximum response due to the breakage of different suspenders: (a) displacement; (b) stress.
Applsci 12 11619 g013
Figure 14. The time history plots of the stress due to the breakage of the long and short suspenders: (a) stress of the arch rib when the 1# suspender breaks; (b) stress of the bridge deck system when the 1# suspender breaks; (c) stress of the arch rib when the 6# suspender breaks; (d) stress of the bridge deck system when the 6# suspender breaks.
Applsci 12 11619 g014
Figure 15. The time history plots of the suspender force due to the breakage of long and short suspenders: (a) 1# suspender broken; (b) 6# suspender broken.
Applsci 12 11619 g015
Figure 16. Maximum value of the hanger force response when different suspenders fracture.
Applsci 12 11619 g016
Figure 17. Schematic illustration of the ESCM.
Applsci 12 11619 g017
Figure 18. The general layout and main component cross-sections of a 100 m half-through CFST standard arch bridge (unit: cm): (a) elevation; (b) plan; (c) arch rib; (d) longitudinal beam; (e) central crossbeam; (f) end beam.
Applsci 12 11619 g018
Figure 19. The general layout and main component cross-sections of a 125 m through CFST standard arch bridge (unit: cm): (a) elevation; (b) plan; (c) arch rib; (d) longitudinal beam; (e) central crossbeam; (f) end beam.
Applsci 12 11619 g019
Figure 20. The time history plot of the stress in different suspender breaking durations: (a) the longitudinal beam; (b) the adjacent suspenders.
Applsci 12 11619 g020
Figure 21. The maximum dynamic response corresponding to each working condition: (a) the longitudinal beam; (b) the adjacent suspenders.
Applsci 12 11619 g021
Figure 22. Longitudinal beam stress time history plot due to the suspender breakage.
Applsci 12 11619 g022
Figure 23. Comparison between the longitudinal beam stress based on the dynamic and static analyses.
Applsci 12 11619 g023
Figure 24. Suspender force time history curve of the suspender adjacent to the ruptured hanger.
Applsci 12 11619 g024
Figure 25. Comparison between suspender force by dynamic and static analysis.
Applsci 12 11619 g025
Figure 26. The relationship between the dynamic coefficient and the span length for the longitudinal beam: (a) half-through CFST standard arch bridges; (b) through CFST standard arch bridges.
Applsci 12 11619 g026
Figure 27. The relationship between the dynamic coefficient and the span length for the suspender: (a) half-through CFST standard arch bridges; (b) through CFST standard arch bridges.
Applsci 12 11619 g027
Table 1. Comparison of test and FEM results due to the 1# suspender being broken (unit: mm).
ResultArch RibBridge Deck SystemSuspender
Displacement/mmStress/MPaDisplacement/mmStress/MPaSuspender Force/kN
Calculated value3.10−36.736.494.1735.62
Measured value3.05−35.417.024.1435.68
Calculated/Measured1.021.040.921.010.99
Table 2. Comparison of test and FEM results due to the 6# suspender broken (unit: mm).
ResultArch RibBridge Deck SystemSuspender
Displacement/mmDisplacement/mmStress/MPaDisplacement/mmDisplacement/mm
Calculated value4.84−46.8315.3811.2937.54
Measured value4.35−50.1615.6111.9738.97
Calculated/Measured1.110.930.980.940.96
Publisher’s Note: MDPI stays neutral with regard to jurisdictional claims in published maps and institutional affiliations.