1. Introduction
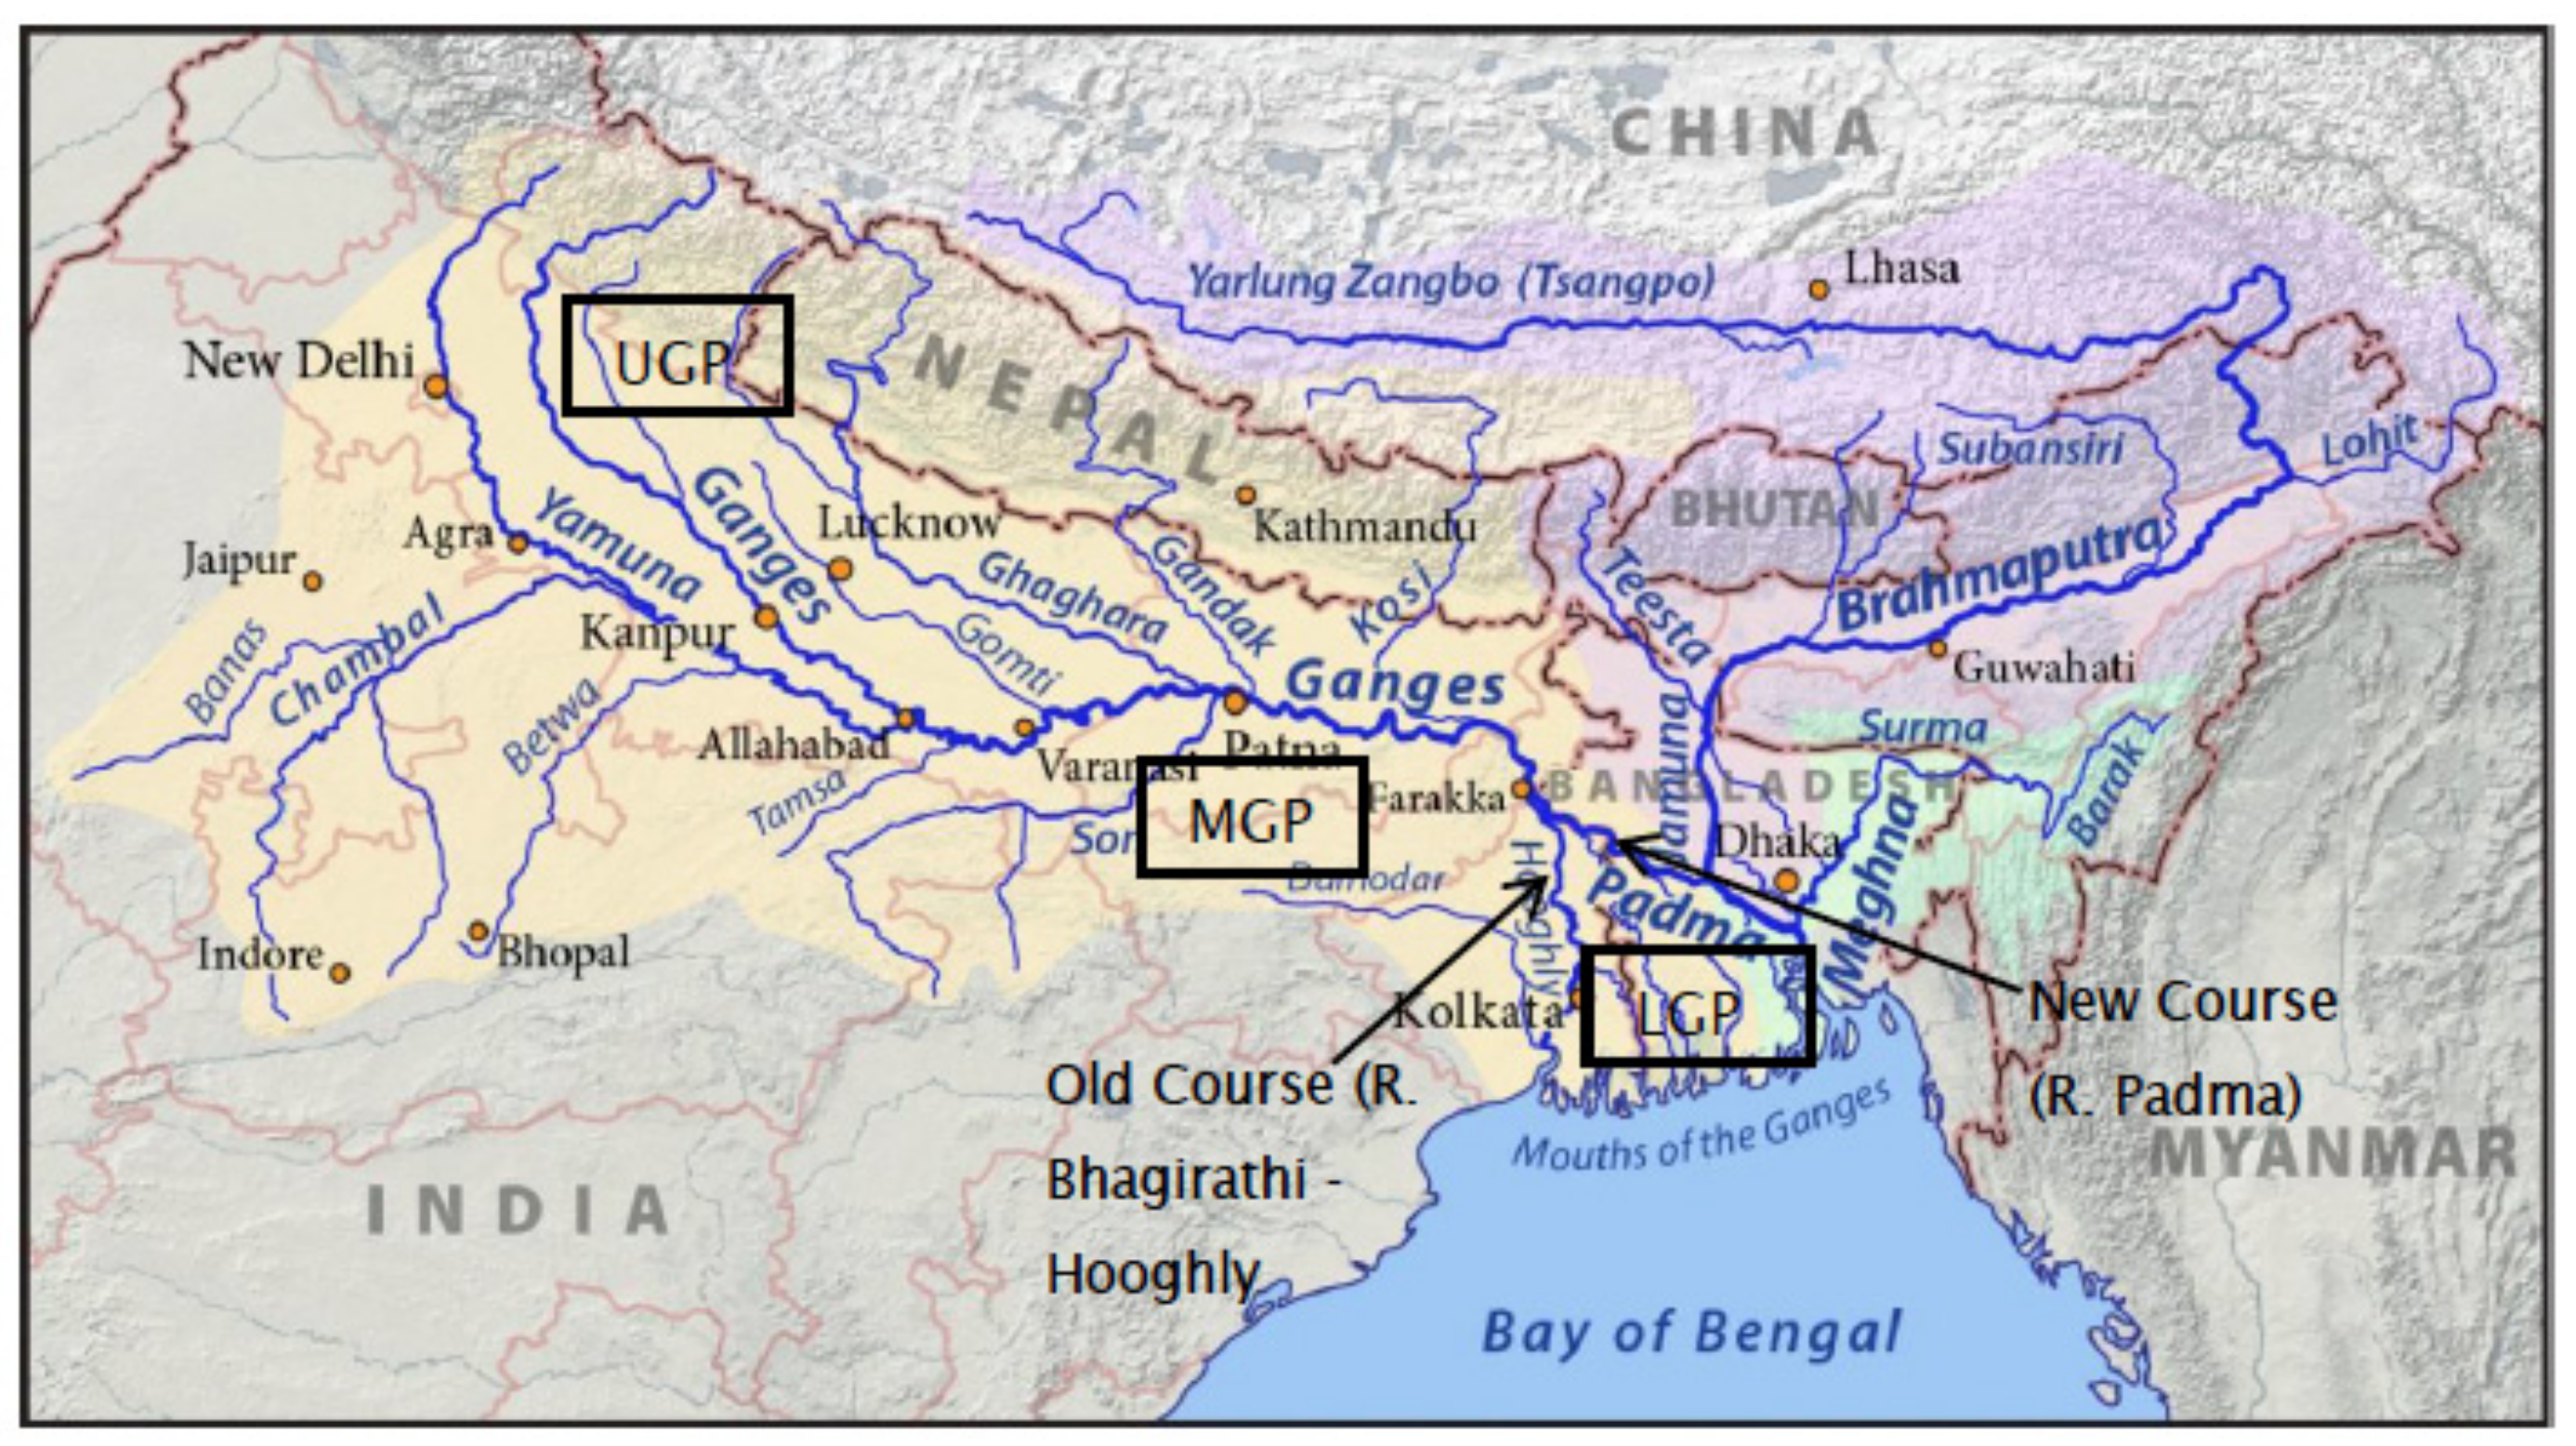
Bangladesh is a predominantly riverine nation. Bangladesh is primarily watered by the Padma, Meghna, Jamuna, and Brahamaputra rivers (
Figure 1). The country is also crisscrossed with rivers of varying sizes. Bangladesh is home to three important river systems, one of which is the Ganges-Padma. From its beginning in the Himalayas in Nepal to where it meets the Jamuna in Bangladesh is a distance of about 2200 km. Here, we speak to the section of the Ganges River that flows from below the Farakka Barrage to where it meets the Jamuna at Aricha. This section of the Padma River is well known to locals. Both the hydrology and the morphology of the Padma’s upper and lower reaches are very different from one another. From the Farakka Barrage to Aricha is the upstream section. The confluence of the Padma and the Jamuna may be seen in the downstream reach from Aricha to Chandpur. As the Brahmaputra River’s primary course shifted towards the Jamuna River, the Padma River’s platform began to change as a result of the massive silt and additional flow [
1,
2]. For much of the Ganges delta, the silt is discharged via its network of distributaries.
Geologically, the Ganges-Padma Basin is considered a subregion of the Indo Ganges Brahmaputra lowlands. The Ganga River is characterised by course changes throughout documented history. Before entering the Bay of Bengal, the coastline extends into the sea. River banks are susceptible to erosion causing their planform to alter with excessive discharge. The Bengal Plain is located at the intersection of the plate of India, plate of Eurasia, and plate of Myanmar. The plate margins are converging, producing the Indian and Burmese arcs. Approximately 328 million tonnes per year of the total suspended sediment observed at Farakka is sand and gravel. The sediments are composed of extremely fine sand and silt-clay particles [
2].
The environmental implications of the Jamuna River’s rising importance are substantial in comparison to those of the Padma River. The Jamuna’s significant sediment transport caused the Padma to gradually transform into a braided river. Braided river depositional models are essential for providing an objective basis for interpreting geological evidence from the past and for aiding in the characterisation of subsurface deposits. Since braiding is such a dynamic process, it is currently difficult to anticipate its future even on relatively short time spans. There is a need for more detailed information about the processes of channel bifurcations, which are generally agreed upon as being crucial to the initiation of braiding, in order to advance our knowledge and ability to model braided rivers. Bank erosion is closely linked to the formation and movement of meander bends on the Ganges, which is primarily a meandering river. Because each of the Jamuna’s braided channels functions as a meandering channel, researchers have previously used a method for forecasting bank erosion in meander bends to analyse erosion along the river’s length [
2,
3].
Rivers are a growingly significant and ever-changing component of our physical landscape. Many different issues, from flood prevention and navigation to water resource management and recreational use, are connected to their behaviour. Rivers carry the water and material they are fed from the land to the sea, effectively acting as agents of erosion and transport. Rivers typically take the form of channels. This is the outline of a canal on the ground, as seen in aerial views or depicted on a map. From above, the river’s channel layout can look like meanders, braids, or be very straight [
4]. Woven and meandering designs are common. For example, we can talk about a stream’s meandering habit or its braided habit to describe its patterning. We have used the relationship between channel length and down valley distance as our defining factor. Sinuosity, a measure of how much a river deviates from a straight line, can range from 1 to 4 or higher in rivers; we define “meandering” rivers as those with a sinuosity of 1.5 or more, while “sinuous” rivers are defined as those with a sinuosity of 1.5 or less. Braided rivers’ planform features, especially the strength of their braiding, have garnered a lot of attention [
2,
5,
6,
7,
8,
9,
10,
11,
12,
13,
14,
15,
16,
17]. Because the strength of braiding varies widely from river to river [
2,
7] and even from reach to reach along the course of a particular river at different flow stages [
2,
3], the use of a suitable braiding parameter is an important step towards improved understanding of braided rivers [
2,
16].
Although extensive research has been conducted on the properties and behaviour of meandering rivers, the fundamental causes are still not fully understood. Currently, archival satellite sensor data are regularly accessible. Frequent intervals lasting nearly four decades give a significant opportunity for advancing our understanding of the natural processes of meander formation. Despite the fact that preliminary research indicates that meander formation can be explained by the instability of alternate bars, further research is required. However, field evidence and simulation models have demonstrated that this is not the case. The instability of river meanders is an inherent trait, and the breadth of the meanders reaches a maximum. When cut-offs occur, sinuosity reaches a threshold degree, and the complex system undergoes a transition to a self-regulating process. Regarding the threshold response of a complex system, the Padma system has been researched. The investigation of the circumstances for soft avulsion/branching found that bankfull flow is not the cause of chute cut-off in the Ganga-Padma system. The velocity and superelevation of flow at the channel’s centreline may be caused by various variables [
17,
18,
19,
20].
Channel planform is a critical factor that must be taken into account when investigating planform dynamics. The channel’s planform is the topographic planimetric geometry of an alluvial canal. The form or pattern of an alluvial river is determined by the interaction between its courses, floodplain, and bars. The spatial distribution of bed load and wash load, sediments, governs vegetation. The width and layout of a channel are determined by the balance between the formation and destruction of floodplains [
21]. The configuration of the channel planform produces distinct channel patterns. Despite the fact that various patterns can coexist, straight, meandering, and braided river channel patterns are the most common varieties [
22,
23,
24,
25,
26,
27] (e.g., anabranching, anastomosing, and wandering). Identifying the variables that explain various channel patterns has always been the primary target of research. There is currently only a qualitative understanding of the patterns. However, channel morpho-dynamics and channel geometry migration interact in these self-organising systems. Self-organising patterns are also dependent on the development and degeneration of the floodplain (including naturally vegetated dikes) under heavy-flow conditions. This information is mostly acquired through laboratory flume experiments and assessments of small- and moderate-sized rivers. Bars are bedforms with proportional lengths or spacing to channel width. Bars may be fixed, or “fixed-bars.” There exists a relationship between bar formation and planform modification. There have been numerous studies on the creation of bars in meandering and braided rivers. The inner bank of a meandering river can produce three types of bars: scroll bars, chute bars, and tail bars. Commonly, tails bars are the result of an obstruction induced by woody debris [
25]. On the basis of how tail bar formation occurs, it is possible to assert that tail bar rivers can both meander and braid. At the inner bend of a winding channel, where accretion occurs during maximum discharge, scroll bars and chute bars are generated. The bars are visible throughout the river system at low tide levels. While chute bars are associated with a greater risk of injury, scroll bars can be associated with both low and high stream power. A scroll bar consists of an inner meander curve perpendicular to the canal ridge. Due to its down-channel-pointing planform, it is frequently referred to as a point bar [
26]. In sedimentology, the point bar denotes the accretionary section of an inner meander bend. Typically, a point bar extends vertically from the deeper segment of the channel to the level at which fine sediments begin to accumulate in the floodplain. For scroll bars, there are “free bars” and “fixed bars.” They may arise from several sources. Landward movement and the fusion of transverse bars are used to generate dynamic scroll bars. The deposition of fine suspended sediments within the main flow causes the creation of bars. Active scroll bars can also form if the outer meander bend erodes and produces extra active scrolling channels for the inner meander curve. This explains why scroll bars exist for both high- and low-discharge circumstances [
26]. The objectives of this study are to compute the sinuosity ratio and the braiding index, as well as to compare these two measures.
2. Data and Methods
A river basin is a distinct hydrological unit with its own “geo-biocultural” traits. Any change in sedimentation regime within a river basin, whether caused by natural or anthropogenic factors, has a delayed impact on the river’s downstream activity in terms of form and lateral bank line stability. This, in turn, undermines the agricultural integrity of the riparian zone, the economic and social coherence of riverbank towns, and their infrastructure. Fluvial Systems modify their floodplains and channels using a mixture of controls and a hydrologic model. There is a tight relationship between river channel patterns and sedimentological floodplain characteristics. Fluvial Systems respond to regional changes in physiography, hydrology, and sediment load by altering their hydraulic geometry and channel structure, despite the fact that core knowledge of fluvial geomorphology is gained from the study of small-to-moderate rivers.
Typically, river characteristics are classified as either straight, meandering, or braided. A wide variety of channel patterns exist, from a direct path through meandering sections to a braided design. Sinuosity (
Table 1), defined as the ratio of channel length to valley length or the ratio of valley slope or channel gradient over the same length of valley [
26], distinguishes straight from meandering channels. Leopold and Wolman chose a total sinuosity ratio of 1.50 to differentiate sinuous from meandering channels. Generally speaking, rivers with a sinuosity of less than 1.5 are straight or sinuous, whereas those with a sinuosity of more than 1.5 are considered meandering. The initial stage in this research was therefore to determine the best strategy for quantifying the degree of braiding in the Ganges-Padma River from satellite pictures. The braiding index proposed by Brice [
6] and Islam [
2] is the best metric for quantifying the braiding continuum of the Ganges-Padma River. This is a common method for gauging the degree of braiding in the world’s longest rivers [
2,
9,
12].
Following Brice’s [
6] definition, we have the braiding index (BI):
where ∑
Li is the total length of bars and (or) islands in the reach, and
Lr is the length of the reach measured mid-way between the banks. Brice decided to use a total braiding index of 1.50 to separate braided from non-braided reaches.
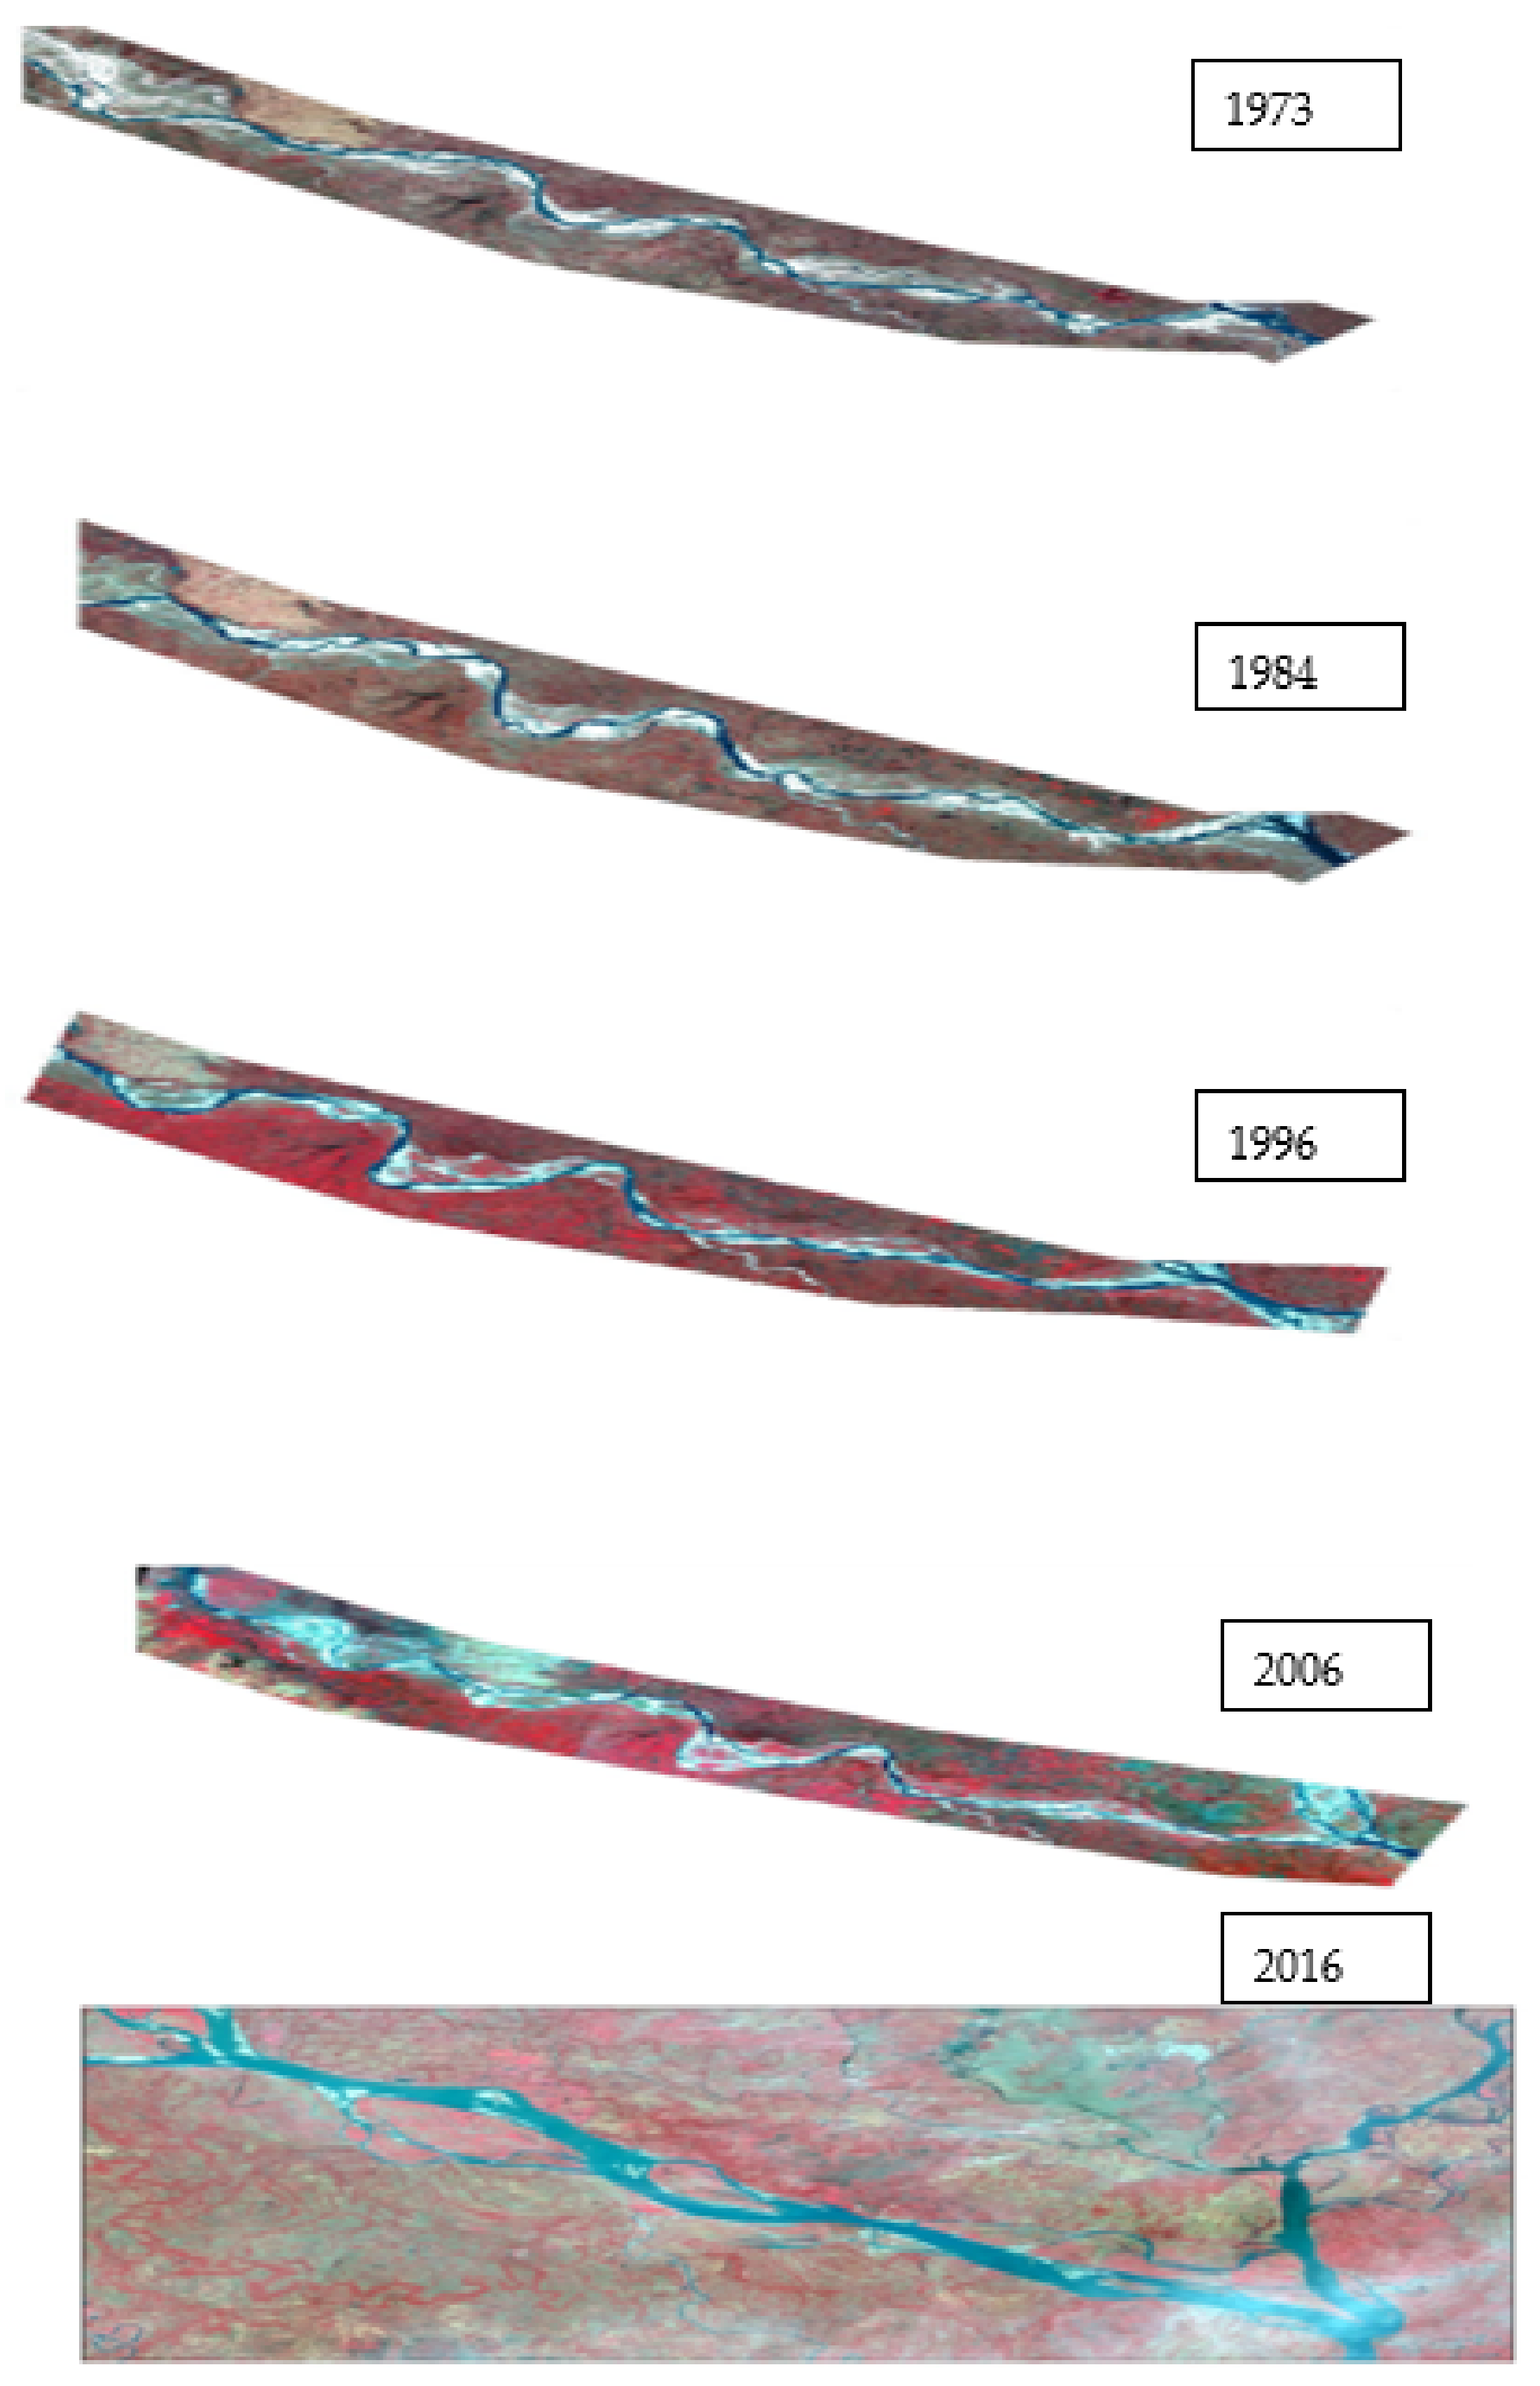
It is worth noting that a time series of Landsat pictures provided the basis for a large chunk of the geostatistical information used in this investigation. There are five different time periods (
Figure 2) used in this analysis (1973, 1984, 1996, 2006, and 2016). We obtained the Landsat images from the Centre for Environmental & Geographic Information Services-CEGIS, Bangladesh.
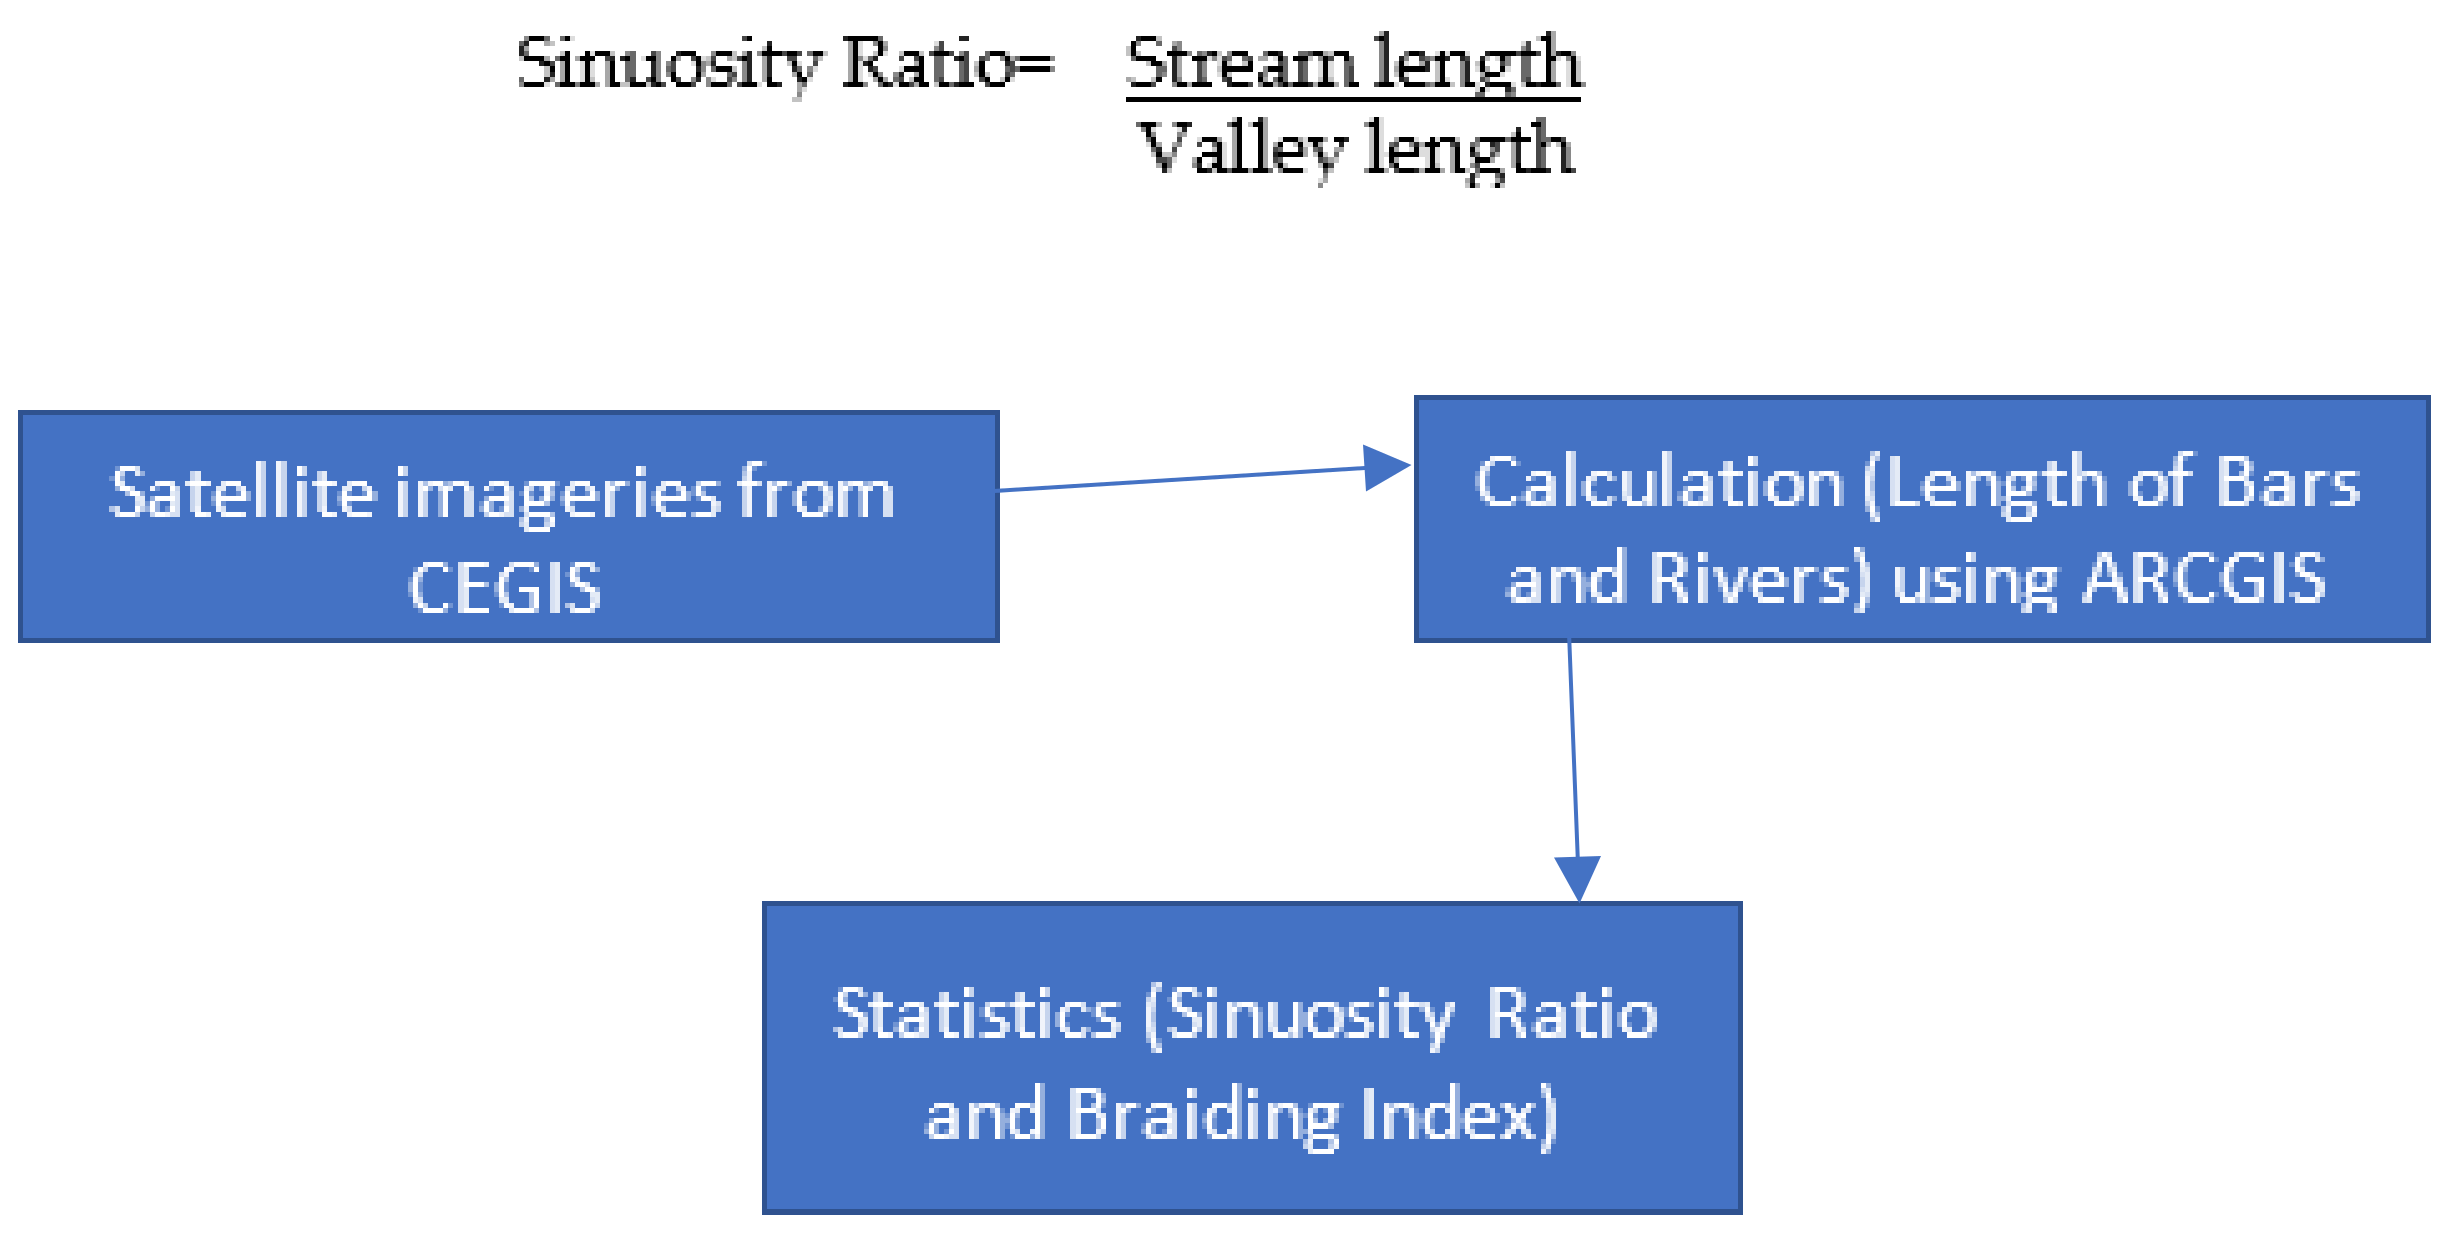
The shifting channels of the Ganges and Padma rivers were mapped using geographic information system software. Using the ArcView tools, we first determine the number and length of bars for the years of interest and any periods in which the bank line of the Ganges and Padma rivers overlapped in the pictures. The sinuosity ratio is calculated using stream length, valley length, and other variables. You may determine the braiding index by adding the lengths of the bars and rivers together. Leopold and Wolman chose a total sinuosity ratio of 1.50 to distinguish sinuous from meandering. A sinuosity of 1.5 or higher indicates a meandering river, while a sinuosity of 1.0 or lower indicates a straight river.
An equivalent of 1.5 curves, either straight or sinuous. If the river’s braiding index is less than 1.50, it is a non-braided river; if it is equal to or greater than 1.50, it is a braided river. For this analysis, we use the following formula to determine the sinuosity ratio and the braiding index and a flowchart (
Figure 3) is provided below:
3. Results and Discussion
The formation of a channel, particularly in huge basins, might exhibit transitional characteristics. Frequently densely inhabited areas are discovered to be drained by tropical rivers. For instance, the Yangtze Basin is home to one of the world’s greatest populations, while on the other side, the Ganges-Brahmaputra Basin has the highest population density with a chaotic urban environment [
23], growth, and a high water demand. Among the many tropical rivers in the globe, the Amazon ranks first. Due to the monsoon season’s high discharge, the Asian rivers are susceptible to flooding. The rivers of Asia support a large population and are a major source of water for irrigation, household, and industrial use. Nonetheless, the floods of these rivers’ features and the resulting bank erosion are responsible for the loss of life and property on fertile agricultural land. Human interference through the construction of dams and barrages frequently has negative effects on river systems, leading to deterioration and flooding. Degradation in particular stretches and alters the river’s natural environment as a result of alterations in sediment and nutrient supply [
24].
Sinuosity is one of the most essential qualities of a river channel pattern. Sinuosity is determined as the ratio of stream length along the curve centre of the canal to the length of the valley. When a river’s sinuosity is more than 1.5, then the river cannot be navigable, is no longer deemed straight and ought to be categorised as meandering. Clearly, the sinuosity has grown more pronounced with time (
Table 2). From a low of 1.31 in 1973, it has risen to a high of 1.47 in 2016.
Table 2 shows that the value was close to 1.5 in 2006 and 2016, indicating a shift towards meandering river behaviour.
Meander migration is the alteration of the planform of a river. Actively wandering rivers adapt their planform in response to changes in discharge, sediment load, channel morphology, and bank material characteristics. The water from the upstream section of a river is diverted to its outside curve. A river meanders due to centrifugal force, resulting in an abnormally high water level. This causes the outer bank to erode and transfers debris to the inner bend. Theoretically, the greatest erosion will occur just downstream of the apex, resulting in the highest sediment loss. The direct translation of the meander bend is down valley. Four migration theories for a meander have been identified: translation, rotation, extension, and a combination of the three. Extension refers to the growth of the meanders, whilst translation refers to their movement and illustrates the meander bends’ movement [
25].
The geometry of the channel is a critical component in determining the migration rate. Furthermore, the radius of curvature has an effect on meander migration. The ratio of the radius of curvature to the width of a channel determines the tightness or curvature of a curve. The migration rate depends on the curve. It has been discovered that a bend curvature ratio of 2.0 to 3.0 improves the rate of migration in temperate rivers. Several models on meander migration have been developed based on the principles of fundamental physics and probability, which demonstrated that numerous bend shapes and sizes can evolve, including meander migration in particular, because of their effect on channel slope, in addition to sedimentation and storage [
23,
24,
25,
26].
Remote sensing is a valuable data source for assessing the physical characteristics of natural river systems throughout time. However, observed remote sensing images are contingent on a variety of factors, some of which are connected to the scene of interest and others unrelated, such as atmospheric influences, sensor qualities, framework (e.g., spatial resolution), and sampling methodologies. It is imperative to govern these confusing circumstances. In order to generate meaningful comparisons across time between image-based planform maps, many image sources must be utilised. Commonly, satellite sensor data are used to examine Earth surface processes such as volcanic glacier flow, surface and internal mechanisms, coastal and estuarine activities, and fluvial processes. Because of the potentially vast coverage area, synoptic perspective, and the capability to capture data regularly [
18,
19,
20,
21,
22,
23,
24,
25,
26,
27], satellite sensor data are particularly useful for monitoring changes in river planform, particularly for large and dynamic rivers. Since rivers are continuous systems, accurate documentation of their structure and attributes is crucial and necessitates the collection of a continuous time series of data across a variety of temporal and spatial scales. The record of attempts to simulate the long-term behaviour of meandering rivers shows the problems posed by the dearth of continuous data sets. Consequently, satellite sensor data are able to give uniform river planform mapping at regular intervals). The year 1972 marked the beginning of the era of space-based Earth observation with sufficient spatial resolution for the charting and monitoring of mega-rivers. The resolution of the spatial multispectral scanning system (MSS) sensor on the Landsat satellite is 80 m. The Thematic Mapper (TM) sensor was added to the Landsat platform in 1982, and Landsat 7 carried the Enhanced Thematic Mapper in 1999 [
28].
Remote sensing is an excellent method for identifying and monitoring the environment, including channel migration patterns over human timescales. It can assist in identifying similar geomorphological and geological characteristics that define the morphogenetic process of channel migration. Multitemporal satellite sensor data enable river planform evolution over time. Monitoring channel migration is crucial for mitigating the risks caused by bank deterioration. Specifically, time series remote sensing data spanning decadal time spans are vital to study planform change. In the current context, free access of Landsat sceneries (beginning in the mid-1990s) inaugurated a new period in time series satellite remote sensing research. The river system is crucial, as is the mechanism that determines meander dynamics. On the one hand, the means of bank erosion, means of cut-offs, the consequences along a river system’s forks, and natural hard banks due to antecedent geology are present, which is crucial to comprehending the river system’s dynamics. Moreover, the presence of a reservoir also affects the river system downstream. River is a contentious topic. A study of the river’s avulsion frequency would also enable exploration of any system periodicity or phase of meander migration along the river network [
28].
In order to calculate the braiding index using Brice’s formula, the total and stream length of bars are displayed in
Table 3. (1964). In 1973, the braiding index of 1.3 for the Ganges-Padma River suggested that it was not braided. The index was 1.43 in 1984, which also indicated non-braided, but it has since climbed, passing the barrier of 1.5, indicating that braiding has occurred. A look at the data reveals that the braiding index was 1.62 in 1996 and 2006, 1.92 in 2007, and 2.15 in 2016. When the braiding index for a river is more than 1.5, the river will be braided. Starting in 1996, we saw that the river began to take on a braided appearance. There is a greater rate of change in the braiding index compared to the sinuosity ratio.
4. Conclusions
We empirically analysed the evolving trend of the Ganges-Padma River by compiling a time series of satellite pictures to record the historical morphological changes. Bangladesh is home to numerous rivers, including the mighty Ganges-Padma. The sinuosity of the Ganges-Padma River has grown throughout time. The sinuosity ratio of bank lines increased from 1.31 in 1973 to 1.33 that same year. In 1996, the sinuosity ratio was raised from 1.33 to 1.37. The sinuosity ratio rose from 1.37 in 1973 to 1.43 in 2006 and 1.47 in 2016 when compared to the corresponding values in 1973 and 1996. As expected, the outcome demonstrates a rise in the braiding index with passing years. In comparison to 1973 and 1984, when the number of bars was reduced, the length of the bars was raised. However, in 1984, the braiding index was raised from 1.3 to 1.43. The total number of bars has increased since 1973 and 1984 but dropped since 1996. In 1973, 1984, and 1996, the bar lengths were extended. However, the index of braiding rose after 1973, 1984, and 1996. In 1973, the braiding index for the Ganges-Padma River was 1.3, which means it was not braided at that time. As of 1984, it was 1.43, which likewise indicated that it was non-braided, but subsequent decades showed a growth in the braiding index, which is now greater than 1.5. The braiding index was 1.62 in 1996, 1.92 in 2006, and 2.15 in 2016. The braiding index is more than the cut-off value of 1.5 at this point. Since the river is expected to be braided if the braiding index is more than 1.5, we may safely assume that the river is braided at the present time.


