Article

RF-Access: Barrier-Free Access Control Systems with UHF RFID

1
State Key Laboratory for Novel Software Technology, Nanjing University, Nanjing 210023, China
2
School of Computer Engineering, Jinling Institute of Technology, Nanjing 211100, China
3
Suzhou City University, Suzhou 215104, China
*
Authors to whom correspondence should be addressed.
Appl. Sci. 2022, 12(22), 11592; https://doi.org/10.3390/app122211592
Submission received: 12 October 2022 / Revised: 3 November 2022 / Accepted: 11 November 2022 / Published: 15 November 2022
(This article belongs to the Special Issue RFID(Radio Frequency Identification) Localization and Application)

Abstract

:
Traditional RFID-based access control systems use flap barriers to help manage pedestrian access and block unauthorized staff at any entrance, which requires visitors to swipe their cards individually and wait for the opening of the blocking body, resulting in low-frequency pedestrian access and even congestion in places with large passenger flow. This paper proposes a barrier-free access control system (RF-Access) with UHF RFID technology. The main advantage of RF-Access is that it provides non-intrusive access control by removing flap barriers and operations of swiping the card. The visitors just go across the system without any stay at the entrance. Meanwhile RF-Access performs the authentication, which greatly improves time efficiency and quality of service. RF-Access addresses two key issues of the non-intrusive access control: motion direction detection and illegal intrusion detection. In RF-Access, we first propose a dual-antenna system setup together with a time-slot-based model to monitor users’ moving directions, which is robust to different environmental factors, such as multi-path effects. Afterwards, we use a tag array to detect illegal intrusion in case attackers do not carry any RFID tags. We implement a prototype of RF-Access with commercial RFID devices. Extensive experiments show that our system can detect the moving direction with 99.83% accuracy and detect illegal intrusion with an accuracy of 96.67%.

1. Introduction

Radio Frequency IDentification (RFID) has been widely used in a variety of applications, such as supply chain management [1,2], warehouse inventory [3,4], objects monitoring and tracking [5,6]. RFID-based access control is one of these applications, which aims to help manage pedestrian access and block unauthorized staff at any entrance. The existing RFID-based access control systems consist of a high-frequency (HF) RFID reader and a blocking body, e.g., flap barriers, which require visitors to swipe their identity cards individually and wait for the opening of the blocking body, resulting in low-frequency pedestrian access and even congestion in places with large passenger flow.
In this paper, we propose a barrier-free access control system (RF-Access) with UHF RFID technology. Compared with HF RFID, UHF RFID has a longer communication range and a higher reading rate, which makes it possible to remove the process of swiping the identity card. In addition, we remove flap barriers from the system, which provides non-intrusive access control: the visitors just go across the system without any stay at the entrance, and meanwhile RF-Access performs the user authentication, which greatly improves time efficiency and quality of service. To achieve this goal, RF-Access needs to address two key challenges: motion direction detection and illegal intrusion detection. In RF-Access, we firstly propose a dual-antenna system setup together with a time-slot-based model to monitor users’ moving directions, which is robust to different environmental factors such as multi-path effects. Afterward, we use a tag array to detect illegal intrusion in case attackers do not carry any RFID tags. Experimental results show that the proposed system has good performance. The main contributions of this paper are three-fold.
  • We propose a novel barrier-free access control system (RF-Access) with UHF RFID technology. The main advantage of RF-Access is that it provides non-intrusive access control by removing flap barriers and operations of swiping the card, which greatly improves time efficiency and quality of service.
  • RF-Access addresses two key issues of non-intrusive access control: motion direction detection and illegal intrusion detection, by using a dual-antenna tag-array system setup together with a time-slot-based model to monitor users’ moving directions.
  • We implement a prototype of RF-Access with commercial RFID devices. Extensive experiments show that our system can detect the moving direction with 99.83% accuracy and detect illegal intrusion with an accuracy of 96.67%.
The rest of the paper is organized as follows. Section 2 introduces the related work. Section 3 details our access control system RF-Access. Section 4 implements the system and evaluates its performance. Finally, Section 5 concludes this paper.

2. Related Work

Access control systems need to install flap barriers to help manage pedestrian access and block unauthorized staff at any entrance, which can function properly but require visitors to wait for the opening of the blocking body, leading to low-frequency pedestrian access and even congestion in places with large passenger flow. In recent years, studies have shifted to barrier-free access control. TDflex [7] designed a customized sensor to detect tailgating intrusion. Specifically, TDflex uses a non-scanning light source to emit modulated near-infrared light and generate real-time three-dimensional images of the monitoring area by measuring the difference between the lights emitted by the light source and the detection target. Computer vision is another technology for barrier-free access control. For example, HIKVISION [8] produces a binocular intelligent network camera, which is deployed directly above the monitoring area. It adopts binocular stereo vision technology to obtain height information of objects and an intelligent tracking algorithm to analyze the users’ behavior trajectory, counting the number of users and detecting access directions. However, vision-based sensing suffers from the impact of environmental factors, including low illumination and non-line-of-sight (the target is blocked by others). Additionally, these solutions cannot figure out the user identity accurately.
In comparison to the above sensing technologies, RFID offers an appealing alternative, with the advantages of unique identification, non-line-of-sight communication, and high reading rates, which makes it the most widely used in the field of access control [9,10]. In recent years, some RFID studies have shifted to study barrier-free access control. Mai et al. [11] deploy a group of infrared intrusion detectors to detect the user’s pass in and out, which, however, allows only a single-channel pass at a time. Wang [12] and Fan [13] deploy two sets of infrared switches on both sides of the gates to detect the directions of users but cannot detect an illegal user amongst legal users. He et al. [14] demand the time interval between the illegal pass and the tag last seen to be greater than 3 s, which is too ideal for practical use. Additionally, the existing solutions all use the HF RFID as the authentication approach, which suffers from a short communication range. Namely, each user needs to stop at the entrance to swipe his/her identity card for authentication, which still has the problem of low-frequency pedestrian access. There are a few commercial RFID readers (antennas) that provide us with the function of moving direction estimation, e.g., Impinj xSpan [15]. They use an antenna-array design to perform beamforming, which is able to dynamically scan the moving tags but suffers from the limitations of the large device size and the high system cost. For example, an Impinj xSpan reader costs nearly nearly 3000 [16], which is much higher than the retail price of an RFID-based access control system. Instead, our design uses the existing RFID reader and antennas embedded in the existing access control system, with no need for any extra hardware augmentation.

3. RF-Access

3.1. Overview

RF-Access uses the UHF RFID to perform user authentication. As shown in Figure 1, an RFID reader connects to one or more RFID antennas that locate on one side of the passageway. The user authentication is achieved by querying RFID tags attached to visitors who pass through the gate. If a tag is queried, the reader compares its EPC (tag’s ID) with legal IDs stored in the backend server. Only the user with a legal RFID tag (or a tagged badge) will pass the system authentication. Since UHF RFID has a long communication range and a high reading rate, RF-Access does not demand users stop to swipe their identity cards as HF RFID. Instead, the visitors just go through the system without any stay, and meanwhile, RF-Access does the user authentication, which greatly improves time efficiency and quality of service. However, the long communication range makes the motion direction detection difficult. Additionally, since we remove the flap barriers, how we detect illegal intrusion by a user who does not carry any tags is another concern. In what follows, we detail how RF-Access addresses these two issues.

3.2. Motion Direction Detection

A barrier-free access control system needs to detect the motion direction (in or out) of each visitor in the passageway. In RF-Access, we first present a signal-based solution and later offer a more robust time-lost model.

3.2.1. Signal-Based Sensing

As shown in Figure 2, as a visitor passes through the access control system (the trajectory can be approximatively treated as a line), the distance between the reader (omnidirectional) antenna and the tag first experiences a decline. After reaching the minimum, the distance increases as the person (tag) moves. If we can observe the distance variances over time, we can use two antennas A and B along the moving direction to check which one reaches the minimal distance first. If A is earlier than B, the motion direction of the tag is from A to B. Otherwise, the direction is B to A. The parameters of RF signals can reflect the distance, such as Received Signal Strength Indicator (RSSI) and the phase value. In the following, we take RSSI as an example to show this solution.
In an RFID system, RSSI represents the strength of a tag’s signals received by the reader. More specifically, a large RSSI value means the power of the tag’s response signal is strong and is more likely to be close to the reader. In theory, Friis is a widely used model that reflects the distance between the transmitter and receiver in free space. According to the Friis equation, the power of a tag’s response signal can be written as follows [17]:
P R = P T G T R 2 G t 2 λ 4 X 2 M ( 4 π r ) 4 Θ 2 B 2 F 2 ,
where P R is the power coupled into the radio-frequency integrated circuit, P T is the power transmitted by the reader, G T R is the load-matched, free-space gain of the transmitter/receiver antenna (i.e., the reader antenna), G t is the load-matched, free-space gain of the tag antenna, λ is the carrier-frequency wavelength, X is the polarization mismatch, M is a modulation factor, r is the reader-to-tag separation distance, Θ is the RF tag antenna’s on-object gain penalty, B is the path-blockage loss, and F 2 is the monostatic fade margin. RSSI is a logarithmic form of P R , which can be derived by the following function:
R S S I = 10 × l g ( P R ) .
According to Equations (1) and (2), we can easily conclude that given a reader and a tag, the longer the distance between them, the smaller the RSSI is. As aforementioned, when the tag moves along the x-axis, the distance between the reader antenna and the tag declines first and then increases. Namely, RSSI experiences a contrary change trend. In Figure 3, we plot the theoretical RSSI value when a tag moves along the x-axis ([−1.5 m, 1.5 m]), given the closest distance of 0.4 m. It is clear that RSSI sees a rising trend and after peaking at the maximum, it gradually drops. The peak corresponds to the time when the tag–antenna distance reaches the minimum.
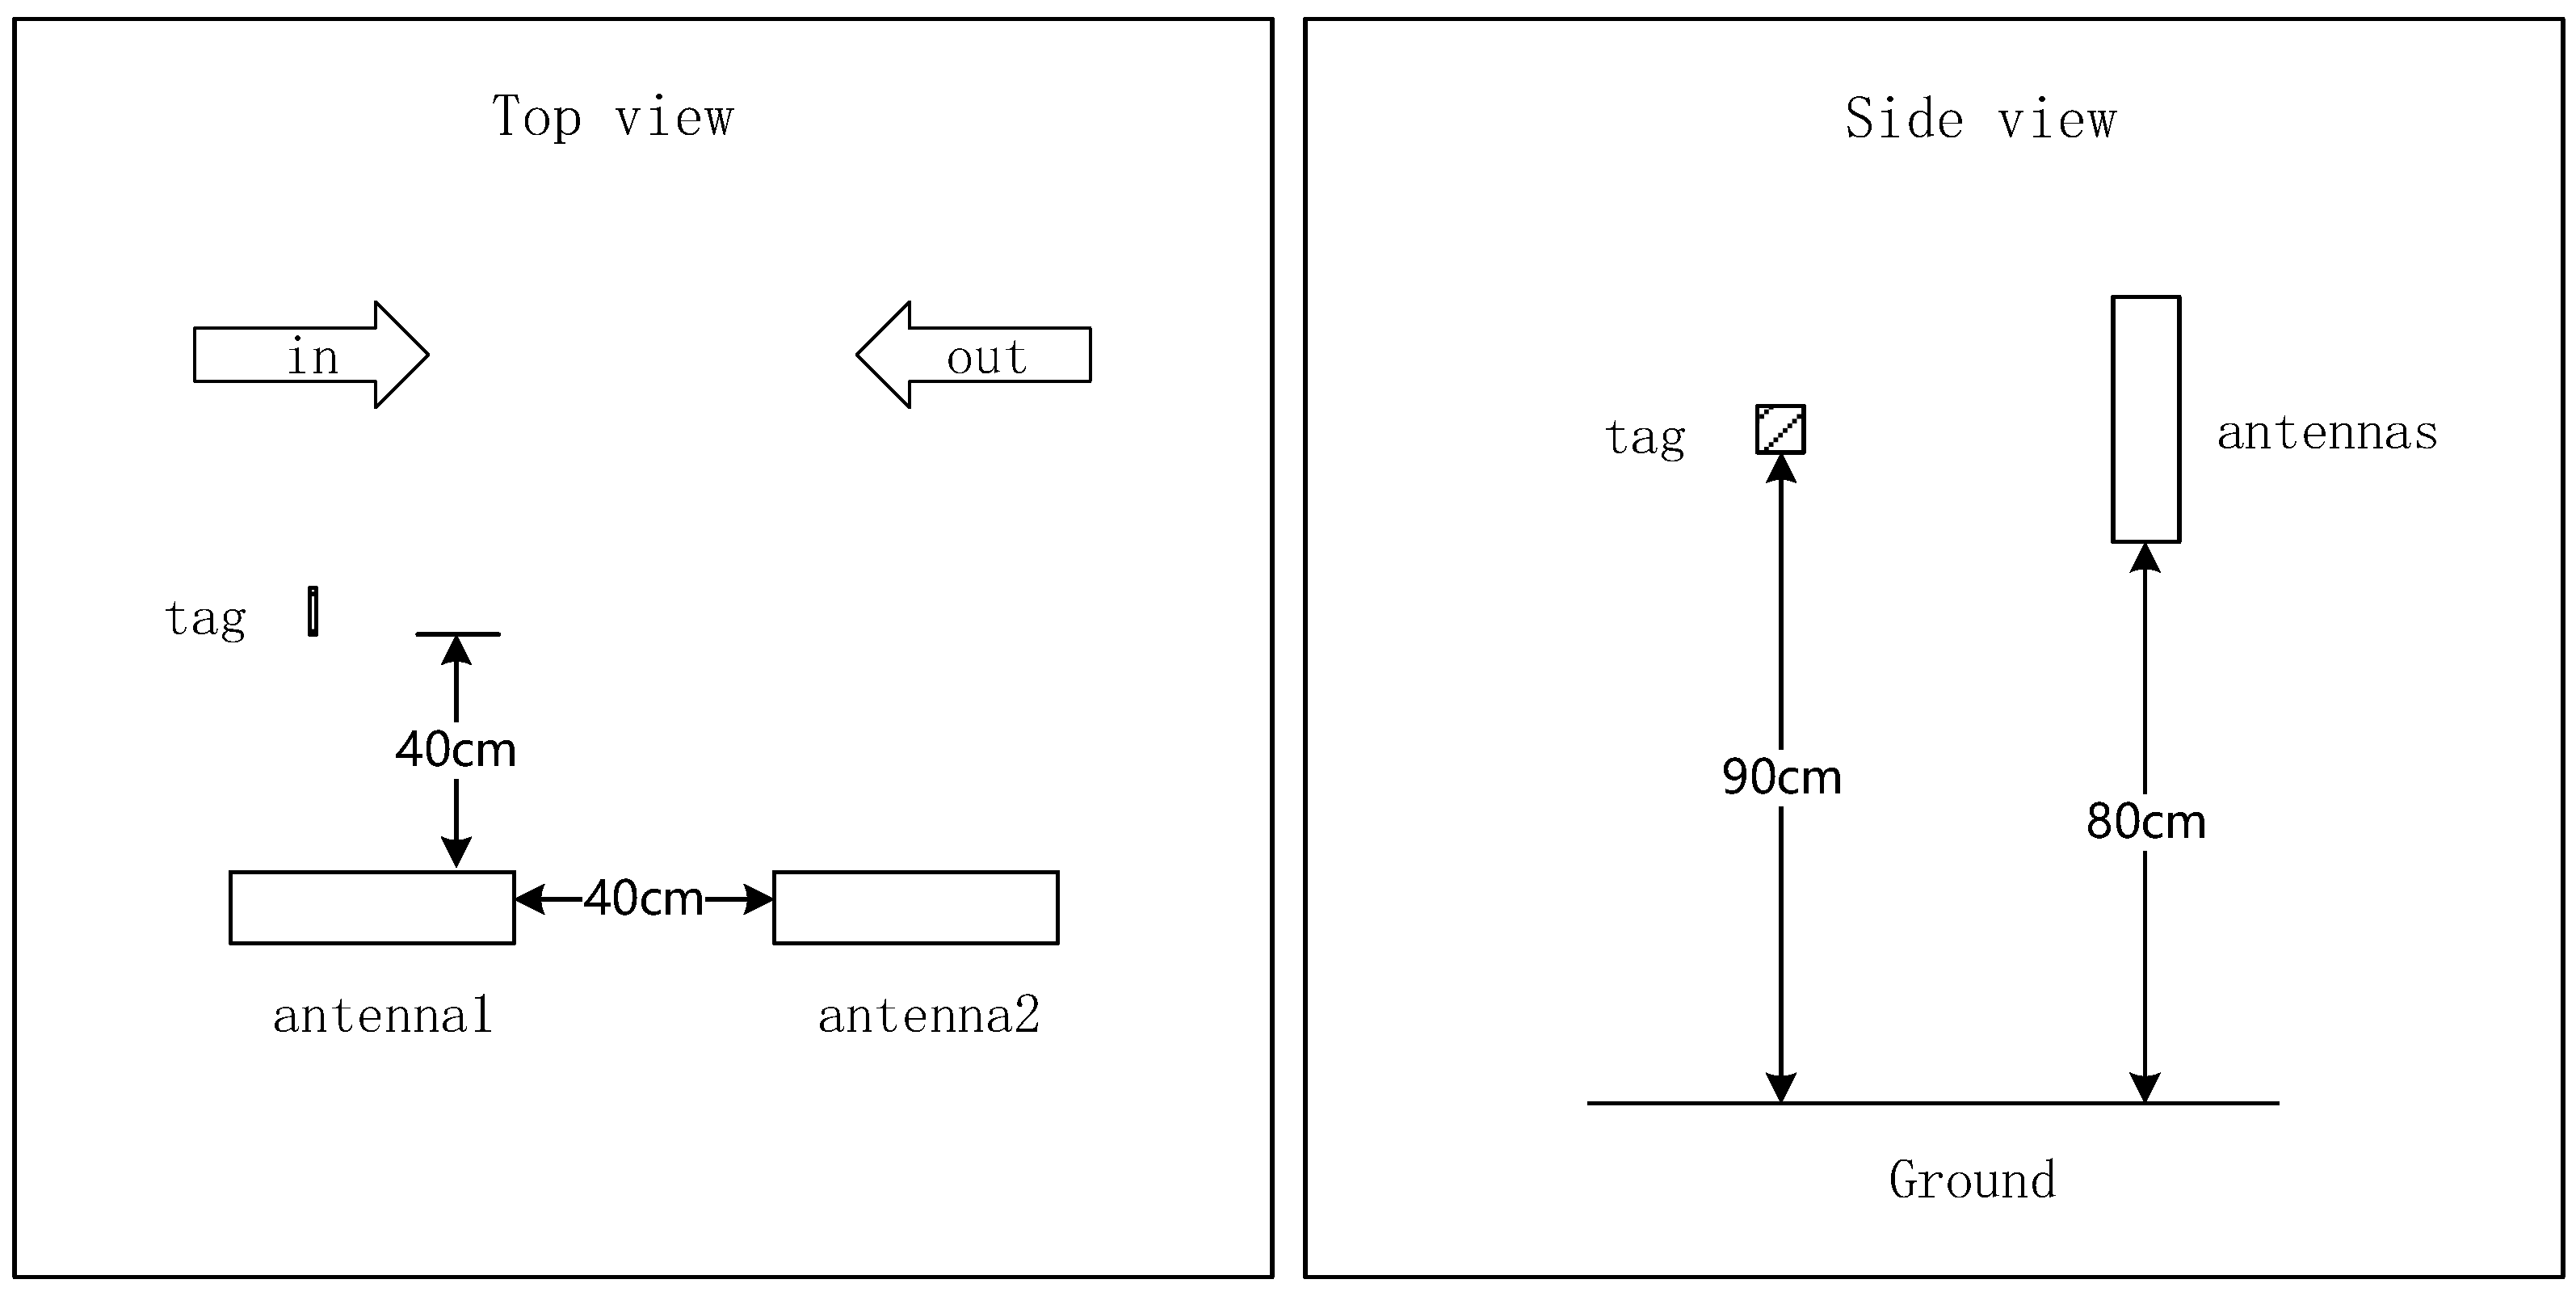
We verify the above theoretical model with a real-world experiment in an open space. As shown in Figure 4, a tag is fixed to a sliding rail and moves at a constant speed of 10 cm/s. Two RFID antennas are 80 cm in height and 40 cm apart from each other. As the tag moves along the sliding rail, we keep measuring the RSSI value of the RF signals backscattered by the tag. The experimental results are shown in Figure 5. It is clear that the RSSI curve generally follows the theoretical model, and two peaks corresponding to two antennas can easily figure out moving in or out—which peaks first means the direction is from this one to the other.
However, the peak cannot be directly determined by the maximal RSSI value due to thermal noise, which is very likely to give rise to false positives. Instead, we try to fit this RSSI curve and find out the time corresponding to the peak for each antenna.
Given a tag, we collect n responses by the mth antenna and build a tag response matrix following the timestamp order, which is described as: D m = D 1 m D 2 m D n m T , where D i m is a tag’s RSSI record, which is actually a triple D i m = e , r i m , t i m , where e is EPC (tag ID), r i m , t i m are the measured RSSI value and corresponding timestamp obtained by the m-th antenna. So, the response matrix of the m-th antenna can be written as follows:
D m = D 1 m D 2 m D n m T = e r 1 m t 1 m e r 2 m t 2 m e r n m t n m = E , R m , T m ,
where the timestamp meets t i m t j m ( 0 < i < j n ), E is the broadcast of e, R m is the vector of RSSI values measured by the m-th antenna, and T m is the vector of timestamps corresponding to R m . The changing trend of the RSSI curve is approximate to the parabola with the opening downward. We fit the RSSI and timestamp in the response signals of two antennas with a quadratic curve, respectively. Let the second-order coefficient and the first-order coefficient in the fitting results be a and b; the time t p e a k corresponding to the peak is:
t p e a k = b 2 a .
By comparing the time of the two antenna’s peaks, we can determine the motion direction.
The signal-based model functions properly in an ideal scenario with modest multi-path effects and slow speed. However, in a real indoor scenario, this model is not robust to more general scenarios. In Figure 6, we let a volunteer carrying a tag walk through the system and use the signal-based model to detect the direction. As we can see, since the human body blocks the tag, almost all the tag signals in the second half are absorbed, resulting in the incomplete image of the RSSI, which further affects the detection accuracy. According to the fitting results, we will obtain a wrong result of the direction. The main reason is that RF signals are vulnerable to environmental changes, which motivates us to seek a more robust way.

3.2.2. Time-Slot-Based Sensing

Instead of using RF signals, we attempt to use the application-layer feature—reading records, which are stable and robust to environmental factors. The principle is that when the tag moves from left to right, the left-side antenna is supposed to query the tag earlier than the right-side antenna and vice versa. By observing the timestamps of the reading records of two antennas, it is promising to figure out the moving direction.
An intuitive solution is to check the first seen time by each antenna. This works in theory but is not robust in real scenarios due to the multi-path effects and the blocking impact of the human body. To address this problem, we resort to all reading records. The solution is to split the reading period into many smaller time slots. For each antenna, we check whether there are some reading records within each time slot. If yes, we consider that this antenna hits the time slot, and the time slot is labeled as a busy slot. The mean of all busy slots is treated as the final reading time of an antenna. By comparing the mean of different antennas, we can figure out the direction.
More specifically, for the m-th antenna, we obtain the time-stamp sequence of the reading records T m = t 1 m t 2 m t n m . The time period is:
T s = [ min ( T m ) , m a x ( T m ) ] .
The time period T s can be divided into w small time slots with the length of δ , i.e.,
w = max ( T m ) min ( T m ) δ
The middle x i of the ith time slot is:
x i = min ( T m ) + ( i 1 2 ) δ .
Let the bit vector B = { b 1 , b 2 , . . . . , b n } indicate whether each slot is busy. If b i is equal to 1, the ith slot is busy. Otherwise, the ith slot is idle. We can obtain the mean t ¯ m of reading time of the m-th antenna:
t ¯ m = 1 ( B ) i = 1 n x i × b i .
For two antennas A and B, if t ¯ A < t ¯ B , we know that the moving direction is from A to B and vice versa.
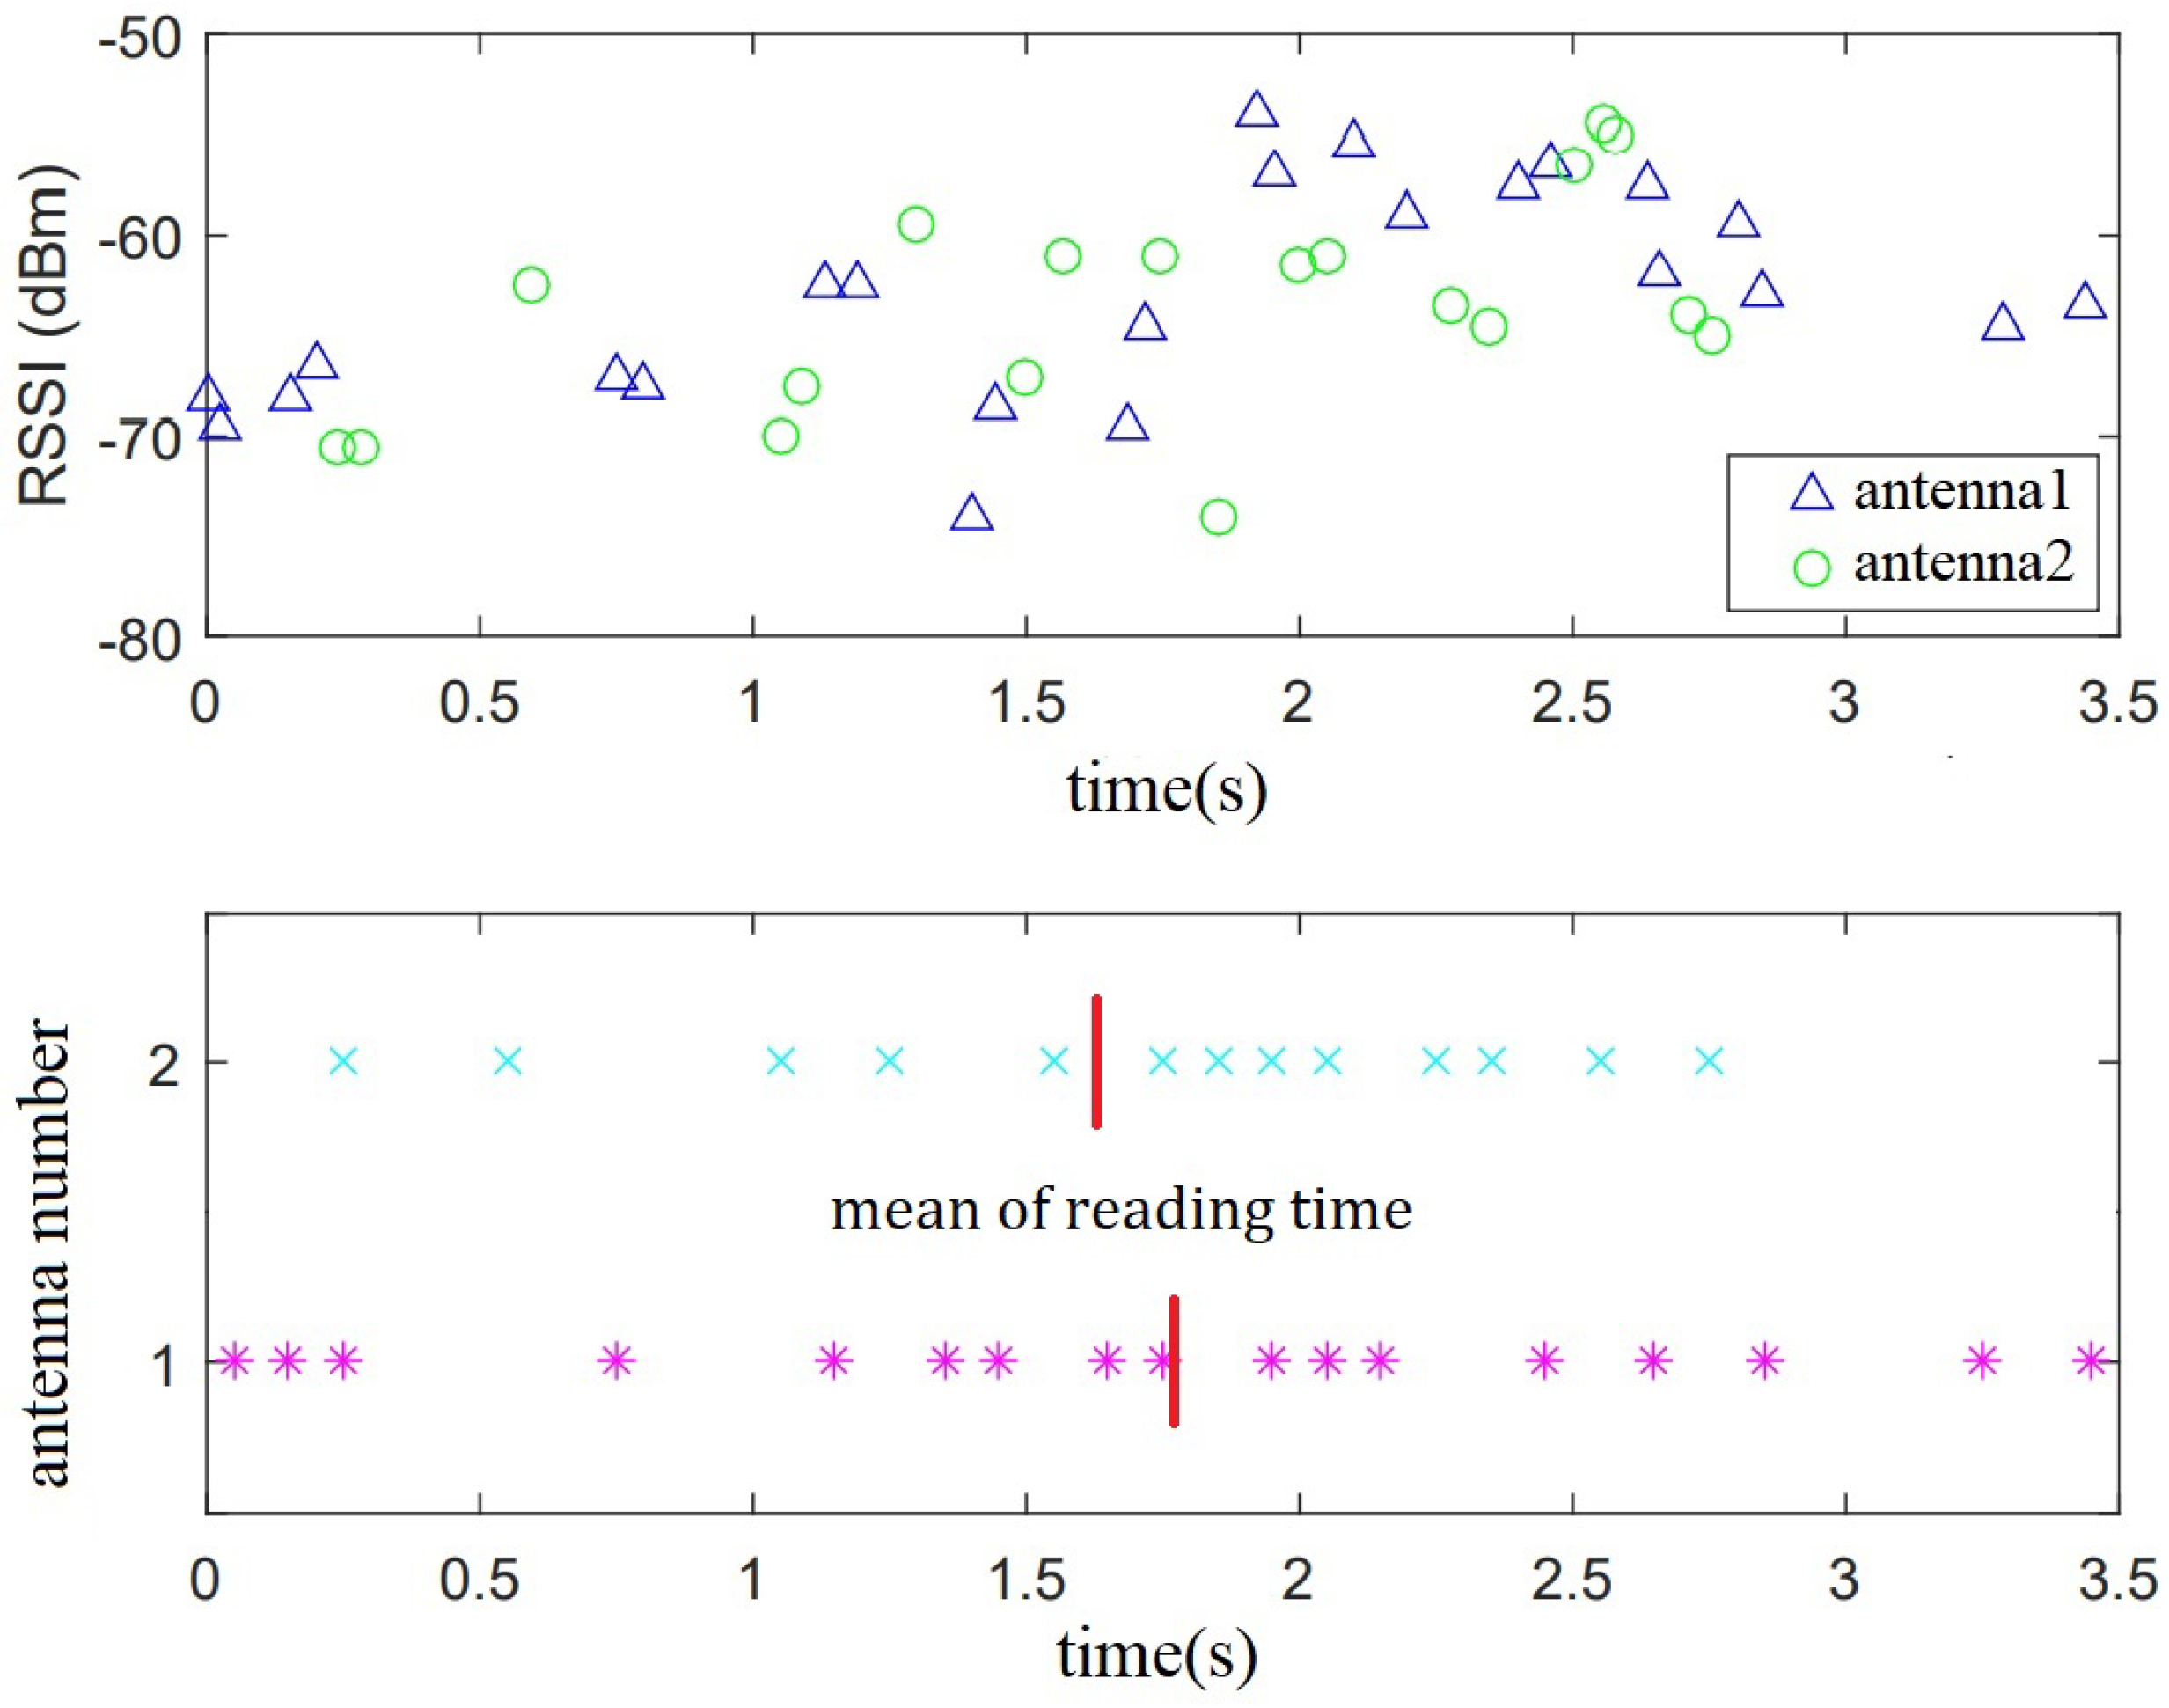
Figure 7 shows the RSSI values when a user moves out with a tag at a constant speed. If the signal-based solution is used, we obtain a wrong answer in this case. For the time slot-based solution, we can obtain t ¯ 1 = 1.78 s and t ¯ 2 = 1.61 s, which means that t ¯ 1 > t ¯ 2 and further verifies that the moving direction is from antenna 2 to antenna 1, i.e., moving out, where the symbols `*’ and `×’ in Figure 7 indicate that the tag is queried within a time slot by antenna1 and antenna2, respectively.

3.3. Tag-Array Based Intrusion Detection

In addition to motion direction detection, intrusion detection is another fundamental function of access control. Illegal intrusion generally falls into two categories: independent intrusion and tailgating intrusion. The former means the attacker individually goes through the access control system, and the latter indicates the attacker closely follows the legal users in the passageway. Since the attacker does not carry any RFID tags, the reader cannot obtain anything from the attacker directly for intrusion detection. RF-Access boils down the issue to a counting-people problem. The idea is to estimate the number of people in the passageway and compare it with that of legal tags queried by the reader. If these two numbers are different, an intrusion event has happened. It is worth noting that if an intruder is detected, the access control system can raise a warning alarm and push this abnormal information to the security guard. The follow-up procedure is application-defined, which is out of the scope of this work.
Since a smart intruder must not carry any tags, we need to design a device-free way to count the number of people. If the intruder carries one or more illegal tags, we can easily figure out the intrusion by reading these tags. In RF-Access, we use a tag array to perform people counting. As shown in Figure 8, we deploy one or more RFID antennas on one side of the passageway and a tag array on the other side. Since the RF signals are vulnerable to the human body, we can take advantage of this inference as the vehicle to people count.
We use a group of experiments to validate this idea. We invite three volunteers to walk through the passageway. To mimic a real attack, we ask for the volunteers to try to be close to each other. Meanwhile, the reader keeps collecting the backscattered signals from all tags. Two parameters are measured, including RSSI and Doppler frequency offset. As shown in Figure 9, 1000 RSSI values obtained from a 6 × 10 tag array are plotted in a polar coordinate system in a random direction, where the radius of each point represents the real RSSI value. We can learn from this figure: (1) When no one walks by, the RSSI distribution forms a thin circle, which indicates that RSSI signals remain relatively stable. (2) RSSI values start to spread out as the number of users increases. The above results demonstrate that there is a potential to use the RSSI distribution to estimate the number of people.
Similarly, we test the Doppler shifts of all tags under different numbers of people. In Figure 10, we randomly select and plot 500 Doppler frequency offset values. Ideally, the Doppler frequency offset should be close to zero when the tag and antenna keep stationary and the Doppler frequency offset increases as the tag moves toward the antenna. However, due to the noise, the Doppler frequency offsets reported by the commercial RFID reader level off at 0 with positive values and negative values, which are shown in Figure 10a. Similar to RSSI, the Doppler frequency offsets become more and more dispersed as the number of people increases.
With the signal features, we can treat the counting problem as a classification problem using machine learning. More specifically, we view RSSI as a random variable and use the entropy of RSSI to measure how the RSSI data spread. Assume that the minimum value of RSSI in all samples is r m i n , and the maximum value is r m a x . The value domain of RSSI is the interval [ r m i n , r m a x ] . Afterward, we divide the interval into N bins with the size Δ of each:
N = r m a x r m i n Δ .
Let m i be the number of RSSI values falling into the ith bin. The probability p i of an RSSI falling into the ith bin is:
p i = m i i = 1 N m i .
The RSSI entropy in unit time can be calculated as follows:
H R = E [ l o g b p ( M ) ] = i = 1 N p i · l o g b ( p i ) ,
where b is the base of logarithm, which is set to two, making the unit of entropy to be b i t . Thus, the RSSI entropy f R of the sample is:
f R = H R / Γ ,
where Γ is the time interval between the first sampling and the last one. For Doppler frequency offsets, we can use the similar method to calculate its entropy.
In addition to the above signal-level features, we observe that the application layer parameters, such as the reading rates, can also be used to conduct counting. With these features, we use the random forest algorithm [18] as the machine learning classifier to conduct counting due to its good classification results on small data sets. We adjust the parameters of the classifier to optimize the estimation accuracy and use the “cross validation method“ to evaluate the model. Specifically, the data set is randomly divided into k mutually exclusive subsets with the similar size. We then utilize one subset as the test set and the remaining k 1 subsets as the training sets to obtain k groups of training/test sets. We finally obtain k mean values of classification accuracy through carrying out k training and classification tests. Here, we adopt “10-fold cross-validation” with k being 10.
It is worth noting that there are some good solutions to the problem of people counting, such as computer vision [8] and radar [19]. We could choose one of them to conduct people counting and use RFID to identity authentication and estimate moving direction. However, in a barrier-free access control system, this increases the deployment overhead and hardware cost for practical use. Instead, our solution is to use an existing RFID device together with a tag matrix (less than nearly 10) to achieve the same task, which might not be the best choice for people counting alone but is a good solution to the existing access control system.

3.4. Put Things Together

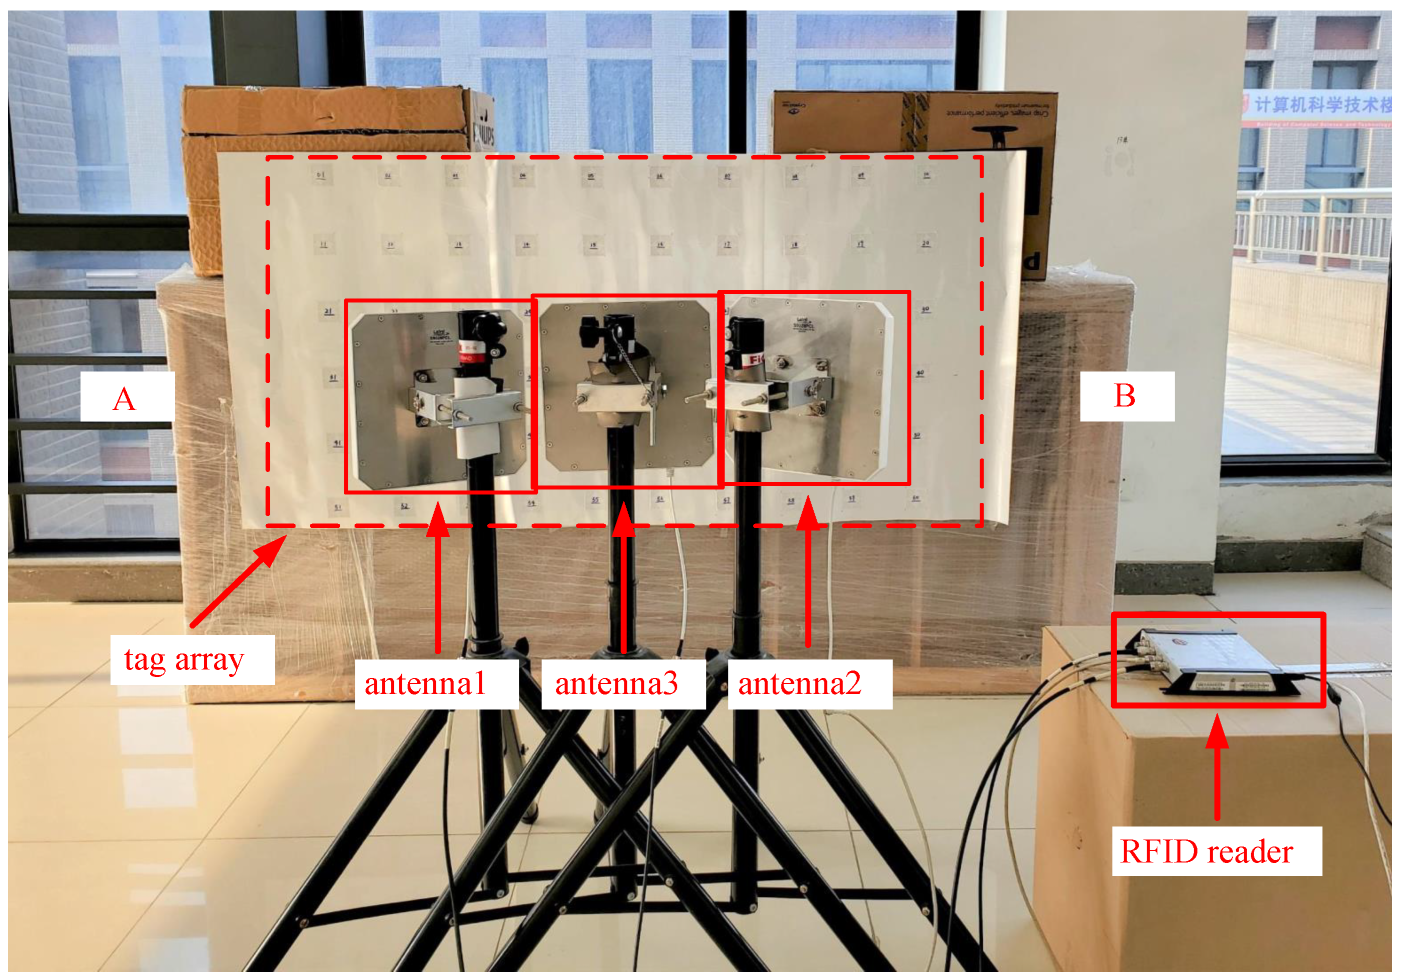
So far, we have discussed motion direction detection and intrusion detection, respectively. Now, we need to put them together to form our access control system RF-Access. As shown in Figure 11, three antennas are installed on one side of the passageway. The two antennas (#1 and #2) are used for moving direction detection. We let antenna #1 slightly face the ‘in’ direction and antenna #2 face the ‘out’ direction, which helps the slot-based solution better identify the moving direction. Additionally, the third antenna #3 is used to keep reading the tag array on the other side of the passageway for intrusion detection. These two parts work together to achieve non-intrusive access control without any stay or flap barriers, which greatly improves the passing speed and quality of service.

4. Evaluation

In this section, we implement a prototype of RF-Access and evaluate its performance in terms of motion direction detection and intrusion detection.

4.1. Implementation

Hardware setup. RF-Access uses an enterprise-level commercial reader, Impinj Speedway R420, which has four antenna ports and a high tag reading rate with hundreds of tags per second. The antenna is Laird S9028PCL [20], which is a circularly polarized directional panel antenna and can receive and transmit signals within the 902–928 MHz frequency band. The antenna gain is 9 dBiC, and the beam width corresponding to 3 dB is 70 degrees. A Laird S9028PCL antenna can concentrate energy in the access control passageway for radiation with the far radiation distance.
System deployment. As shown in Figure 12, RF-Access deploys an RFID reader with three antennas and an RFID tag array at a two-way single passageway access control with a width of 80 cm. One reader works at 32.5 dBm power and 924.375 MHz frequency. Two antennas (antenna #1 and antenna #2) are deployed on one side of the passageway with an interval of 40 cm and an incline of 20 degrees to both ends of the passageway, respectively. The third antenna #3 is deployed between the two antennas, facing the other side of the passageway for intrusion detection. A 6 × 10 tag array is deployed on the other side of the passageway. RF-Access uses Impinj H47 RFID tags with a size of 44 mm × 44 mm. The distance between two adjacent tags is 10 cm. The height of the tags is from 0.4 m to 1.15 m. Antenna #3 faces the center of the tag array, which is 80 cm away from the ground. The antenna continuously records the signal changes from all tags in the array. The passageway is about 1.5 m long.

4.2. Detection of Motion Direction

4.2.1. Experimental Methods

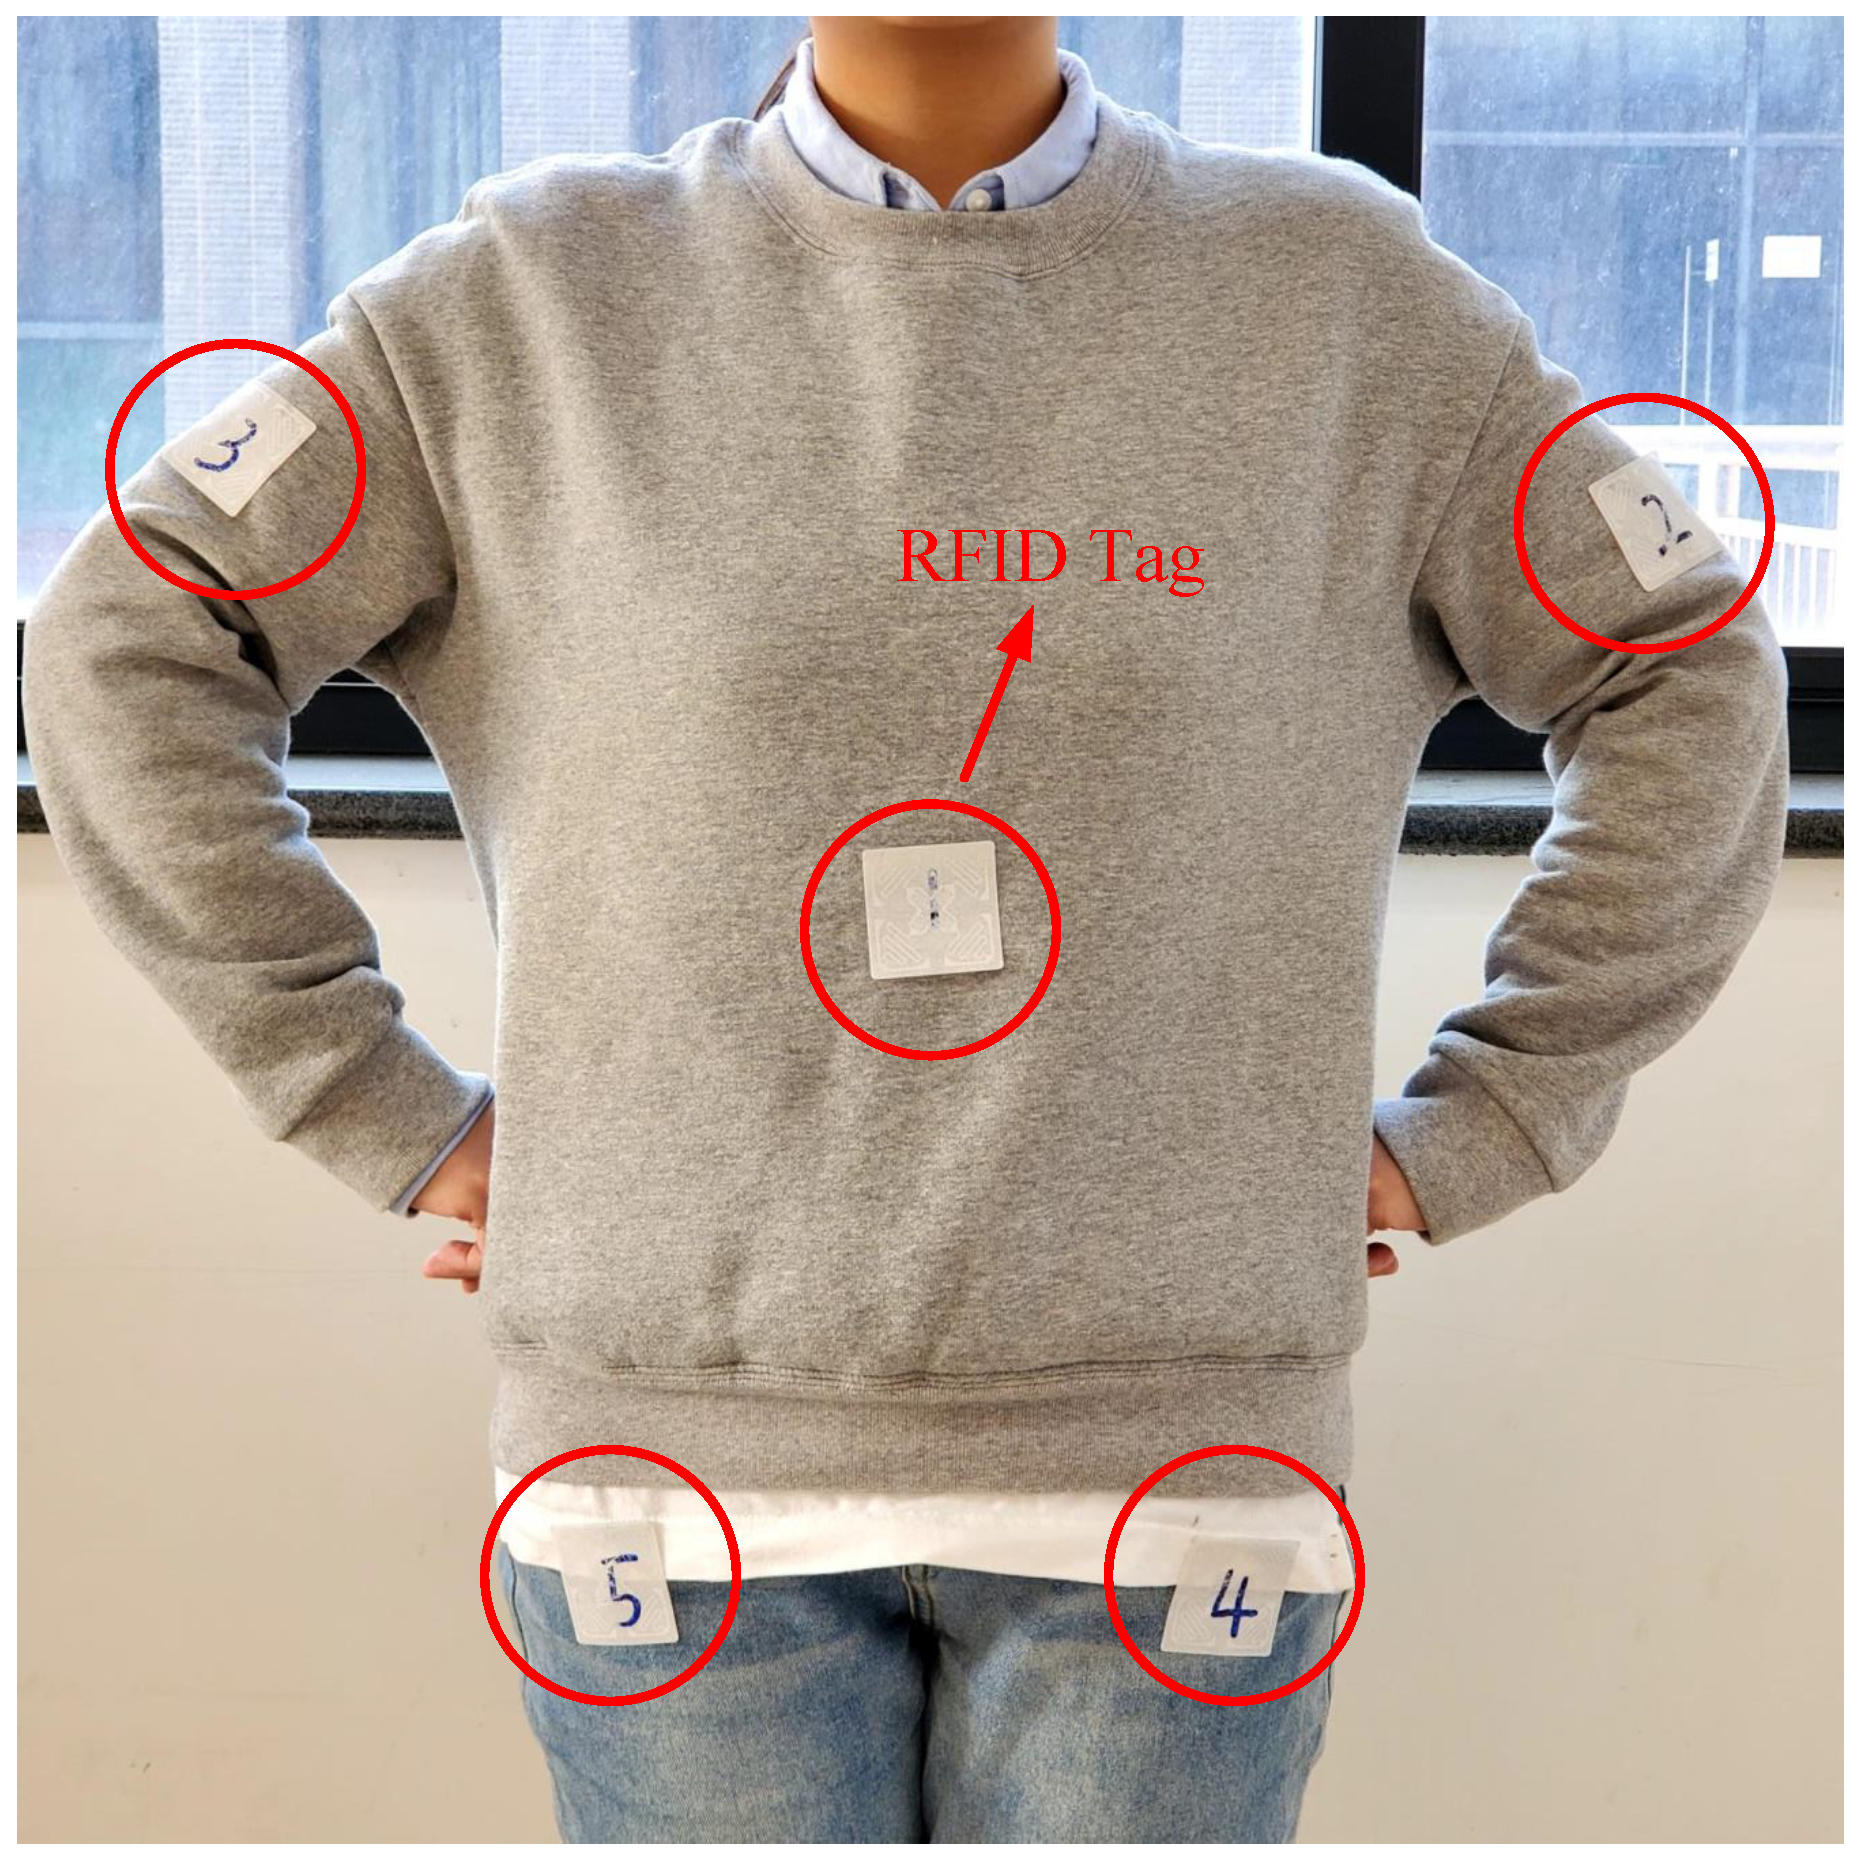
We invite some volunteers to conduct experiments in a general indoor environment for evaluating the performance of our system. Volunteers carry Impinj H47 RFID tags that reflect their identities at different locations and then execute traffic movements at different speeds with a 40 cm distance from the antenna, simulating movement in an 80 cm wide access control passageway. As shown in Figure 13, five tags are placed on the chest, left arm, right arm, left pocket, and right pocket, respectively. Three movement speeds including 1 m/s, 1.5 m/s and 2 m/s are adopted, which mimics three situations: constant speed passing, fast passing and running passing, respectively. Passage behaviors are further divided into two categories: (1) “moving in” behavior: from A to B; (2) “moving out” behavior: from B to A. The volunteers execute each behavior 20 times by carrying the tags at the same locations.
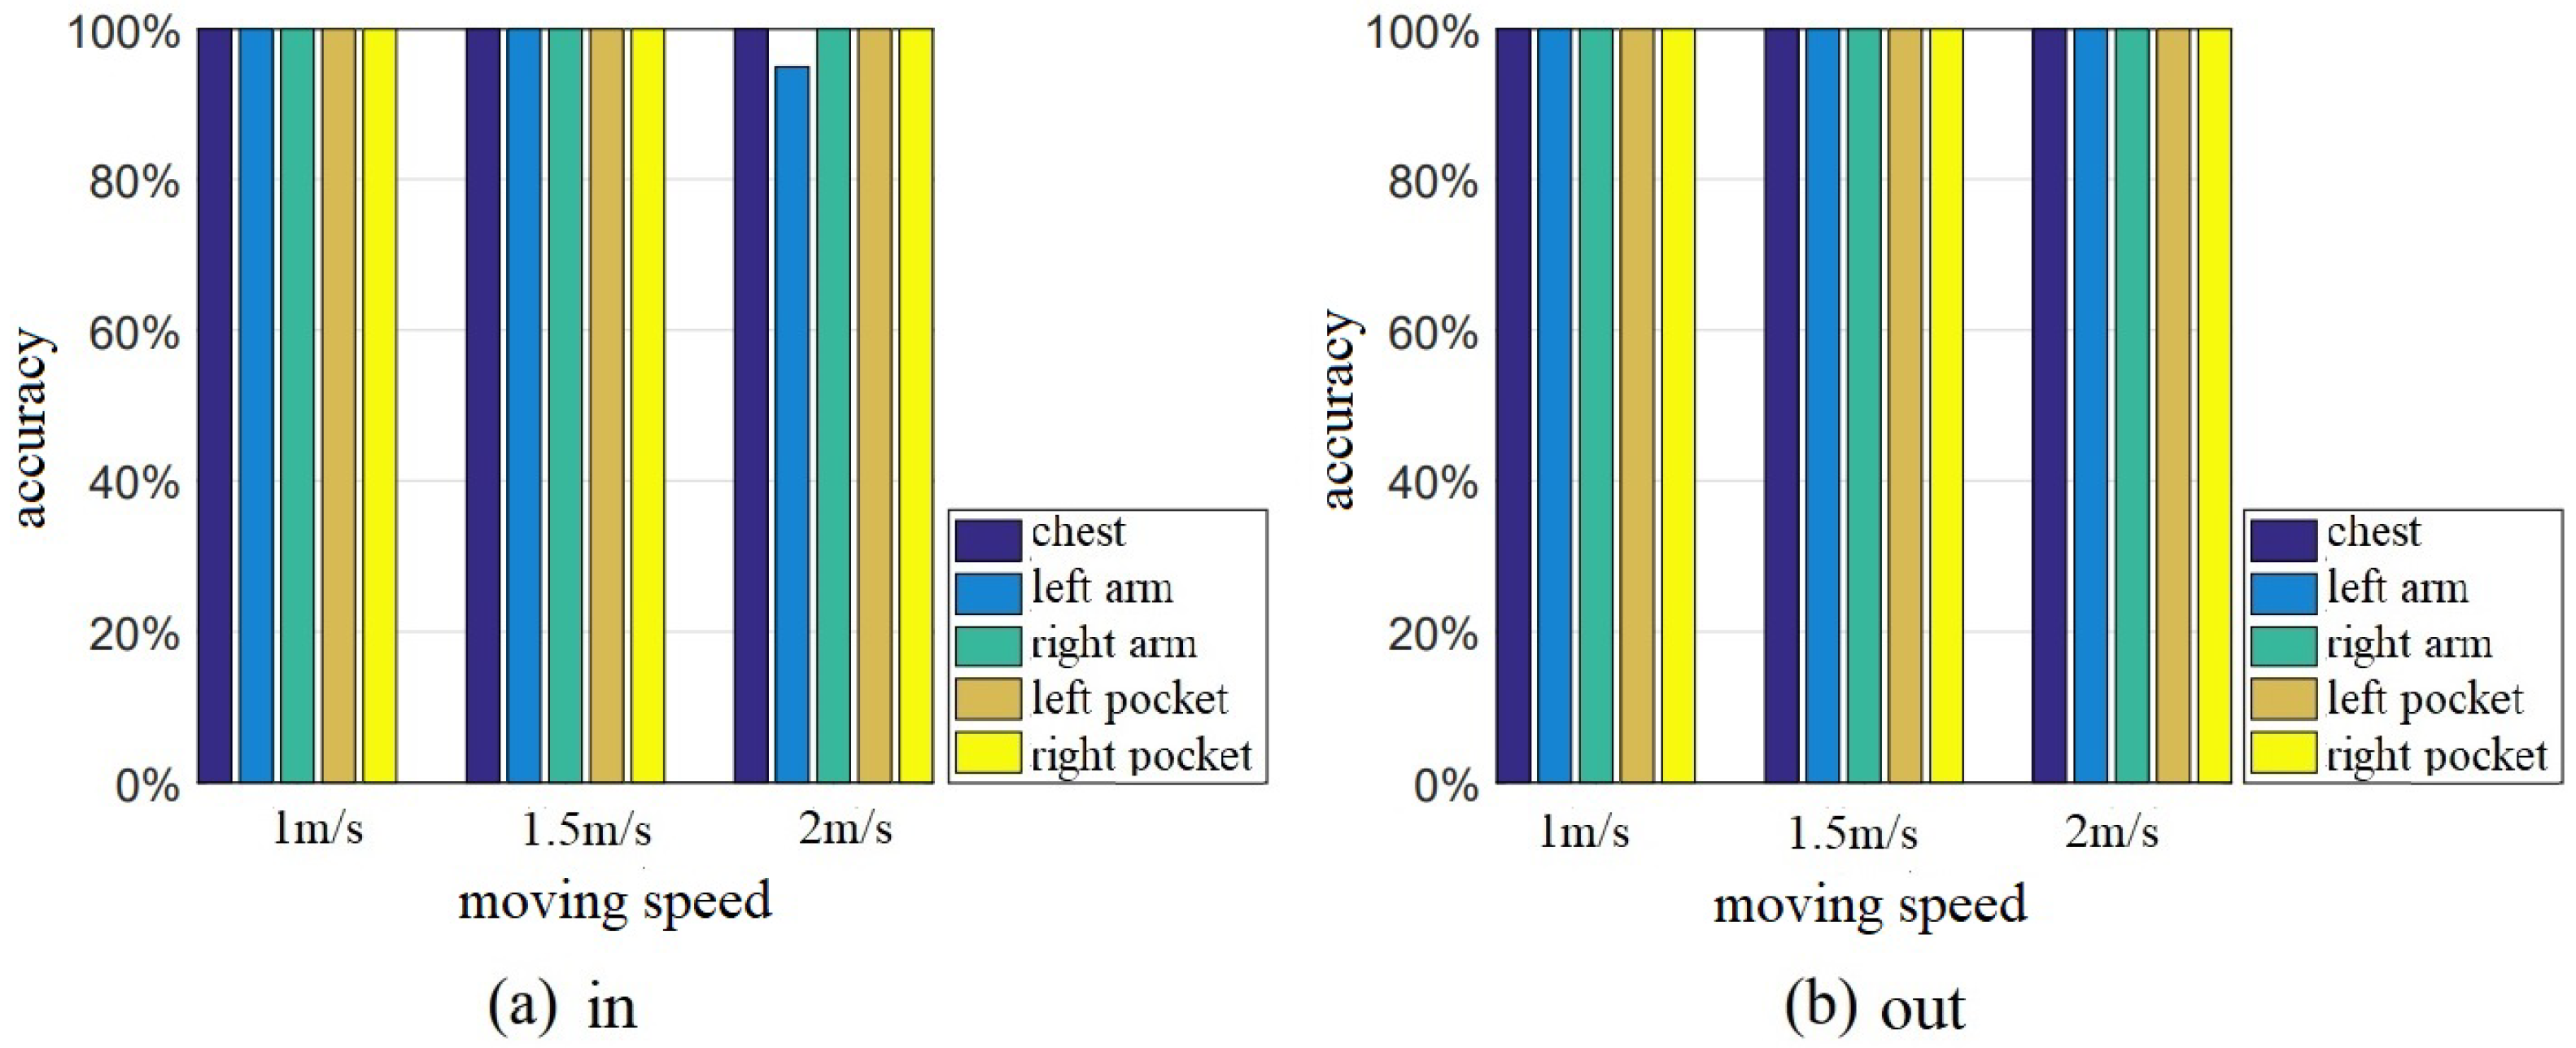
First, we study the performance of the moving direction. Figure 14 and Figure 15 show the detection accuracy of the signal-based model and the slot-based model under different tag positions and different moving speeds. For the signal-based sensing model, the motion direction (in or out) has a small impact on sensing accuracy, but the moving speed has a great impact on the detection accuracy. The detection accuracy generally decreases as the moving speed increases. This is consistent with our intuition that high speeds reduce the collected data, which makes the signal-based analysis hard, leading to relatively low accuracy. Additionally, even when the speed is the same, the accuracy of different tags is different. For example, the right arm’s tag has less than 70% accuracy as the tag moves out. The reason is that the human body blocks the line-of-sight signals, and the reflected signals caused by multi-path will give rise to estimation errors of the distance. This indicates that the signal-based solution can function properly in a relatively ideal scenario but easily suffers from environmental changes.
Compared with the signal-based solution, the time slot-based model has much better performance. As shown in Figure 15, the accuracy almost remains stable at a high level, regardless of the tag’s position, moving direction, and moving speeds. This well validates the good robustness of the slot-based solution. The reason is that we use the reading records rather than signals to detect the direction, which has only two states in a time slot, making it robust to different environmental factors. Next, we study the impact of other factors on accuracy. The following experiments were carried out based on the time-slot-based sensing model.

4.2.2. Impact of Antenna Angle

In Figure 16a, we study the impact of antenna angle on sensing performance. We adjust the antenna angle γ from 0 to 40 with the step of 10 and repeat the experiments 50 times at each angle, with half of the constant speed and half of the running speed. As we can see, the accuracy is close to 100% when the angle is no less than 10 . The case of γ = 0 sees a slight decline. The reason is that the inclined angle helps two antennas better read tags along their facing directions, which benefits direction detection. When the angle is 0, the difference between the two antennas comes from only that of antenna positions, which is too small to properly identify all cases. However, large inclined angles make it hard to deploy the antennas in a gate. We recommend 20 in this case.

4.2.3. Impact of Antenna Distance

In Figure 16b, we evaluate the impact of the antenna spacing distance on the detection accuracy. We change the antenna spacing distance L from 20 cm to 50 cm with the step 10 cm and conduct the experiments 50 times for obtaining the average results. As we can see, the accuracy is close to 100% when the distance is no less than 30 cm. The case of L = 20 cm sees a slight decline. The reason is that a large distance helps two antennas better distinguish moving in and moving out (different directions) from the time domain. We suggest that the distance be set to 30 cm or larger in practical use.

4.2.4. Impact of Different Users

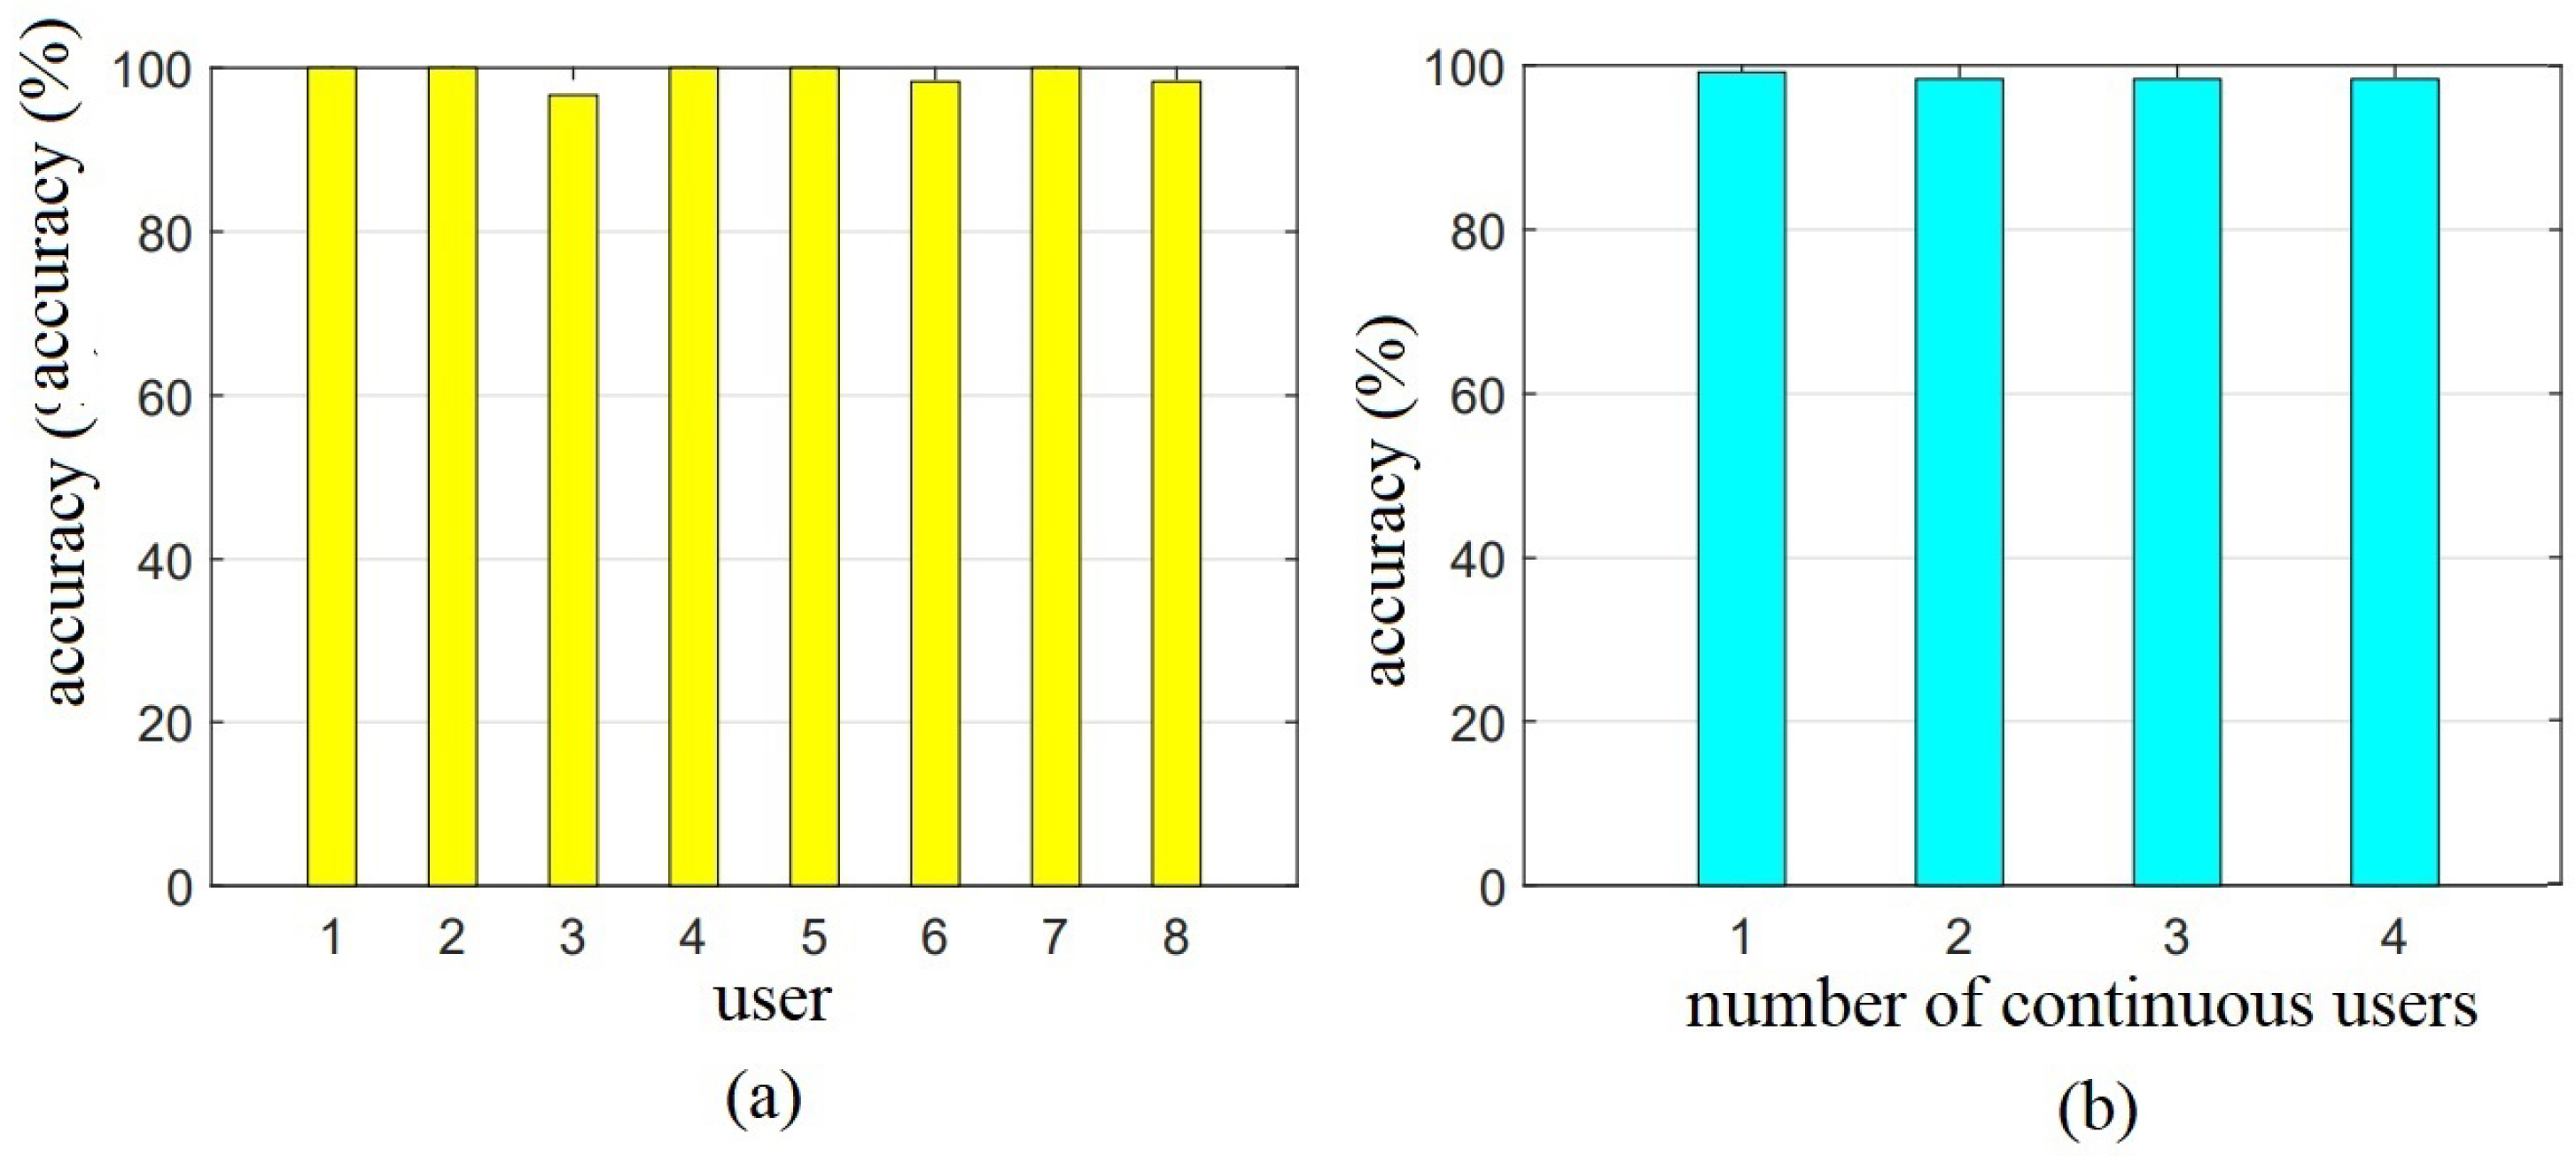
In this study, we investigate the impact of different users on the accuracy of RF-Access. Eight volunteers (five males and three females) were invited to participate in the experiments. Their heights ranged from 155 cm to 185 cm and their weights varied from 45 kg to 80 kg. Each volunteer randomly placed the tag at one of the five positions and passed through the passageway. As shown in Figure 17a, the system can maintain high detection accuracy of active moving directions for different volunteers. Similarly, we can verify that the detection accuracy remains stable when multiple people pass in parallel, as shown in Figure 17b. The results demonstrate that RF-Access can obtain accurate and stable access direction detection results for different visitors.

4.3. Intrusion Detection

4.3.1. Experimental Methods

Next, we study the accuracy of intrusion detection of our tag-array-based sensing model. We let volunteers follow each other and pass through the access control passageway. Meanwhile, the antennas keep collecting the signal changes of the tag array. We label the data and use these data as training samples with uniform distribution. As shown in Table 1, we invited the different volunteers to conduct the experiments 50 times under each scenario. For the single intrusion detection, we let up to three volunteers (without carrying any tags) pass the access control and calculate the average output of 50 experiments.

4.3.2. Detection Accuracy

Table 2 shows the confusion matrix for the classification of 1–3 visitors in the experiment. Each row and each column in the table represent the real and estimated number of the moving visitors, respectively. Each element in the matrix represents the percentage correctly estimated. As shown in Table 2, the average recall rate of the classification is 96.10%, and its standard deviation is 0.016. The cases of 1–3 visitors are not wrongly judged as zero, and the recall rates of three categories are higher than 95% for people counting. The overall accuracy is 95.67%. Specifically, if the estimated number is greater than the real one, it is considered that illegal visitors exist in the access control system. The false alarm rate in the experiment is 1.33%. On the contrary, if the estimated number is less than the real value, there exists a possibility of missing the illegal intrusion, and the rate in the experiments is 0.03%. Both the false alarm rate and the omission rate are low. In a single intrusion detection, the accuracy rate is as high as 99.9%. Based on the above experiments of single intrusion detection and tailgating intrusion detection, we can obtain that the accuracy of RF-Access for illegal intrusion detection is 96.67%.

5. Conclusions

In this paper, we propose a novel barrier-free access control system called RF-Access with UHF RFID technology. The main advantage of RF-Access is that it provides non-intrusive access control by removing flap barriers and processes of swiping the identity card, which greatly improves time efficiency and quality of service. RF-Access addresses two key issues of non-intrusive access control: motion direction detection and illegal intrusion detection by using a dual-antenna tag-array together with a time-slot based model. We implement a prototype of RF-Access with commercial RFID devices. Extensive experimental results show that our proposed system has good performance.

Author Contributions

Conceptualization, X.W. (Xuan Wang), Y.Y. and J.L.; methodology, X.W. (Xuan Wang) and J.L.; software, X.W. (Xia Wang) and Y.Y.; validation, X.W. (Xuan Wang) and Y.Y.; writing—original draft preparation, Y.Y., X.W. (Xuan Wang), and X.W. (Xia Wang); writing—review and editing, X.W. (Xia Wang) and J.L.; supervision, J.L. and Z.Z.; funding acquisition, J.L. All authors have read and agreed to the published version of the manuscript.

Funding

The National Natural Science Foundation of China under Grant 62072231, the Open Project of State Key Laboratory for Novel Software Technology under Grant KFKT2021B15, and the Collaborative Innovation Center of Novel Software Technology and Industrialization.

Institutional Review Board Statement

Not applicable.

Informed Consent Statement

Not applicable.

Data Availability Statement

Not applicable.

Conflicts of Interest

The authors declare no conflict of interest.

References

  1. Choi, T.M. Coordination and Risk Analysis of VMI Supply Chains With RFID Technology. IEEE Trans. Ind. Inform. 2011, 7, 497–504. [Google Scholar] [CrossRef]
  2. Chen, X.; Liu, J.; Wang, X.; Liu, H.; Jiang, D.; Chen, L. Eingerprint: Robust Energy-related Fingerprinting for Passive RFID Tags. In Proceedings of the USENIX NSDI, Santa Clara, CA, USA, 25–27 February 2020; pp. 1101–1113. [Google Scholar]
  3. Fyhn, K.; Jacobsen, R.M.; Popovski, P.; Larsen, T. Fast Capture-Recapture Approach for Mitigating the Problem of Missing RFID Tags. IEEE Trans. Mob. Comput. 2012, 11, 518–528. [Google Scholar] [CrossRef]
  4. Liu, J.; Zhu, F.; Wang, Y.; Wang, X.; Pan, Q.; Chen, L. RF-scanner: Shelf scanning with robot-assisted RFID systems. In Proceedings of the IEEE INFOCOM, Atlanta, GA, USA, 1–4 May 2017; pp. 1–9. [Google Scholar]
  5. Shangguan, L.; Zhou, Z.; Zheng, X.; Yang, L.; Liu, Y.; Han, J. ShopMiner: Mining Customer Shopping Behavior in Physical Clothing Stores with COTS RFID Devices. In Proceedings of the ACM SenSys, Seoul, Korea, 1–4 November 2015; pp. 113–126. [Google Scholar]
  6. Liu, J.; Chen, S.; Chen, M.; Xiao, Q.; Chen, L. Pose Sensing with a Single RFID Tag. IEEE/ACM Trans. Netw. 2020, 28, 2023–2036. [Google Scholar] [CrossRef]
  7. IEE: A Sense for Innovation. Available online: https://iee-sensing.com (accessed on 11 October 2022).
  8. Xu, X. Application and Innovation of Eight Integrated Technologies of Intelligent Access Card System. China Secur. Prot. 2014, 8, 52–54. [Google Scholar]
  9. Yang, L.; Chen, Y.; Li, X.Y.; Xiao, C.; Li, M.; Liu, Y. Tagoram: Real-time tracking of mobile RFID tags to high precision using COTS devices. In Proceedings of the 20th Annual International Conference on Mobile Computing and Networking, Maui Hawaii USA, 7–11 September 2014; pp. 237–248. [Google Scholar]
  10. Stefaniak, P.; Jachnik, B.; Koperska, W.; Skoczylas, A. Localization of LHD Machines in Underground Conditions Using IMU Sensors and DTW Algorithm. Appl. Sci. 2021, 11, 6751. [Google Scholar] [CrossRef]
  11. Mai, A.; Wei, Z.; Gao, M. An access control and positioning security management system based on RFID. In Proceedings of the 7th International Conference on Intelligent Human-Machine Systems and Cybernetics, Hangzhou, China, 26–27 August 2015; Volume 2, pp. 537–540. [Google Scholar]
  12. Wang, Y. Open Trouble-Free Guard Management System Based on RFID Technology. Master’s Thesis, Ocean University of China, Qingdao, China, 2008. [Google Scholar]
  13. Fan, J. Research and Design of Student Apartments Barrier-Free Access Management System Based on RFID Technology. Master’s Thesis, Harbin Engineering University, Harbin, China, 2015. [Google Scholar]
  14. He, S.P.; Li, A.G.; Zhang, X. Design of Removable Intelligenct Barrier-free Access Control System Based on Mobile Technique. Meas. Control Technol. 2017, 36, 72–75. [Google Scholar]
  15. Impinj Inc. Available online: http://www.impinj.com (accessed on 11 October 2022).
  16. atlasRFIDstore. Available online: https://www.atlasrfidstore.com/impinj-xspan-gateway-rfid-reader (accessed on 11 October 2022).
  17. Griffin, J.D.; Durgin, G.D. Complete Link Budgets for Backscatter-Radio and RFID Systems. IEEE Antennas Propag. Mag. 2009, 51, 11–25. [Google Scholar] [CrossRef]
  18. Breiman, L. Random forests. Mach. Learn. 2001, 45, 5–32. [Google Scholar] [CrossRef] [Green Version]
  19. Vayyar. Available online: https://vayyar.com/technology/ (accessed on 11 October 2022).
  20. Laird Inc. Available online: https://www.lairdconnect.com/rf-antennas/rfid-antennas/s902-series-rfid-antenna (accessed on 11 October 2022).
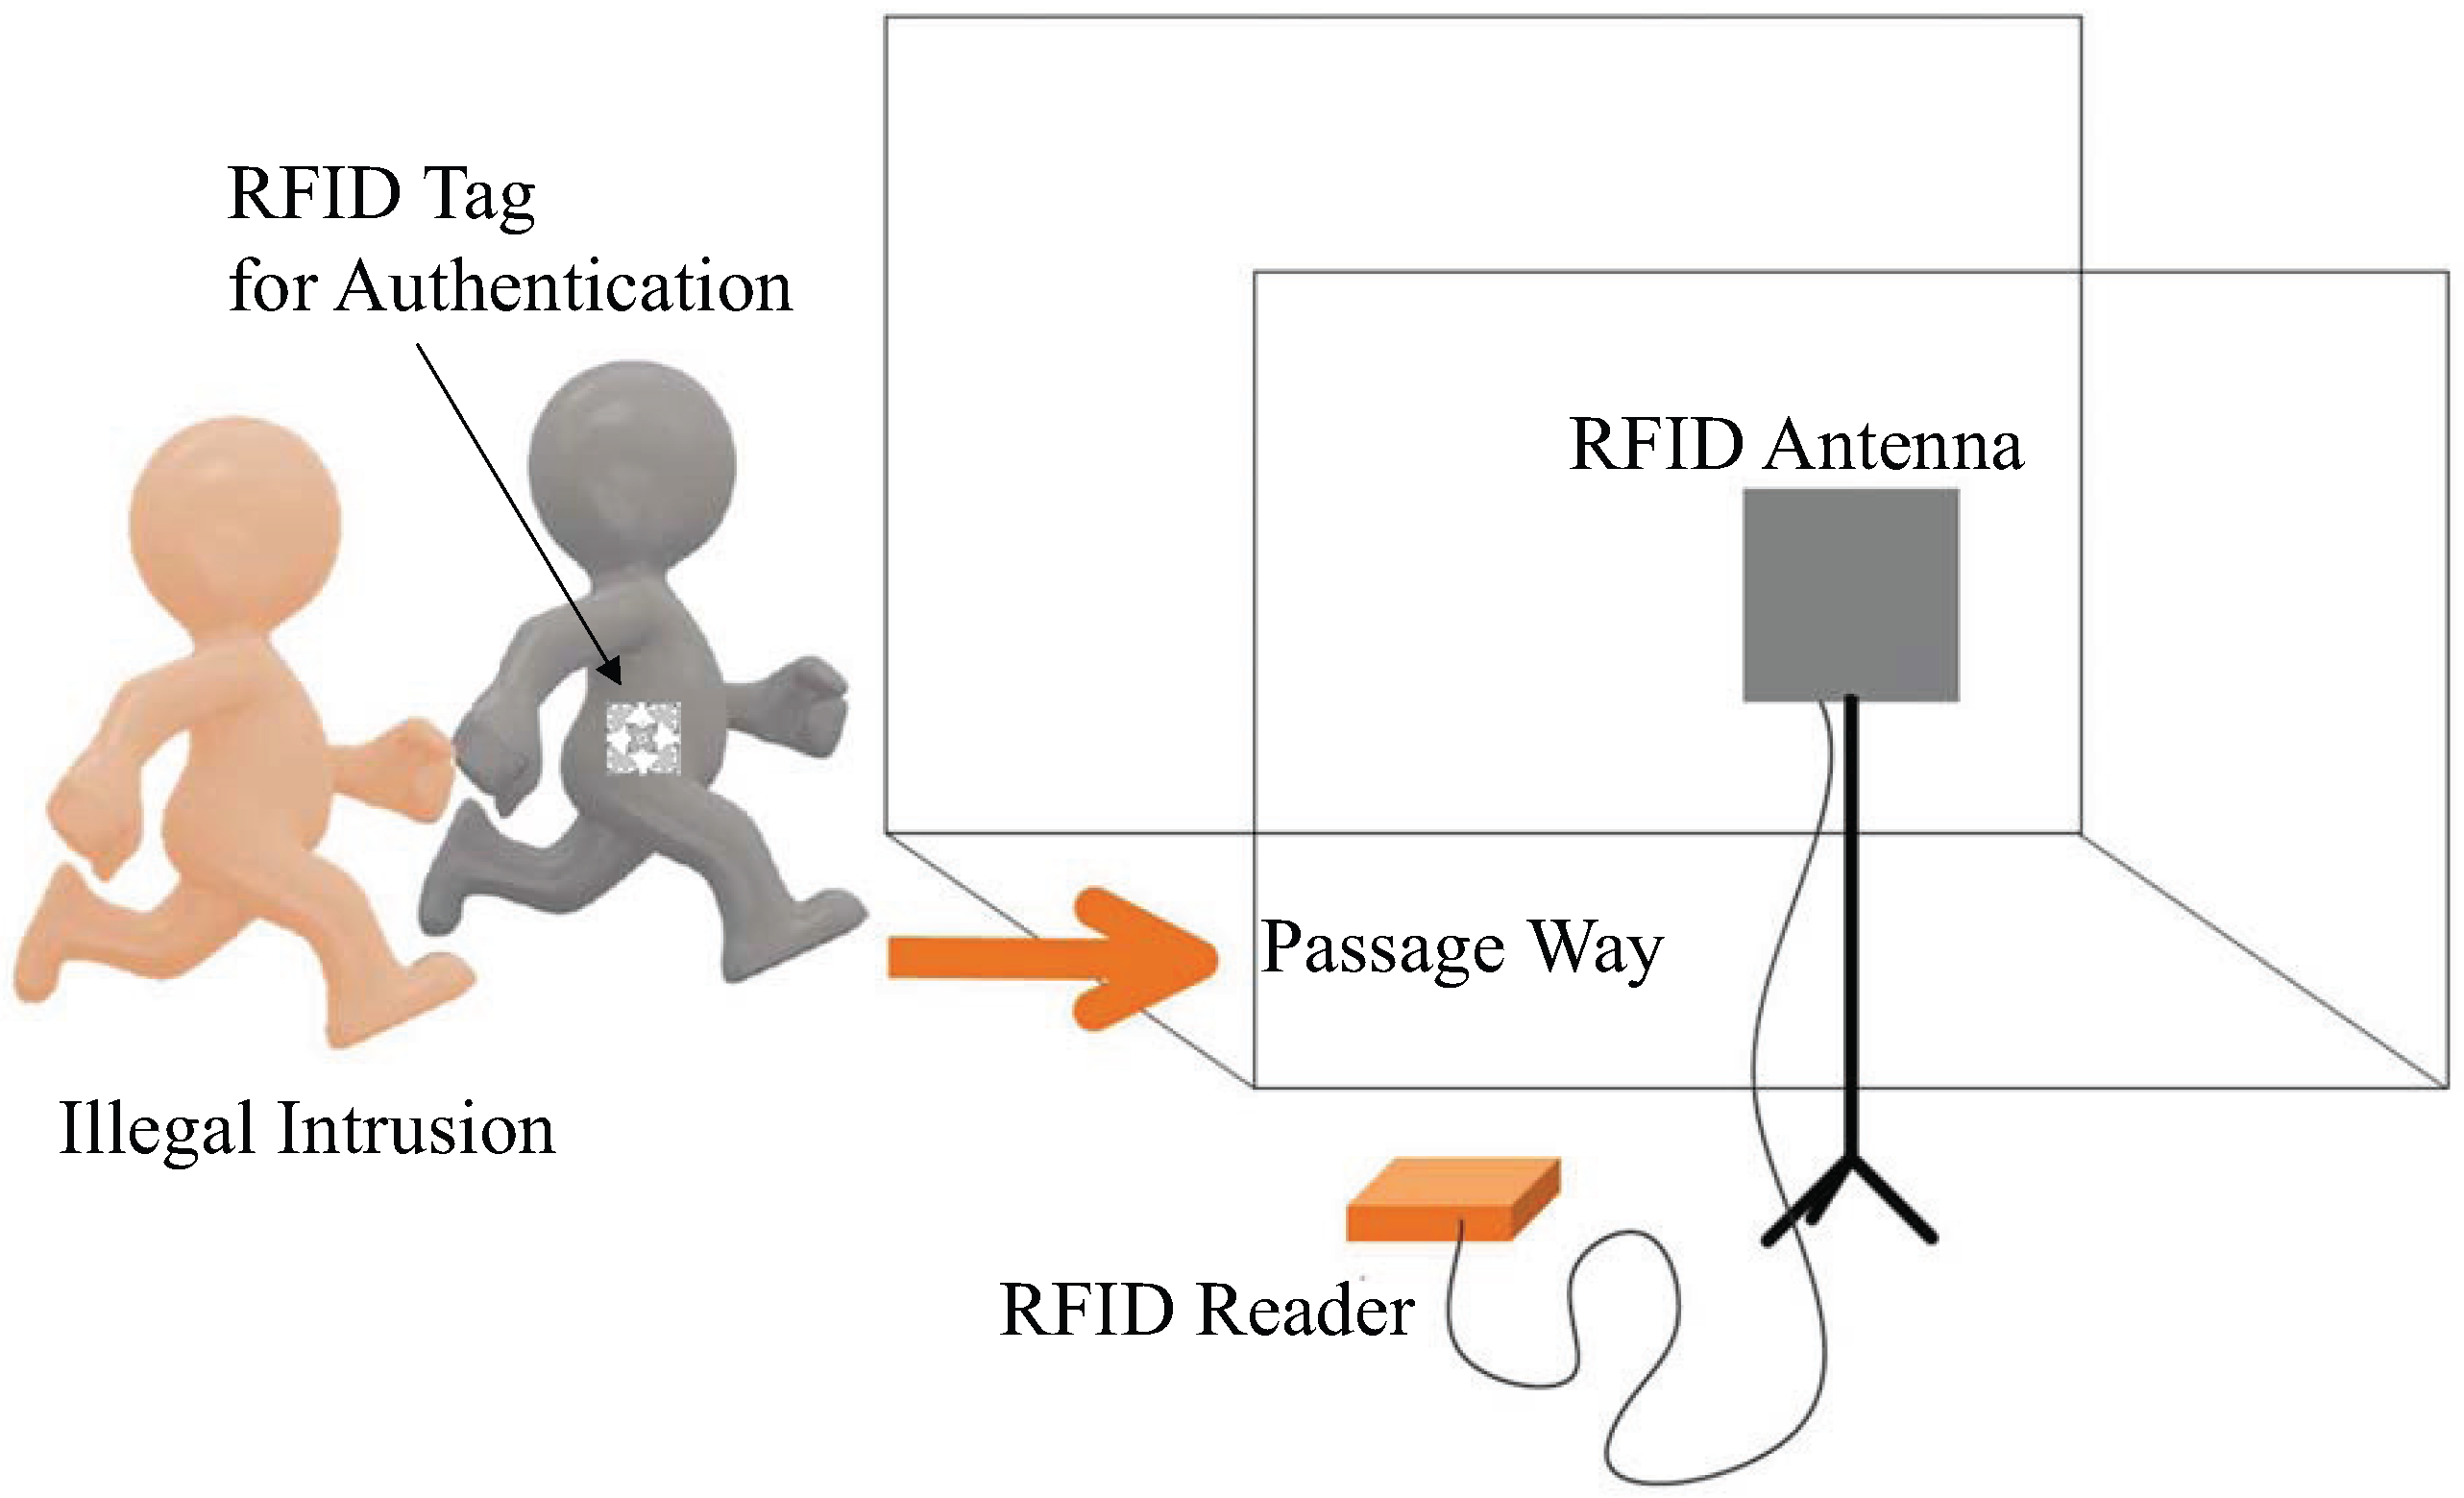
Figure 1. System overview.
Applsci 12 11592 g001
Figure 2. The changes of tag-to-reader distance when a tag moves linearly (omnidirectional antenna in this case).
Applsci 12 11592 g002
Figure 3. The theoretical RSSI value when a tag moves along the x-axis.
Applsci 12 11592 g003
Figure 4. System deployment for the RSSI-based model.
Applsci 12 11592 g004
Figure 5. RSSI values with respect to the time; (a) moving in; (b) moving out.
Applsci 12 11592 g005
Figure 6. RSSI values collected from a running tagged person: (a) moving in; (b) moving out.
Applsci 12 11592 g006
Figure 7. An illustration of time-slot-based detection.
Applsci 12 11592 g007
Figure 8. Tag-array-based intrusion detection.
Applsci 12 11592 g008
Figure 9. Impact of the number of users on RSSI.
Applsci 12 11592 g009
Figure 10. Impact of the number of users on Doppler frequency offsets.
Applsci 12 11592 g010
Figure 11. Top view of RF-Access deployment.
Applsci 12 11592 g011
Figure 12. System deployment of RF-Access.
Applsci 12 11592 g012
Figure 13. Tag positions.
Applsci 12 11592 g013
Figure 14. Detection accuracy of signal-based sensing model.
Applsci 12 11592 g014
Figure 15. Detection accuracy of time-slot-based sensing model.
Applsci 12 11592 g015
Figure 16. Detection accuracy with different antenna angle and distance.
Applsci 12 11592 g016
Figure 17. Detection accuracy for the visitors with different shapes and behaviors.
Applsci 12 11592 g017
Table 1. Experimental setup of tailgating intrusion detection.
NumberVisitor QuantityLegal Visitor QuantityIllegal Visitor Quantity
1110
2220
3211
4330
5321
6312
Table 2. Confusion matrix of people counting.
True ValueEstimated Value
0 Visitor1 Visitor2 Visitors3 Visitors
0 visitor1000
1 visitor00.980.020
2 visitors00.020.950.03
3 visitors00.0070.040.953
Publisher’s Note: MDPI stays neutral with regard to jurisdictional claims in published maps and institutional affiliations.