Abstract
To study the rewetting characteristics of tobacco strips during the redrying stage, a conjugate heat and mass transfer model of tobacco strips was established based on their physical properties. The fundamental relationship between the multiphysical fields and humidity fields of tobacco strips and the key process parameters was considered in this model, and the feasibility of the model was verified via experiments. Based on this model, the transfer and variation laws of the moisture content, humidification rate, and temperature of tobacco strips under different relative humidity and temperature conditions were studied, and the rewetting process parameters of tobacco strips were determined using COMSOL Multiphysics. The results show that this model can be used to study the rewetting characteristics of tobacco strips during the redrying stage. The rewetting of tobacco strips can be divided into two stages, namely, the accelerated stage and approximate constant rate increase stage, where the former stage has a greater impact on the rewetting effect. The higher the relative humidity and temperature, the greater the change in the moisture content, humidification rate, and effective moisture diffusivity, and the faster the increase rate. The best rewetting effect was achieved when the relative humidity was 85% and the temperature was 55 °C. Under these conditions, the moisture content of the tobacco strips was 11% to 13%, the humidification rate was 0.03 %/s to 0.29 %/s, the highest effective moisture diffusivity was 7.8 × 10⁻¹⁰ m2/s, and the maximum activation energy was 37.86 kJ/mol. This study provides a theoretical basis and data support for analyzing the characteristics of the rewetting process and for optimizing the process parameters.
1. Introduction
The rewetting of tobacco strips during the redrying stage (hereinafter referred to as rewetting) is a more complex and difficult part of the whole redrying process [1], which aims to make the internal moisture and temperature of heaped tobacco strips reach the specified process index [2,3] while being conducive to natural alcoholization. Traditional rewetting methods have been eliminated due to their large number of problems, and now, rewetting with a forced hot and humid airflow is commonly used [4]. No matter which rewetting method is used, it is greatly influenced by the process parameters. Because of the numerous and complex process parameters [5,6,7] and because adjustment mainly relies on manual experience [8], various problems arise, such as reduced tobacco quality and high moisture and vapor consumption [9]. The influence of relative humidity and temperature on rewetting characteristics is a problem that urgently needs to be solved.
In the process of rewetting, relative humidity and temperature are critical for consistent rewetting quality and strip yield [10]. Shi [1] used the BP neural network algorithm to control and optimize the moisture and temperature of a tobacco redrying machine, and this algorithm greatly improved the rewetting quality of tobacco strips. Fu et al. [11] proposed a novel dual-control algorithm to control the exit moisture and to reduce the fluctuation amplitude of the outlet moisture during the tobacco redrying process. Wang et al. [12] designed a serial predictive compensation control strategy based on the serial relationship between the moisture content of tobacco strips at the outlet of the redryer and that of tobacco strips packed in cases, which solved the problem of the unstable moisture content of tobacco strip packing in the drying line. Based on the thermodynamic theory, Ji et al. [13] simulated the temperature field and flow field of tobacco in a reversion machine and optimized the structure of the reversion machine based on simulation and experimental results to improve the quality of tobacco rewetting. Zhao et al. [14] built a mathematical model of the internal flow field of the box and the motion of the strips and silk particles based on the fluid dynamics theory to optimize the tobacco conditioner, and improve the utilization rate of strips and product quality. Tang et al. [15] established a loose rewetting network model of tobacco strips using the Bayesian network analysis method to explore the complex relationship between the process parameters and quality indicators in the process of rewetting during production. Xu et al. [16] improved the number and layout of nozzles in a rewetting cylinder, optimized the moisture addition and proportion, and solved the problem of wet mass after rewetting. In summary, these studies on improving the quality and qualified rate of tobacco strips by changing the process parameters, such as relative humidity and temperature, were realized by improving algorithms based on simulations to optimize the structure of rewetting machines. In terms of the mechanism, there are few studies on the influence of the transfer and diffusion of external relative humidity and temperature on rewetting.
In this paper, a conjugate heat and mass transfer model of tobacco strips was established, and the reliability of the model was verified by experiments. Based on the established model, the transfer and distribution of moisture and temperature at different positions and thicknesses of tobacco strips were calculated. The influence of the relative humidity and temperature on the moisture content, humidification rate, effective moisture diffusivity, and activation energy of the tobacco strips was studied, and the rewetting characteristics and process parameters were explored.
2. Model Construction
A schematic diagram of heaped tobacco strips during a rewetting session is shown in Figure 1. Tobacco strips enter the rewetting box (0.4 × 0.35 × 0.8 m) from the right inlet and then move toward the left outlet. During this period, air at the bottom mixes with vapor entering from the sides, which passes through the tobacco strips from the bottom to the top, and the tobacco strips are discharged from the outlet at the top of the box. To analyze the rewetting characteristics, a conjugate heat and mass transfer model was established based on mass equations and energy equations. The fundamental relationship between the internal temperature field and humidity field of the tobacco strips and the key process control technical indexes were considered in this model.
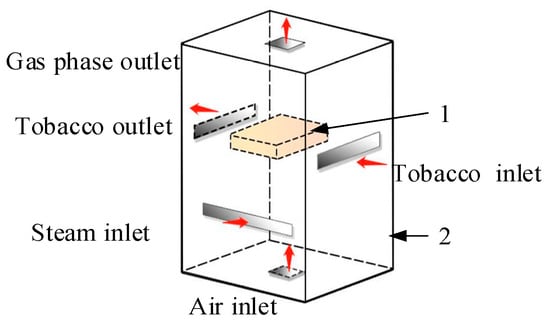
Figure 1.
Schematic of heaped tobacco in rewetting session: 1—heaped tobacco strips; 2—rewetting box.
2.1. Physical Model
The physical model of tobacco rewetting is shown in Figure 2 (0.25 × 0.25 × 0.08 m), which describes the complex heat and mass transfer phenomena of the tobacco strips during the rewetting process. Due to the differences in temperature, humidity, pressure, and flow rate between the environment and tobacco strips [4], the gas-phase moisture and heat in the external environment will make contact with the lower surface of the heaped tobacco strips first, which will absorb the heat and moisture and diffuse them to the upper part of the tobacco strips, forming an exchange and transfer of heat and mass between the external environment and tobacco strips. The properties of the heaped tobacco strips in this work are given in Table 1, the rest of the values are below the corresponding equations.
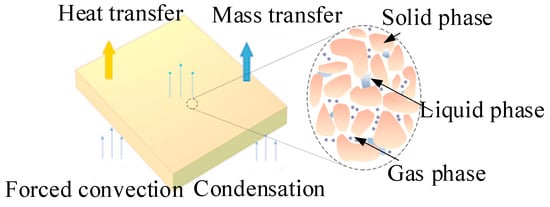
Figure 2.
Heat and mass transfer within the heaped tobacco strips in the rewetting session.

Table 1.
Physical properties of the heaped tobacco strips.
2.2. Mathematical Models
Based on the physical model, we can analyze the mathematical model more easily. After the investigation of the factory, it is known that the deformation of tobacco strips in the process of rewetting can be neglected, and the tobacco strips are greatly affected by the capillary forces. The temperature and humidity of the three phases in the tobacco strips have little difference and can be regarded as equal. Some assumptions will be made within the acceptable error range, such as how the solid phase of tobacco strips does not absorb water and is a rigid skeleton; water can stay in any position in the tobacco strips under the action of capillary force; the initial temperatures of the solid, liquid, and gas phases inside the tobacco strips are the same; and the initial liquid phase of the moisture coexists with the gas phase inside the tobacco strips and is in thermodynamic equilibrium. According to the mass equations and energy equations, the heat and mass transfer mathematical model of the tobacco strips during the rewetting process was established.
2.2.1. Mass Equation
According to the assumption that the geometry of the solid phase does not change with time, the mass conservations of the liquid phase and gas phase need to be analyzed separately. Here, the liquid phase refers to the liquid water and the capillary pressure depends on the concentration (cl) and temperature (T) of the tobacco strips [19]; however, the effect of temperature is negligible in this work, and the mass equation is:
where t is time (s), φ is porosity, Sl is the saturation of the liquid-phase water, ρl is the density of the liquid phase (kg/m3), Rcon is a condensation rate (kg/m3/s), and indicates the liquid-phase flux (kg/m2/s1) as given by Darcy’s law:
where µl is the viscosity of the liquid phase (Pa.s); kl indicates the fixed permeability of the liquid phase (m2); kl,r indicates the relative permeability of the liquid phase, which is the ratio of the effective permeability of the liquid phase to absolute permeability and is a dimensionless number; pl is the pressure in the liquid phase (Pa); P is the total pressure (Pa); and pc is the capillary pressure (Pa). The first term represents the flow due to the gradients in the gas pressure. The second term represents the flow due to the capillary pressure. The capillary pressure depends on the concentration (cl) and temperature (T) of the tobacco strips [19]. Therefore, it can be rewritten as:
where cl indicates the concentration of the liquid-phase water(kg/m3) and T indicates the temperature of the tobacco strips (°C).
The capillary diffusivity due to the temperature gradient is known as the Soret effect and is often less significant than the diffusivity due to the concentration gradients, and thus, will be neglected in this work. Therefore, Equation (1) can be rewritten as:
Based on the above equations, an appropriate closure equation linking Sl to pc is provided, as the capillary pressure and a retention model need to be introduced [20]. The capillary pressure pc is defined as the difference between the total pressure and liquid phase at their interface, namely, [21]:
A retention model proposed by van Genuchten [22] clearly shows the correlation between the capillary pressure and pore saturation:
where θl is the normalized saturation content [20], β and n are the material-dependent parameters, m indicates the porous matrix property, and m = 1 − 1/n; at the same time, the relative permeability kl,r and saturation of the liquid-phase Sl can be represented as:
where L is a material-dependent parameter [20].
Consider that the sum of the gas-phase saturation (Sg) and liquid-phase saturation (Sl) is 1. To simplify the calculation, it is assumed that the gas phase can flow freely in both the internal and the external environment of the heaped tobacco strips [21] (i.e., θl = Sl). P is considered the constant within the porous matrix; thus, Equation (5) and the first term of Equation (4) involving Sl can be written as:
Thus, Equation (4) can be rewritten as:
If kl, β, L, and n are known, Equations (6), (7) and (9) can be used to describe the accumulation of the tobacco strips’ capillary suction.
The gas phase is a mixture of vapor and air, and its mass equation is:
where Sg is the saturation of the gas-phase moisture, ρg indicates the density of the gas phase within the tobacco strips (kg/m3), ωv indicates the mass fraction of the vapor, ρv indicates the density of vapor in the tobacco strips (kg/m3), kg,r indicates the relative permeability of the gas phase, kg indicates the gas-phase internal permeability (m2), μv indicates the vapor viscosity (Pa.s), and Deff,g indicates the effective diffusivity of the gas phase in tobacco strips (m2/s).
During the rewetting process of the tobacco strips, the condensation is in disequilibrium, and Rcon can be calculated using the nonequilibrium formulation [23] for porous materials:
where pv,eq indicates the gas-phase steam equilibrium pressure (Pa); Mv indicates the molecular weight of vapor in the gas phase (kg/mol); R indicates the universal gas constant, 8.314 (J/mol/K) [24]; T indicates temperature (°C); pv indicates the gas-phase vapor pressure (Pa); and Kcon indicates the condensation constant [25], 1000 (s−1).
2.2.2. Energy Equation
Based on heat balance, considering the energy changes caused by conduction, convection, and condensation, the energy equation can be expressed as:
where ρa indicates the air density inside the tobacco strips (kg/m3); cp,a and cp,v indicate the air and steam heat capacities ((J/kg/K), respectively; keff indicates the effective penetration rate (m2); Dv,a indicates the binary diffusivity (m2/s); and μg indicates the gas-phase viscosity (Pa.s), where keff is expressed as:
Dv,a (m2/s) [26] and μg (Pa.s) [27] can be written as:
2.3. Initial and Boundary Conditions
When the local factory carries out the process, the local temperature, humidity, and meteorological conditions are combined to make a range of processing conditions and parameters. The initial moisture content of the heaped tobacco strips is 8.5%, the temperature is 40 °C, the initial vapor mass fraction ωv is 0.85, and the initial pressure is the atmospheric pressure.
where cl(t=0) indicates the initial concentration of the liquid phase (kg/m3).
The pressure at the boundary of the environment is equal to the environmental pressure Pamb, and thus, the boundary conditions for the liquid phase and gas phase can be written as:
where hmv indicates the mass transfer coefficient (m/s), 0.079 (m/s); pv,a indicates the ambient air and vapor pressure (Pa); indicates the liquid-phase flux; and indicates the vapor flux.
The convection and condensation heat boundary conditions are expressed as:
where qsurf indicates the surface heat (J), hT indicates the heat transfer coefficient (W/m2/K), and hfg indicates the latent heat of evaporation (J/kg).
The dependence of the effective moisture diffusivity on the temperature is usually described by an Arrhenius equation [28]:
where D0 indicates the pre-exponential factor (m2/s) of the Arrhenius equation and Ea indicates the activation energy (kJ/mol).
2.4. Model Solution
The mathematical model is solved using the finite element method (FEM) in COMSOL Multiphysics software. The meshing of the heaped tobacco strips consists of free tetrahedral cells. The modules of the turbulence flow, heat transfer in fluids, and transport of the diluted species are adopted to solve the energy and mass equations. The MUMPS solver is used to find the moisture, where the total simulation time is 50 s, and the time step is 5 s. The grid convergence index method [29] is used to evaluate the mesh independently. The GCI of three grids is calculated based on the moisture content after 50 s, as shown in Table 2. It can be seen from Table 2 that both GCI12 and GCI23 are less than 5%, and the asymptotic range α is approximately 1. This indicates that the solution is independent of the grid size. Next, Grid2 is used to solve the model (Figure 3).

Table 2.
Grid-independent validation.
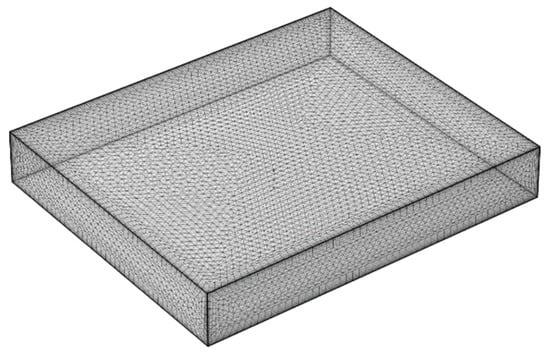
Figure 3.
The grid of the heaped tobacco strips.
3. Experimental Verification of the Moisture Content
The experimental material used was Yuxi tobacco strips with a density of 280 kg/m3 [8], which were sampled and placed in a sealed bag. The initial moisture content of heaped tobacco strips was calculated to be 8.5% by using the weight method [30] after drying at 105 °C. The experimental equipment includes a scaled-down rewet box (0.39 m × 0.44 m × 0.7 m), some net baskets (0.08 m × 0.08 m × 0.1 m), a temperature-controlled steamer, an electronic balance, a ruler, and a temperature and relative humidity meter. The experimental rewetting box is shown in Figure 4, and the rewetting conditions are a relative humidity of 85% and temperature of 55 °C. The tobacco strips in their initial state were put into the rewetting box, and the quality change in the tobacco strips was recorded every 15 s from 0 s to 150 s. The moisture content increment is calculated according to Equation (21).
where W is the moisture content increment, mi,1 is the mass of tobacco strips before the i-th group of rewetting (kg), and mi,2 is the mass of the tobacco strips after the i-th group of rewetting (kg).
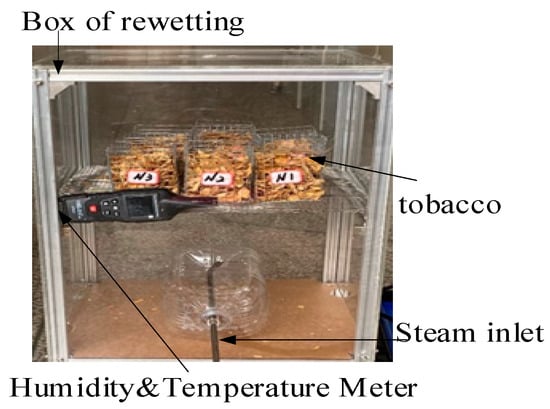
Figure 4.
The experimental rewetting box.
The results of the moisture content simulations and experimental tests are shown in Figure 5. It can be seen that the test results are lower than the simulation results until about 120 s because the box absorbs the heat, causing some steam touching the box to condense and resulting in partial energy and mass loss. On the other hand, the tobacco strips are briefly exposed to dry air during the weighing, causing a small amount of moisture to evaporate. The maximum relative error of moisture content between the simulated and measured values of the heaped tobacco strips is 11.39%, which is within the allowable error range of the experiment. The results showed that the tobacco rewetting model can describe the rewetting process of the heaped tobacco strips.
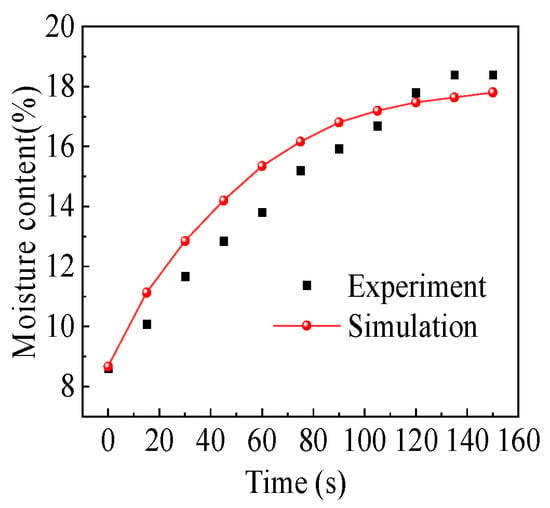
Figure 5.
The comparison of the experiment and simulation of the moisture content.
4. Results and Discussion
To analyze the effects of relative humidity and temperature on the moisture content, humidification rate, and effective moisture diffusivity on the heaped tobacco strips in the rewetting process, three sections were selected for analysis: section A in the central layer, section B vertically downward 2 cm from the central layer, and section C on the lower surface of the heaped tobacco strips.
4.1. The Effect of the Relative Humidity on Moisture Content and Humidification Rate of Tobacco Strips
Combined with the actual production process parameters of some cigarette factories, the rewetting conditions were selected as a relative humidity of 85% and temperature of 55 °C. Under this condition, the distribution and variation of the heaped tobacco strips’ overall moisture content are shown in Figure 6. The time interval in Figure 6a–c is the same, and the real-time moisture content of tobacco strips from three-dimensional and lateral perspectives are shown. At 1 s, in Figure 6a, the forced convection occurs in the rewetting box, and the vapor migrates through the forced convection to condense on the lower surface of the heaped tobacco strips, increasing the surface moisture content of the heaped tobacco strips. At 25 s, in Figure 6b, the surface moisture content is higher than the interior, and is transferred to the interior by diffusion. It is also seen that the moisture distribution is uneven in the same section, and the moisture content of the lower surface’s central area is lower than the boundary because the vapor dispersed around the tobacco strips when it met them. At 50 s, in Figure 6c, the moisture distribution and transfer trend are similar to that in Figure 6b, which spread from the bottom and side boundaries to the center and top. The overall moisture content was significant, reaching 11–13%, and meeting the production requirements of moisture content.
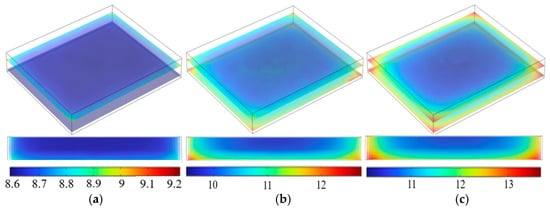
Figure 6.
Schematic diagram of the rewetting process (the values in the figure represent the moisture content, unit: %). (a) The moisture content and distribution of tobacco strips at 1 s; (b) the moisture content and distribution of tobacco strips at 25 s; (c) the moisture content and distribution of tobacco strips at 50 s.
Based on Figure 6, the moisture content changes in the heaped tobacco strip sections A, B, and C under different relative humidity conditions are analyzed when the temperature is 55 °C, as shown in Figure 7. At three relative humidities, the trend of moisture content of each section is the same, which includes two stages of the accelerating increase stage and the approximate constant rate increase stage. The accelerated increase stage is 0 s to 10 s, where the moisture content of all sections increases rapidly and the increments are large. The approximate constant rate increase stage is 10 s to 50 s, where the moisture content of all sections increases slowly and the increments remain stable. The reason for two stages is that the gas-phase condensation increases first, and then decreases gradually. It is also for this reason that there is always a moisture gradient that increases rapidly first, and then slows down to a stable level in all sections of the tobacco strips, which also indicates that moisture has been transmitted within the tobacco strips in the form of diffusion during this period. From Figure 7, it can be seen that, at the same time as that of the same relative humidity, the moisture content of section C is higher and faster than that of sections A and B; this is followed by section B, and finally, section A. This is because section C makes contact with the vapor first, and it is stable and sufficient. A large amount of vapor condenses at section C first, whereas section A is in the geometric center of the heaped tobacco strips, and the reactions here lag behind the other sections. Figure 7 also shows that the moisture content increment and growth rate of the three sections are also different with different relative humidity levels. The higher the relative humidity, the higher the increment and growth rate of the moisture content at each section, which indicates that relative humidity has a greater effect on the moisture content of tobacco strips.
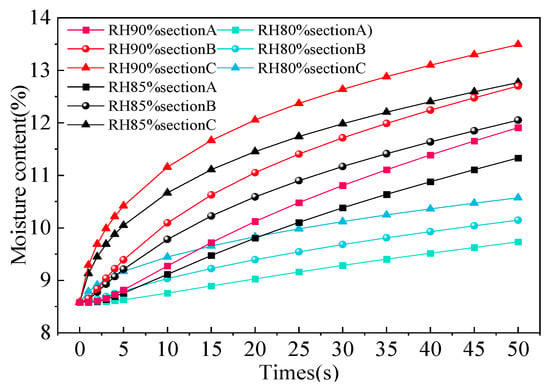
Figure 7.
The moisture content changes of heaped tobacco strips.
Based on the moisture content variation of the tobacco strips (Figure 7), the humidification rate curves of tobacco strips when the rewetting temperature was at 55 °C and the relative humidity was 80%, 85%, and 90% were analyzed, as shown in Figure 8. It can be seen that the change in the humidification rate can be divided into two stages, the accelerated stage and slowed down stage. The reason for this is that the condensation rate of the gas phase increases at the beginning, the moisture content of the tobacco strips increases rapidly, and the partial pressure of the surface vapor increases, causing less vapor transfer to the surface of the tobacco strips [4]. The accelerated stage is divided into two stages, the acceleration reduction process and the acceleration increase process. Section B and section C are the accelerated reduction processes, and section A is the accelerated increase process. Section C is first exposed to the vapor and then condensed on the surface, whereas section A is located in the center of the heaped tobacco strips. At higher temperatures, the gas-phase diffusion is fast, as it enters the inside of tobacco strips first, and then liquid condenses on the surface. When the moisture content increases, it enters a slowed down stage, where the moisture content of the heaped tobacco strips gradually approaches the equilibrium moisture content and the humidifying rate slowly reduces. It can also be seen in Figure 8 that the higher the relative humidity, the greater the change in the humidification rate. For example, when the relative humidity is 90%, the humidification rate and change in each section are significantly greater than in the other two relative humidity cases, followed by 85%, and finally, 80%, where the humidification rate is the lowest and the lift change is the slowest. The above indicates that relative humidity has a large effect on the humidification rate.
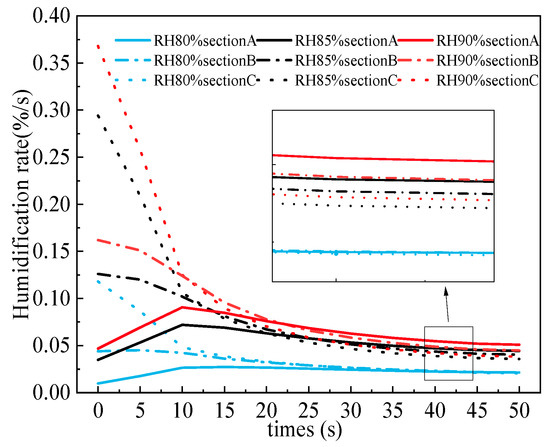
Figure 8.
The effect of different relative humidity levels on humidification rate.
4.2. The Effect of Relative Humidity on Moisture Content and Humidification Rate of Tobacco Strips
The distribution and trend of tobacco strips’ temperature under the conditions of the relative humidity of 85% and temperature of 55 °C are shown in Figure 9. The time interval is the same in Figure 9a–c, which shows the real-time temperature change and distribution of tobacco strips from the three-dimensional and lateral perspectives, respectively. The initial temperature of tobacco strips was uniform. At 1 s, in Figure 9a, the lower surface temperature of tobacco strips increased rapidly and was the highest at the edge, and a large temperature gradient began to appear in the tobacco strips, with the highest temperature being on the lower surface and the lowest on the upper surface. The reason for this is that the gas phase with a higher temperature touches the lower surface of the tobacco strips first through the external forced convection, and then disperses towards the edges. At 25 s, in Figure 9b, the temperature distribution was uneven, but the temperatures of the upper and lower surfaces were close to each other due to the gas phase blowing around tobacco strips and bringing heat to the upper surface. In addition, the temperature conduction from the surroundings to the inside is more pronounced compared to Figure 9a. At 50 s, in Figure 9c, the temperature distribution and transfer trend are similar to Figure 9b, and because the vapor is stable and sufficient, there is still a high external temperature and a low internal temperature. However, the overall temperature is close to the gas-phase temperature, and the temperature difference between the inside and outside has been reduced to 1.5 °C, which meets the requirements of temperature regulation in production and can be seen as a uniform temperature.

Figure 9.
The temperature distribution. (The values in the figure represent temperature, unit: °C) (a) The temperature distribution of tobacco strips at 1 s; (b) the temperature distribution of tobacco strips at 25 s; (c) the temperature distribution of tobacco strips at 50 s.
Using the variation and distribution of temperature in Figure 9, the effect of temperature variation on the moisture content and humidification rate of tobacco strips can be analyzed more clearly. When the relative humidity is 85% under different temperatures, the change in the moisture content of sections A, B, and C is shown in Figure 10. This is similar to Figure 7, where there are two stages, the accelerated rise stage and the approximate constant rate increase stage; 0 s to 10 s is the accelerated rise stage, and 10 s to 50 s is the approximate constant rate increase stage. The higher the temperature, the higher the increment and the rate of the moisture content increase in each section. To explain the result, the relationship between temperature and moisture has to be analyzed. For example, at 60 °C, the moisture content of tobacco strips is close to 14%, which is much higher than the moisture content at other temperatures. One reason is the diffusion of the gas phase into the interior after condensation on the surface; on the other hand, a higher temperature (seen in Figure 9) can increase the activity of moisture molecules. The gas phase entered the interior of tobacco strips more easily and later condensed into the liquid phase inside the tobacco strips, causing a higher incremental moisture content and the rate of increase. These findings indicate that the moisture content of tobacco strips is strongly influenced by temperature.
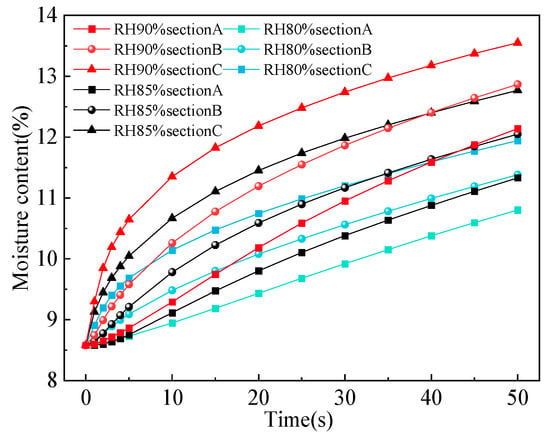
Figure 10.
The moisture content changes in heaped tobacco strips.
Based on the variation in the tobacco temperature and moisture content, the humidification rate curves of tobacco strips at the relative humidity of 85% and temperatures of 50 °C, 55 °C, and 60 °C were analyzed, as shown in Figure 11. The effect of different temperatures on the humidification rate is similar to that seen in Figure 8 of Section 4.1 and will not be repeated here. Figure 11 shows that the higher the temperature, the greater the humidification rate, and the faster the change in the tobacco strips. When the relative humidity is the same, the higher the temperature, the greater the activity of the moisture molecules, and the greater the amount of moisture that condenses on the surface and inside, which reflects the greater impact of temperature on the humidification rate.
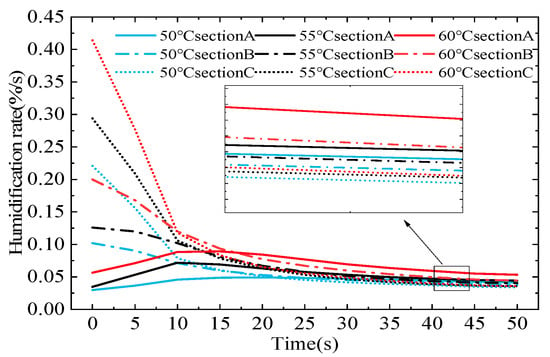
Figure 11.
The effect of different temperatures on the humidification rate.
4.3. The Effective Moisture Diffusivity (Deff) and Activation Energy (Ea)
The moisture content is an important indicator of rewetting [4], and it changes mainly through diffusion in the heaped tobacco strips. The moisture diffusivity is related to the changes in structure, temperature, and moisture content. The moisture diffusivity properties can be explained by Fick’s second law of diffusion [31]:
where Deff indicates the effective moisture diffusivity in tobacco strips (m2/s), and x indicates the tobacco strips’ distance from the border to the center (m).
The trend of effective moisture diffusivity with the moisture content under different temperature conditions is shown in Figure 12. Figure 12a,b shows the effective moisture diffusivity on the surface and inside the heaped tobacco strips, respectively. This coefficient increases rapidly with the increase in moisture content, and then, due to the reduction in the temperature difference and concentration difference, it tends to be flat. The higher the temperature, the greater the variation in the effective moisture diffusivity, which indicates that both relative humidity and temperature have a greater influence on the effective moisture diffusivity. Additionally, the Deff in this study is higher than Li [32]. There are two reasons: (1) The Deff is affected by temperature. The higher the temperature, the higher the moisture molecular activity making the effective moisture diffusivity higher, which is consistent with the studies of Chen [33] and S Rafiee [28]. (2) The effective moisture diffusivity is also related to the velocity of flow. When the gas-phase velocity is high, it increases the mass transfer coefficient and accelerates the effective moisture diffusivity to the interior.

Figure 12.
The variation in effective moisture diffusivity with moisture content at different temperatures. (a) The heaped tobacco strips’ surface; (b) the heaped tobacco strips’ interior.
In other fields, the influence of temperature on effective moisture diffusivity has been studied [34,35]. The logarithm was taken based on Equation (20), and written as Equation (23):
lnDeff and 1/T were used for plotting, and a line was obtained by fitting, as shown in Figure 13. The activation energies of the tobacco strips’ surface and middle were 37.86 kJ/mol and 37.15 kJ/mol, respectively. The activation energy of the surface was slightly higher than that of the interior, which indicated that the effective moisture diffusivity increased faster on the surface than in the interior at the same temperature.
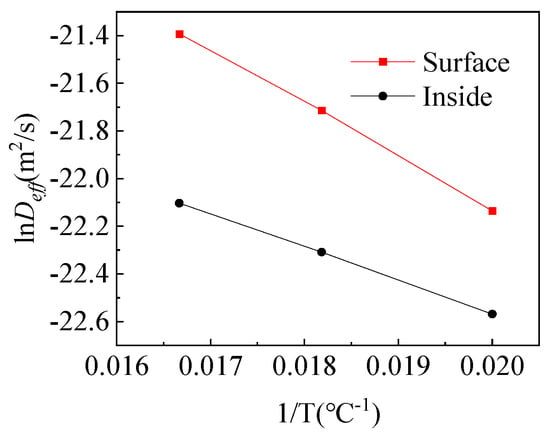
Figure 13.
The effect of temperature on the effective moisture diffusivity on the surface and inside.
5. Conclusions
In this study, the conjugate heat and mass transfer model of tobacco rewetting was established by using a numerical simulation method, and the effects of relative humidity and temperature on the moisture content, the moisture humidification rate, the effective moisture diffusivity, and the activation energy of heaped tobacco strips were analyzed.
- The rewetting of heaped tobacco strips during the redrying stage includes two stages, the accelerating stage and approximate constant rate stage. The vapor mainly condensates in the accelerated stage, which is characterized by fast growth and a large increment of moisture content. The diffusivity of the liquid phase mainly occurs in the approximate constant rate stage, which is characterized by the slow growth of the moisture content and stable increments.
- The relative humidity and temperature have a great influence on the rewetting characteristics of heaped tobacco strips. The higher the relative humidity and temperature, the higher the moisture content of heaped tobacco strips, and the greater the increment and the faster the humidification rate. The best conditions for rewetting tobacco strips are a relative humidity of 85% and a temperature of 55 °C. This maintains the moisture content in the range from 11 to 13 percent.
- An effective moisture diffusivity is greatly influenced by the relative humidity and temperature, showing a changing law of rapid increase and then stable increase. The higher the relative humidity and temperature, the greater the variation, and the faster the rate of increase. At the same time, the effective moisture diffusivity of the heaped tobacco strips’ surface is more sensitive than the interior.
Author Contributions
Conceptualization, H.W. and L.W.; methodology, H.W., L.W. and W.J.; software, W.J., Q.W. and H.W.; validation, H.W., W.J., Q.W. and H.Z.; formal analysis, H.W., W.J. and H.Z.; investigation, H.W.; resources, L.W. and Q.W.; data curation, H.W.; writing—original draft preparation, H.W.; writing—review and editing, L.W. and W.J.; supervision, L.W.; project administration and funding acquisition, L.W. All authors have read and agreed to the published version of the manuscript.
Funding
This research was funded by the Major Science and Technology Special Project of Yunnan Province of China, grant number 202002AD080001.
Institutional Review Board Statement
Not applicable.
Informed Consent Statement
Not applicable.
Data Availability Statement
Not applicable.
Conflicts of Interest
The authors declare no conflict of interest.
References
- Shi, Y. Control and Application of BP Neural Network Based on Rewetting Zone in Tobacco Redrying Oven. Master’s Thesis, Yunnan University, Kunming, China, 2015. [Google Scholar]
- Hu, K. Technique and Equipment in Tobacco Threshing and Redrying, 1st ed.; Chemical Industry Press: Beijing, China, 2002; pp. 91–94. [Google Scholar]
- Zhao, C. Research on the Influence of Threshing and Redrying Technology on the Processing Quality of Tobacco Leaves. Master’s Thesis, Kunming University of Science and Technology, Kunming, China, 2020. [Google Scholar]
- Huang, J. Tobacco Industry Handbook, 1st ed.; Guangdong Economy Publishing House: Guangzhou, China, 1999; pp. 547–551. [Google Scholar]
- Chen, C.; Zhang, F.; Cao, D. Optimization of moisture regain process parameters in tobacco leaf redryer. Manuf. Autom. 2015, 37, 111–114. [Google Scholar]
- Hu, Y.; Xu, L.; Zhang, W.; Peng, L.; Zhang, W. Study on the hydroscopic characteristics of flie-cured tobacco from Yunnan. Tob. Sci. Technol. 2000, 9, 8–12. [Google Scholar]
- Zhang, Y. Reducing breakage rate of strips during redrying. Tob. Sci. Technol. 2009, 4, 21–24. [Google Scholar]
- Jiang, W.; Wang, L.; Tang, J.; Yin, Y.; Zhang, H.; Jia, T.; Qin, J.; Wang, H.; Wei, Q. Calibration and Experimental Validation of Contact Parameters in a Discrete Element Model for Tobacco Strips. Processes 2022, 10, 998. [Google Scholar] [CrossRef]
- Dai, Y.; Shen, Y.; Xia, F.; Peng, L. Design of moistening system in reordering section in strip redryer. Tob. Sci. Technol. 2019, 52, 115–120. [Google Scholar]
- Liu, Y.; Zhang, Y.; Liu, Y.; Pang, X.; Huang, K.; Dai, X.; Pang, T. Analysis of influencing factors on threshing and redrying strips yield. J. Anhui Agric. Sci. 2021, 49, 185–188. [Google Scholar]
- Fu, L.; Ren, Z. Application of novel dual control strategy in tobacco re-drying process. Control. Eng. China 2014, 21, 100–103, 106. [Google Scholar]
- Wang, W.; Feng, X.; Fan, Z.; Ma, Y.; Chen, H.; Ren, Z. Design and application of control strategy for moisture content in redried tobacco strips packed in cases. Tob. Sci. Technol. 2020, 53, 103–107, 112. [Google Scholar]
- Ji, J.; Zhu, Y.; Wang, J.; Zhang, H.; He, Z. Experimental study on optimization design of tobacco moisture regain machine based on thermodynamics. J. Agric. Mech. Res. 2019, 41, 34–39. [Google Scholar]
- Zhao, Y.; Zhang, G.; Cao, W.; You, X.; Factory, T.C. Optimization design of exhaust hood in tunnel type tobacco conditioner. Tob. Sci. Technol. 2016, 49, 87–92. [Google Scholar]
- Tang, J.; Tang, L.; Wen, L.; He, B.; Lin, W.; Zeng, Z.; Ma, N.; Zhou, B. Construction and prediction of Bayesian network model of relationship between process parameters and discharge quality in loosening and conditioning. Food Mach. 2020, 36, 207–210. [Google Scholar]
- Xu, M.; Gong, J.; Jin, W.; Sun, K.; Zhu, J.; Wu, X.; Zhang, M.; Zheng, C.; Lin, B.; Zhu, X.; et al. Modification of conditioning cylinder for expanded tobacco based on fluent simulation. Tob. Sci. Technol. 2021, 54, 107–112. [Google Scholar]
- Qin, J.; Wang, L.; Jiang, W.; Wang, J.; Jia, T. Simulation analysis of tobacco leaf redrying and drying process based on COMSOL. Food Mach. 2021, 37, 136–141. [Google Scholar]
- Bejan, A. Convection Heat Transfer, 4th ed.; John Wiley & Sons: Hoboken, NJ, USA, 2013; pp. 633–636. [Google Scholar]
- Datta, A.K. Porous media approaches to studying simultaneous heat and mass transfer in food processes. I: Problem formulations. J. Food Eng. 2007, 80, 80–95. [Google Scholar] [CrossRef]
- Alberghini, M.; Boriskina, S.V.; Asinari, P.; Fasano, M. Characterisation and modelling of water wicking and evaporation in capillary porous media for passive and energy-efficient applications. Appl. Therm. Eng. 2022, 208, 118159. [Google Scholar] [CrossRef]
- Nordlund, M.; Michaud, V. Dynamic saturation curve measurement for resin flow in glass fibre reinforcement. Compos. Part A Appl. Sci. Manuf. 2012, 43, 333–343. [Google Scholar] [CrossRef]
- Van Genuchten, M.T. A closed-form equation for predicting the hydraulic conductivity of unsaturated soils. Soil Sci. Soc. Am. J. 1980, 44, 892–898. [Google Scholar] [CrossRef]
- Ni, H.; Datta, A.K.; Torrance, K. Moisture transport in intensive microwave heating of biomaterials: A multiphase porous media model. Int. J. Heat Mass Transf. 1999, 42, 1501–1512. [Google Scholar] [CrossRef]
- Cengel, Y.A.; Boles, M.A. Thermodynamics: An Engineering Approach, 8th ed.; McGraw-Hill Education: New York, NY, USA, 2009; p. 898. [Google Scholar]
- Halder, A.; Dhall, A.; Datta, A.K. Modeling transport in porous media with phase change: Applications to food processing. J. Heat Transf. 2011, 133, 031010. [Google Scholar] [CrossRef]
- Datta, A.K. Porous media approaches to studying simultaneous heat and mass transfer in food processes. II: Property data and representative results. J. Food Eng. 2007, 80, 96–110. [Google Scholar] [CrossRef]
- Gulati, T.; Datta, A.K. Enabling computer-aided food process engineering: Property estimation equations for transport phenomena-based models. J. Food Eng. 2013, 116, 483–504. [Google Scholar] [CrossRef]
- Rafiee, S.; Sharifi, M.; Keyhani, A.; Omid, M.; Jafari, A.; Mohtasebi, S.S.; Mobli, H. Modeling effective moisture diffusivity of orange slice (Thompson Cv.). Int. J. Food Prop. 2010, 13, 32–40. [Google Scholar] [CrossRef]
- Roache, P.J. Quantification of uncertainty in computational fluid dynamics. Annu. Rev. Fluid Mech. 1997, 29, 123–160. [Google Scholar] [CrossRef]
- Zhang, L.; Xu, Z.; Xia, L.; Ma, Z. Optimization of the hot-air drying technical parameters for ginkgo fruit based on response surface methodology. Trans. Chin. Soc. Agric. Mach. 2012, 43, 140–145. [Google Scholar]
- Ghazanfari, A.; Emami, S.; Tabil, L.G.; Panigrahi, S. Thin-layer drying of flax fiber: II. Modeling drying process using semi-theoretical and empirical models. Dry. Technol. 2006, 24, 1637–1642. [Google Scholar] [CrossRef]
- Li, S.; Fu, Z.; Hu, R.; Shi, W.Q.; Cheng, X.Q.; Xiao, R.G.; Ling, P.; Fan, H.E.; Jian, B. Moisture change of tobacco leaves during curing and establishment of drying mathematical model. J. South. Agric. 2018, 49, 121–129. [Google Scholar]
- Chen, X.D. Moisture diffusivity in food and biological materials. Dry. Technol. 2007, 25, 1203–1213. [Google Scholar] [CrossRef]
- Doymaz, İ. Drying of green bean and okra under solar energy. Chem. Ind. Chem. Eng. Q./CICEQ 2011, 17, 199–205. [Google Scholar] [CrossRef]
- Shen, F.; Peng, L.; Zhang, Y.; Wu, J.; Zhang, X.; Yang, G.; Peng, H.; Qi, H.; Deng, S. Thin-layer drying kinetics and quality changes of sweet sorghum stalk for ethanol production as affected by drying temperature. Ind. Crops Prod. 2011, 34, 1588–1594. [Google Scholar] [CrossRef]
Publisher’s Note: MDPI stays neutral with regard to jurisdictional claims in published maps and institutional affiliations. |
© 2022 by the authors. Licensee MDPI, Basel, Switzerland. This article is an open access article distributed under the terms and conditions of the Creative Commons Attribution (CC BY) license (https://creativecommons.org/licenses/by/4.0/).