Article

Assessment of Cranial Deformation Indices by Automatic Smartphone-Based Photogrammetric Modelling

Department of Cartographic Engineering, Geodesy and Photogrammetry, Universitat Politècnica de València, Camino de Vera s/n, 46022 Valencia, Spain
*
Author to whom correspondence should be addressed.
Appl. Sci. 2022, 12(22), 11499; https://doi.org/10.3390/app122211499
Submission received: 26 September 2022 / Revised: 28 October 2022 / Accepted: 10 November 2022 / Published: 12 November 2022
(This article belongs to the Special Issue Image and Signal Processing in Biomedical Engineering)

Abstract

:
This paper presents research carried out to assess the accuracy of a fully automatic smartphone-based photogrammetric solution (PhotoMeDAS) to obtain a cranial diagnostic based on the 3D head model. The rigorous propagation of the coordinate measurement uncertainty to the infant’s derived cranial deformation indices is demonstrated. The cranial anthropometric parameters and cranial deformation indices that PhotoMeDAS calculates automatically were analysed based on the estimated accuracy and uncertainty. To obtain both accuracy and uncertainty, a dummy head was measured 54 times under different conditions. The same head was measured with a top-of-the-line coordinate-measuring machine (CMM), and the results were used as ground-truth data. It is demonstrated that the PhotoMeDAS 3D models are an average of 1.01 times bigger than the corresponding ground truth, and the uncertainties are around 1 mm. Even assuming uncertainties in the coordinates of up to 1.5 mm, the error in the derived deformation index uncertainties is around 1%. In conclusion, the PhotoMeDAS solution improves the uncertainty obtained in an ordinary paediatric consultation and can be recommended as a tool for doctors to establish an adequate medical diagnosis based on comprehensive cranial deformation indices, which is much more precise and complete than the information obtained by existing analogue devices (measuring tapes and callipers) and easier to use and less expensive than radiological imaging (CT and MRI).

1. Introduction

Cranial deformation is a relatively frequent condition treated in paediatric neurosurgery, whose most common type—deformational plagiocephaly, a flattening of an area of the head due to positional causes—affects up to 40% of infants [1,2]. Some authors have found evidence of an association between plagiocephaly and developmental delay [3,4], so accurate detection in the early stages, when an intervention may help to overcome the condition, becomes essential.
Different approaches are currently followed to evaluate cranial deformation [5,6]. They include a simple visual assessment and the use of callipers, measuring tape and flexicurves, as well as computed tomography (CT) and nuclear magnetic resonance imaging (MRI). CT and MRI are the gold standards for diagnostics, not only in terms of their accuracy (although the child’s lying position may alter the results due to positional pressure [7,8]) but also because of the information provided on the inner part of the head. However, they require extra personnel (technicians and anaesthetists) and expensive resources (CT/MRI equipment). Last but not least, ionising radiation from CT must always be minimised.
In recent times, photogrammetric solutions have been developed for the evaluation of cranial deformation. In [9], photographs taken by a professional photographer were used to test whether some types of deformities (scaphocephaly and trigonocephaly) could be objectively identified by stereophotogrammetry. In [10], the effect on skull volume changes (asymmetry indices in particular) after wearing orthosis helmets for at least 150 days was analysed by three-dimensional photogrammetry. Photogrammetric solutions have the clear advantage of producing a 3D model, where different angles and distances can be measured without subjecting the infant to a stressful medical test, but they normally require high-end 3D (laser or structured-light) scanners or photogrammetric solutions that are rarely available at the paediatrician’s office. We want to replace this instrumental requirement with the use of a standard smartphone.
Photogrammetric Medical Deformation Assessment Solutions (PhotoMeDAS, https://photomedas.eu, accessed on 9 November 2022, Universitat Politècnica de València, València, Spain), a low-cost tool, was developed for measuring and evaluating cranial deformation in infants [11,12,13]. It is composed of a coded cap fitted on the infant’s head, a smartphone application used to record the overall head cap targeting its barycenter, and a cloud-based processing system that yields the head’s 3D model with the automatic determination of deformational indices.
The repeatability of the automatic smartphone-based photogrammetric solution has been analysed in previous work [11], but an assessment of the derived 3D model accuracy and its implication for determining cranial deformation indices is still lacking due to its complexity in real-life clinical consultations with fully dynamic infants. Also lacking is the assessment of the measurement uncertainty and its propagation to the final determination of deformation indices. Overcoming these limitations constitutes the purpose of the present work.

2. Materials and Methods

The low-cost smartphone photogrammetric solution PhotoMeDAS requires a coded cap to extract the 3D points that will be used for the mesh creation, i.e., 3D modelling. For this research, the coded cap was fitted to a dummy’s head (Figure 1). The PhotoMeDAS tool uses a coordinate system where the y-axis is defined by both preauricular points, the x-axis is defined by the middle of the preauricular points and the frontal point, and the z-axis is such that a right-handed coordinate system is formed [11] (p. 270).

2.1. PhotoMeDAS Modelling

The coded cap was fixed to the dummy’s head with glue in order to prevent the labels from being accidentally moved. Fifty-four 3D models were created after taking the corresponding fifty-four recordings on different days and at various intervals around the dummy’s head with the PhotoMeDAS application using an Android smartphone with a good processor speed. To show the 3D models in the web browser and be able to interact with them, the 3D Heritage Online Presenter (3DHOP) JavaScript library has been used [14]. The 3DHOP package uses the multiresolution model format to send different resolutions to clients, i.e., web browsers, depending on their visualisation needs, reducing the data loading time; 3DHOP also has a fast configuration and useful final user tools [15]. The 54 models can be seen superimposed at https://photomedas-dev.tk/pm/show_mounted_model_files_from_url/7e8a6954-c91c-4057-83a4-2ba8843d2d88/ (accessed on 9 November 2022). In the web browser, the user can zoom, rotate, show, and hide 3D models and use the section tool to see and measure the variations between the 3D models (Figure 2). In particular, as can be seen in the zoomed-in view in Figure 2d, where the surfaces of the 54 models are displayed, there is a maximum separation of 1.8 mm between models, which can be understood as the upper limit to the current measurement dispersion.
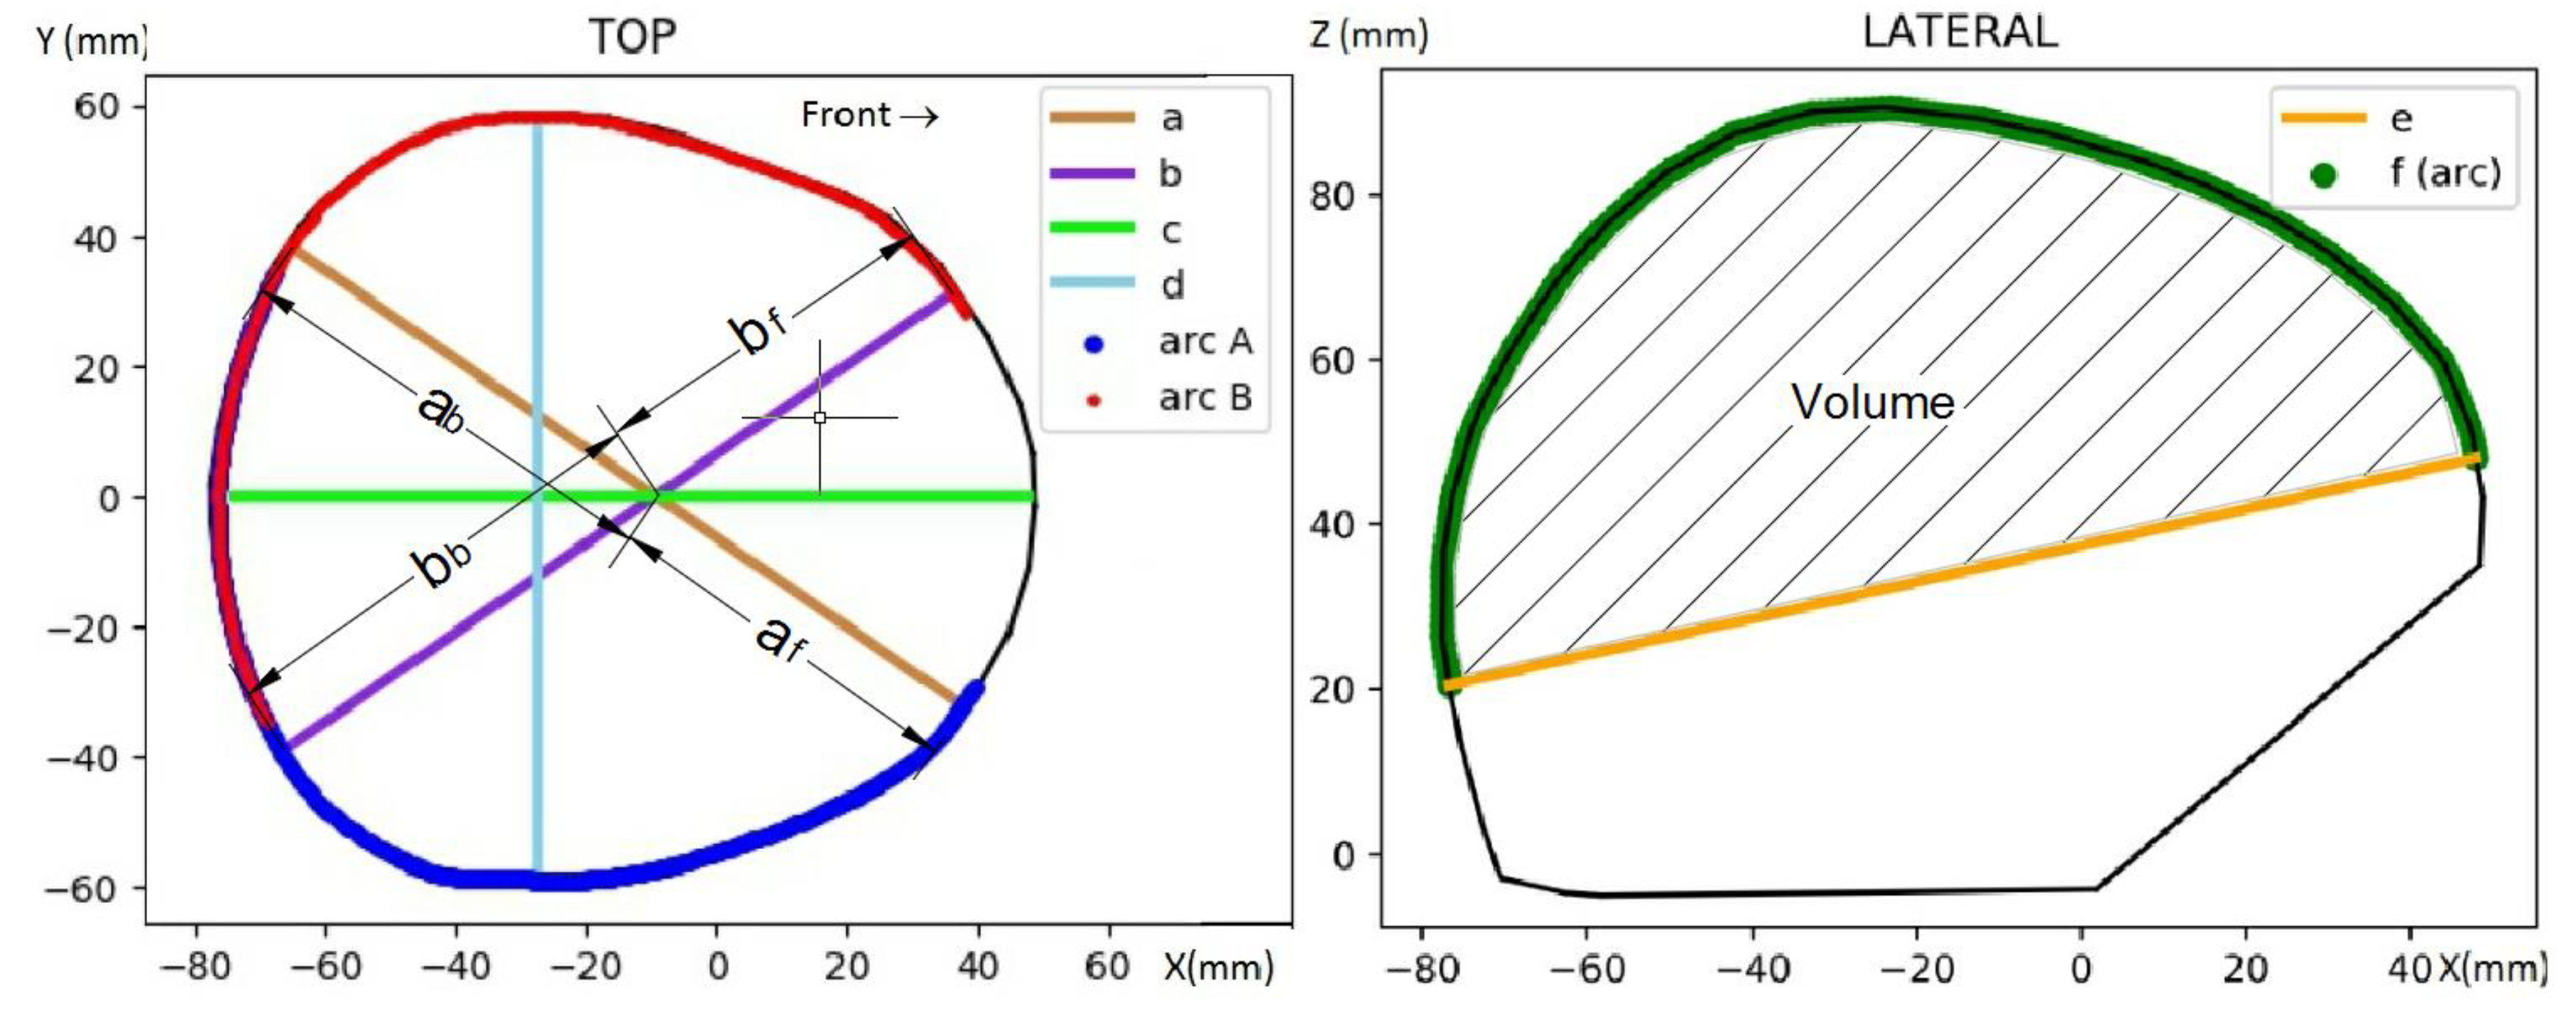
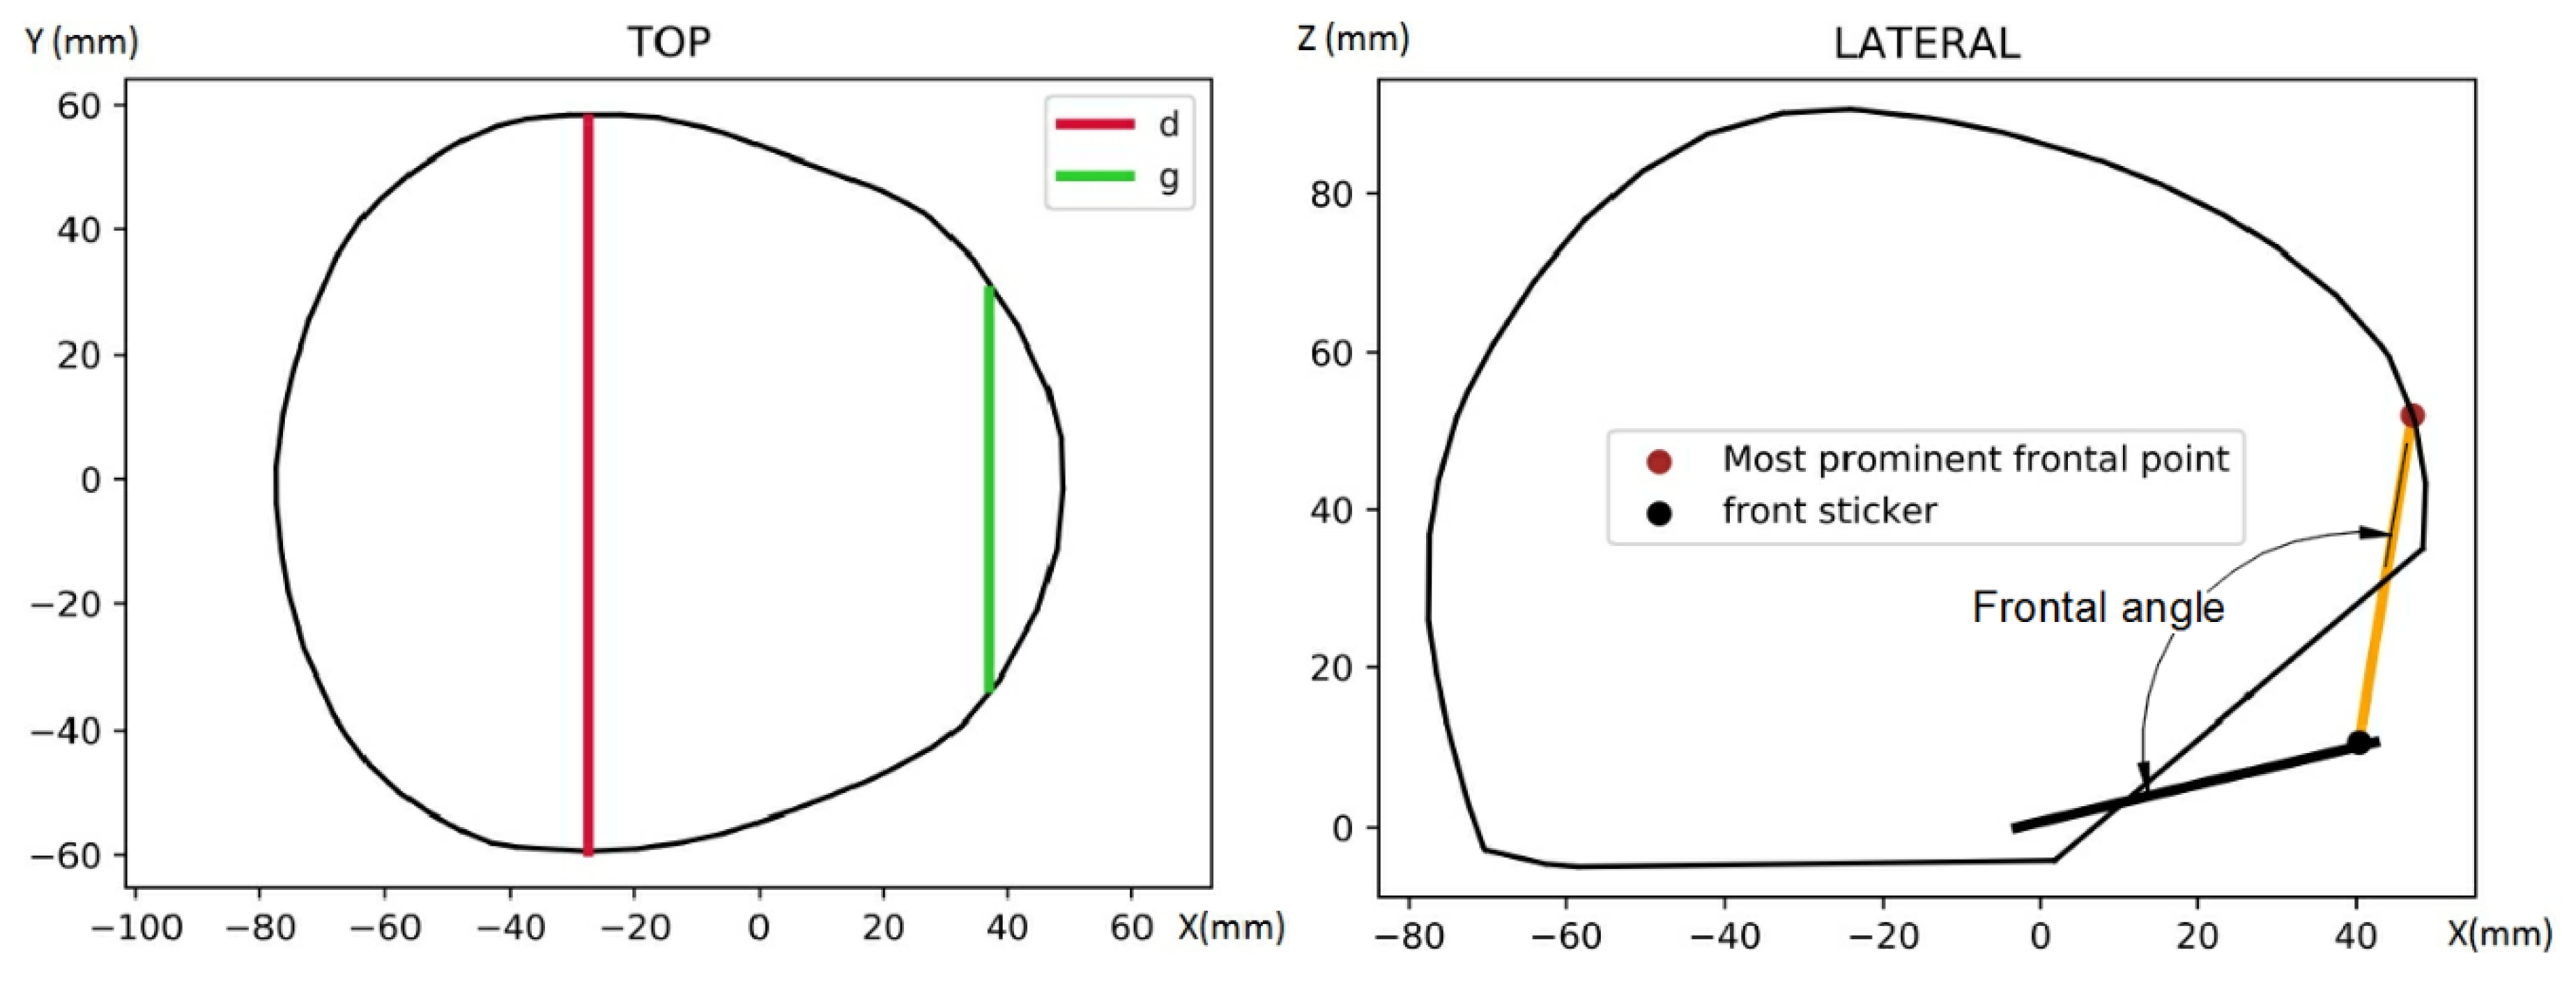
For each 3D model, the coordinates of 536 points (corners of the coded stickers of the cap) were determined and used to compute the following anthropometric parameters and cranial deformation indices, which are common in paediatric diagnostics [16,17] and whose numerical values are shown in the PhotoMeDAS report. Figure 3 and Figure 4 depict the measured values from which the parameters and indices in Table 1 were computed.

2.2. Ground Truth

An industrial computer numerical control (CNC) coordinate-measuring machine (CMM) (Mitutoyo Crysta Apex S 9106) was used to obtain the ground-truth data. The CMM has a maximum permissible error (MPE) of 1.7 μm in coordinate determination. The MPE is one of the key figures in the technical specification of a measurement system and forms the basis of the periodic verification of its performance [18]. Despite the high accuracy of the CNC CMM, the pointing accuracy, which can be estimated as 0.2 mm [19,20], is subject to the limitation of the visual perception of the human operator, who has to manually locate the pointing device on the label corners to register their coordinates (Figure 5).

2.3. Model Comparison

First, the difference between each coordinate observed with PhotoMeDAS and its homologous ground-truth coordinate obtained by the CNC CMM was calculated. There were 29241 observations on each axis.
Second, to analyse the agreement between PhotoMeDAS 3D measurements and the ground truth, a standard similarity transformation [21], that is, a set of three shifts (Tx, Ty, Tz), rotations along the three axes (Rx, Ry, Rz), and a scale factor (1 + dS), can be determined. The seven parameters determined after the similarity transformation should not be significantly different from zero to ensure that both models are statistically compatible.
In addition, Bland–Altman plots, used extensively in biomedicine to assess the agreement between two quantitative methods of measurement, have been demonstrated to perform significantly better than correlation and regression studies [22]. These plots, presented initially by Bland and Altman [23,24], provide the user with a mean difference and 95% limits of agreement for the method comparison and permit validating the new method while assessing the significance of the sample size in doing so.

2.4. Uncertainty Propagation

The comparison of the PhotoMeDAS measurements with the ground truth described in the previous subsection may provide us with the typical measurement accuracy of the PhotoMeDAS system. Then, the results of the uncertainty propagation to the anthropometric parameters and cranial indices in Equations (1)–(8) for the particular value of the measurement accuracy can be obtained as described in this subsection. This is a novel result of paramount interest since it permits quantitatively assessing the validity of the PhotoMeDAS smartphone-based automatic solution to estimate the cranial parameters and indices.
Assuming some typical uncertainties in the measurement of coordinates along each axis, σx, σy, and σz, which can be determined after the comparison with the ground truth and be regarded as statistically different or statistically equal among them (at this stage, we will not necessarily restrict the derivation to the first case), we can compute the expressions for the uncertainty propagation of these coordinate measurement uncertainties, σx, σy, and σz, throughout Equations (1)–(8). In doing so, we take into account that a tri-axial ellipsoid has been considered the ideal shape for a non-deformed cranium [13,25]. Let us denote by A, B, and C the semiaxes of the tri-axial ellipsoid along the x-, y-, and z-axes, respectively. By using this approximation, the cranial volume results in
C V = 4 3 π A B C
and the application of the uncertainty propagation law to this expression yields
σ C V = 4 3 π A B σ z 2 + A C σ y 2 + B C σ x 2
where we assume that A, B, and C, being quantities along the x-, y-, and z-axes, have the typical accuracies of their respective axis, that is, σx, σy, and σz, respectively. Similarly, the perimeter can be approximated as the perimeter of an ellipse, whose approximate expression, sufficient for the derivation of uncertainty values, is
C P = 2 π A 2 + B 2 2
The application of the uncertainty propagation law now yields
σ C P = 2 π 2 C P A σ x 2 + B σ y 2
where, again, it is assumed that the semiaxes have the typical accuracies of their respective axis, that is, σx and σy.
The Distance between Preauricular Points is easily determined in terms of the y-coordinates of both preauricular points by a simple subtraction (their x-coordinates are zero according to the definition of the coordinate system):
D P a P = y 2 y 1
The application of the uncertainty propagation law in terms of the typical accuracy of the y-coordinates, σy, results in
σ D P a P = 2 σ y
Now, as a side note, it may be worth mentioning that, just for the purpose of uncertainty estimation, some working values of A, B, and C may be obtained in terms of the estimates given in the PhotoMeDAS report (where the values of A, B, and C are not explicitly given): in particular, B can be taken as
B = D P a P 2
and A and C can be deduced from the cranial perimeter and cranial volume expressions, Equation (11) and Equation (9), respectively, as
A = 2 p 2 4 π 2 B 2
C = 3 V 4 π A B
For the maximum cranial width (d), being a measure purely dependent on y-coordinates only, the same expression as for the Distance between Preauricular Points (DPaP) (see Equations (13) and (14)) can be used, that is,
σ d = 2 σ y
The same consideration but on the x-axis can be made for the maximum longitudinal distance c:
σ c = 2 σ x
The determination of distance a involves two points whose coordinates x1, y1, x2, and y2 need to be measured:
a = x 2 x 1 2 + y 2 y 1 2
So, its corresponding uncertainty can be obtained after the application of the propagation law as
σ a = 2 x 2 x 1 a 2 σ x 2 + 2 y 2 y 1 a 2 σ y 2
or, denoting by α the angle that forms the measured line a with the x-axis, as
σ a = 2 cos 2 α σ x 2 + 2 sin 2 α σ y 2
The α angle is approximately 45°, so, just for the purpose of uncertainty estimation, this value can be introduced in the above equation, resulting in
σ a = σ x 2 + σ y 2
The same consideration can be applied to distance b, so its uncertainty can be estimated as
σ b = σ x 2 + σ y 2
Now, for the case of distances af, bf, ab, and bb, the determination of each distance involves two points but only three coordinates, because one of the y-coordinates is zero. Then,
σ a f = σ x 2 + σ y 2 2
σ b f = σ x 2 + σ y 2 2
σ a b = σ x 2 + σ y 2 2
σ b b = σ x 2 + σ y 2 2
For the asymmetry index in Equation (1),
σ A I = σ a 2 + σ b 2
and taking into account Equations (23) and (24),
σ A I = 2 σ x 2 + σ y 2
Similarly, for the front and back asymmetry indices in Equations (2) and (3), using the former Equations (25)–(28), we can write
σ A I f = 2 σ x 2 + σ y 2
σ A I b = 2 σ x 2 + σ y 2
For the Oblique Cranial Length Ratio (OCLR) in Equation (4), with the above Equations (23) and (24), we obtain
σ O C L R = σ x 2 + σ y 2 100 b 2 + 100 a b 2 2
Assuming, just for the purpose of uncertainty propagation, that arcA in Figure 2 can be approximated by half the circumference of diameter a, that is,
a r c A π a 2
and analogously for arcB and b,
a r c B π b 2
the uncertainty for Perimeter30 in Equation (5) results in
σ P e r i m e t e r 30 = π 2 σ x 2 + σ y 2
For the cephalic index (CI) in Equation (6), the propagation law, also using Equations (18) and (19), yields
σ C I = 2 100 d c 2 2 σ x 2 + 100 c 2 σ y 2
For the towering index (TI) in Equation (7), just for the purpose of uncertainty propagation, we make the analogous assumption used in Equations (34) and (35) that f can be approximated by half the circumference of diameter e, that is,
f π e 2
and that the determination of distance e involves two points whose coordinates x1, z1, x2, and z2 need to be measured:
e = x 2 x 1 2 + z 2 z 1 2
So, the uncertainty in e, similarly to the case of a in Equation (23), is
σ e = σ x 2 + σ z 2
and the propagation law for the towering index gives
σ T I = 50 π e f 2 2 + 100 f 2 σ x 2 + σ z 2
The metopic index (MI) in Equation (8) uses two distances, g and d, measured along the y-axis, so for each of them, only two y-coordinates are determined, and correspondingly, we have
σ g = 2 σ y
and the same expression, already shown in Equation (18), for σd.
Finally, the frontal angle (Figure 5) involves three points: (0,0), (x1, z1), and (x2, z2); so,
F A = a t a n x 2 x 1 z 2 z 1 a t a n x 1 z 1
and the propagation of uncertainty results in
σ F A = z 1 x 1 2 + z 2 z 1 x 2 x 1 2 + z 2 z 1 2 2 + z 2 z 1 x 2 x 1 2 + z 2 z 1 2 σ x 2 + x 1 x 1 2 + z 1 2 + x 2 x 1 x 2 x 1 2 + z 2 z 1 2 2 + x 2 x 1 x 2 x 1 2 + z 2 z 1 2 σ z 2
In the case of the Global value, i.e., mean right hemisphere minus left hemisphere, for the several hundred measured points, the errors tend to average out, and the resulting uncertainty remains dominated by the uncertainty in the definition of the coordinate axis by means of the coordinates of both preauricular points. Therefore,
σ G l o b a l = 2 σ y

3. Results

3.1. Accuracy Assessment

The degree of accuracy and repeatability of the coordinates obtained for the 54 PhotoMeDAS models can be first analysed by observing the differences in the histograms shown in Figure 6.
The average values of the differences in the x-, y-, and z-coordinates are 0.5, −0.1, and −0.6 mm, respectively, and the standard deviations are 0.86, 0.97, and 0.74 mm, which yields a standard deviation in xyz of 1.49 mm.

3.2. Three-Dimensional Transformation Assessment

The results of the accuracy assessment are presented next with and without applying a scale factor correction to the 3D imaging coordinates obtained with PhotoMeDAS.

3.2.1. Without Scale Correction

A similarity transformation was determined between the coordinates of each PhotoMeDAS model and the CNC CMM coordinates. The mean and standard deviations obtained for the three shifts, three rotations, and scale factor are presented in Table 2. A scale transformation was also computed, and the resulting values are shown in Table 2, as well.
As can be seen in Table 2, the scale factor, with a value of around 0.99, is significant; that is, the PhotoMeDAS 3D model needs to be scaled down a bit to make it compatible with the ground truth.
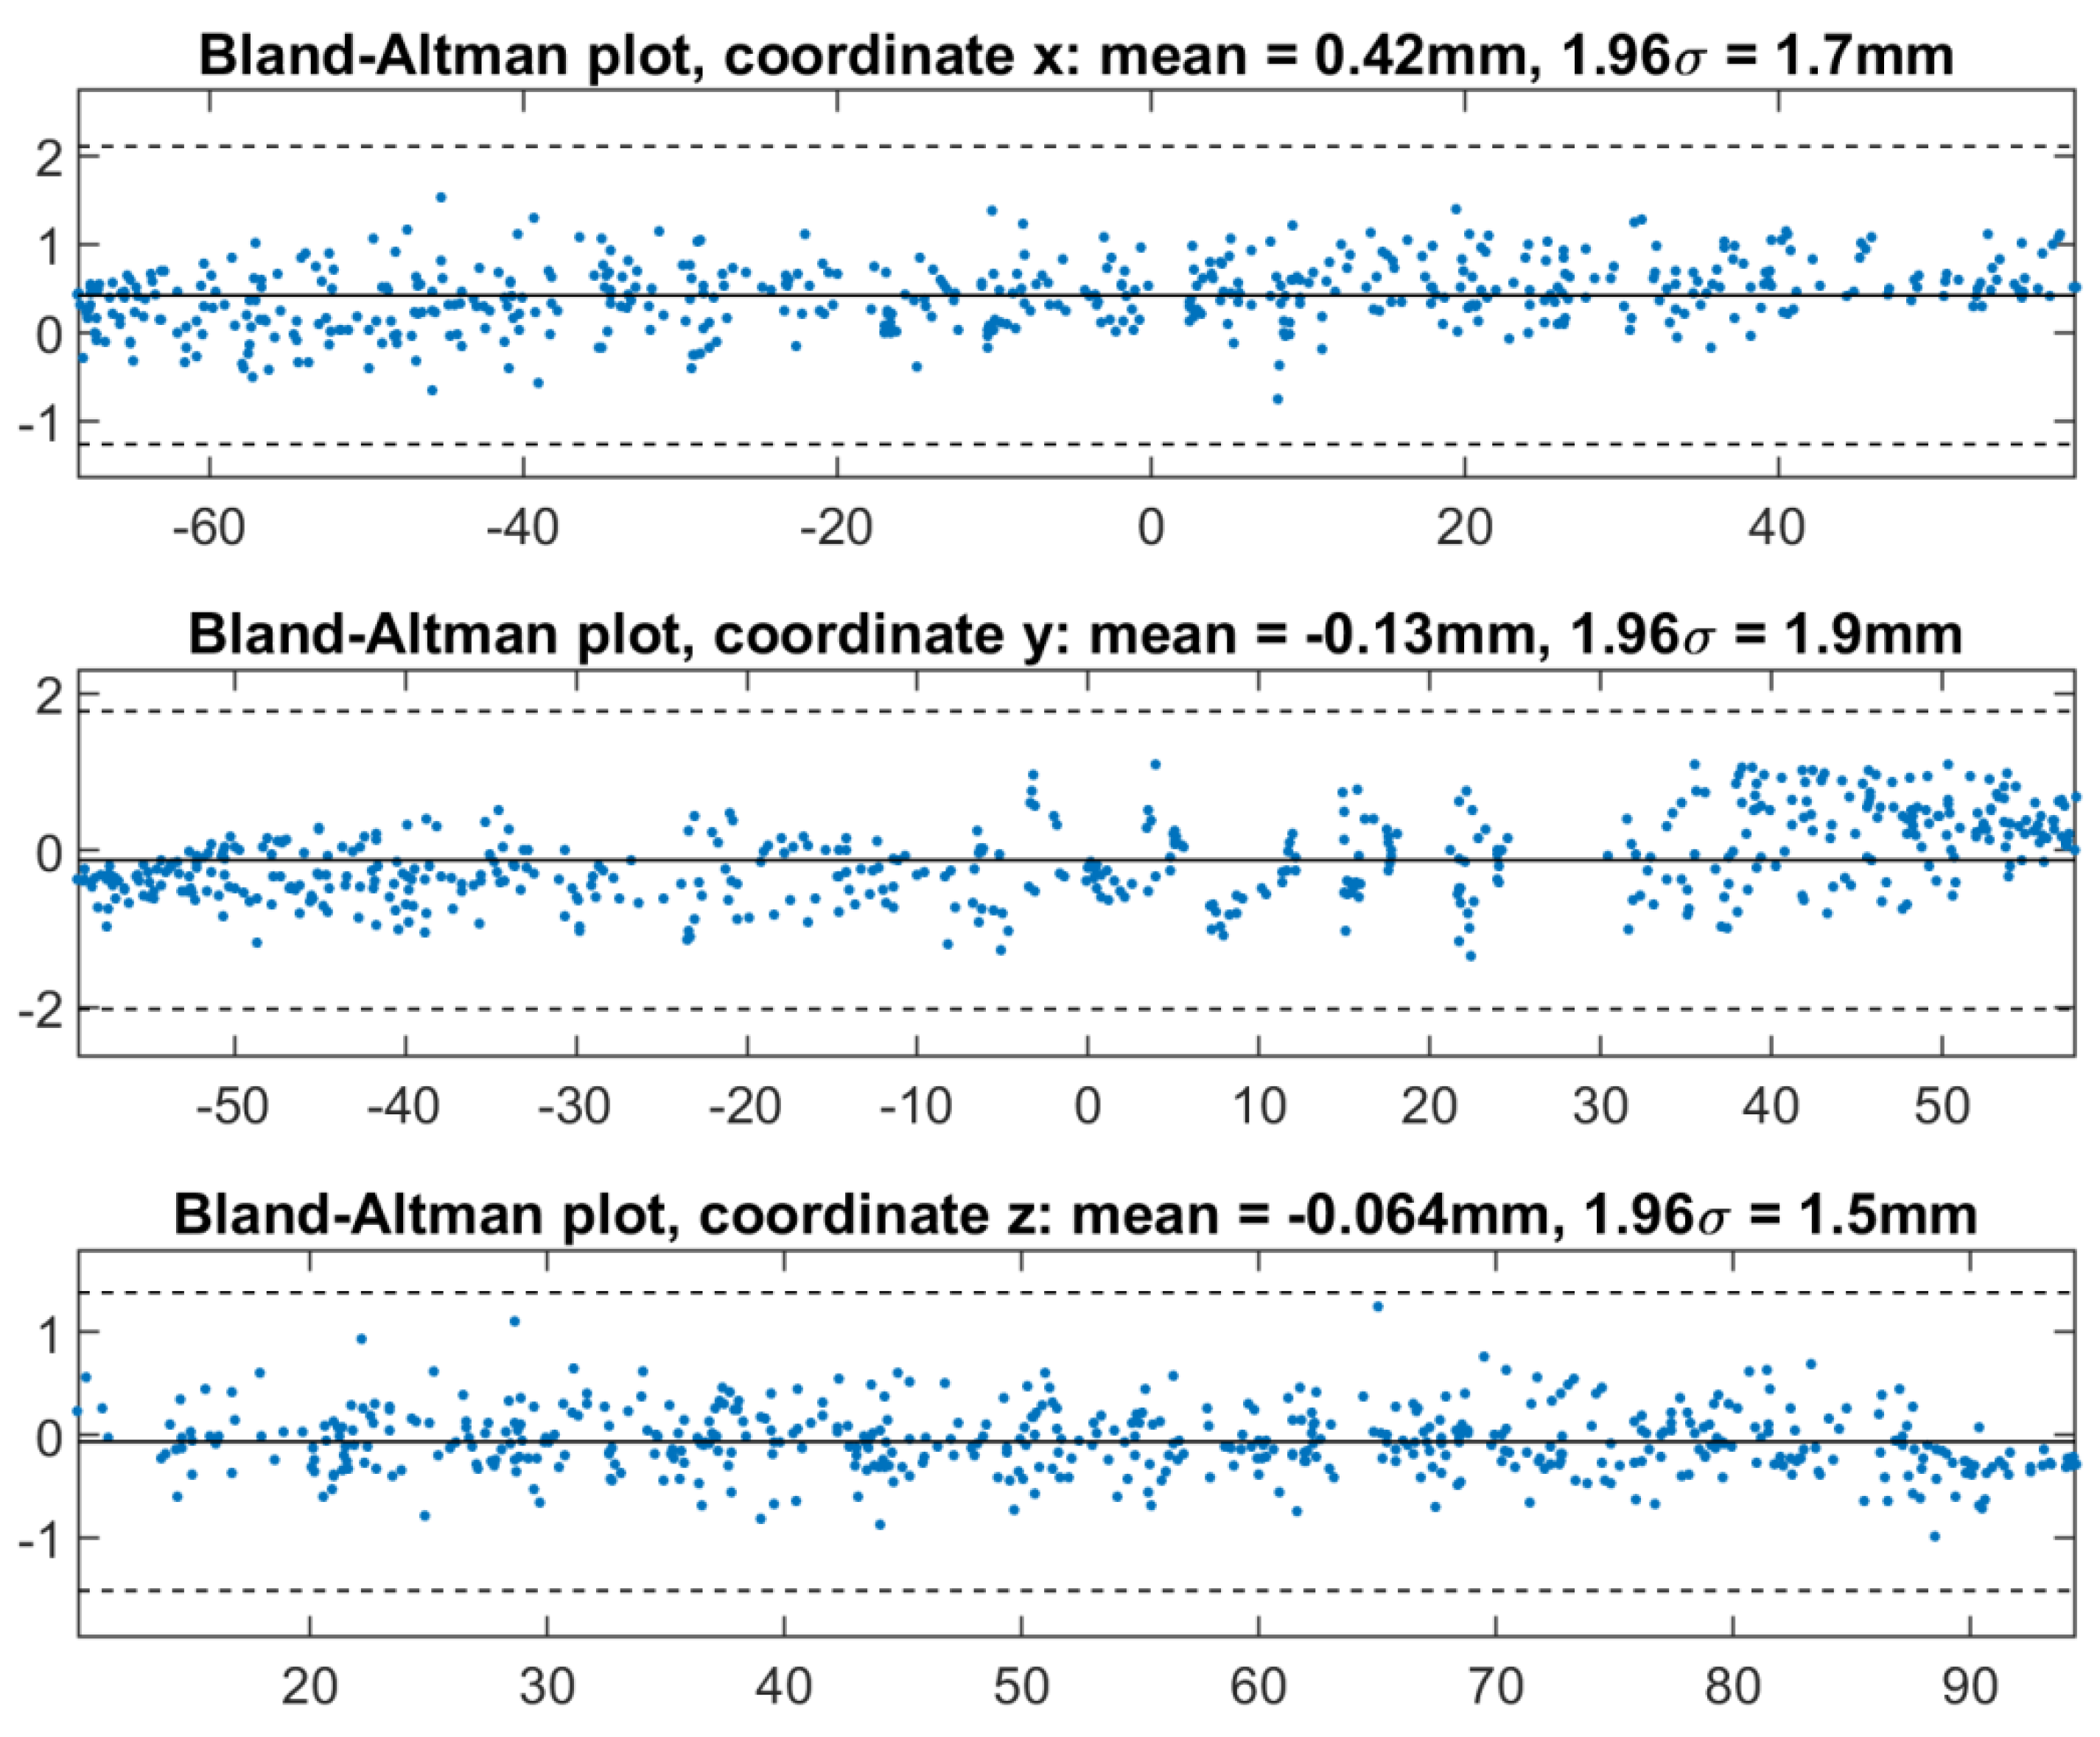
As mentioned before, the Bland–Altman plot is the best tool for comparing PhotoMeDAS and the ground truth. In our case, we have point coordinates from 54 PhotoMeDAS models, and the mean value of each of them was computed. The coordinate standard deviations were taken from the initial accuracy assessment, that is, 0.86, 0.97, and 0.74 mm, respectively. Figure 7 shows no null slopes in the Bland–Altman plots for the x-, y-, and z-coordinates, which confirms that a scale difference from unity between the PhotoMeDAS solution and the CNC CMM exists.
The PhotoMeDAS model is slightly larger than the ground truth, although this is of little importance since the results do not deteriorate by more than 1 mm. This problem of scale, which was already noted in [11] (“a general overestimation is appreciated”), impacts the infant’s head size only in the order of 1 mm (or less), since the coordinates are below 100 mm (see Figure 3 and Figure 4).
The next section presents the results after applying a scale factor correction to the PhotoMeDAS coordinates.

3.2.2. With Scale Correction

Figure 8 shows the Bland–Altman plots with the coordinates of PhotoMeDAS after scaling them with a factor of 0.99. It can be confirmed that the effect of the scale factor has been eliminated.

3.3. Uncertainty Propagation

Typical uncertainties of 0.7 to 1.0 mm were obtained for the x-, y-, and z-coordinates. It seems reasonable to consider a common number for these uncertainties (σx = σy = σz). We can now investigate how the uncertainty in the coordinates propagates to the cranial anthropometric parameters and deformation indices presented in the previous section. Table 3 shows the cranial anthropometric parameters for the head model, along with the resulting uncertainties for different accuracies in measured coordinates. To check the assumptions made in the uncertainty propagation formulas (Section 2.4), the same estimates obtained from the 54 measured models are also provided (Table 3).
It has to be noted that the cranial perimeter is determined with an equivalent uncertainty measurement accuracy of 0.5 mm, which clearly improves the uncertainty obtained in a typical clinical consultation with direct procedures (tape and calliper). Further, the pseudo-cranial volume, which is a magnitude difficult to determine by other means, is obtained with a 6% uncertainty for the worst-case scenario of a 1.5 mm measurement accuracy (that is, an uncertainty of 29 mL in 464 mL).
Table 4 shows the cranial deformation indices obtained from the head’s 3D model, along with the resulting uncertainties for different accuracies in the measured coordinates, as well as the uncertainties of the same estimates obtained from the 54 measured models. Percentages below 1% were achieved for the conventional OCLR and CI indices, similar to the MI, with the TI being just slightly higher (1.6%).

4. Discussion

Many papers can be found in the literature comparing results achieved with different solutions [5], direct calliper measures [6,17], orthogonal photography [26], CT [27], and 3D photogrammetry images [17,27,28,29,30]. They permit some general conclusions to be drawn: first, calliper measurements are a bit smaller (1–4 mm [17], around 2% [5]) than the digital photogrammetric results, possibly due to the pressure of the callipers and/or the use of skullcaps for photogrammetric solutions [17]; second, although CT yields the best solution [6], it is not recommended since the patient has to be sedated [5], and it constitutes an avoidable exposure to radiation that entails a higher risk of malignancies in later life; third, other solutions, such as orthogonal photography [6] or, better, 3D photogrammetry, since it is more flexible in terms of image acquisition (“fast, easy, and independent of the examiner” [27]) are preferred. However, to the authors’ understanding, nothing has been written about both the accuracy and uncertainty in the derived anthropometric cranial parameters and indices, which are important estimates for diagnosing cranial deformations by medical specialists such as paediatric neurosurgeons and paediatrists. Therefore, the results presented herein deepen quality estimates that should be clearly clarified by the different existing solutions available in the market, especially when dealing with infant development assessment.
After many private discussions with paediatric neurosurgeons, it has been clarified that differences up to 2 mm are meaningless during an infant’s clinical consultation, usually with uncontrolled and fully dynamic infants. Therefore, the results achieved herein with the Bland and Altman plot [23,24] guarantee the performance of the low-cost smartphone-based photogrammetric solution. PhotoMeDAS yields mean values below 0.65 mm and a deviation of up to 1.0 mm at a 95% confidence level without correcting the scale factor; if correcting the scale factor, mean values below 0.4 mm with an equal 95% confidence interval can be achieved.
From the 21 anthropometric cranial parameters and indices determined automatically by PhotoMeDAS (Table 3 and Table 4), 11 values confirm a measurement uncertainty of 0.5 mm, DPaP and d uncertainty of 0.75 mm, af and bb uncertainty of 1.0 mm, and CV, a, b, bf, and ab uncertainty of 1.5 mm. Only TI exceeds an uncertainty of 1.5 mm.
Accuracies up to 2% in indices are sufficient for a proper diagnostic [13]. Therefore, the uncertainties obtained with PhotoMeDAS for the main anthropometric cranial indices, i.e., CI, OCLR, and MI, are acceptable, even assuming minor uncertainties of 0.5 mm in the coordinates; this is also true considering uncertainties up to 1.5 mm for TI, which is clearly a safe value for both the non-scale-corrected and the scale-corrected 3D models (Figure 7 and Figure 8).

5. Conclusions

The smartphone-based PhotoMeDAS solution is a low-cost tool that allows non-experts in photogrammetry to produce 3D models of infants’ heads and automatically obtain cranial parameters and deformation indices during a typical clinical consultation. In the present research, we estimated the PhotoMeDAS measurement accuracy and uncertainty following a rigorous comparison between repeated PhotoMeDAS measurements and ground truth values determined by employing a highly accurate CNC CMM that satisfies the most rigorous industry standards. For this purpose, a dummy was measured up to 54 times to test its performance, as it is unrealistic to undertake this research during an infant’s clinical consultation. In addition to the accuracy and uncertainty estimates, we also analysed the propagation of the coordinate measurement uncertainty to the final cranial deformation indices. Furthermore, it is confirmed that the empirical tests undertaken with PhotoMeDAS satisfy the mathematical propagation estimates of the cranial anthropometric parameters and deformation indices. This is a novel contribution to state-of-the-art cranial deformation assessment and diagnosis, not only with smartphone technology but also with high-end image-based and range-based 3D imaging systems. We have concluded that an uncertainty of 1.5 mm in measurements allows users to derive cranial anthropometric parameters and deformation indices of the order of 1.6% for TI and better than 1% for OCLR, CI, and MI. Therefore, the existing smartphone-based PhotoMeDAS solution improves the uncertainty obtained in a routine paediatric consultation by up to three times and can be a recommended tool for helping doctors to make the proper medical diagnosis based on comprehensive cranial deformation indices, far beyond existing direct/analogue subjective devices with tape and callipers or high-end image-based/range-based solutions. Last but not least, PhotoMeDAS can be used to assess cranial deformation over time, minimising the need for radiological imaging services such as CT and RMI.
Future work will be undertaken to validate the results with actual clinical consultations for diagnoses, contrasting the obtained values with doctors’ clinical perceptions of diverse cranial deformations, such as deformational plagiocephaly, brachycephaly, or a combination of both, and craniosynostosis.

Author Contributions

Conceptualisation, S.B., G.M.-N. and J.L.L.; methodology, S.B., G.M.-N. and J.L.L.; software, G.M.-N. and J.L.L.; validation, S.B., G.M.-N. and J.L.L.; formal analysis, S.B., G.M.-N. and J.L.L.; investigation, S.B., G.M.-N. and J.L.L.; resources, J.L.L.; data curation, S.B., G.M.-N. and J.L.L.; writing—original draft preparation, S.B., G.M.-N. and J.L.L.; writing—review and editing, S.B., G.M.-N. and J.L.L.; visualisation, G.M.-N. and J.L.L.; supervision, J.L.L.; project administration, J.L.L.; funding acquisition, S.B., G.M.-N. and J.L.L. All authors have read and agreed to the published version of the manuscript.

Funding

This research received no external funding.

Institutional Review Board Statement

Not applicable.

Informed Consent Statement

Not applicable.

Data Availability Statement

The data presented in this study are available on request from the corresponding author.

Acknowledgments

The PhotoMeDAS team acknowledges the help of the company SODECIA (https://sodecia.com, accessed on 9 November 2022), Valencia Business Unit, who kindly measured the dummy’s coded cap with its high-accuracy CNC CMM.

Conflicts of Interest

The authors declare no conflict of interest.

References

  1. Ballardini, E.; Sisti, M.; Basaglia, N.; Benedetto, M.; Baldan, A.; Borgna-Pignatti, C.; Garani, G. Prevalence and characteristics of positional plagiocephaly in healthy full-term infants at 8–12 weeks of life. Eur. J. Pediatr. 2018, 177, 1547–1554. [Google Scholar] [CrossRef]
  2. Khormi, Y.; Chiu, M.; Goodluck Tyndall, R.; Mortenson, P.; Smith, D.; Steinbok, P. Safety and efficacy of independent allied healthcare professionals in the assessment and management of plagiocephaly patients. Child’s Nerv. Syst. 2020, 36, 373–377. [Google Scholar] [CrossRef]
  3. Martiniuk, A.L.C.; Vujovich-Dunn, C.; Park, M.; Yu, W.; Lucas, B.R. Plagiocephaly and developmental delay: A systematic review. J. Dev. Behav. Pediatr. 2017, 38, 67–78. [Google Scholar] [CrossRef]
  4. Collett, B.R.; Wallace, E.R.; Kartin, D.; Cunningham, M.L.; Speltz, M.L. Cognitive outcomes and positional plagiocephaly. Pediatrics 2019, 143, e20182373. [Google Scholar] [CrossRef] [PubMed] [Green Version]
  5. Siegenthaler, M.H. Methods to diagnose, classify, and monitor infantile deformational plagiocephaly and brachycephaly: A narrative review. J. Chiropr. Med. 2015, 14, 191–204. [Google Scholar] [CrossRef] [PubMed] [Green Version]
  6. Wilbrand, J.F.; Wilbrand, M.; Pons-Kuehnemann, J.; Blecher, J.C.; Christophis, P.; Howaldt, H.P.; Schaaf, H. Value and reliability of anthropometric measurements of cranial deformity in early childhood. J. Cranio-Maxillofac. Surg. 2011, 39, 24–29. [Google Scholar] [CrossRef] [PubMed]
  7. Caple, J.M.; Stephan, C.N.; Gregory, L.S.; MacGregor, D.M. Effect of head position on facial soft tissue depth measurements obtained using computed tomography. J. Forensic Sci. 2016, 61, 147–152. [Google Scholar] [CrossRef] [PubMed]
  8. Munn, L.; Stephan, C.N. Changes in face topography from supine-to-upright position—And soft tissue correction values for craniofacial identification. Forensic Sci. Int. 2018, 289, 40–50. [Google Scholar] [CrossRef]
  9. Meulstee, J.W.; Verhamme, L.M.; Borstlap, W.A.; van der Heijden, F.; de Jong, G.A.; Xi, T.; Bergé, S.J.; Delye, H.; Maal, T.J.J. A new method for three-dimensional evaluation of the cranial shape and the automatic identification of craniosynostosis using 3D stereophotogrammetry. Int. J. Oral Maxillofac. Surg. 2017, 46, 819–826. [Google Scholar] [CrossRef]
  10. Dörhage, K.W.W.; Wiltfang, J.; von Grabe, V.; Sonntag, A.; Becker, S.T.; Beck-Broichsitter, B.E. Effect of head orthoses on skull deformities in positional plagiocephaly: Evaluation of a 3-dimensional approach. J. Cranio-Maxillofac. Surg. 2018, 46, 953–957. [Google Scholar] [CrossRef]
  11. Barbero-García, I.; Lerma, J.L.; Mora-Navarro, G. Fully automatic smartphone-based photogrammetric 3D modelling of infant’s heads for cranial deformation analysis. ISPRS J. Photogramm. Remote Sens. 2020, 166, 268–277. [Google Scholar] [CrossRef]
  12. Barbero-García, I.; Pierdicca, R.; Paolanti, M.; Felicetti, A.; Lerma, J.L. Combining machine learning and close-range photogrammetry for infant’s head 3D measurement: A smartphone-based solution. Measurement 2021, 182, 109686. [Google Scholar] [CrossRef]
  13. Grieb, J.; Barbero-García, I.; Lerma, J.L. Spherical harmonics to quantify cranial asymmetry in deformational plagiocephal. Sci. Rep. 2022, 12, 167. [Google Scholar] [CrossRef]
  14. Potenziani, M.; Callieri, M.; Dellepiane, M.; Corsini, M.; Ponchio, F.; Scopigno, R. 3DHOP: 3D Heritage Online Presenter. Comput. Graph. 2015, 52, 129–141. [Google Scholar] [CrossRef]
  15. Boutsi, A.M.; Ioannidis, C.; Soile, S. An Integrated Approach to 3D Web Visualization of Cultural Heritage Heterogeneous Datasets. Remote Sens. 2019, 11, 2508. [Google Scholar] [CrossRef] [Green Version]
  16. Pindrik, J.; Molenda, J.; Uribe-Cardenas, R.; Dorafshar, A.H.; Ahn, E.S. Normative ranges of anthropometric cranial indices and metopic suture closure during infancy. J. Neurosurg. Pediatr. 2016, 18, 667–673. [Google Scholar] [CrossRef] [PubMed] [Green Version]
  17. Skolnick, G.B.; Naidoo, S.D.; Nguyen, D.C.; Patel, K.B.; Woo, A.S. Comparison of direct and digital measures of cranial vault asymmetry for assessment of plagiocephaly. J. Craniofac. Surg. 2015, 26, 1900–1903. [Google Scholar] [CrossRef]
  18. Thompson, A.; Southon, N.; Fern, F.; Stupfler, G.; Leach, R. Efficient empirical determination of maximum permissible error in coordinate metrology. Meas. Sci. Technol. 2021, 32, 105013. [Google Scholar] [CrossRef]
  19. Bortoluzzi, G.; Ligi, M. DIGMAP: A computer program for accurate acquisition by digitizer of geographical coordinates from conformal projections. Comput. Geosci. 1986, 12, 175–197. [Google Scholar] [CrossRef]
  20. Hu, P.; Yang, B. Visual perception driven 3D building structure representation from airborne laser scanning point cloud. Virtual Real. Intell. Hardw. 2020, 2, 261–275. [Google Scholar] [CrossRef]
  21. Ma, Y.Q.; Liu, S.C.; Li, Q.Z. An advanced multiple outlier detection algorithm for 3D similarity datum transformation. Measurement 2020, 163, 107945. [Google Scholar] [CrossRef]
  22. Giavarina, D. Understanding Bland Altman analysis. Biochem. Med. 2015, 25, 141–151. [Google Scholar] [CrossRef] [PubMed] [Green Version]
  23. Altman, D.G.; Bland, J.M. Measurement in medicine: The analysis of method comparison studies. Statistician 1983, 32, 307–317. [Google Scholar] [CrossRef]
  24. Bland, J.M.; Altman, D.G. Statistical methods for assessing agreement between two methods of clinical measurement. Lancet 1986, 327, 307–310. [Google Scholar] [CrossRef]
  25. Barbero-García, I.; Lerma, J.L.; Marqués-Mateu, Á.; Miranda, P. Low-cost smartphone-based photogrammetry for the analysis of cranial deformation in infants. World Neurosurg. 2017, 102, 545–554. [Google Scholar] [CrossRef] [PubMed]
  26. Alho, E.J.L.; Rondinoni, C.; Furokawa, F.O.; Monaco, B.A. Computer-assisted craniometric evaluation for diagnosis and follow-up of craniofacial asymmetries: SymMetric v. 1.0. Child’s Nerv. Syst. 2020, 36, 1255–1261. [Google Scholar] [CrossRef] [PubMed]
  27. Wilbrand, J.F.; Szczukowski, A.; Blecher, J.C.; Pons-Kuehnemann, J.; Christophis, P.; Howaldt, H.P.; Schaaf, H. Objectification of cranial vault correction for craniosynostosis by three-dimensional photography. J. Cranio-Maxillofac. Surg. 2012, 40, 726–730. [Google Scholar] [CrossRef]
  28. Ayoub, A.; de Freitas Silva, L.; Mossey, P.; Al-Rudainy, D.; Marques de Mattos, A.; Garcia Júnior, I.R.; Quigley, A.; Ju, X. The characterisation of the craniofacial morphology of infants born with Zika virus, Innovative approach for public health surveillance and broad clinical applications. Front. Med. 2021, 8, 612596. [Google Scholar] [CrossRef] [PubMed]
  29. Freudlsperger, C.; Steinmacher, S.; Bächli, H.; Somlo, E.; Hoffmann, J.; Engel, M. Metopic synostosis: Measuring intracranial volume change following fronto-orbital advancement using three-dimensional photogrammetry. J. Cranio-Maxillofac. Surg. 2015, 43, 593–598. [Google Scholar] [CrossRef] [PubMed]
  30. Schaaf, H.; Malik, C.Y.; Streckbein, P.; Pons-Kuehnemann, J.; Howaldt, H.P.; Wilbrand, J.F. Three-dimensional photographic analysis of outcome after helmet treatment of a nonsynostotic cranial deformity. J. Craniofac Surg. 2010, 21, 1677–1682. [Google Scholar] [CrossRef]
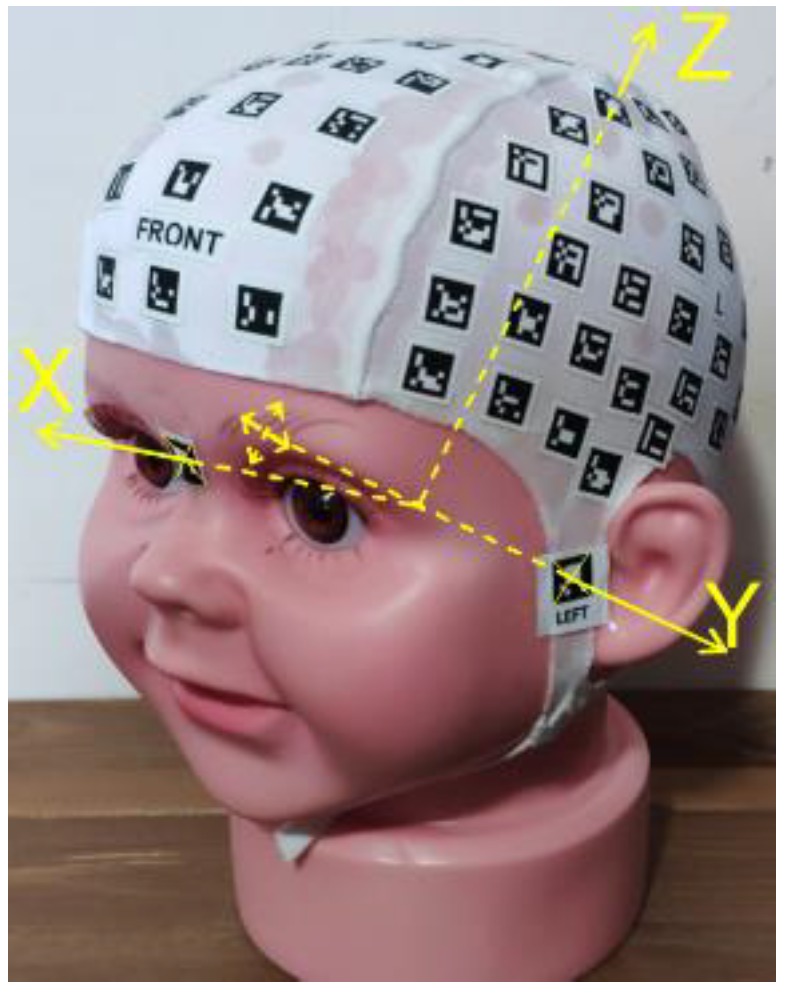
Figure 1. Dummy with the coded cap on. The local reference system (XYZ axes) is displayed in yellow.
Applsci 12 11499 g001
Figure 2. Visualisation of the PhotoMeDAS 3D models. (a) Fifty-four superimposed models, where it is possible to zoom, rotate, measure, create sections, show/hide content, and set the transparency of each model. (b) XY-plane section. (c) XZ-plane section. (d) Details of a section showing the maximum measured length among 3D models.
Applsci 12 11499 g002
Figure 3. (Left): Measurements for computing asymmetry and cephalic indices. (Right): Measurements for computing the towering index.
Applsci 12 11499 g003
Figure 4. (Left): Measurements for computing the metopic index. (Right): Measurements for computing the frontal angle.
Applsci 12 11499 g004
Figure 5. CNC CMM: operator pointing at a label corner to register its coordinates.
Applsci 12 11499 g005
Figure 6. Histograms displaying the differences in coordinates between all PhotoMeDAS coordinates and the ground truth. Units mm.
Applsci 12 11499 g006
Figure 7. Bland–Altman plots of the coordinate differences between PhotoMeDAS and CNC CMM (ground truth).
Applsci 12 11499 g007
Figure 8. Bland–Altman plots of the coordinate differences between PhotoMeDAS (scale factor 0.99) and CNC CMM (ground truth).
Applsci 12 11499 g008
Table 1. Anthropometric parameters and cranial deformation indices.
Parameter or IndexSymbolFormula or Explanation
Cranial perimeterCP
Pseudo-cranial volumeCVVolume above the maximum CP
Maximum cranial widthd
Maximum longitudinal distancec
a valueaDistance between right-frontal bone and left-occipital bone
b valuebDistance between left-frontal bone and right-occipital bone
af valueafFrontal part of a
bf valuebfFrontal part of b
ab valueabBack part of a
bb valuebbBack part of b
Asymmetry indexAI A I = a b (1)
Asymmetry index, frontAIf A I f = a f b f (2)
Asymmetry index, backAIb A I b = a b b b (3)
Oblique Cranial Length RatioOCLR O C L R = a b × 100 (4)
Perimeter30Perimeter30 P e r i m e t e r 30 = a r c A a r c B (5)
Cephalic indexCI C I = d c × 100 (6)
Towering indexTI T I = e f × 100 (7)
Metopic indexMI M I = g d × 100 (8)
Frontal angleFA
GlobalGlobalMean right hemisphere minus left hemisphere
Table 2. Results of the similarity and scale transformations between PhotoMeDAS coordinates and the CNC CMM coordinates (ground truth): mean and standard deviation. The scale factor in brackets equals 1 + differential scale.
ParameterSimilarity TransformationScale Transformation
MeanStd. DeviationMeanStd. Deviation
X translation (mm)0.500.30
Y translation (mm)0.000.31
Z translation (mm)−0.270.17
Differential scale−0.0065 (0.9935)0.0039−0.0096 (0.9904)0.0043
Rotation in X (deg)−0.070.32
Rotation in Y (deg)0.030.66
Rotation in Z (deg)−0.360.66
Table 3. Cranial anthropometric parameters along with their corresponding uncertainties for different values of measurement accuracy (0.5, 0.75, 1, and 1.5 mm). Experimental uncertainties derived from the 54 measured models are provided in the last column. The bold values highlight the closest largest uncertainties.
Cranial Parameter or IndexValueUncertainty (Meas. Accuracy 0.5 mm)Uncertainty (Meas. Accuracy 0.75 mm)Uncertainty (Meas. Accuracy 1.0 mm)Uncertainty (Meas. Accuracy 1.5 mm)Uncertainty
from the 54 Measured Models
CV (mL)4641014192925.8
CP (mm)39023472.0
DPaP (mm)106.40.71.11.42.10.8
d (mm)117.10.71.11.42.10.7
c (mm)121.30.71.11.42.10.8
a (mm)146.20.71.11.42.11.9
b (mm)146.30.71.11.42.11.8
af (mm)67.30.60.91.21.81.1
bf (mm)65.90.60.91.21.81.2
ab (mm)78.90.60.91.21.81.0
bb (mm)80.40.60.91.21.80.8
AI (mm)01.01.52.03.00.5
AIf (mm)10.91.31.72.60.5
AIb (mm)−20.91.31.72.60.5
Perimeter30 (mm)31.62.43.14.71.2
FA (deg)114.41.42.12.84.21.1
Global (mm)2.10.71.11.42.10.2
Table 4. Cranial deformation indices along with their corresponding uncertainties for different values of measurement accuracy (0.5, 0.75, 1, and 1.5 mm). Experimental uncertainties derived from the 54 measured models are provided in the last column. The bold values highlight the closest largest uncertainties.
Cranial Parameter or IndexValueUncertainty (Meas. Accuracy 0.5 mm)Uncertainty (Meas. Accuracy 0.75 mm)Uncertainty (Meas. Accuracy 1.0 mm)Uncertainty (Meas. Accuracy 1.5 mm)Uncertainty
from the 54 Measured Models
OCLR (%)1000.71.01.42.00.3
CI (%)970.71.11.42.10.7
TI (%)680.50.81.11.61.4
MI (%)540.71.01.42.00.5
Publisher’s Note: MDPI stays neutral with regard to jurisdictional claims in published maps and institutional affiliations.