Article

Insulated Gate Bipolar Transistor Solder Layer Defect Detection Research Based on Improved YOLOv5

School of Computer Science and Engineering, Sichuan University of Science & Engineering, Yibin 644000, China
*
Author to whom correspondence should be addressed.
Appl. Sci. 2022, 12(22), 11469; https://doi.org/10.3390/app122211469
Submission received: 2 October 2022 / Revised: 6 November 2022 / Accepted: 8 November 2022 / Published: 11 November 2022

Abstract

:
The expanding market scale of the insulated gate bipolar transistor as a new type of power semiconductor device has higher insulated gate bipolar transistor soldering requirements. However, there are some small bubbles difficult to detect. The accuracy and speed of existing detection algorithms are difficult to meet the requirements of automated quality monitoring. For solving these problems, a detection data set of solder layer images captured by X-ray and labeled was made and an improved algorithm based on YOLOv5 was proposed, which can detect defects accurately and at a fast speed. The main contributions of this research are as follows: (1) a tiny bubble detection layer that further integrates the deep feature information and shallow feature information is added to improve the model’s ability to detect small bubbles; (2) to speed up model convergence by optimizing anchor frame parameters; (3) we change the EIoU loss function as the bounding box loss function to solve the sample imbalance of the dataset; (4) combine the Swin Transformer structure to improve the convolution module and form a new feature extraction module, and introduce it into the backbone layer to improve the detection accuracy. The results of the experiment show that the overall performance of the improved network is better than the original and mainstream detection algorithms. The accuracy of the improved YOLOv5_SEST has reached 94.5% and 5.6% improvement in mAP for common bubble defect detection compared to the original algorithm. Our model size is only 5.3 MB, and the detection speed reaches 110 f/s. Therefore, the improved YOLOv5_SEST can well meet the requirements of automated quality monitoring of insulated gate bipolar transistors.

1. Introduction

In recent years, the rapid development of advanced technology is inseparable from the support of power electronics technology, the use of commutation technology can efficiently achieve the conversion of electrical energy, the Insulated Gate Bipolar Transistor (IGBT) is a variety of electronic power equipment undertaking the conversion of electrical energy and transmission control of the core components [1,2,3,4], it is also the most failure-prone component in converters [5,6]. With the rise of new energy industries, the efficiency and lifetime of IGBT have become the key to the global green energy-saving economy [7]. IGBT modules are subjected to relatively repetitive alternating high and low temperature and thermal cycles in actual operation for long periods, which makes it imperative that they have excellent reliability in terms of temperature. However, it has been found that the reliability of IGBT modules in high-reliability high power places is not high [8,9], and that defects in their solder layer interfaces can not only affect the overall model heat transfer but can even lead to the failure of the entire module. Its failure can lead to the failure of electronic and electrical equipment in minor cases, or it can lead to the overall system being unexpectedly plunged into downtime, resulting in serious economic losses [10,11,12,13]. Therefore, IGBT solder layer defect detection is of great importance to ensure the reliability and stability of IGBT modules.
The traditional methods for defect detection in IGBT modules include destructive testing sampling with microscopic and nondestructive testing. For nondestructive testing, a series of detection methods were proposed, such as ultrasonic inspection [14], and X-ray detection using digital radiography (DR) and computed tomography (CT). However, in traditional methods, due to the high cost and low efficiency of manual testing, it is difficult to complete the task of large-scale quality testing. As deep learning-based defect detection relies on images, imaging-friendly X-rays become the nexus for detection using deep learning.
Object detection algorithms are divided into three categories: single-stage algorithms, two-stage algorithms, and anchor-free algorithms. The two-stage algorithms generate candidate regions in advance with high precision but low speed such as Faster R-CNN [15], Mask R-CNN [16], and Cascade R-CNN [17], etc. The one-stage algorithms that synchronize the target prediction category with the regression position with high speed and high practicality meet the requirements of industrial real-time quality inspection such as YOLO family series [18,19], SSD [20], RetinaNet [21], etc. The anchor-free algorithms avoid hand-designed anchor frames, such as CenterNet [22], FCOS [23], etc.
In recent years, the rapid development of hardware technology has led to the rapid growth of computer computing power, laying the foundation for long development in various fields. Menelaos et al. [24] proposed the implementation of an unsupervised image classification task using a time-multiplexed spiking convolutional neural network based on VCSELs; Kim et al. [25] proposed AI2O3/TiOx-based resistive random access memory (RRAM) in response to the lack of consideration of errors occurring in the program during transfer in previous studies; Indranil et al. [26] proposed a technology-aware training algorithm to address the problem that various non-idealities in the crossbar implementations of synaptic arrays can degrade the performance of neural networks.The above hardware development cases offer the possibility and feasibility of deep learning to implement industrial defect detection.
With the rapid development of computer computing power, deep learning has contributed to defect detection in industries such as printed circuit boards, steel, capsules, batteries, textiles, fruits and vegetables, and smart cars. For example, Xu et al. [27] proposed a joint training strategy of Faster R-CNN and Mask R-CNN to achieve intelligent pavement crack detection. Compared with YOLOv3, it improves the performance but leads to a decrease in Mask R-CNN bounding box detection. Guo et al. [28] proposed a method to improve the detection accuracy by first preprocessing the tile images with uneven illumination, complex surface texture, and low contrast using an adaptive histogram homogenization method with restricted contrast, and then using Mask R-CNN for defect detection. Guo et al. [29] proposed a scheme of adding a guided anchor frame algorithm to produce an anchor based on Faster R-CNN to achieve intelligent detection of surface defects of three parts, which substantially improved the detection accuracy of the model.
Compared with other algorithms, YOLO series algorithms have non-negligible advantages. Yao et al. [30] proposed a YOLOv5-based model for the detection of surface defects in kiwifruit, which provides an efficient and intelligent way of post-production quality inspection for agriculture. Wang et al. [31] proposed a YOLOv5-based algorithm to achieve unmanned quality inspection of tile surface defects on production lines for the current problem that manual quality inspection cannot be avoided on tile surfaces. The results show that the accuracy of the YOLOv5 model is higher than that of Faster R-CNN, SSD, and YOLOv4. Li et al. [32] used the DBSCAN+K-means clustering algorithm based on YOLOv3 to re-cluster Anchor under Avg IOU criterion, add residual units, and introduce SE attention mechanism to increase the model-specific feature extraction capability to achieve the improvement of YOLOv3 for PCB defect detection accuracy and speed. The above case study provides the feasibility of choosing YOLOv5 for defect detection in IGBT solder layers.
There is a lack of research on the use of deep learning for the detection of bubble defects in the solder layer of IGBT modules, so this paper collects a dataset of labeled IGBT solder layer bubble defects. Considering that the more complex detection process of the two-stage algorithm and the network structure leads to a slower detection speed, which cannot meet the requirements of industrial quality inspection in real-time. Low confidence in the prediction results of the anchor-free frame algorithm. The regression-based, one-stage algorithm is faster and more practical to meet the requirements of industrial real-time unmanned quality control. This paper presents an improved YOLOv5-based defect detection model for IGBT solder layers. The main contributions of this research are as follows:
  • A tiny bubble detection layer that integrates deep feature information and shallow feature information is added to improve the model’s ability to detect small bubbles.
  • To speed up model convergence by optimizing anchor frame parameters.
  • We change the EIoU loss function to the bounding box loss function to solve the sample imbalance of the dataset.
  • Combine the Swin Transformer structure to improve the convolution module, form a new feature extraction module and introduce it into the backbone layer to improve the detection accuracy.
In the remainder of this paper, Section 2 introduces the YOLOv5 base model. We explain our proposed methodology in Section 3, while experimental details and results are discussed in Section 4. Finally, a brief conclusion is given in Section 5.

2. Related Work

YOLOv5

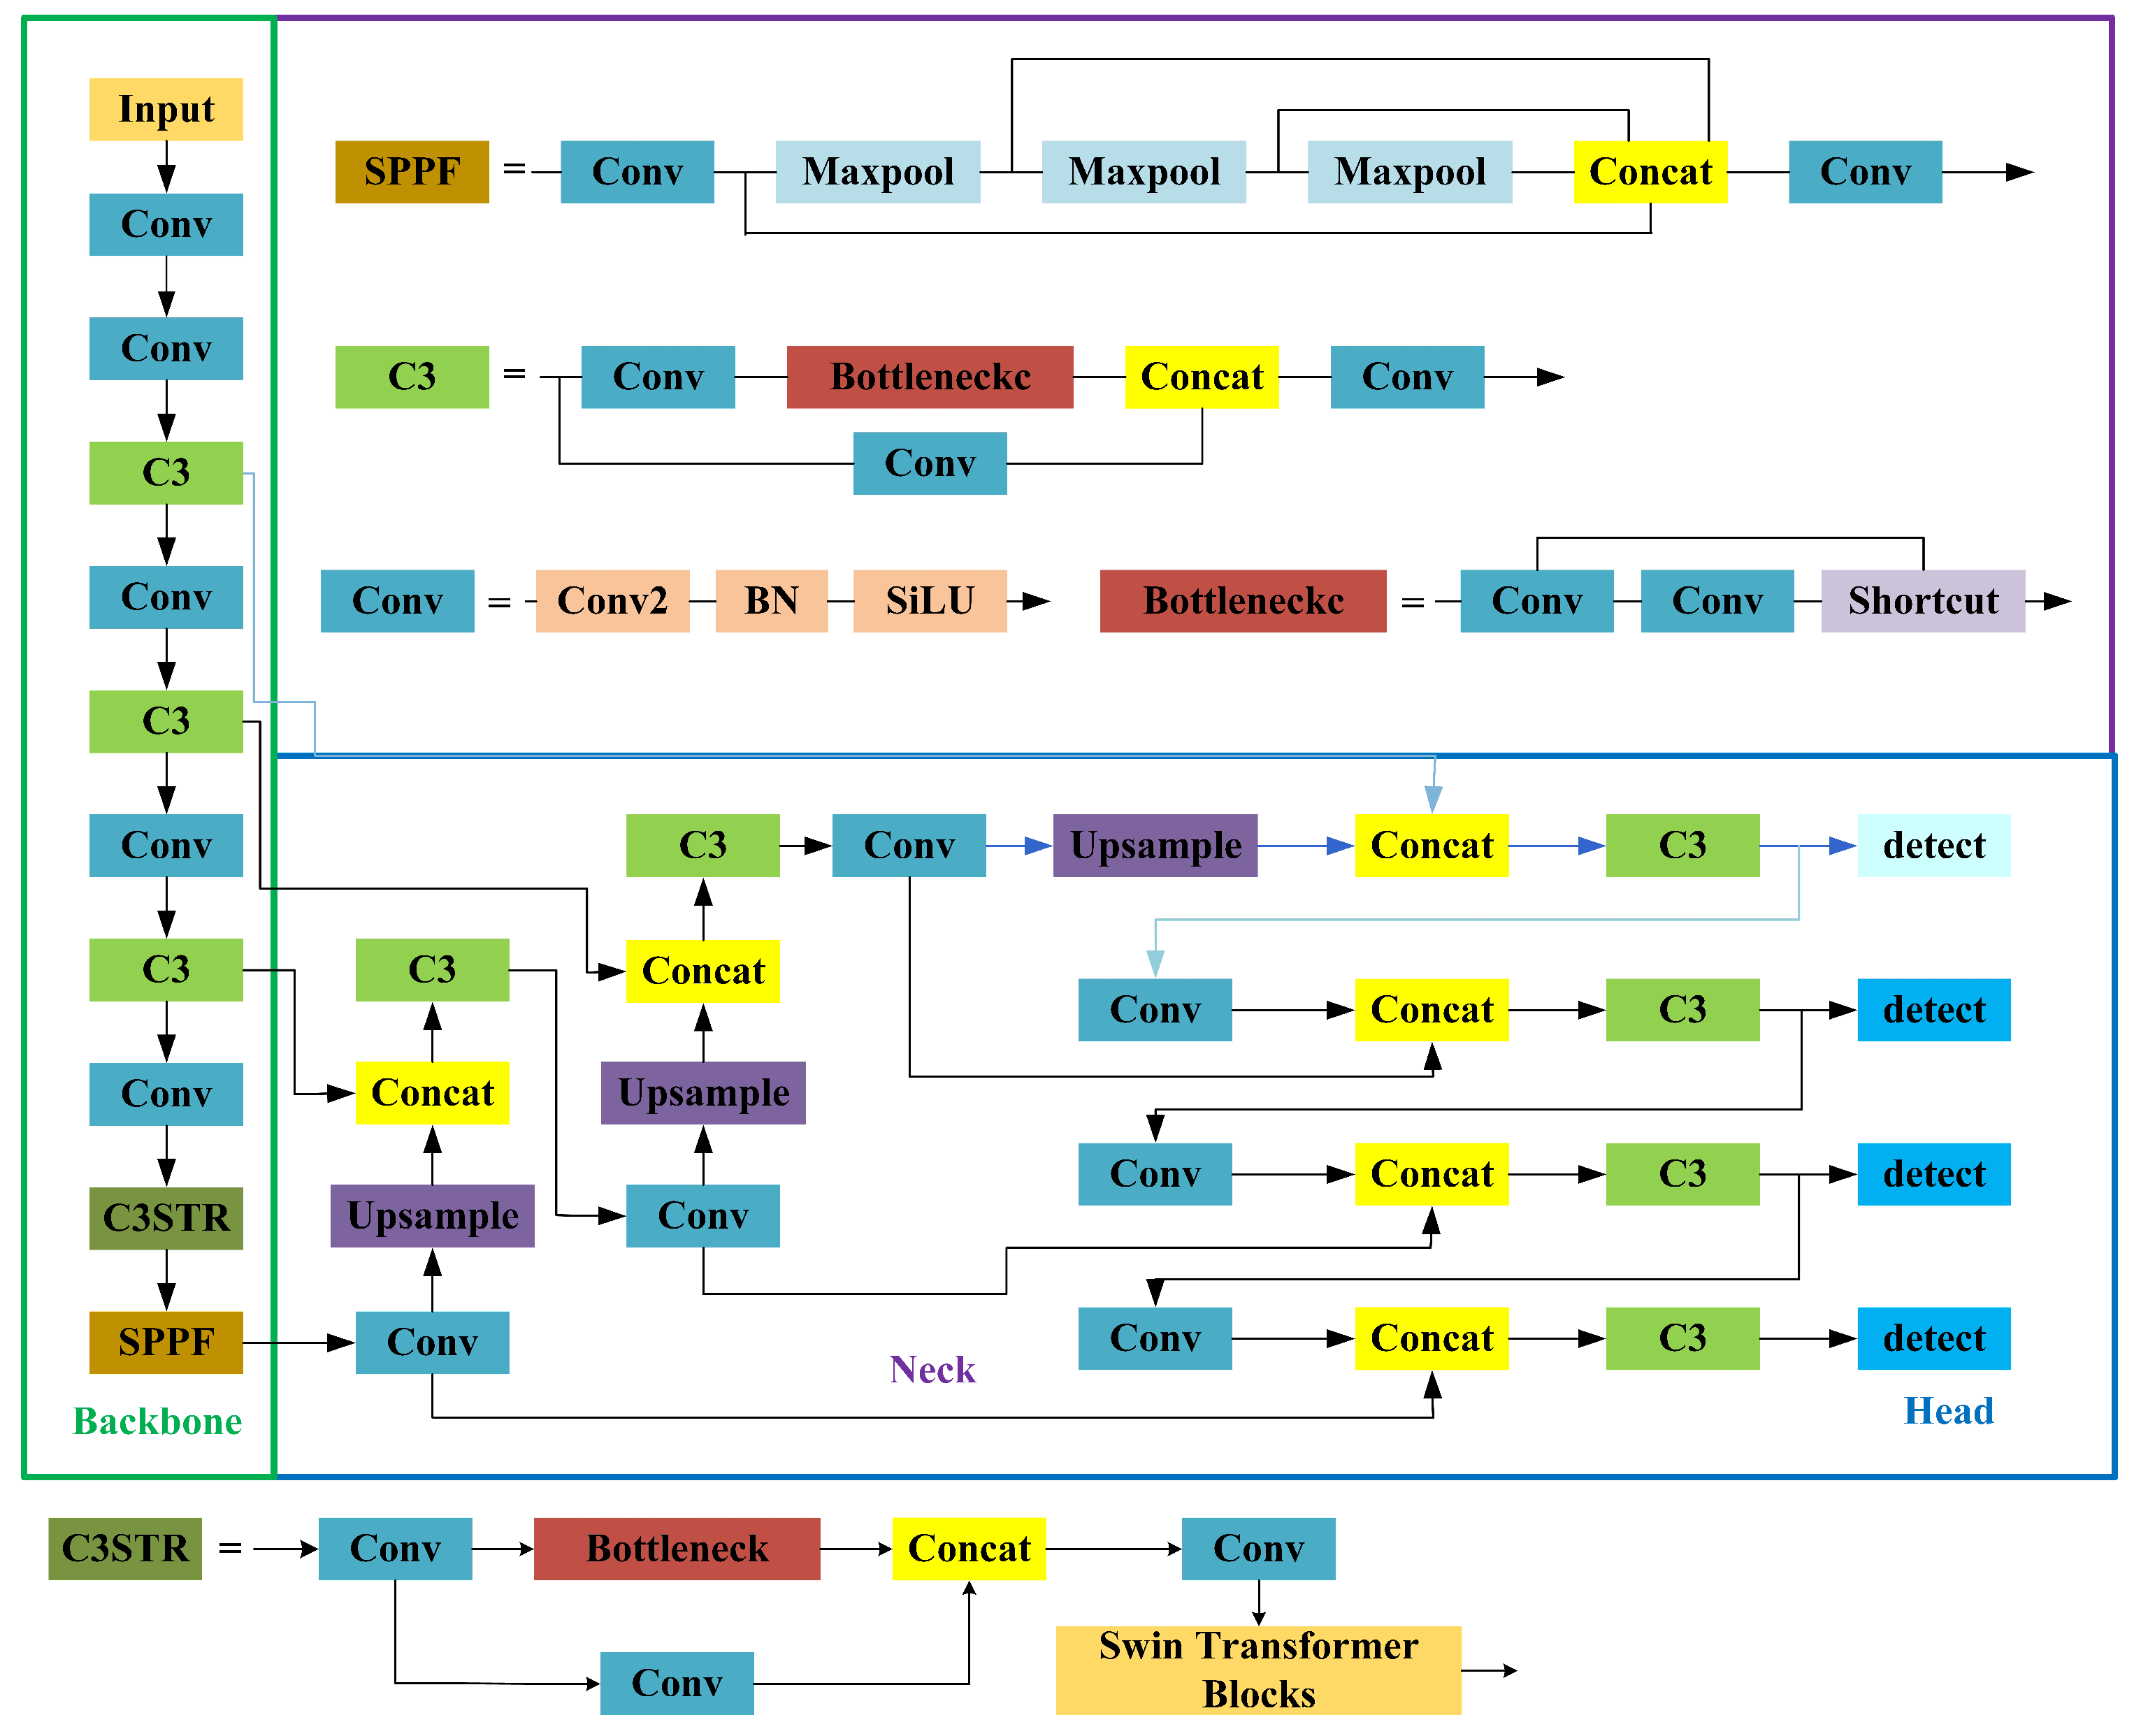
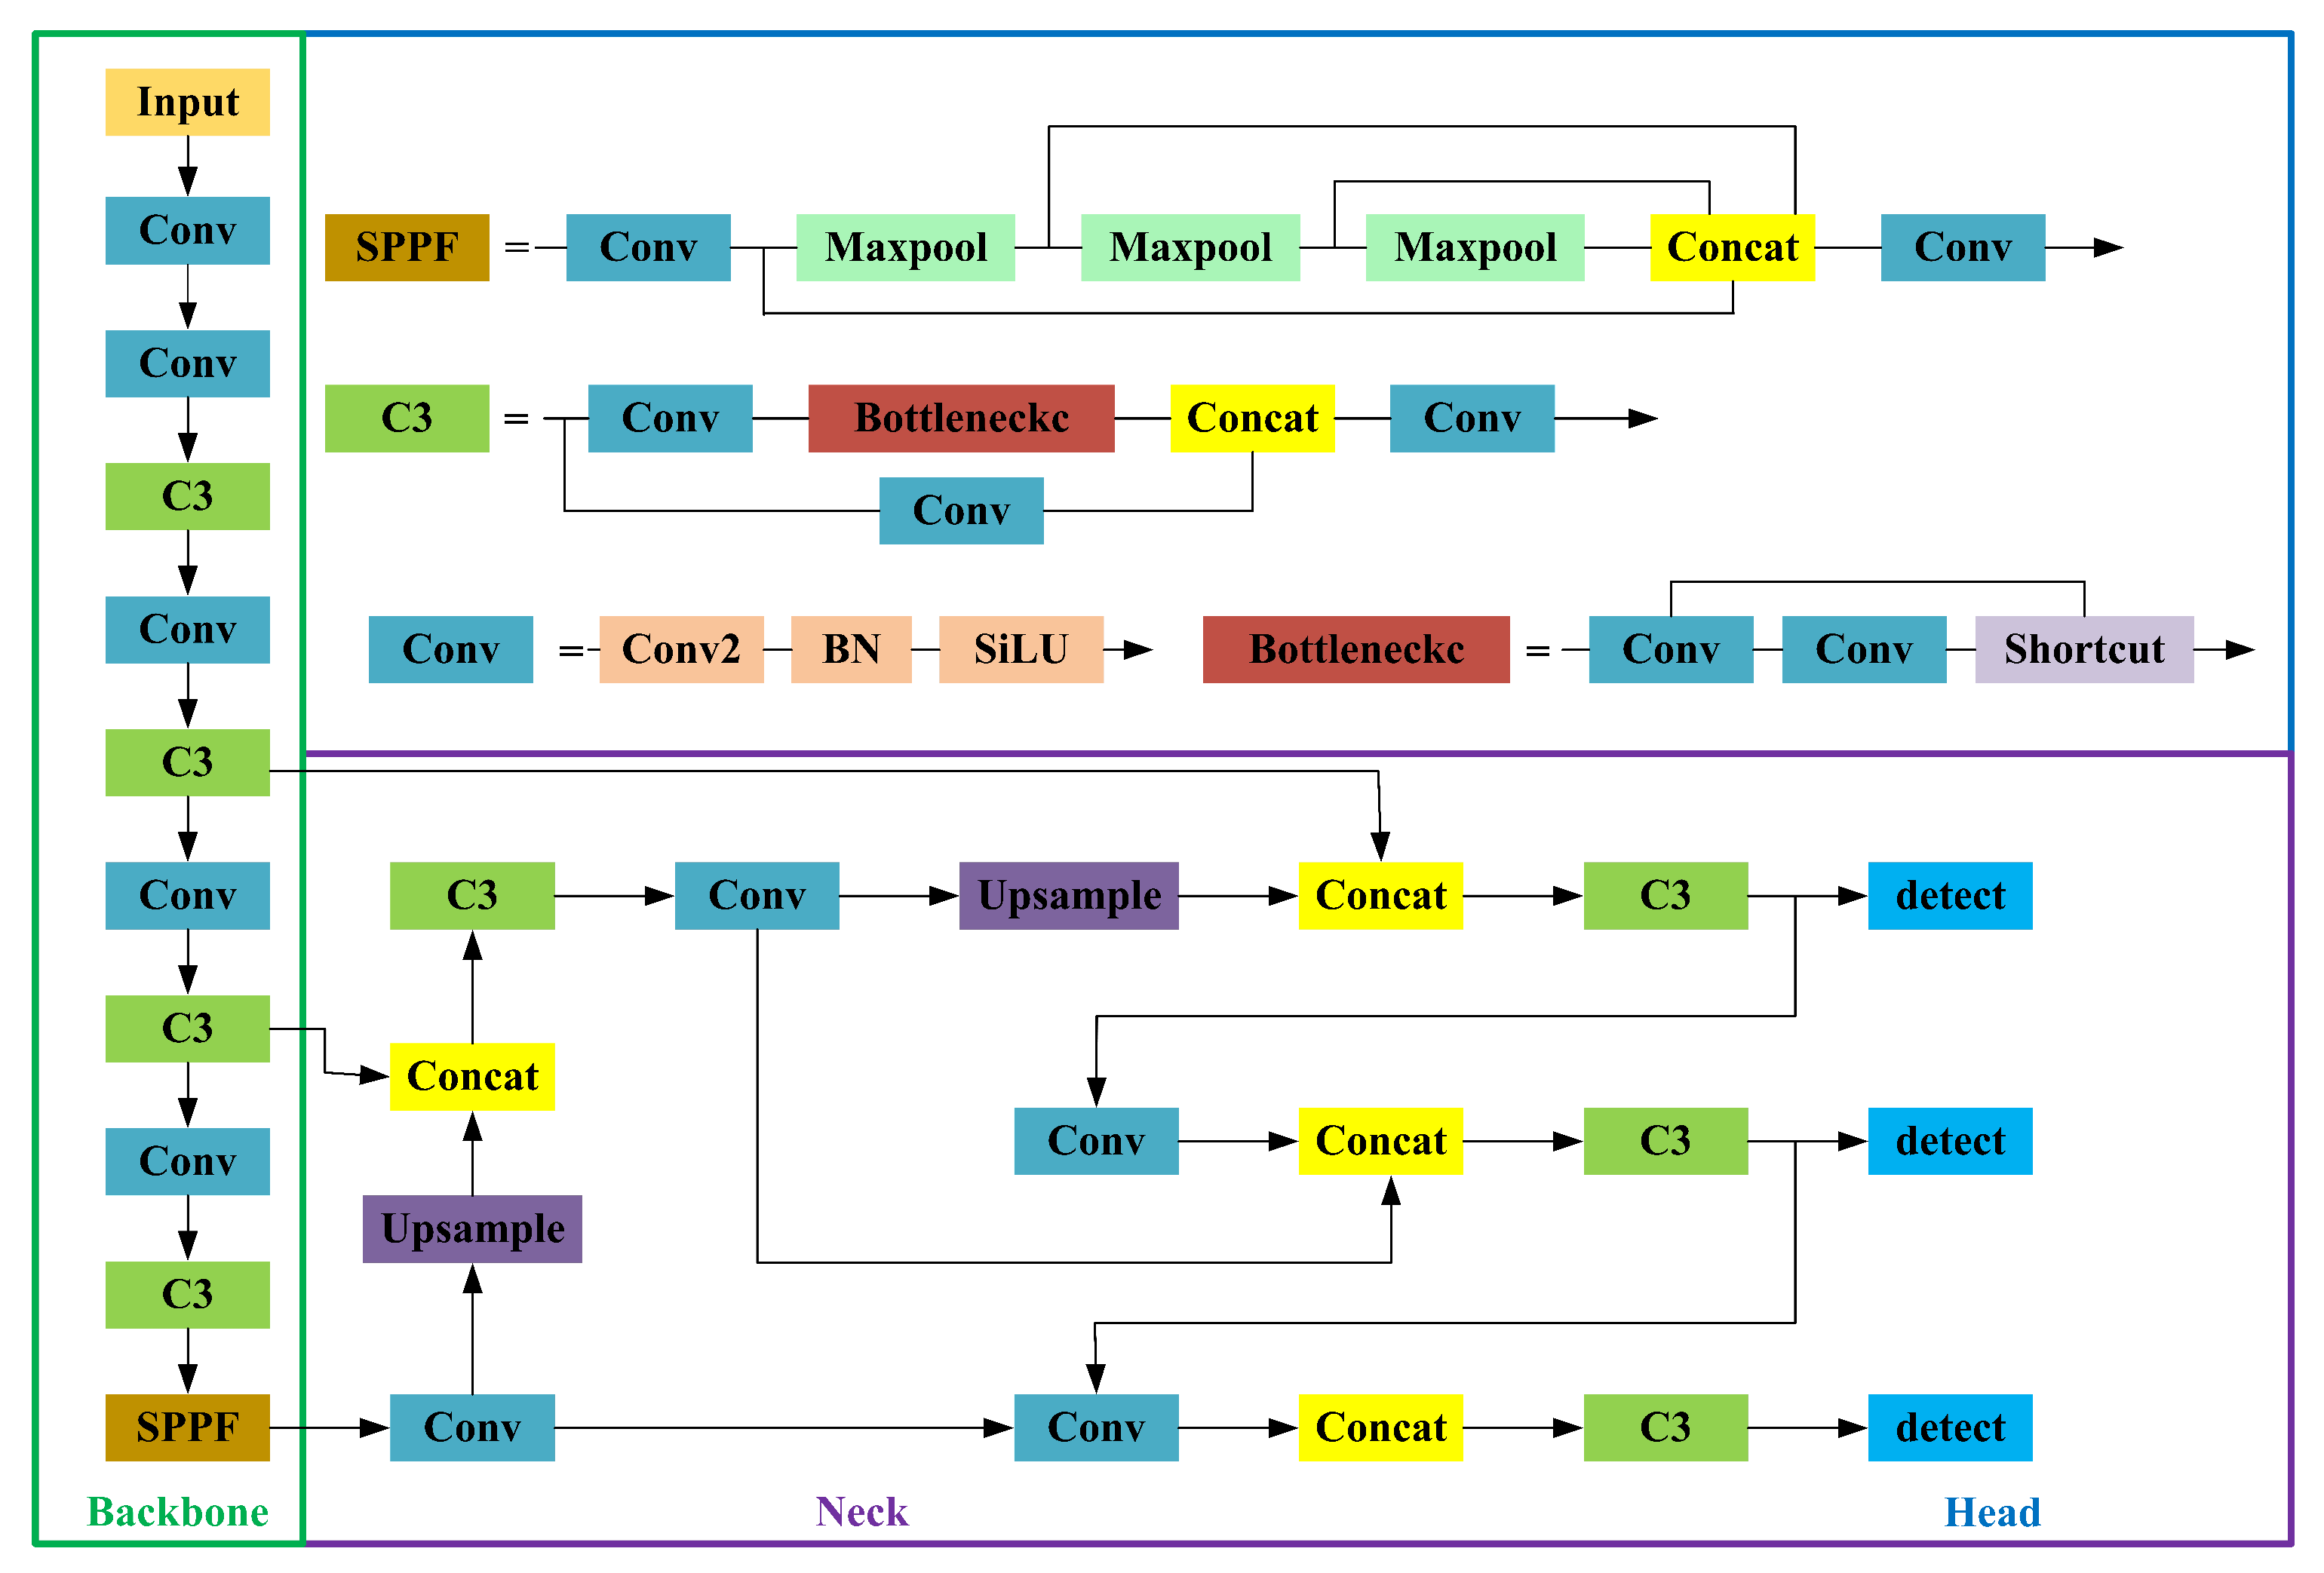
Among the series of object detection models, the most classic one-stage detection model is the YOLO series, of which YOLOv5 [33] was released by Ultralytics in 2020. After continuous updates and upgrades, there are five versions of the YOLOv5 algorithm in the order of increasing the weight, width, and depth of the model, which are YOLOv5n, YOLOv5s, YOLOv5m, YOLOv5m YOLOv5l, and YOLOv5x. The overall structure of the YOLOv5 network is shown in Figure 1, which consists of four main parts: input side, backbone, neck, and head.
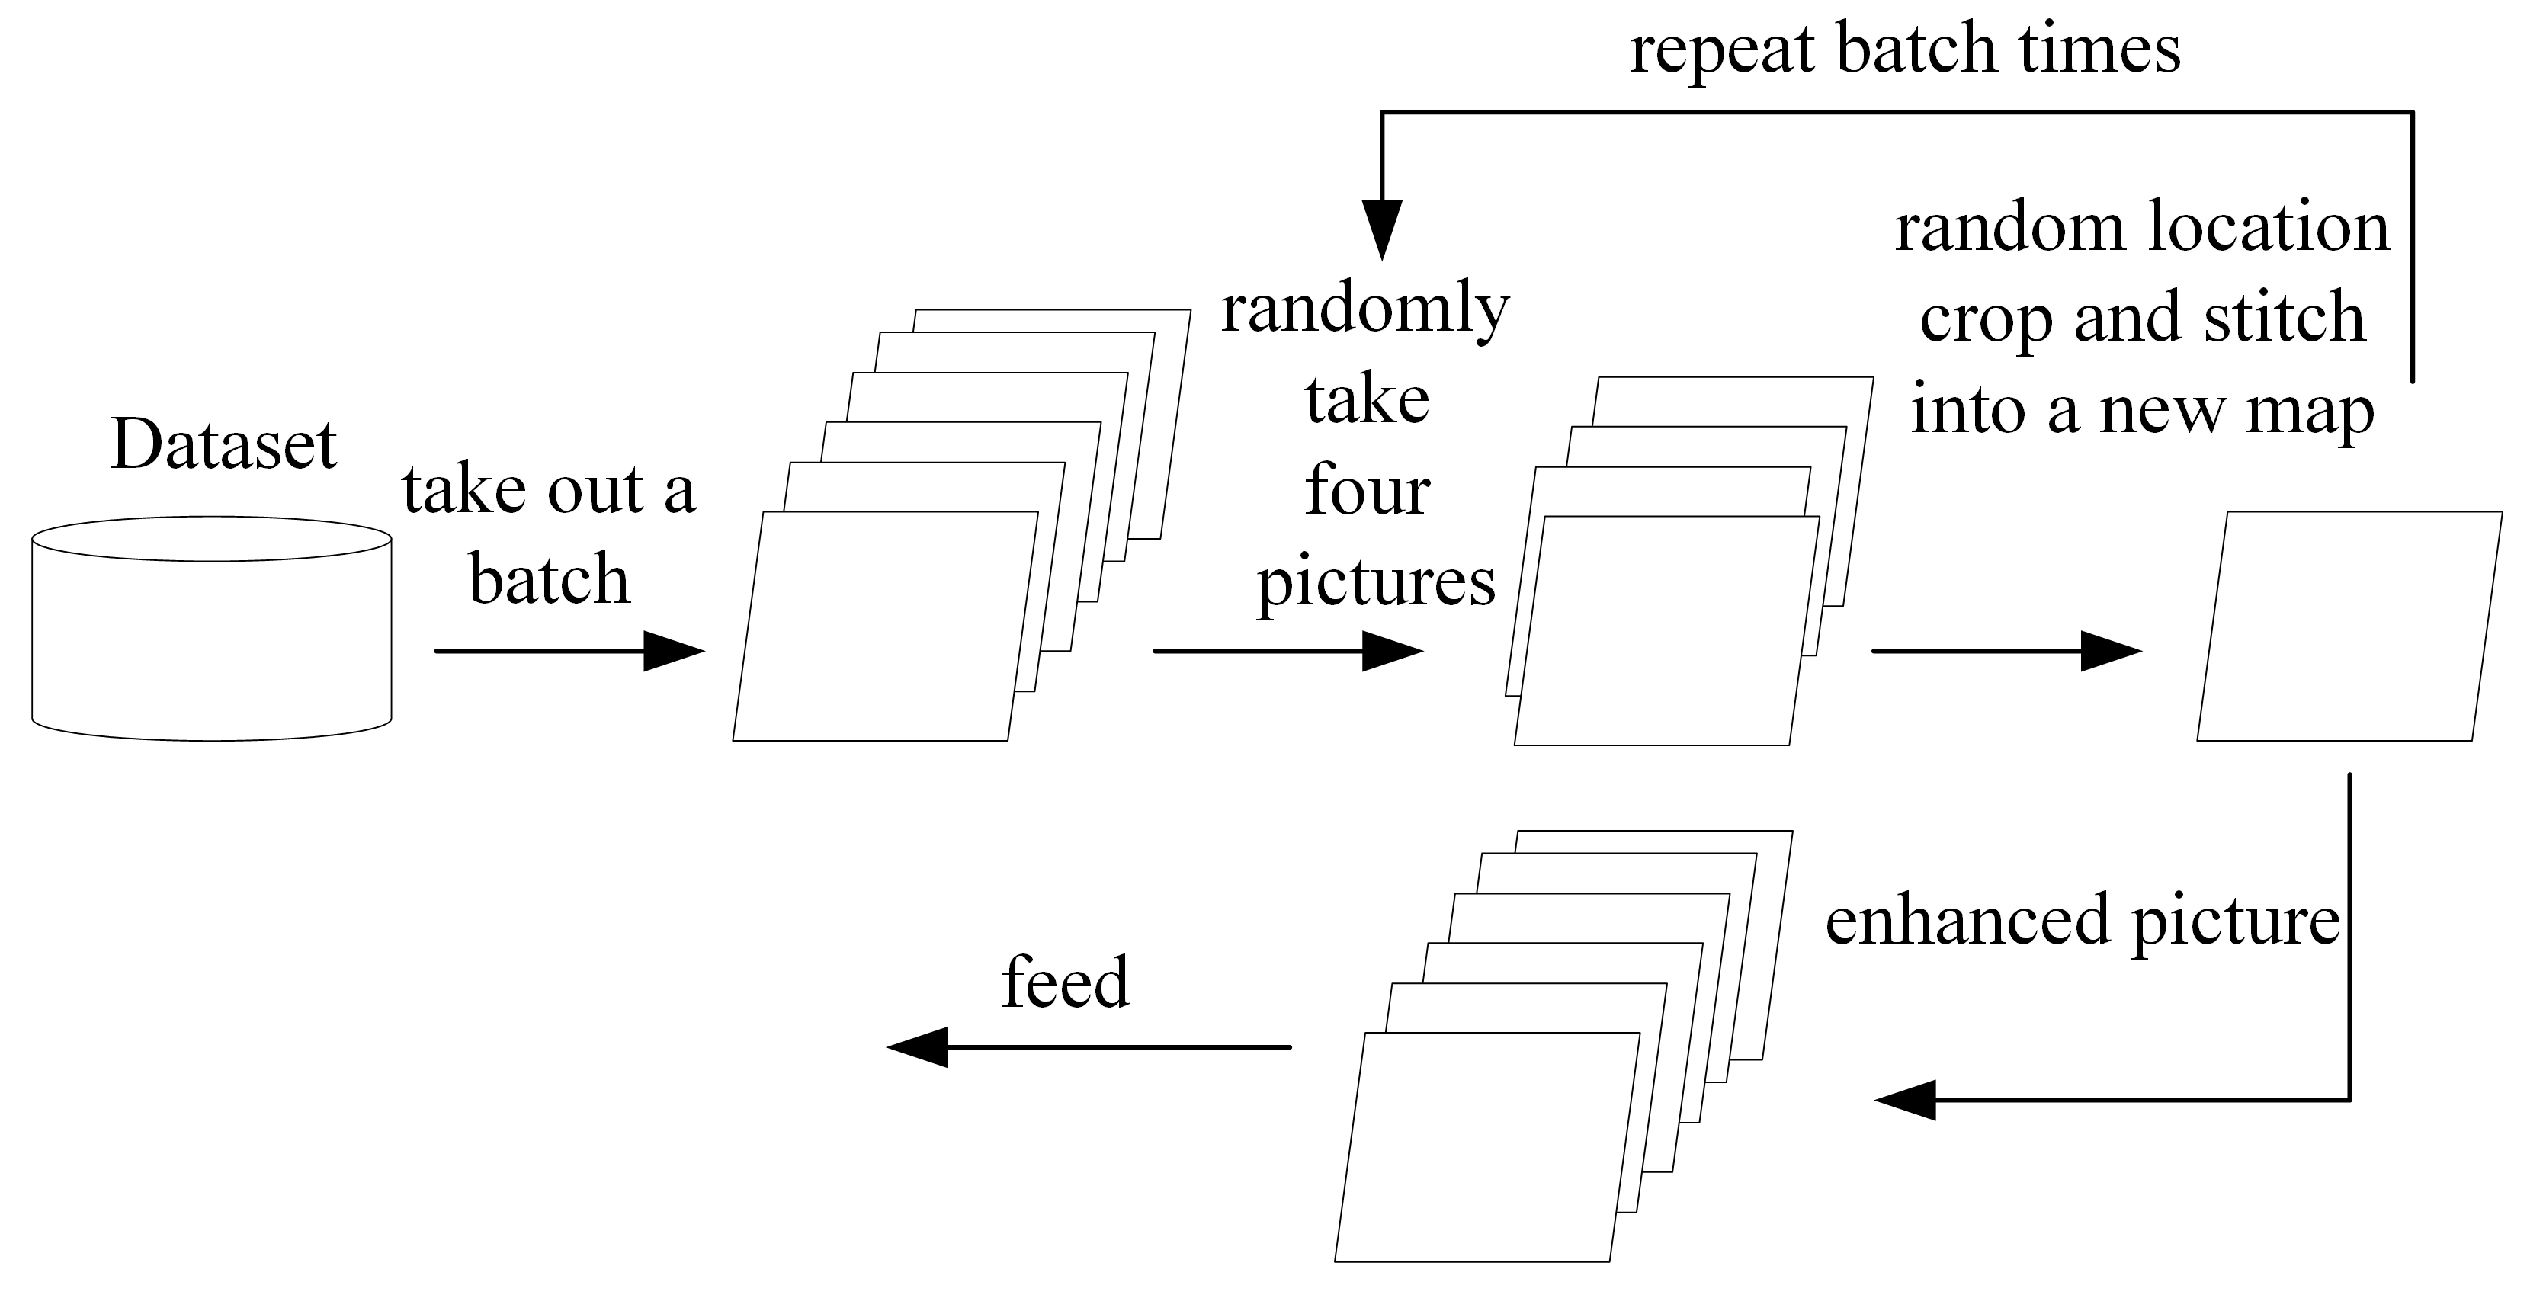
Data augmentation, self-adaptive anchor frame calculation, and self-adaptive image scaling are implemented on the input side. The data augmentation process, in which Mosaic data augmentation cite18 is used in addition to the basic data augmentation method, as shown in Figure 2, randomly takes four images from the dataset and rotates, flips, scales, and splices them to obtain new training data, adding small target samples to enrich the dataset and further enhance the training speed of the network. In the self-adaptive anchor frame calculation process, the set anchor frame is input to the network to calculate the predicted frame compared with the real frame to reverse update the network parameters and iterate to reach the best. In the self-adaptive image scaling process, calculating the scaling ratio, size, and black border fill values to add the least amount of black border and retain the most features.
Backbone consists of a 6 × 6 Conv module equivalent to Focus, four Conv modules, four C3 modules, and the SPPF module. The input image is firstly sliced through the 6 × 6 Conv module by taking a value for every pixel interval in the horizontal and vertical directions, halving the image size and quadrupling the number of channels, followed by a series of convolution, pooling, Cross Stage Partial Network (CSPNet), and finally extracting high-level semantic information through SPPF to obtain the feature map.
Neck follows the structure of Feature Pyramid Networks (FPN) combined with the Path Aggregation Network (PAN) [34], which achieves the fusion of high-level semantic information with shallow location information to improve the model detection accuracy while preserving the original image information.
Head obtains high-quality candidate frames by using the non-maximum suppression method to remove low-quality predicted frames from the target anchor frames of corresponding sizes detected from the Neck of three different sizes of feature maps.
The loss of a target detection class model generally consists of target confidence loss, classification loss, and bounding box loss, which is shown as Equation (1), where λ 1 , λ 2 , λ 3 are the equilibrium coefficients.
Loss = λ 1 L c l a + λ 2 L l o c + λ 3 L c o n f
The target confidence of YOLOv5 and the loss of classification are adopted from BCEWithLogitsLoss, as shown in Equations (2) and (3).
B C E L = i = 1 N y i * ln σ x i + 1 y i * ln 1 σ x i
σ x i = Sigmoid x i = 1 1 + e x i
where N represents the number of target categories, x i represents the predicted value of the i category, σ x i represents the probability of the i category after the sigmoid function, and y i * represents the true value of the i category.
Bounding box loss is calculated using CIoU Loss [35], as shown in Equations (4)–(6). Where α is the weight coefficient, v is used to measure the consistency of the relative proportions of two rectangular boxes, w g t , h g t represents the width and height of the real box, w , h represents the width and height of the predicted box, and I o U represents the intersection ratio of the predicted box and the real box. Even though CIoU Loss increases the penalty for aspect ratio to improve the evaluation accuracy, there are problems with using inverse trigonometric functions for the calculation to increase the arithmetic power consumption, reduce the training speed and not consider the sample distribution.
α = v ( 1 I o U ) + v
v = 4 π 2 arctan w g t h g t arctan w h 2
CIoULoss = 1 I o U + ρ b , b g t c 2 + α v

3. Methodology

YOLOv5 is a high-performance model that locates and classifies defects in one step. Therefore, YOLOv5 is selected for the corresponding network structure adjustment and improvement to achieve the detection of IGBT solder layer bubble defects. Due to the small size, large number, irregular distribution, and different shapes of defective bubbles in IGBT modules, the detection of solder layer bubble defects by using object detection algorithms such as YOLOv5 are not effective. To improve the detection capability of solder layer defect bubbles, the overall structure of the improved YOLOv5 in this paper is shown in Figure 3: (1) adding a small target detection layer that fits the tiny bubbles of the IGBT solder layer and adjusting the anchor frame parameters; (2) improving the box regression loss function; (3) adding a new convolution module to the backbone network.

3.1. Add a Small Object Detection Layer

The original YOLOv5 model has three detection layers. They are a detection layer of size 80 × 80 for detecting objects with a size of 8 × 8 and above, a detection layer of 40 × 40 for detecting objects with a size of 16 × 16 and above, and a 20 × 20 size detection layer for detecting targets of size above 32 × 32 [36]. A larger feature map size detects small targets and a smaller feature map size detects large targets [37].
As the relatively high number of tiny defects in IGBT solder layer defect detection, the model is required to improve the detection capability for tiny targets. Therefore, in this paper, based on the original YOLOv5, a set of a priori anchor frames (5,6), (8,14), (15,11) for tiny targets is added to improve the convergence speed during model training; while retaining the original map information, the feature map is further extended by adding a set of convolution modules, upsampling modules for tiny targets. To reduce the loss of location information, the deep semantic information is fused with the shallow information, and the minimum feature map obtained in the backbone network is spliced with the further extended feature map to obtain a new feature map. A detection layer for detecting small targets is added to match the new feature map detection.

3.2. Loss Function

Box regression loss for YOLOv5 calculated by CIoU loss function [38]. Although CIoU improves the convergence speed and regression accuracy of the network, the v in the formula only reflects the difference in aspect ratio and does not show the true difference between the aspect ratio and its confidence level. Moreover, as inferred from the prediction frame and the prediction formula, w and h cannot be increased and decreased at the same time, so there may be a situation that prevents the model from optimizing the similarity effectively. To address the above problem, EIoU solves theoretically the problem that w and h cannot be scaled up or down simultaneously in CIoU Loss by directly penalizing the loss function of the prediction results of w and h, as shown in Equation (7).
EIoULoss = L I o U + L d i s + L a s p = 1 I o U + ρ 2 b , b g t c 2 + ρ 2 w , w g t C w 2 + ρ 2 h , h g t C h 2
It can be seen that the EIoU loss function consists of the intersection ratio loss of the predicted frame and the real frame, the center distance loss of the predicted frame and the real frame, and the width and height loss of the predicted frame and the real frame, where C w and C h are the width and height of the two rectangular closures, respectively. Bounding box regression also suffers from the problem of unbalanced training samples, that is, the number of low-quality anchor boxes with large regression errors in a single image is much larger than the number of low-quality samples with small errors, and such samples can cause excessive gradients to affect the training effect. To solve this problem, Focal Loss is introduced to solve the problem of sample imbalance based on the original one, which makes the EIoU Loss loss function more consistent with the detection situation in this study.

3.3. Improvement of C3 Module

The traditional Convolutional Neural Network (CNN) [39] has been very successful in extracting features as well as structure for image classification with good fitting ability, and the structure has been optimized with the addition of residual structure and the deep neural network has led to a better combination of context and corresponding generalization ability. From the perspective of human vision, the Transformer [40] based on the self-attention mechanism is more in line with human visual logic, but in the application process, it is found that it cannot adapt to a large range of target size changes and the attention mechanism brings a correspondingly large amount of computation, which makes the accuracy and speed less than that of CNN. Swin Transformer [41] proposes a hierarchical approach to construct multi-layer feature maps to solve the above problems, as well as to introduce a sliding window operation to restrict attention to a finite window to make the computational complexity linearly related to the input image size.
Swin Transformer is similar to ViT in that the input image with size H × H × 3 is first chunked, then the feature dimension of the image block is changed by linear embedding in stage1, and then it is fed into Swin Transformer Block and the input features are calculated; stage2-stage4 is similar in that the 2 × 2 adjacent image blocks are merged and stitched together, and then the convolutional network is used to downscale them to achieve the desired feature dimension.
Swin Transformer Blocks are shown in Figure 4, and the normalized data first enter the Windows Multi-head Self Attention (W-MSA) module that further divides the image blocks into different regions and performs self-attentive calculations on them; immediately into the Multilayer Perception (MLP) machine using the GeLU function as the activation function to implement the nonlinear transformation of the data. Finally, the introduction of the Shifted Windows Multi-head Self Attention (SW-MSA) mechanism, which enables the interaction of information within partial windows between different levels; and connected using residual modules after each MSA module and MLP, as shown in Equations (8) to (11).
Z ^ l = W M S A L N Z l 1 + Z l 1
Z l = M L P L N Z ^ l + Z ^ l
Z ^ l + 1 = S W M S A L N Z l + Z l
Z l + 1 = M L P L N Z ^ l + 1 + Z ^ l + 1
The C3 module, which incorporates Swin Transformer Blocks, is named the C3STR module, and its specific structure is shown in Figure 3. It is experimentally demonstrated that the C3STR module, which introduces the Swin Transformer module, can achieve the same effect of introducing an attention mechanism to improve model accuracy with minimal additional overhead.

4. Experiments

4.1. Experimental Environment and Parameter Settings

To verify the effectiveness of the improved method in this paper, corresponding experiments will be conducted on the homemade IGBT data set. The experimental environment is Ubuntu 18.04 operating system, 2 Inter Xeon Silver(R) 4010R processors, Nvidia Geforce RTX 3080 graphics card, and deep learning framework Pytorch version 1.10. To ensure the fairness and reliability of the experimental results, all training parameters in this paper are fully set as the parameters in Table 1, which contain learning rate, momentum, weight decay, batch size, number of iterative rounds, and picture size.

4.2. Dataset Construction

4.2.1. Acquisition of Raw Images

The quality of the dataset is highly relevant to the training and improvement of the model [42]. Since there is no publicly available dataset for IGBT solder layer defects, this paper establishes a standardized IGBT production line solder layer defect detection dataset. The images of this dataset were randomly collected from the standardized IGBT production line using an industrial X-ray device with a collection size of 1536 × 1536 images and a total of 400 images with high image quality. To ensure the diversity and completeness of defect types, the data images are randomly collected from different production batches. The principle is to use the penetrating property of X-ray for precise imaging to detect the internal solder layer structure, solder layer defect location, size, and dimension of IGBT without damaging the IGBT.

4.2.2. Image Pre-Processing

The image format of X-rays acquisition is 16-bit, which cannot be processed by the algorithm directly, so it needs to be converted to an 8-bit image by window width and window bit processing, and the principle is to find the area corresponding to the image that needs to be displayed and processed, and do histogram equalization on this part to convert it to the 8-bit image. Figure 5a is the original image of the IGBT solder layer acquired by X-ray, which can be seen to be unusable for algorithmic calculations. Figure 5b shows the IGBT display image after preprocessing. It can be seen that in the X-rays acquisition image of the IGBT after processing, the solder layer defects are visible.

4.2.3. Annotation of the Dataset

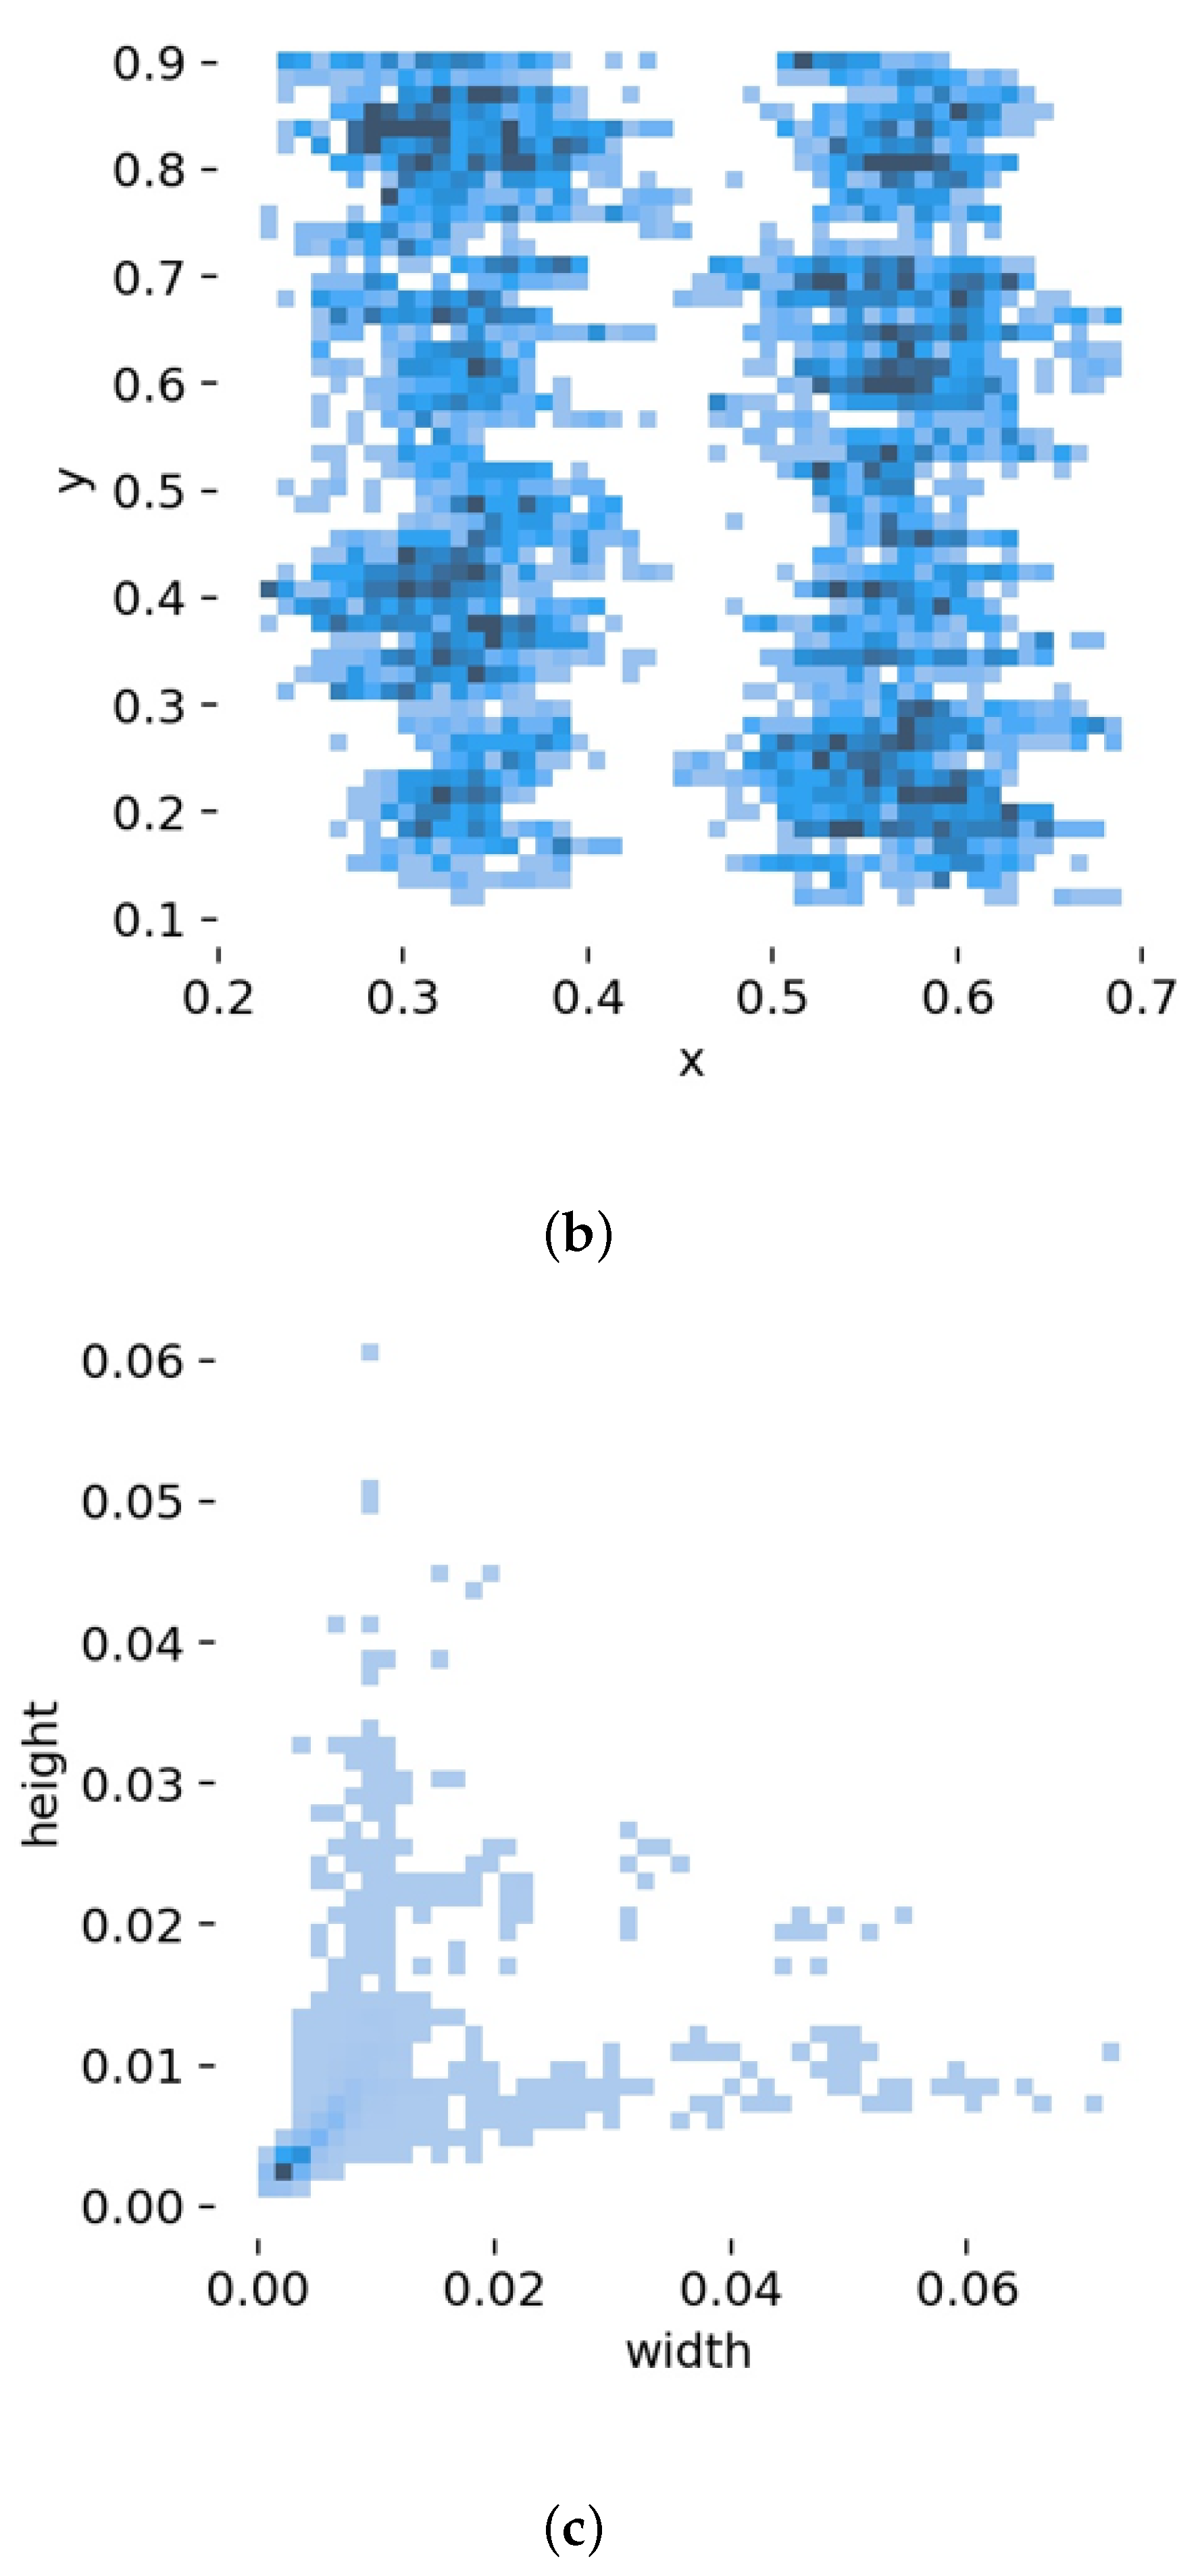
LabelImg software was used to manually grade and label the 400 sheets of preprocessed IGBT solder layer bubble defects to produce inspection labels and avoid boxing irrelevant content as much as possible during the labeling process. The label format is chosen from the YOLO data set format, a total of two types of solder defects are marked, and the labels are divided into the bubble, bubble_edge. The image annotation is shown in Figure 5c, where the bubble is annotated with regular bubble defects, while bubble_edge is used to annotate the edge bubble with the irregular shape at the edge of the solder layer. The obvious sample imbalance can be seen in Figure 6a, where the first type of ordinary bubbles is much larger than the second type of edge irregularity bubbles, Figure 6b where the central point can be seen to be relatively concentrated, and Figure 6c where the defects are of different sizes.

4.3. Evaluation Indicators

In this paper, Precision, Mean Average Precision (mAP), GFLOPs, and Weight are used as model evaluation metrics for the IGBT solder layer defect detection task. The accuracy rate represents the ratio of the number of defects (TP) correctly predicted by the model to the total number of defects (TP + FP) predicted for a certain category, as shown in Equation (12). The mAP, which combines the accuracy and completeness rates, is calculated as follows Equations (13) to (15), where n is the total number of categories, A P ( i ) is the detection accuracy of a certain category of defects, can effectively express the recognition ability of the detection model. The computational volume and model size reflect the complexity of the model from different aspects, respectively, and all the above four metrics are positively correlated with the detection effect.
P = T P T P + F P
R = T P T P + F N
A P = 0 1 P ( R ) d R
m A P = 1 n i = 0 n A P ( i )

4.4. Analysis of Experimental Results

4.4.1. Comparison of Improved Model Results for YOLOv5 Base Model

To further verify the universality and effectiveness of the improved method proposed in this paper, the following five groups of comparison experiments were designed for the improved detection of defects in the solder layer of IGBT modules, and the comparison results are shown in Table 2.
According to the results of previous public dataset tests, the complexity of the target detection network structure is positively correlated with the detection effect. However, the experimental results show that too much convolution operation and too deep a network structure are not suitable for solder layer bubble defects with non-uniform size and irregular distribution. As can be seen from Table 2, the improvement strategies proposed in this paper are optimized in all five base models, and in terms of mAP in YOLOv5n, YOLOv5s, YOLOv5m, YOLOv5l, and YOLOv5x are improved by 5.6%, 5%, 3%, 2%, and 2.2%, respectively, proving that the improvement methods mentioned in this paper effectively enhance the detection performance of the models. Overall, YOLOv5n_SEST performs better in all aspects of industrial application conditions where accuracy, recognition performance, and lightness are required.

4.4.2. Improved Model Comparison Experiments

To better demonstrate the benefits of the improved model on the IGBT dataset, each improvement point will be validated separately below:
  • To verify the superiority of the C3STR module, the following comparison experiments were carried out between it and the classical attention module. To ensure fairness in the experiments, all experiments were carried out at the same location based on the addition of a small target detection layer and the results are shown in Table 3. The results show that the CSTR module proposed in this paper improves the detection accuracy by 7.4%, 5.7%, 6.2% and 9.9% over the CA [43] module, SE module [44], CBAM [45] module and C3CBAM module, respectively, which is because C3STR combines the advantages of Swin Transformer Blocks and retains the maximum features based on Improved detection.
  • Performance analysis of the number of C3STR settings was carried out to compare the effect of different numbers on the performance of the IGBT solder layer defect detection model, and the experimental design gradually replaced the C3 module when the detection results were compared, and the results are shown in Table 4. Experimental results show that replacing a C3 module gives the greatest accuracy gain at a minimal cost.
  • In order to verify the effectiveness of the EIoU loss function for the dataset of this paper, the following experiments will be compared with the loss functions of DIoU, GIoU, CIoU and AlphaIoU, and the results are shown in Table 5. The experimental results show that the EIoU loss function improves the detection accuracy by 3%, 2.3%, 1% and 2.8%, respectively, compared with other loss functions, proving its indispensable advantage for sample imbalanced data sets.

4.4.3. Ablation Experiments

To further prove the effectiveness of the proposed improvement method in this paper and to explore the effectiveness and relevance of each improvement method, seven sets of ablation experiments were designed based on YOLOv5n, and each set of experiments uses the same initial conditions as well as data sets, the results of the ablation experiments are shown in Table 6.
As can be seen from Table 6, the addition of the small target detection layer improves mAP by 3.6% and accuracy by 0.7%, proving a large improvement in the detection of small target bubbles, as well as dense edge bubbles. Modifying the bounding box loss function has almost no change in the size of the model and the amount of computation, but different bounding box loss functions for different datasets have different effects, as well as for the sample imbalance. The EIoU loss function for the dataset used in this paper improves the mAP by 1.8%; after introducing the C3STR module, the mAP improves by 2.3%, which strongly demonstrates the feasibility of the Swin Transformer backbone network in the field of target detection; finally, by fusing the three improvements, the mAP is improved by 5.6%, which is a great improvement for the detection of small target dense bubble defects in IGBT module solder layers.

4.4.4. Performance Comparison Experiments

To further reflect the detection performance of the improved model in this paper, it is compared with various mainstream target detection models on the data set collected in this paper, and the comparison results are shown in Table 7.
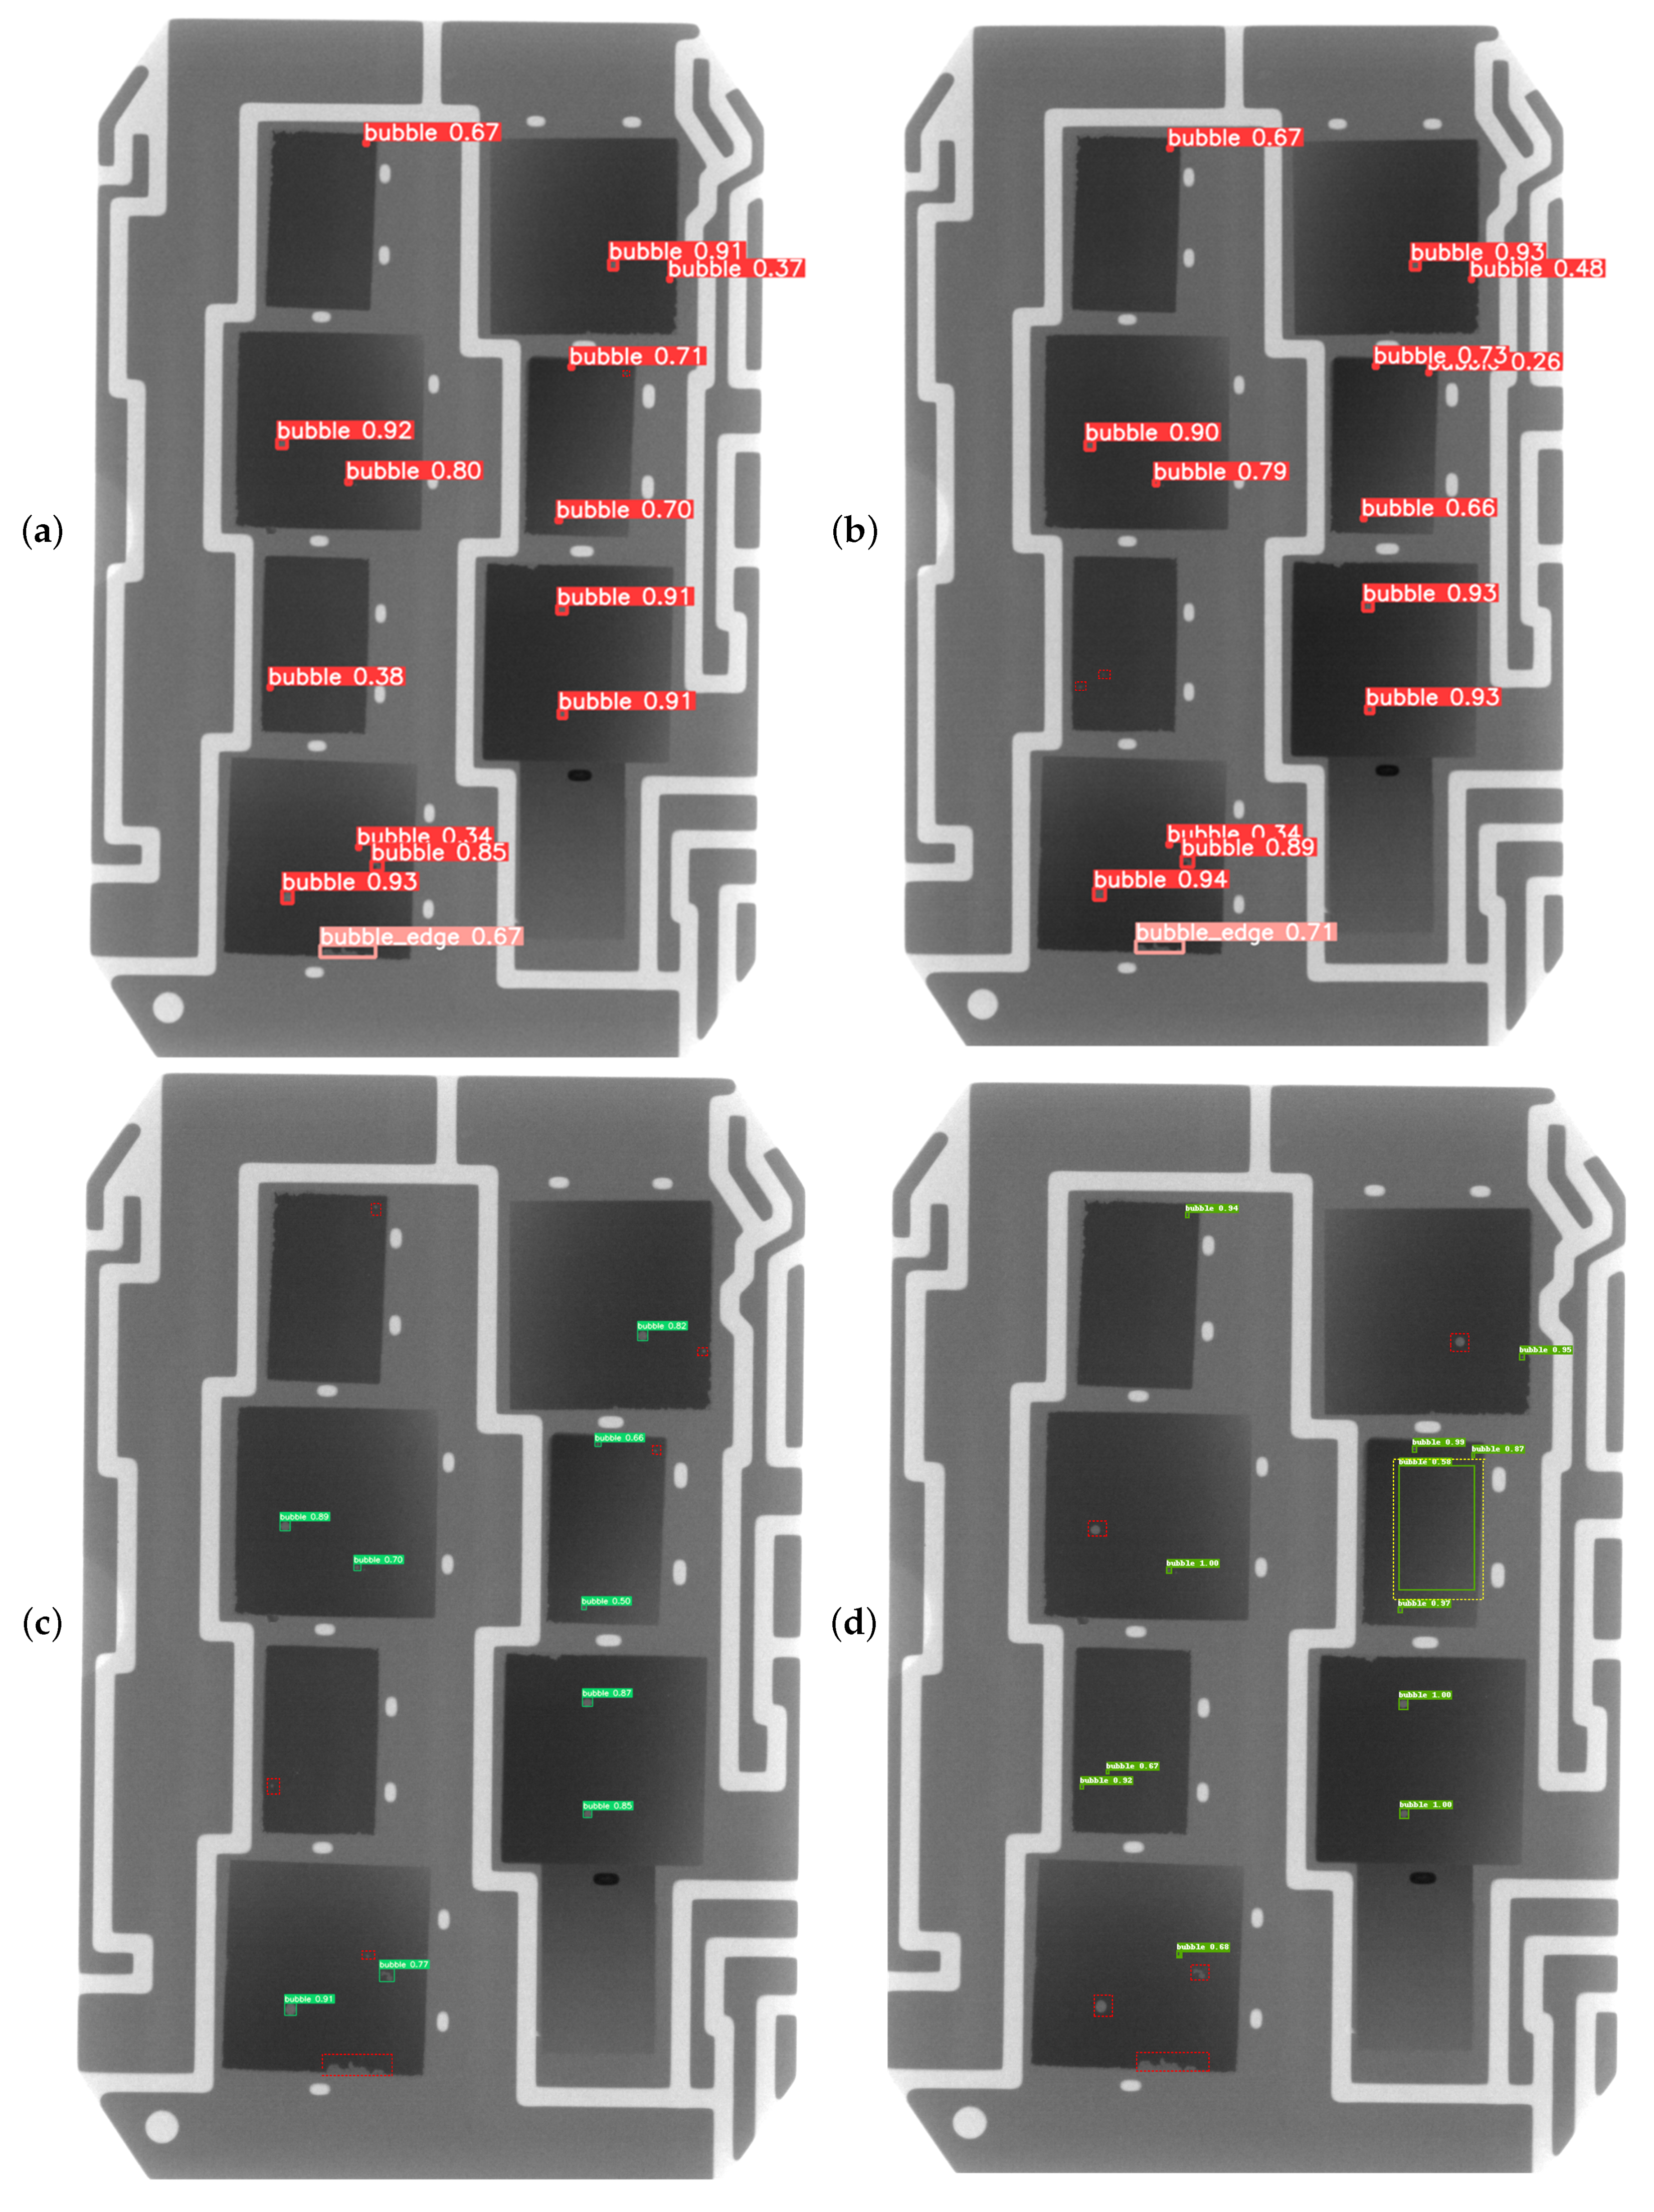
As can be seen from Table 7, YOLOv5n_SEST has a significant advantage over most models not only in terms of accuracy but also in terms of detection speed. Although the model size compared to the PPYOLO_Tiny model is slightly larger, it has an irreplaceable advantage in terms of detection accuracy and speed. To further verify the superiority of the performance of the improved model, the top four models in Table 7, Faster R-CNN, Mask R-CNN, Cascade R-CNN, YOLOv7 [46], and YOLOv5n are selected for visual comparison with YOLOv5_SEST, and the comparison results are shown in Figure 7, it shows that the improved method based on the anchor box can better distinguish the background from the target, reduce the interference of background information, and lower the rate of missed detection; the other models have more or less missed detection and false detection.
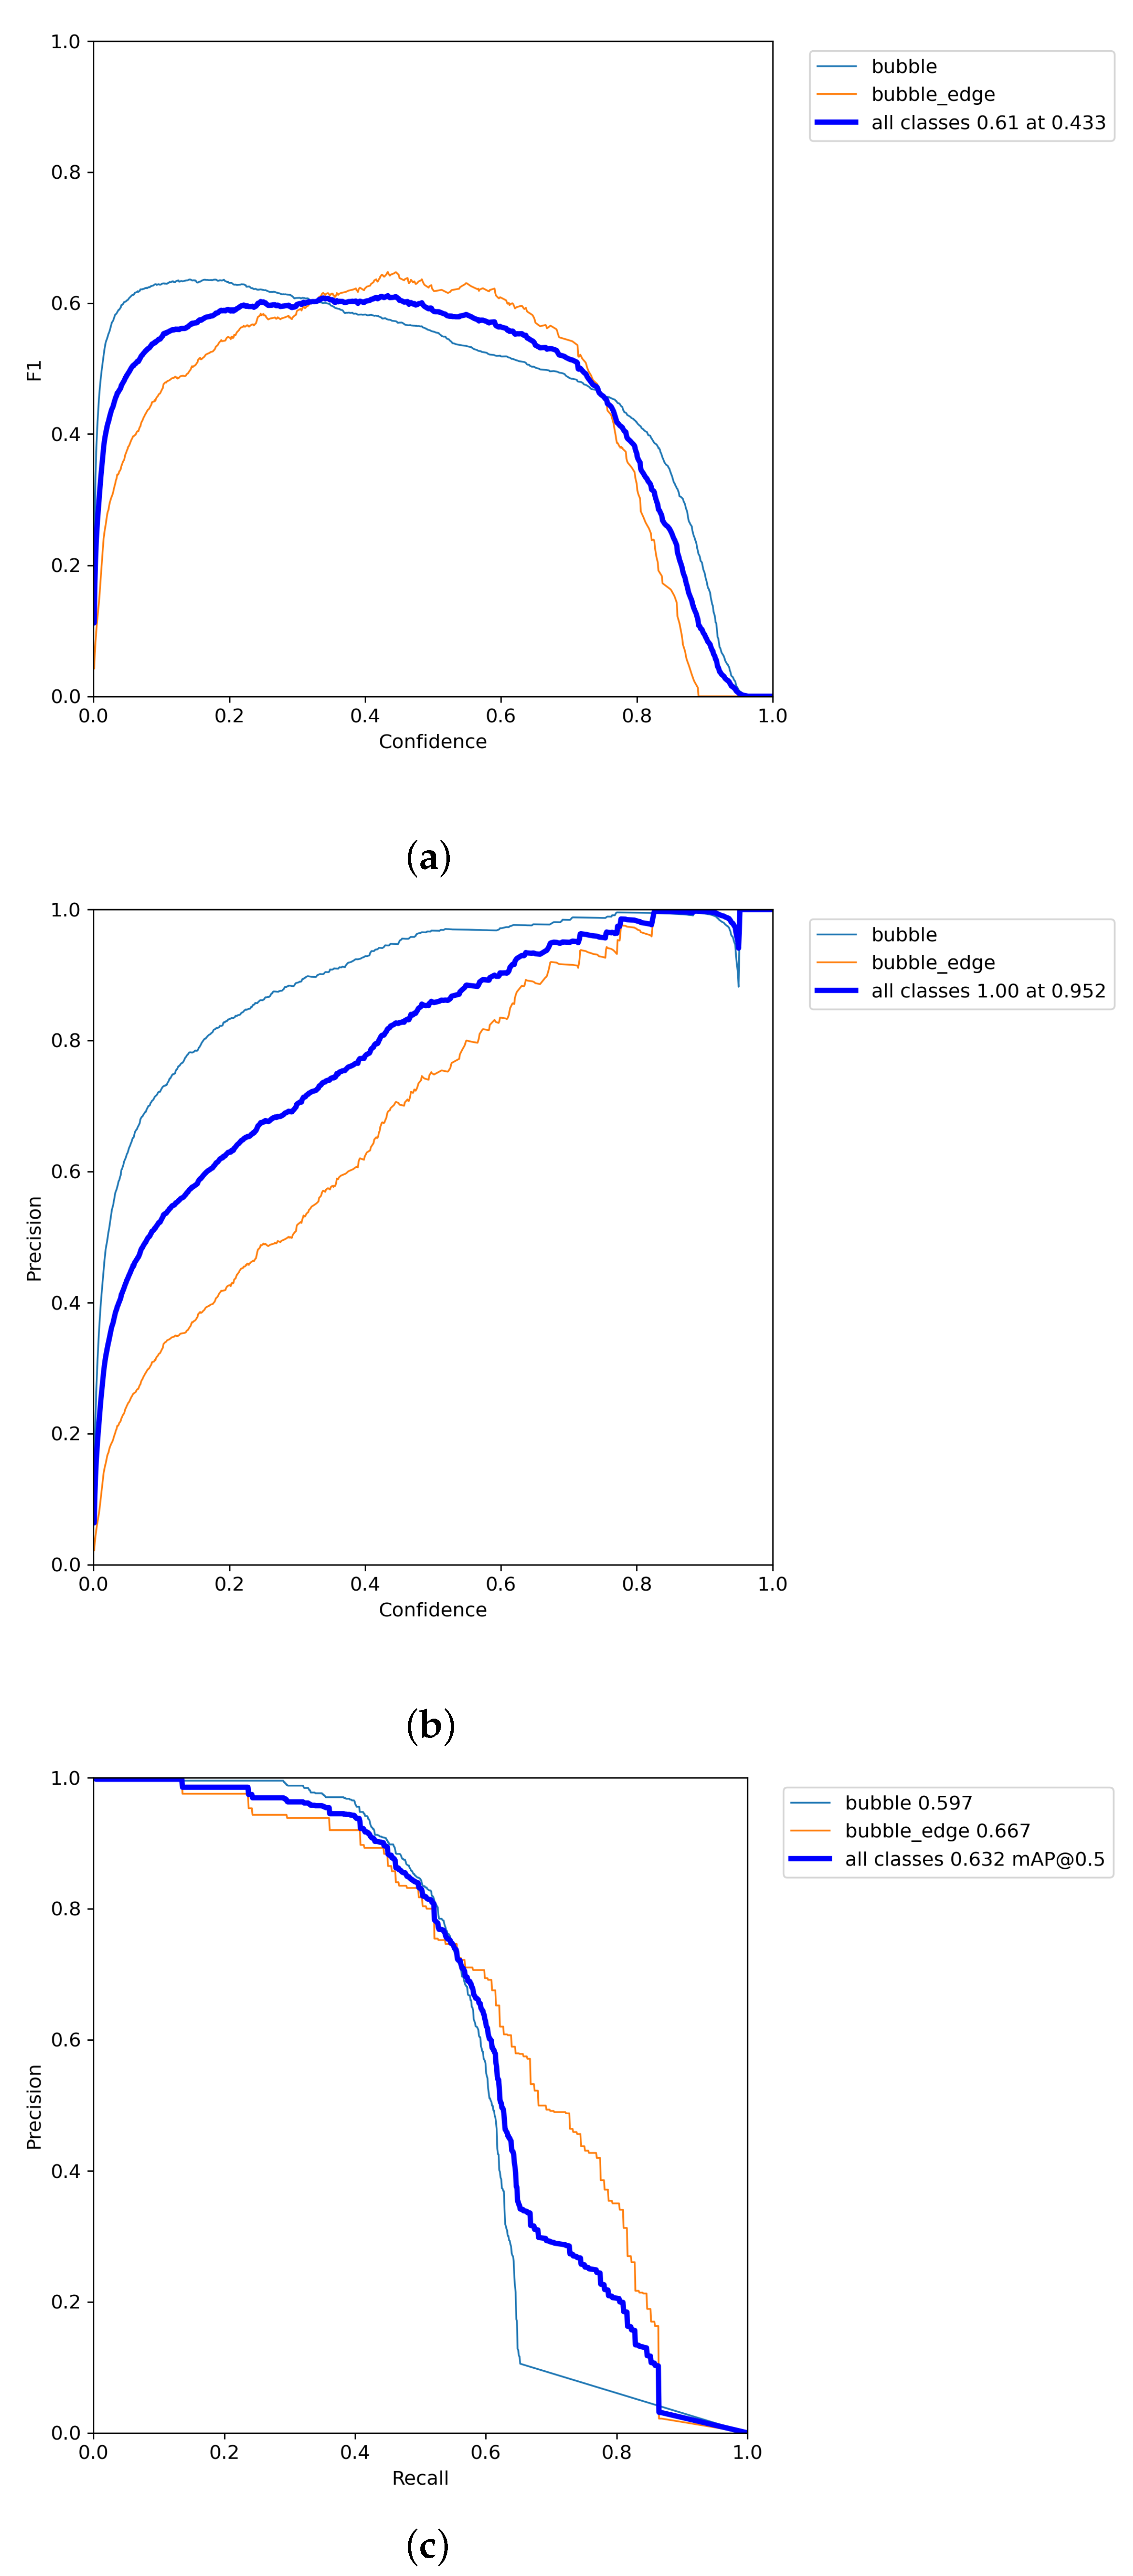
Since YOLOv5n itself is a very small model, the addition of the small target detection layer and the fused C3STR module does not increase its size to an unacceptable level, and its model time and space complexity makes the model less demanding for the hardware environment when detecting so that it can be well applied to the IGBT industrial inspection site. Table 8 shows the YOLOv5n_SEST model-specific performance details, it can be seen that for the first category of ordinary bubbles accuracy reached 94.5%, the second category of unconventional bubbles only reached 76.3%, which shows that the second category of unconventional bubbles is a breakthrough point. From Figure 7a for the YOLOv5n_SESTR detection effect graph, it can be seen that the effect near the edge of the general because the first category and the second category have similar places difficult to distinguish, but the overall effect is suitable for industrial detection. The specific performance analysis of the model in this paper is shown in Figure 8, where (a) shows the relationship between the reconciled average functions of model accuracy and recall and the confidence level, (b) represents the graph line of the relationship between accuracy and confidence level, (c) represents the relationship between model accuracy and recall, and (d) represents the relationship between model recall and confidence level.

4.4.5. NEU-DET Dataset Validation

We selected the open-source dataset NEU-DET to verify the generality of the improved algorithm proposed in this paper. The model training parameters are set as in Section 4.1, and the experimental results are shown in Table 9. The NEU-DET dataset is a strip surface defect dataset published by Northeastern University, which collects six typical surface defects of the hot-rolled strip: crazing, inclusion, patches, pitted, rolled, and scratches. A total of 1800 grayscale images, containing 300 samples for each type of defect. Table 9 shows that the improved model proposed in this paper improves the mAP of all defects by 1.8% compared with the original YOLOv5n, which verifies the generality of the proposed model.

5. Conclusions

In this paper, for the IGBT module solder layer bubble defect detection task, two types of IGBT module solder layer bubble defect data sets are collected and labeled, and an improved algorithm based on YOLOv5, the YOLOv5n_SEST model, is proposed. A detection layer for small target bubbles is added, which effectively detects more tiny bubbles. For the problem of unbalanced samples in the data set, the bounding box loss function is improved to improve the comprehensive detection effect of the model. For improving the detection capability capacity of bubble defects capability, the C3STR module is added to the backbone network; Swin Transformer Blocks are used to construct multi-layer feature maps; and the self-attention is restricted to the moving window to ensure that the computational effort is within the controllable range to achieve efficient feature extraction. The experimental results show that the improved model achieves 94.5% accuracy for common bubble defects, 85.4% accuracy for all defects, 5.6% improvement in mAP, and 110 f/s speed. The algorithm can well perform the task of real-time detection of industrial IGBT solder layer defects, ensuring the detection speed of the one-stage algorithm and improving the accuracy of the YOLOv5 model. The algorithm can well perform the task of real-time detection of industrial IGBT solder layer defects, ensuring the detection speed of the one-stage algorithm and improving the accuracy of the YOLOv5 model.
The degradation of the detection performance for irregular and dense bubbles at the edges is a limitation of the model. Therefore, we will continue to explore and optimize the performance of this model for edge bubbles, study the algorithms that are universally applicable to various industrial fields, and promote the application of artificial intelligence in unmanned quality inspection and intelligent inspection processes in the future.
Author Contributions

Conceptualization, Q.L. and X.L.; Data curation, Q.L. and Y.Z.; Formal analysis, K.N.; Funding acquisition, X.L.; Investigation, Q.L. and K.N.; Methodology, Q.L.; Project administration, Q.L.; Software, Q.L.; Supervision, K.N.; Validation, Y.Z.; Visualization, Q.L.; Writing—original draft, Q.L.; Writing—review & editing, Q.L., X.L. and Y.Z. All authors have read and agreed to the published version of the manuscript.

Funding

This research was funded by Sichuan Science and Technology Program (No. 2017GZ0303), Sichuan Academician (Expert) Workstation Fund Project (No. 2016YSGZZ01), Special Funding for High-level New Talent Training (No. B12402005), and Talent Introduction Project of Sichuan University of Light Chemical Industry (No. 2021RC16).

Institutional Review Board Statement

Not applicable.

Informed Consent Statement

Not applicable.

Data Availability Statement

Not applicable.

Conflicts of Interest

The authors declare no conflict of interest.

References

  1. Iwamuro, N.; Laska, T. IGBT History, State-of-the-Art, and Future Prospects. IEEE Trans. Electron Devices 2017, 64, 741–752. [Google Scholar] [CrossRef]
  2. Qian, Z.; Zhang, J.; Sheng, K. Status and Development of Power Semiconductor Devices and Its Applications. Zhongguo Dianji Gongcheng Xuebao/Proc. Chin. Soc. Electr. Eng. 2014, 34, 5149–5161. [Google Scholar]
  3. Zhou, D.; Blaabjerg, F.; Franke, T.; Tonnes, M.; Lau, M. Comparison of Wind Power Converter Reliability With Low-Speed and Medium-Speed Permanent-Magnet Synchronous Generators. IEEE Trans. Ind. Electron. 2015, 62, 6575–6584. [Google Scholar] [CrossRef]
  4. Liu, G.; Huang, J.; Tang, R. Development of High Voltage and High Current (4500V/600A) IGBT Chip. J. Electrotech. Technol. 2021, 38, 4855–4862. [Google Scholar]
  5. Ren, N.; Hu, H.; Lyu, X.; Wu, J.; Xu, H.; Li, R.; Zuo, Z.; Wang, K.; Sheng, K. Investigation on single pulse avalanche failure of SiC MOSFET and Si IGBT. Solid-State Electron. 2019, 152, 33–40. [Google Scholar] [CrossRef]
  6. Yaqub, I.; Li, J.; Johnson, C.M. Dependence of overcurrent failure modes of IGBT modules on interconnect technologies. Microelectron. Reliab. 2015, 55, 2596–2605. [Google Scholar] [CrossRef]
  7. Tang, G.; Pang, H.; He, Z. Development and application of advanced AC and DC technology in China. Chin. J. Mech. Electr. Eng. 2016, 36, 12. [Google Scholar]
  8. Yang, S.; Bryant, A.; Mawby, P.; Xiang, D.; Ran, L.; Tavner, P. An Industry-Based Survey of Reliability in Power Electronic Converters. IEEE Trans. Ind. Appl. 2011, 47, 1441–1451. [Google Scholar] [CrossRef]
  9. Oh, H.; Han, B.; McCluskey, P.; Han, C.; Youn, B.D. Physics-of-Failure, Condition Monitoring, and Prognostics of Insulated Gate Bipolar Transistor Modules: A Review. IEEE Trans. Power Electron. 2015, 30, 2413–2426. [Google Scholar] [CrossRef]
  10. Tan, L.; She, C.; Liu, P.; Tao, Y. Research progress on failure mechanism of IGBT module solder layer. Electron. Components Mater. 2020, 39, 15–21. [Google Scholar]
  11. Falck, J.; Felgemacher, C.; Rojko, A.; Liserre, M.; Zacharias, P. Reliability of Power Electronic Systems: An Industry Perspective. IEEE Ind. Electron. Mag. 2018, 12, 24–35. [Google Scholar] [CrossRef] [Green Version]
  12. Fischer, K.; Pelka, K.; Bartschat, A.; Tegtmeier, B.; Wenske, J. Reliability of Power Converters in Wind Turbines: Exploratory Analysis of Failure and Operating Data From a Worldwide Turbine Fleet. IEEE Trans. Power Electron. 2018, 34, 6332–6344. [Google Scholar] [CrossRef]
  13. Wu, Y.; Chang, G.; Peng, Y.; Fang, J.; Tang, L.; Li, W. Effect of Solder Layer Porosity on Thermal Stress of IGBT Modules. High Power Convert. Technol. 2014, 36, 17–23. [Google Scholar]
  14. D’Orazio, T.; Leo, M.; Distante, A.; Guaragnella, C.; Pianese, V.; Cavaccini, G. Automatic ultrasonic inspection for internal defect detection in composite materials. NDT E Int. 2008, 41, 145–154. [Google Scholar] [CrossRef]
  15. Ren, S.; He, K.; Girshick, R.; Sun, J. Faster R-CNN: Towards Real-Time Object Detection with Region Proposal Networks. IEEE Trans. Pattern Anal. Mach. Intell. 2017, 39, 1137–1149. [Google Scholar] [CrossRef] [PubMed]
  16. He, K.; Gkioxari, G.; Dollár, P.; Girshick, R. Mask R-CNN. In Proceedings of the 2017 IEEE International Conference on Computer Vision (ICCV), Venice, Italy, 22–29 October 2017; pp. 2980–2988. [Google Scholar] [CrossRef]
  17. Cai, Z.; Vasconcelos, N. Cascade R-CNN: Delving Into High Quality Object Detection. In Proceedings of the 2018 IEEE/CVF Conference on Computer Vision and Pattern Recognition, Salt Lake City, UT, USA, 18–23 June 2018; pp. 6154–6162. [Google Scholar] [CrossRef] [Green Version]
  18. Redmon, J.; Divvala, S.; Girshick, R.; Farhadi, A. You Only Look Once: Unified, Real-Time Object Detection. In Proceedings of the 2016 IEEE Conference on Computer Vision and Pattern Recognition (CVPR), Las Vegas, NV, USA, 27–30 June 2016; pp. 779–788. [Google Scholar] [CrossRef] [Green Version]
  19. Redmon, J.; Farhadi, A. YOLO9000: Better, Faster, Stronger. In Proceedings of the 2017 IEEE Conference on Computer Vision and Pattern Recognition (CVPR), Honolulu, HI, USA, 21–26 July 2017; pp. 6517–6525. [Google Scholar] [CrossRef] [Green Version]
  20. Liu, W.; Anguelov, D.; Erhan, D.; Szegedy, C.; Reed, S.; Fu, C.Y.; Berg, A.C. SSD: Single Shot MultiBox Detector. In Lecture Notes in Computer Science, Proceedings of the Computer Vision—ECCV 2016, Amsterdam, The Netherlands, 11–14 October 2016; Leibe, B., Matas, J., Sebe, N., Welling, M., Eds.; Springer International Publishing: Cham, Switzerland, 2016; pp. 21–37. [Google Scholar]
  21. Lin, T.Y.; Goyal, P.; Girshick, R.; He, K.; Dollár, P. Focal Loss for Dense Object Detection. In Proceedings of the 2017 IEEE International Conference on Computer Vision (ICCV), Venice, Italy, 22–29 October 2017; pp. 2999–3007. [Google Scholar] [CrossRef] [Green Version]
  22. Zhou, X.; Zhuo, J.; Krähenbühl, P. Bottom-Up Object Detection by Grouping Extreme and Center Points. In Proceedings of the 2019 IEEE/CVF Conference on Computer Vision and Pattern Recognition (CVPR), Long Beach, CA, USA, 15–20 June 2019; pp. 850–859. [Google Scholar] [CrossRef] [Green Version]
  23. Tian, Z.; Shen, C.; Chen, H.; He, T. FCOS: Fully Convolutional One-Stage Object Detection. In Proceedings of the 2019 IEEE/CVF International Conference on Computer Vision (ICCV), Seoul, Korea, 27 October–2 November 2019; pp. 9626–9635. [Google Scholar] [CrossRef] [Green Version]
  24. Skontranis, M.; Sarantoglou, G.; Deligiannidis, S.; Bogris, A.; Mesaritakis, C. Time-Multiplexed Spiking Convolutional Neural Network Based on VCSELs for Unsupervised Image Classification. Appl. Sci. 2021, 11, 1383. [Google Scholar] [CrossRef]
  25. Kim, T.H.; Kim, S.; Hong, K.; Park, J.; Youn, S.; Lee, J.H.; Park, B.G.; Kim, H. Effect of Program Error in Memristive Neural Network With Weight Quantization. IEEE Trans. Electron Devices 2022, 69, 3151–3157. [Google Scholar] [CrossRef]
  26. Chakraborty, I.; Roy, D.; Roy, K. Technology Aware Training in Memristive Neuromorphic Systems for Nonideal Synaptic Crossbars. IEEE Trans. Emerg. Top. Comput. Intell. 2018, 2, 335–344. [Google Scholar] [CrossRef]
  27. Xu, X.; Zhao, M.; Shi, P.; Ren, R.; He, X.; Wei, X.; Yang, H. Crack Detection and Comparison Study Based on Faster R-CNN and Mask R-CNN. Sensors 2022, 22, 1215. [Google Scholar] [CrossRef]
  28. Guo, L.; Duan, H.; Zhou, W.; Tong, G.; Wu, J.; Ou, X.; Li, W. Surface defect detection algorithm of magnetic tile based on Mask R-CNN. Comput. Integr. Manuf. Syst. 2022, 28, 1393–1400. [Google Scholar]
  29. Guo, L.; Li, Y.; Huang, F.; Qian, F. Faster-RCNN Part Defect Detection Based on Guided Anchoring Algorithm. Mech. Des. Manuf. 2022, 374, 160–164. [Google Scholar]
  30. Yao, J.; Qi, J.; Zhang, J.; Shao, H.; Yang, J.; Li, X. A Real-Time Detection Algorithm for Kiwifruit Defects Based on YOLOv5. Electronics 2021, 10, 1711. [Google Scholar] [CrossRef]
  31. Wang, S.; Dong, W.; Huang, J.; Wang, N. YOLOv5-based tile surface defect detection. Packag. Eng. 2022, 43, 217–224. [Google Scholar]
  32. Li, W.; Li, X.; Yan, H. PCB defect detection based on improved YOLO v3. Electro-Opt. Control 2022, 29, 106–111. [Google Scholar]
  33. Tan, S.; Bie, X.; Lu, G.; Tan, X. Real-time detection of human mask wearing based on YOLOv5 network model. Laser Mag. 2021, 42, 147–150. [Google Scholar]
  34. Zheng, Z.; Wang, P.; Liu, W.; Li, J.; Ye, R.; Ren, D. Distance-IoU Loss: Faster and Better Learning for Bounding Box Regression. In Proceedings of the AAAI Conference on Artificial Intelligence, New York, NY, USA, 7–12 February 2019. [Google Scholar]
  35. Liu, S.; Qi, L.; Qin, H.; Shi, J.; Jia, J. Path Aggregation Network for Instance Segmentation. In Proceedings of the 2018 IEEE/CVF Conference on Computer Vision and Pattern Recognition (CVPR), Salt Lake City, UT, USA, 18–23 June 2018. [Google Scholar]
  36. Shi, H. Research on Pedestrian Tracking and Trajectory Prediction on Urban Roads Based on Deep Learning. Master’s Thesis, Xi’an University of Technology, Xi’an, China, 2021. [Google Scholar]
  37. Zhao, M. Detection and Analysis of Traffic Congestion Status Based on Deep Learning. Master’s Thesis, Guizhou University, Guiyang, China, 2020. [Google Scholar]
  38. Tian, F.; Jia, H.; Liu, F. Improved YOLOv5 for small target detection in oilfield job site safety dressing. Comput. Syst. Appl. 2022, 31, 159–168. [Google Scholar]
  39. Lima, R.P.D.; Suriamin, F.; Marfurt, K.; Pranter, M.; Soreghan, G. Convolutional Neural Networks. In AAPG Explorer; Apress: Berkeley, CA, USA, 2018; pp. 63–78. [Google Scholar] [CrossRef]
  40. Lee, J.; Yoon, W.; Kim, S.; Kim, D.; Kim, S.; So, C.H.; Kang, J. BioBERT: A pre-trained biomedical language representation model for biomedical text mining. Bioinformatics 2019, 36, 1234–1240. [Google Scholar] [CrossRef] [Green Version]
  41. Liu, Z.; Lin, Y.; Cao, Y.; Hu, H.; Wei, Y.; Zhang, Z.; Lin, S.; Guo, B. Swin Transformer: Hierarchical Vision Transformer using Shifted Windows. In Proceedings of the IEEE/CVF International Conference on Computer Vision, Montreal, QC, Canada, 10–17 October 2021; pp. 1234–1240. [Google Scholar]
  42. Ran, R.; Xu, X.; Qiu, S.; Cui, X.; Ouyang, F. A Survey of Crack Detection Methods Based on Deep Convolutional Neural Networks. Comput. Eng. Appl. 2021, 57, 13. [Google Scholar]
  43. Hou, Q.; Zhou, D.; Feng, J. Coordinate Attention for Efficient Mobile Network Design. In Proceedings of the IEEE/CVF Conference on Computer Vision and Pattern Recognition, Nashville, TN, USA, 20–25 June 2021; pp. 13713–13722. [Google Scholar]
  44. Hu, J.; Shen, L.; Albanie, S.; Sun, G.; Wu, E. Squeeze-and-Excitation Networks. IEEE Trans. Pattern Anal. Mach. Intell. 2020, 42, 2011–2023. [Google Scholar] [CrossRef]
  45. Woo, S.; Park, J.; Lee, J.Y.; Kweon, I.S. CBAM: Convolutional Block Attention Module. In Proceedings of the European Conference on Computer Vision, Munich, Germany, 8–14 September 2018; pp. 3–19. [Google Scholar]
  46. Wang, C.Y.; Bochkovskiy, A.; Liao, H. YOLOv7: Trainable bag-of-freebies sets new state-of-the-art for real-time object detectors. arXiv 2022, arXiv:2207.02696. [Google Scholar]
Figure 1. The overall structure of the YOLOv5 network.
Applsci 12 11469 g001
Figure 2. Mosaic data augmentation process.
Applsci 12 11469 g002
Figure 3. YOLOv5_SEST complete network structure.
Applsci 12 11469 g003
Figure 4. Swin Transformer Blocks.
Applsci 12 11469 g004
Figure 5. IGBT image: (a) Original IGBT image; (b) Preprocessed IGBT image; (c) IGBT module labeling status.
Applsci 12 11469 g005
Figure 6. Dataset analysis: (a) Defect class distribution; (b) Location distribution of defect center points; (c) Defect size distribution.
Applsci 12 11469 g006aApplsci 12 11469 g006b
Figure 7. Comparison of detection effects.Where the red dashed boxes represent missed detection targets and the yellow dashed boxes represent false detection targets. The yellow dashed boxes represent the false detection targets. (a) YOLOv5n_SEST; (b) YOLOv5n; (c) YOLOv7; (d) Faster R-CNN; (e) Mask R-CNN; (f) Cascade R-CNN.
Applsci 12 11469 g007aApplsci 12 11469 g007b
Figure 8. Model performance analysis: (a) F1_curve; (b) P_curve; (c) PR_curve; (d) R_curve.
Applsci 12 11469 g008aApplsci 12 11469 g008b
Table 1. Parameter settings.
NameValue
Learning rate0.01
Momentum0.937
Weight decay0.0005
Batch size16
Epochs2000
size of picture640 × 640
Table 2. Comparison of YOLOv5 basic network model and improved model results.
ModelPrecision%mAP%GFLOPs/MWeight/M
YOLOv5n81.357.94.23.9
YOLOv5n_SEST85.463.517.75.3
YOLOv5s81.758.215.814.5
YOLOv5s_SEST74.163.269.817.5
YOLOv5m83.559.948.042.2
YOLOv5m_SEST77.862.9272.552.7
YOLOv5l75.960.7107.892.9
YOLOv5l_SEST80.062.7690.6118.7
YOLOv5x75.161.3204.0173.2
YOLOv5x_SEST84.863.51401.6225.4
Table 3. Performance comparison of C3STR with common attention modules.
ModelPrecision%mAP%GFLOPs/MWeight/M
YOLOv5n6_CA80.156.15.66.8
YOLOv5n6_SE78.457.84.34.1
YOLOv5n6_CBAM68.857.34.234.0
YOLOv5n6_C3CBAM71.253.657.08.0
YOLOv5_SEST85.463.517.75.3
Table 4. Performance comparison of test results with different numbers of C3STR.
ModelNumber of C3STR%Precision%mAP%GFLOPs/MWeight/M
YOLOv5n_C3STR185.463.517.75.3
YOLOv5n_C3STR274.161.118.18.0
YOLOv5n_C3STR371.453.657.010.0
YOLOv5n_C3STR478.260.171.320.2
Table 5. Performance comparison of different loss function detection results.
ModelPrecision%mAP%GFLOPs/MWeight/M
YOLOv5n_DIoU64.859.57.85.1
YOLOv5n_GIoU70.660.27.85.1
YOLOv5n_CIoU70.761.57.85.1
YOLOv5n_AlphaIoU66.159.77.85.1
YOLOv5n_EIoU78.462.57.85.1
Table 6. Ablation experiment results. Where, Small_D indicates the small target detection layer structure proposed in this paper, EIOU indicates the change to the EIoU loss function applicable to the sample imbalance data, and C3STR indicates the introduction of the new C3 module that combines the C3 module with Swin Transformer in this paper. “✓” indicates that the improvement scheme is cited, and blank indicates that it is not cited.
GroupSmall_D%EIoU%C3STR%Precision%mAP%GFLOPs/MWeight/M
1 8261.57.85.1
2 81.459.74.23.9
3 81.760.214.14.1
4 82.161.57.85.1
5 82.561.317.75.4
6 81.860.714.14.1
785.463.517.75.4
Table 7. Comparison of different model experiments.
ModelmAP%Weight/MFPS (f/s)
Faster_rcnn_r5042.67125.04.83
SSD_r3424.247.415.46
Fcos12.3127.411.66
PPYOL_Tiny19.233.836.28
Mask_rcnn36.2133.00.78
Cascade_rcnn37.5262.811.96
YOLOv746.1274.871.42
YOLOv5n_SEST63.55.4110.00
Table 8. YOLO5n_SEST specific performance.
ModelPrecision %(Bubble)Precision% (Bubble_Edge)Precision% (All)mAP%
YOLO5n_SEST94.576.385.463.5
Table 9. Comparison of detection results in the NEU-DET dataset.
ModelAP%mAP%Weight/M
CrInPaPsRsSC
YOLOv5n44.282.792.384.362.988.175.83.9
YOLOv5n_SEST50.486.691.684.359.992.777.64.5
Publisher’s Note: MDPI stays neutral with regard to jurisdictional claims in published maps and institutional affiliations.