Article

Micro-Computed Tomography with 3D Image Analysis to Reveal Firing Temperature Effects on Pore Systems in Archaeological and Ethnographic Ceramics

1
Center for Historic Architecture and Design, University of Delaware, Newark, DE 19716, USA
2
Biomedical Research Informatics Center, Nemours Children’s Hospital, Wilmington, DE 19803, USA
*
Author to whom correspondence should be addressed.
Appl. Sci. 2022, 12(22), 11448; https://doi.org/10.3390/app122211448
Submission received: 1 October 2022 / Revised: 4 November 2022 / Accepted: 8 November 2022 / Published: 11 November 2022
(This article belongs to the Special Issue Application of X-ray Computed Tomography)

Abstract

:

Featured Application

Ceramic pore network characterization, ceramic firing temperature studies.

Abstract

Understanding the firing regimes of archaeological ceramics reveals clues about the history of technological developments, but current methods for determining firing history have limitations. We experimented with non-destructive micro-CT combined with 3D image analysis to collect data on 42 pore variables, hypothesizing that pore systems are affected by ceramic firing temperatures. Analysis of variance showed that 26 of the variables are significantly related to firing temperature. Total volume porosity (open and closed pores) goes down with increased firing temperature, as does the fraction of pores accessible to a surface. Maximum pore volume, maximum and standard deviation of pore surface area, and pore elongation measures all decrease with higher firing temperatures while shape factors indicating greater sphericity increase. Pore connectivity measures decrease with higher firing temperatures, and variation in pore and connection lengths increases. The highest fired ceramics have low connection tortuosity. Three-dimensional image analysis of micro-CT data can augment existing methods of archaeothermometry, and since many pore characteristics impact the functional properties of ceramics (density, durability, mechanical strength, thermal conductivity, permeability, and diffusion), firing temperature studies of pore systems can inform wider archaeological ceramics research.

1. Introduction

The firing temperatures of ancient and historic ceramics are important to archaeologists as indicators of developments in firing technologies, kilns, and ceramic production. This field of study has been termed archaeothermometry [1,2,3]. Interpretations are complicated because porosity is affected by the raw material choices of potters, the rate of temperature rise, the time maintained at peak temperature, the rate of cooling, the total duration of firing, and the conditions during firing (oxidizing, reducing, or mixed). Therefore, analysts usually propose an upper range rather than a precise temperature [4,5].
Current methods for estimating firing temperatures of archaeological ceramics are often problematic [6] and firing-temperature studies tend to be less common in the archaeological literature compared to other research goals. Micro-computed tomography (micro-CT) combined with 3D image analysis to study pore systems in archaeological ceramics is a promising approach for investigating firing temperatures and firing effects on microstructures and on the functional properties of ceramic materials. The initial research presented here is intended to provide a base for further investigations that will help expand the tools and approaches available to archaeological scientists.
The most common current approach to estimating ceramic firing temperatures is to study the mineralogy of archaeological sherds. Techniques such as thin-section petrography, scanning electron microscopy, X-ray diffraction, FTIR spectroscopy, or thermal analysis methods are often employed to study the degree of vitrification of the ceramic matrix, changes in minerals known to decompose or alter at certain temperatures, and the presence of minerals that form in ceramic materials at high temperatures [7,8,9,10,11,12,13,14,15,16,17,18,19]. Sometimes, sherd fragments are refired in the laboratory and any changes in mineralogy and microstructure at specific temperatures are noted [20,21,22,23,24]; the appearance after incremental temperature increases is compared to the original sherds to identify the point at which the original temperature has been exceeded [25,26]. Alternatively, potential raw materials are fired at incremental temperatures and the material transformations are studied [25,27,28]. Another approach is to use thermal expansion measurements to estimate firing temperatures [2,29]. These methods can be problematic. Experimental firings used for temperature estimations may not match actual firing temperatures [30], and a complex array of variables can affect ceramic microstructure and appearance [6].
Measurements of total open porosity are also used to estimate firing temperatures [20], with lower percentages tending to correspond to higher firing temperatures [31]. As the temperature rises, the clay matrix begins to sinter and vitrify, causing pores to shrink [1,32] and a decrease in open porosity with a higher proportion of isolated and closed pores [33]. The size and shape of pores are also affected by a combination of raw materials and firing temperatures. For example, lower-fired wares may have added organic material that burns out or carbonates that decompose leaving large irregular pores, whereas fine-grained materials fired at high temperatures may develop small, rounded pores [1] (Figure 1). A few experiments have looked at changes in pore size and homogeneity with temperature, and they have found that higher firing temperatures tend to result in a more homogeneous system of pores and a smaller average pore size [34]. Other experiments have shown that the amount, size, and shape of pores in a ceramic body can be an indication of the degree of vitrification and thus of firing temperature [35]. Park et al. [33] note that pore topology is a key variable in understanding ceramic firing technology and its effect on pore morphology and pore orientation during thermal expansion, sintering, and vitrification processes.
Porosity in archaeological ceramics is usually studied by thin-section petrography [16,18], scanning electron microscopy (SEM) [33], water [1,31] or liquid nitrogen absorption [36], or by mercury intrusion porosimetry (MIP) [34,37]. Each method has advantages but limitations, and none include the entire pore system and range of pore sizes [38,39]. The research presented here highlights how micro-CT combined with 3D image analysis has strong potential for archaeological ceramic pore studies.
Micro-CT is non-destructive, so if it is performed first on a sample, that same exact sample can then be used for any of the other methods used to study porosity or to estimate firing temperatures. It would be especially useful to make a thin section after the micro-CT imaging and combine porosity characterization with a study of mineralogy and matrix vitrification. A second advantage is that, unlike thin-section petrography and SEM analysis, micro-CT images show the full 3D pore networks. Finally, unlike many other techniques, the 3D image analysis of micro-CT scans provides quantitative data on many pore variables while also providing qualitative visual data, so it is possible to examine exactly where on the sample specific results are located.
Ricci [40] explored how micro-CT could be used to discern firing condition effects on ceramic materials. He notes that both particle packing and porosity features of the ceramic matrix are related to firing temperature, and that micro-CT can be used to study the total porosity of the ceramic material including closed and open pore systems. He used laboratory-made ceramic raw materials fired at temperatures ranging from 400–1000 °C and Early Medieval sherds from the Venetian Lagoon. He concluded that micro-CT imaging was a potentially useful approach to relate microstructure and pore distribution to firing temperature. Park et al. [33] also used pore characteristics observed in micro-CT images to deduce firing degree and conditions and found that firing temperatures and atmospheres affect pore shape and orientation. Micro-CT analysis of pores in archaeological ceramics has also been used for other goals, such as deducing fabrication methods or identifying total volume porosity [41,42,43,44,45,46,47,48]; it is also used, sometimes in combination with 3D image analysis, to analyze the porosity characteristics of related materials such as modern manufactured ceramics [49], bricks [38,50,51], and concrete [52].
In the experiments presented here, the focus is on examining the effects of firing temperature on ceramic pore systems with the data available through 3D image analysis of micro-CT images. The results are also used to examine how firing effects on pore systems may change the microstructure in ways that could influence the functional properties of archaeological ceramics such as density, durability, mechanical strength, thermal conductivity, permeability, and diffusion. Out of 42 variables analyzed, 26 were significantly associated with firing temperature. These include total volume porosity (open plus closed); the volume fraction of pores accessible to any ceramic surface; the ratio of pores accessible to a surface versus pores confined to the interior; many variables related to pore size and shape; and a variety of variables related to the nature of pore connectivity which were collected from sparse and dense graphs of pore networks and from pore network models.

2. Materials and Methods

2.1. Ceramic Sherds

Twelve sherds were selected to represent firing temperatures that range from 900 °C up to 1380 °C (Table 1). Two well-separated samples were cut from each sherd, so that within-sherd variability could be assessed. All samples were from sites in Asia, with most being from China. All had been previously studied by thin-section petrography and other methods. Likely firing temperatures were proposed based on firing temperature analyses performed on other sherds from those sites where available, using the traditional methods discussed above, or from the published literature.

2.2. Micro-CT Imaging

Micro-CT imaging was performed with a Rigaku GX130 instrument (cone beam geometry). Samples from the ceramic sherds were set on the Styrofoam support of a horizontal holder. For this instrument, the sample holder remains stationary while the flat-panel X-ray detector (FPD) rotates around it 360° and at uniformly distributed viewing angles collects magnified projection images (micro-focus X-ray source to the center of rotation, 120 mm; W target; 7 Mp FPD with 116.424 × 145.728 mm active area size; 49.5 µm pixel size; 2352 × 2944 pixels dimension; and 224 mm FPD to the center of rotation). To minimize image noise, each session began with a gain calibration to correct for any non-unform responses of detector pixels to X-ray exposure, followed by a 57 min instrument warm-up period. Scanning time for each sample was also 57 min. Image noise was further reduced by ensuring that the samples were no more than about twice the size of the field of view used for imaging.
All ceramics were imaged twice, once with a field of view of 10 × 10 mm and again with 5 × 5 mm. For both fields of view, the small focus spot size (5 µm) was used for high resolution. Phase contrast and hence image quality were optimized with voltage and source intensity settings of 130 kV and 61 µA, with a 0.06 mm Cu and 0.5 mm Al filter combination [66]. Three-dimensional reconstruction in the Rigaku software uses a filtered back projection reconstruction algorithm with a ring reduction filter. For fuller details on the instrument and settings, see Reedy and Reedy 2022 [51].
While the Rigaku GX130 has a nominal resolution of 4.5 µm, the best actual spatial resolution achievable is 10 µm, using a 5 × 5 mm field of view and all settings optimized as described above. We checked this spatial resolution by imaging a micro-CT bar pattern (QRM) and confirming that the 10 µm line and spot widths could in fact be accurately measured.
Two samples of each of the twelve sherds were first imaged with the field of view set to 5 × 5 mm, giving a spatial resolution of 10 µm, and then again with the field of view set to 10 × 10 mm, giving a spatial resolution of 20 µm. In previous work on brick porosity, the scans with 10 × 10 mm field of view proved to be inferior to the 5 × 5 mm field of view scans in characterizing the pore systems of historic and hand-made bricks and in differentiating different brick types [51]. We repeated the experiment here because we thought it might be possible that larger fields of view, with the larger sherd context they provide, could prove better at characterizing firing temperatures even though only pore sizes larger than 20 µm could be measured.

2.3. Protocols for 3D Image Analysis

3D image analysis was performed using Dragonfly (version 2022), a software package by Object Research Systems [67]. A multi-stage protocol originally developed and tested in the earlier brick porosity study [51] was applied:
  • Intensity calibration of each micro-CT image at the outset brought the set of images closer to each other in intensity values with the goal of reducing the number of segmentation models that had to be developed by machine learning/deep learning; since then, some models worked well for multiple images.
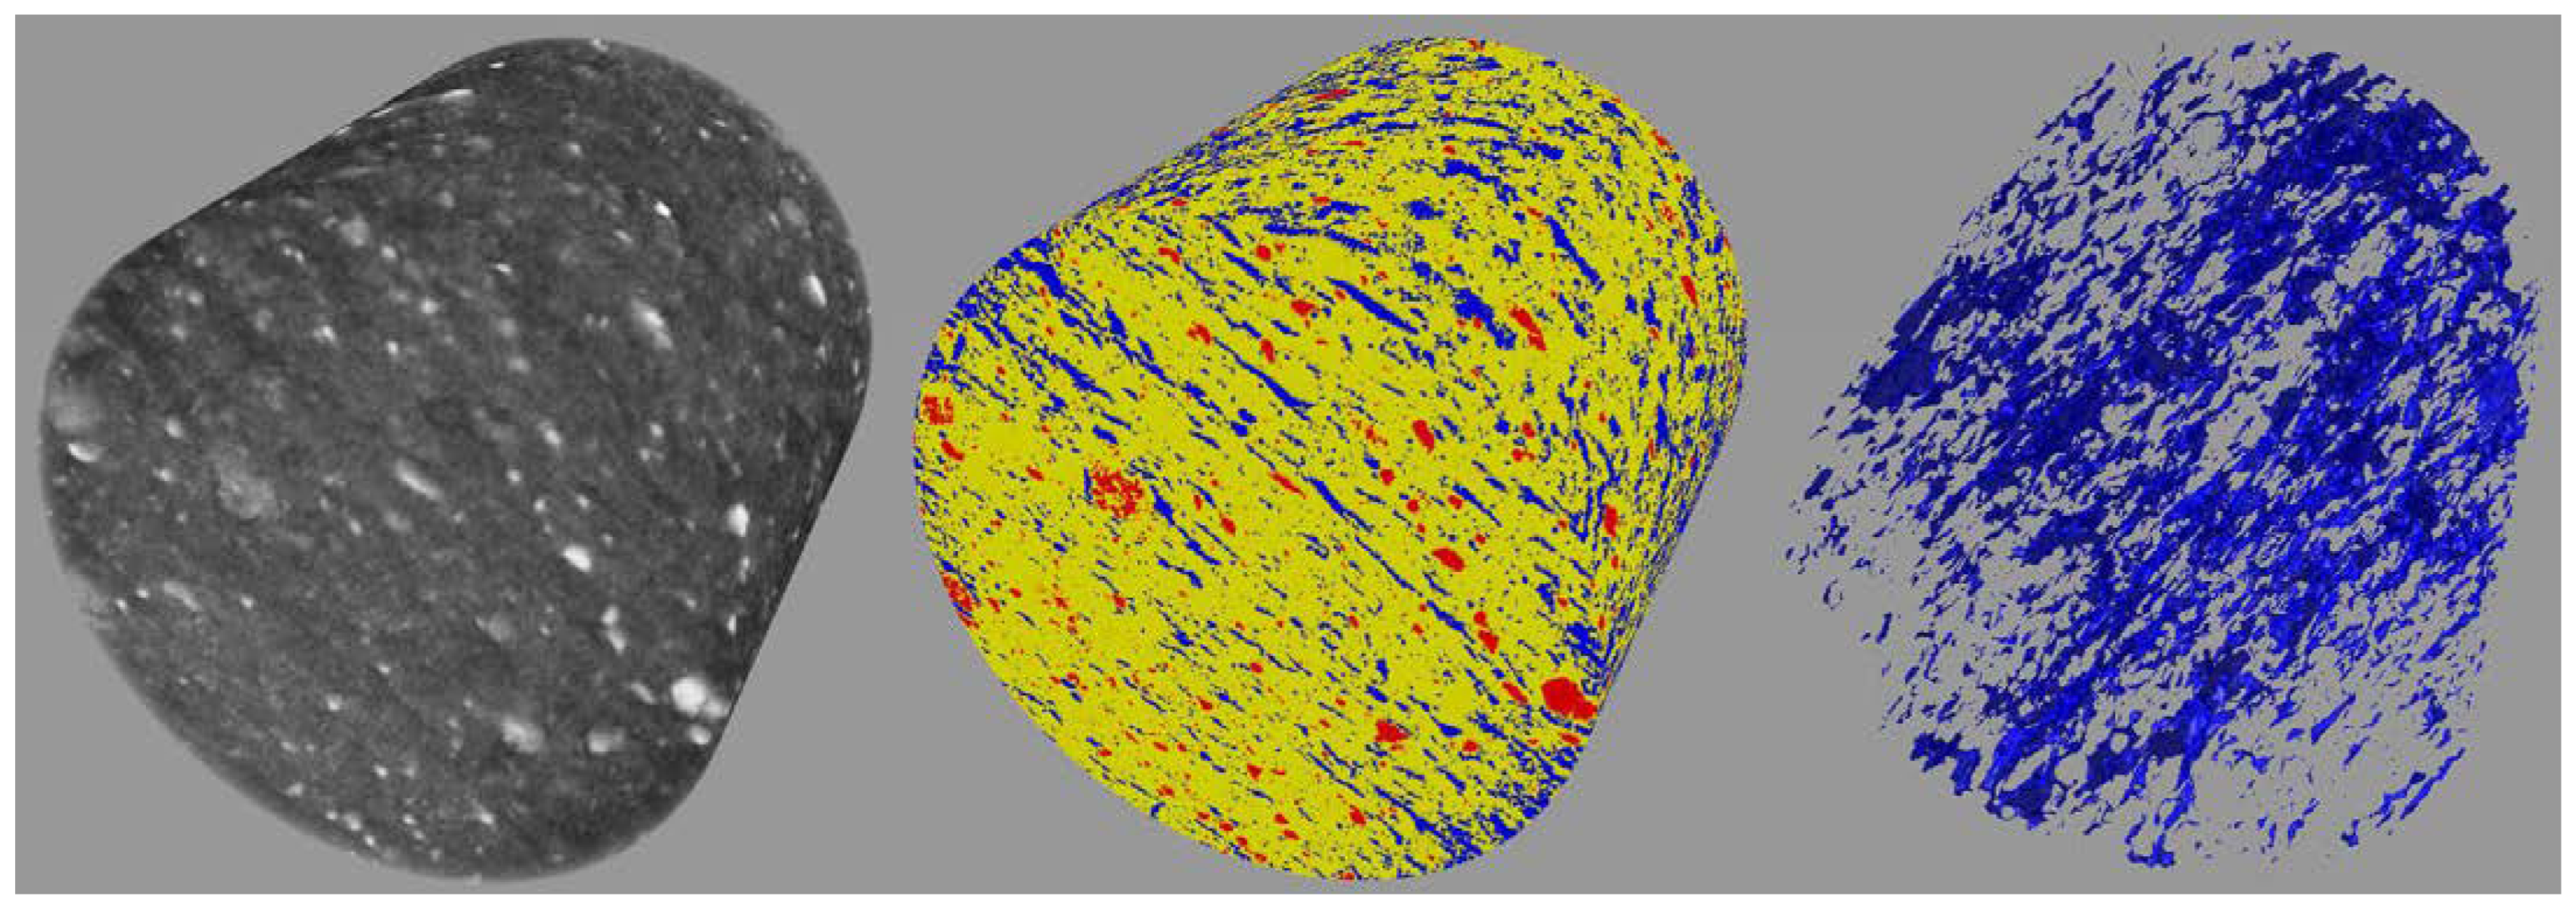
  • A Region of Interest (ROI) for each micro-CT image was created, selected to remove the background and to exclude any surface roughness area (Figure 2, left). Some of the ceramic samples also have a slip or a glaze layer, or both a glaze and a thin slip beneath it. These layers were excluded from the ROI since the purpose here is to characterize pores within the ceramic body itself.
  • A segmentation model was developed that could separate the pore areas from the silica-rich particles and from the ceramic matrix. Since simple thresholding does not work well with these images, the Dragonfly tool for “segment with artificial intelligence” was used. Beginning with one slice, a large frame was created. Initial Otsu thresholding [68] was used to separate the image into the pore, silica particle, and matrix classes. Errors in that initial thresholding were corrected using a manual paintbrush tool. Several different machine learning and deep learning models were then trained using the data in the initial frame, as it is known that such models can improve the accuracy of segmentation when grey-level thresholding does not work well [49]. Once the models were trained, the results were viewed on a second slice, and the best-performing model used for further training, after additional manual corrections were applied with the paintbrush tool. Training followed by manual corrections continued until we had a model that gave good segmentation with no further corrections needed. We could usually stop after three slices; the maximum that was ever needed was five slices. The final fully trained model was then applied to the entire ROI (Figure 2, center). Individual models only needed to be developed about one-third of the time; initial intensity calibration of images meant that some models worked well for multiple images.
  • The pore class was extracted from the segmentation result (Figure 2, right). It was processed to eliminate any speckling noise or other imaging artifacts. The total pore volume percentage was then calculated.
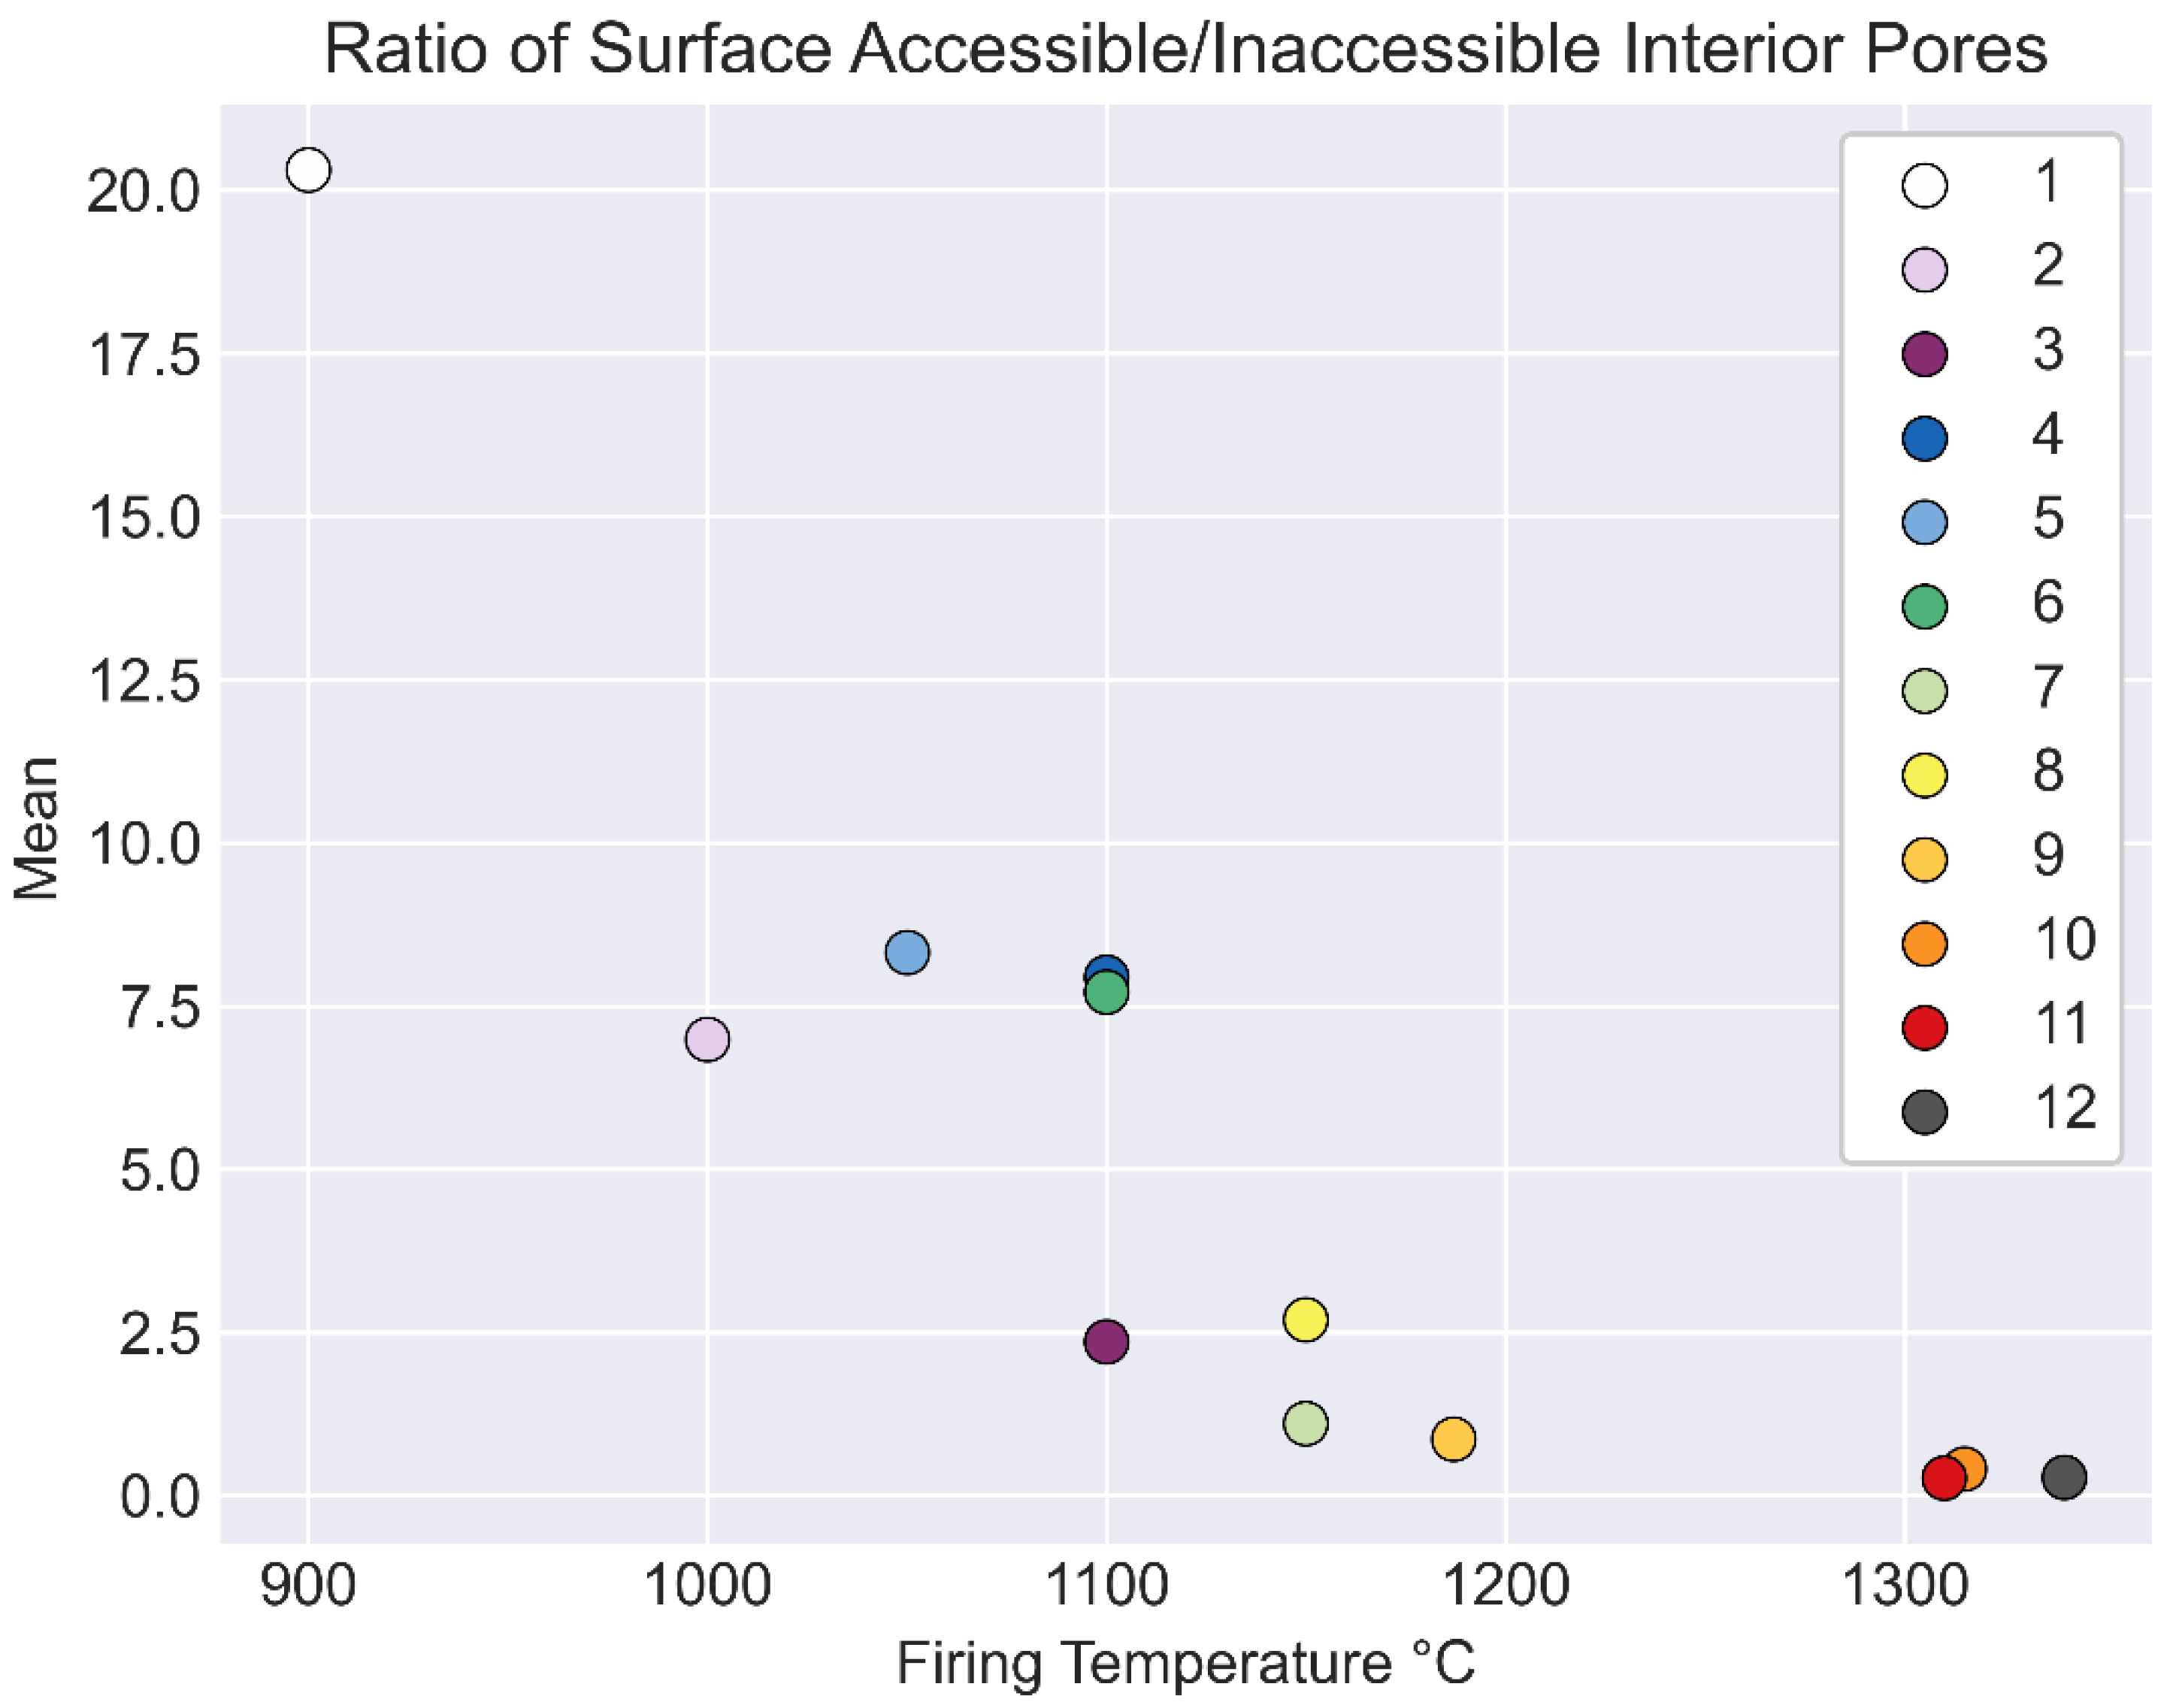
  • The percentage of the pores that are accessible to any surface versus the percentage of inaccessible interior-only ones was calculated. This was carried out by overlaying a single-pixel-wide shell of the ROI and calculating what percentage of pores touch the shell in any slice (so are accessible to a surface) and what percentage do not (interior-only pores).
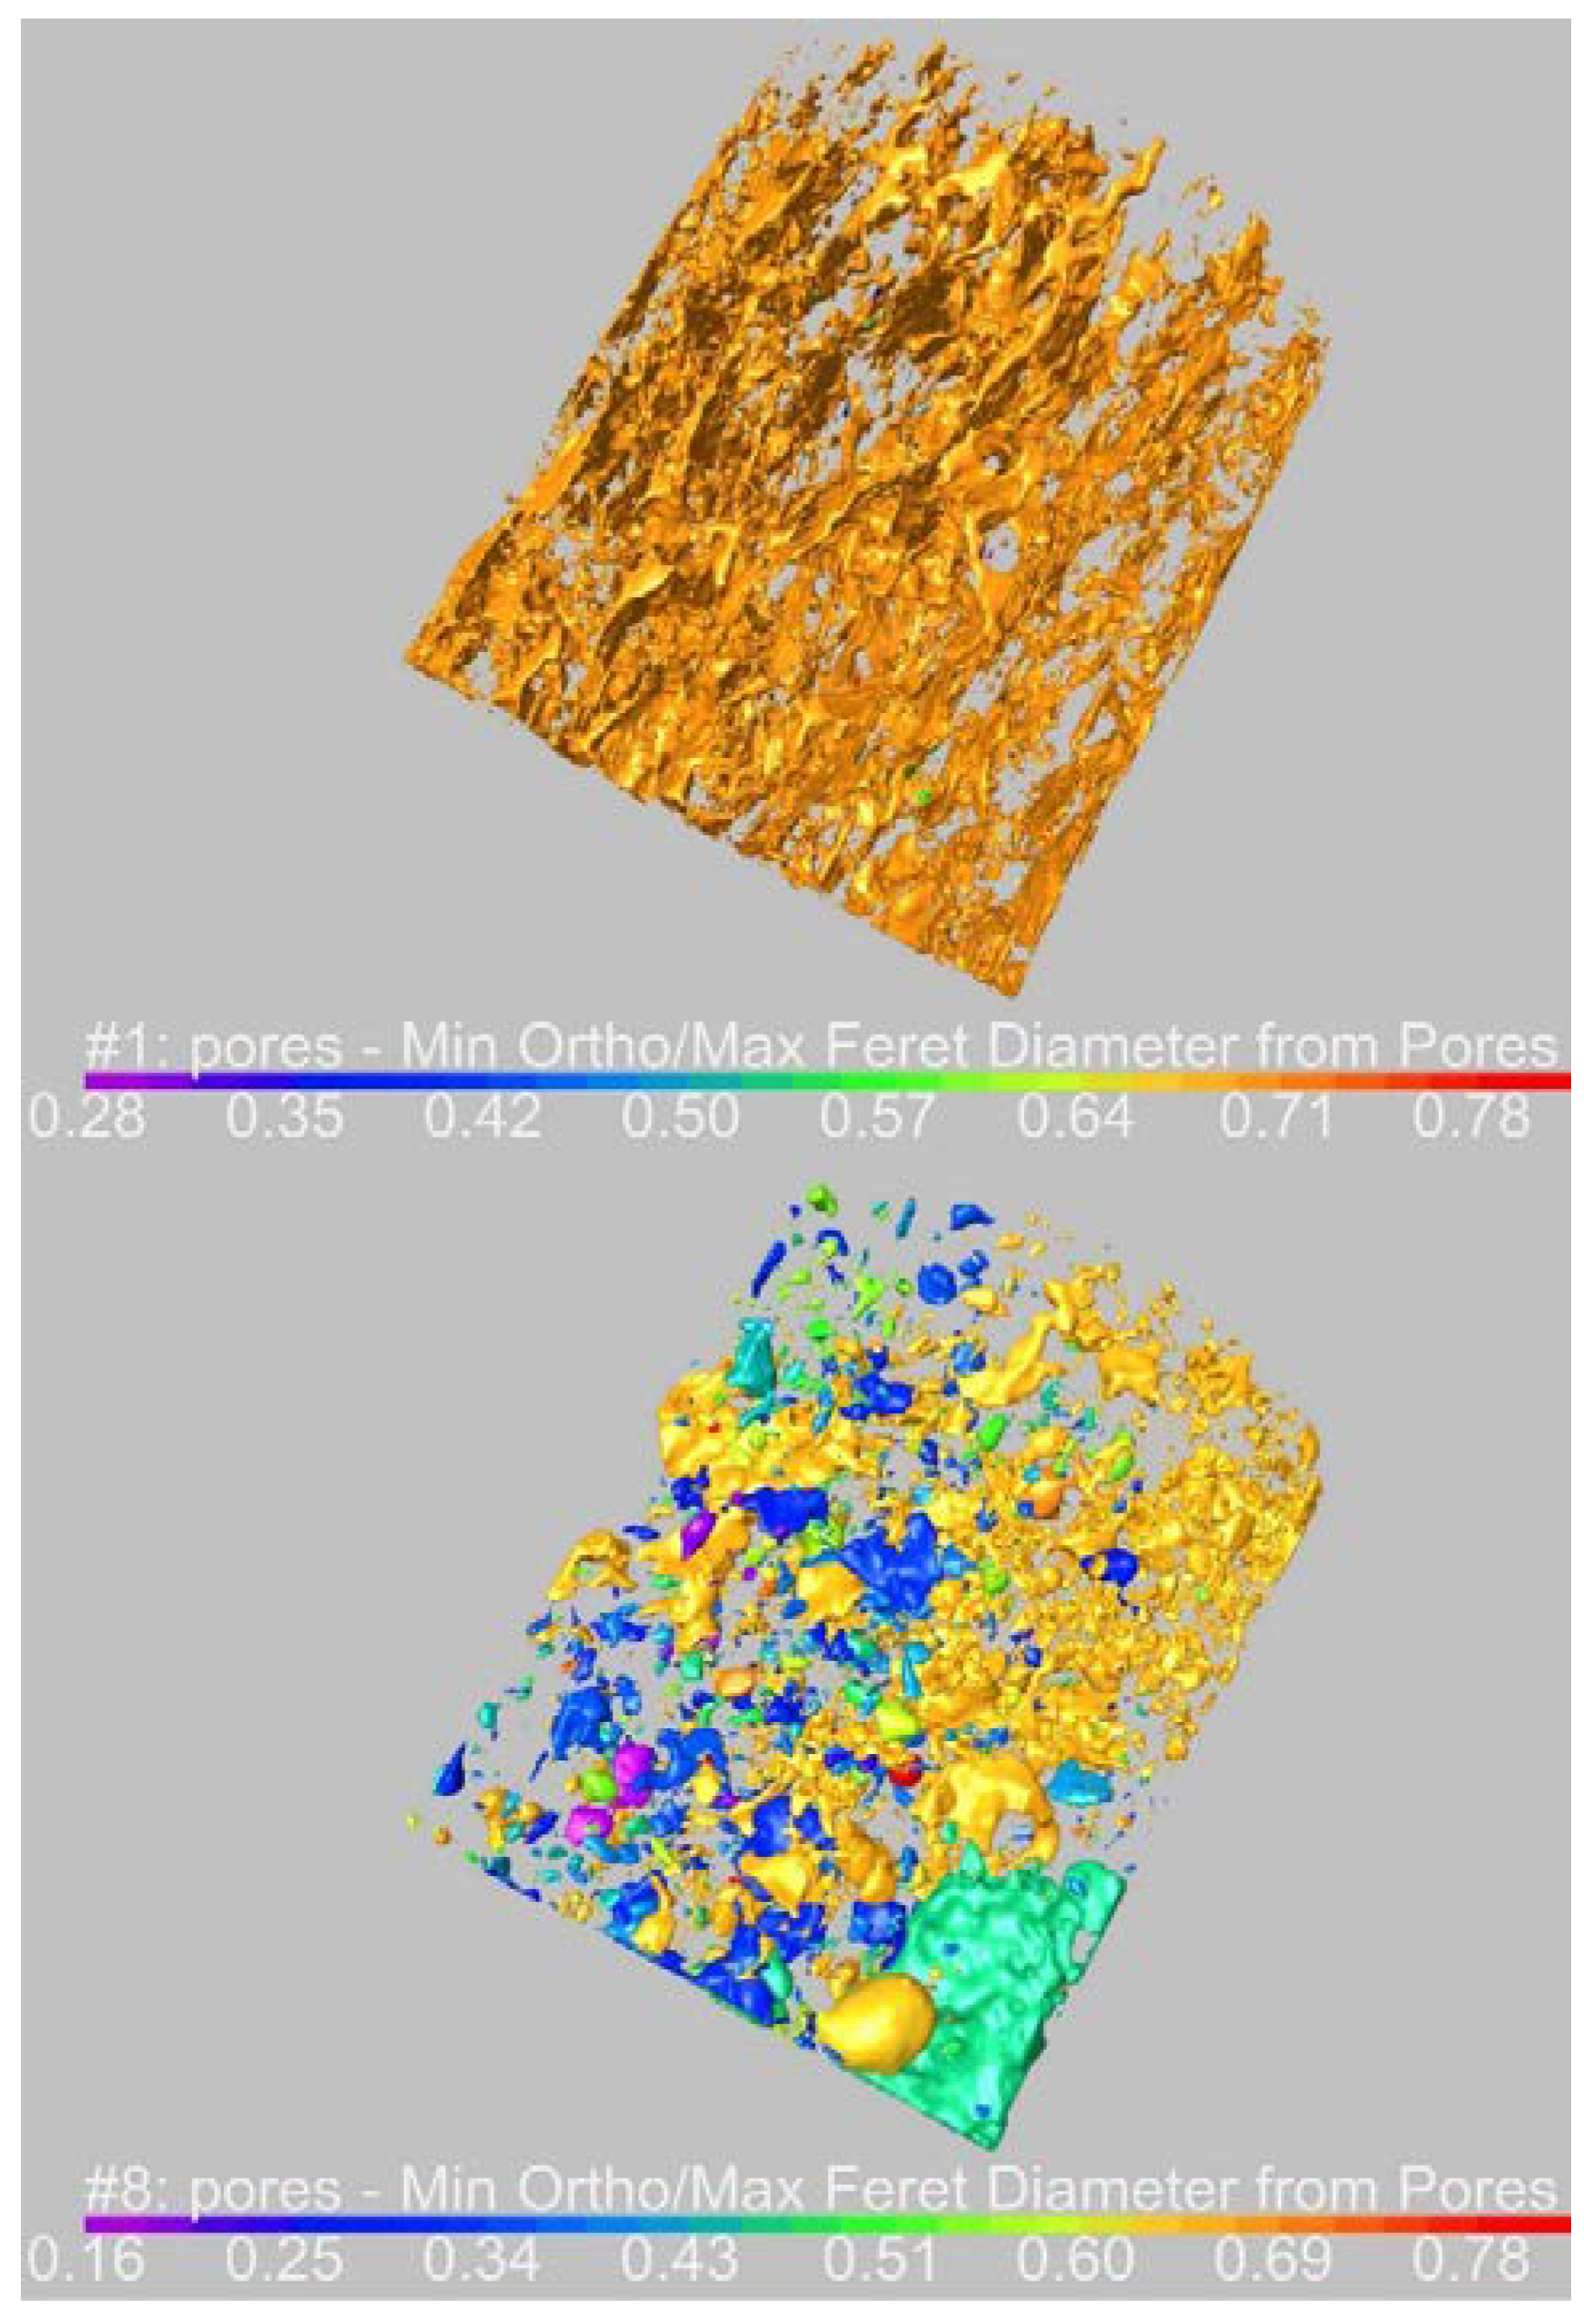
  • A multi-ROI was created for the pores in each image by automatically grouping the voxels into components based on connectivity. Then, 16 statistical properties related to various shape and size parameters were calculated for the individual pores in each image. These variables were selected based on properties found to be significant in the previous brick micro-CT study [51].
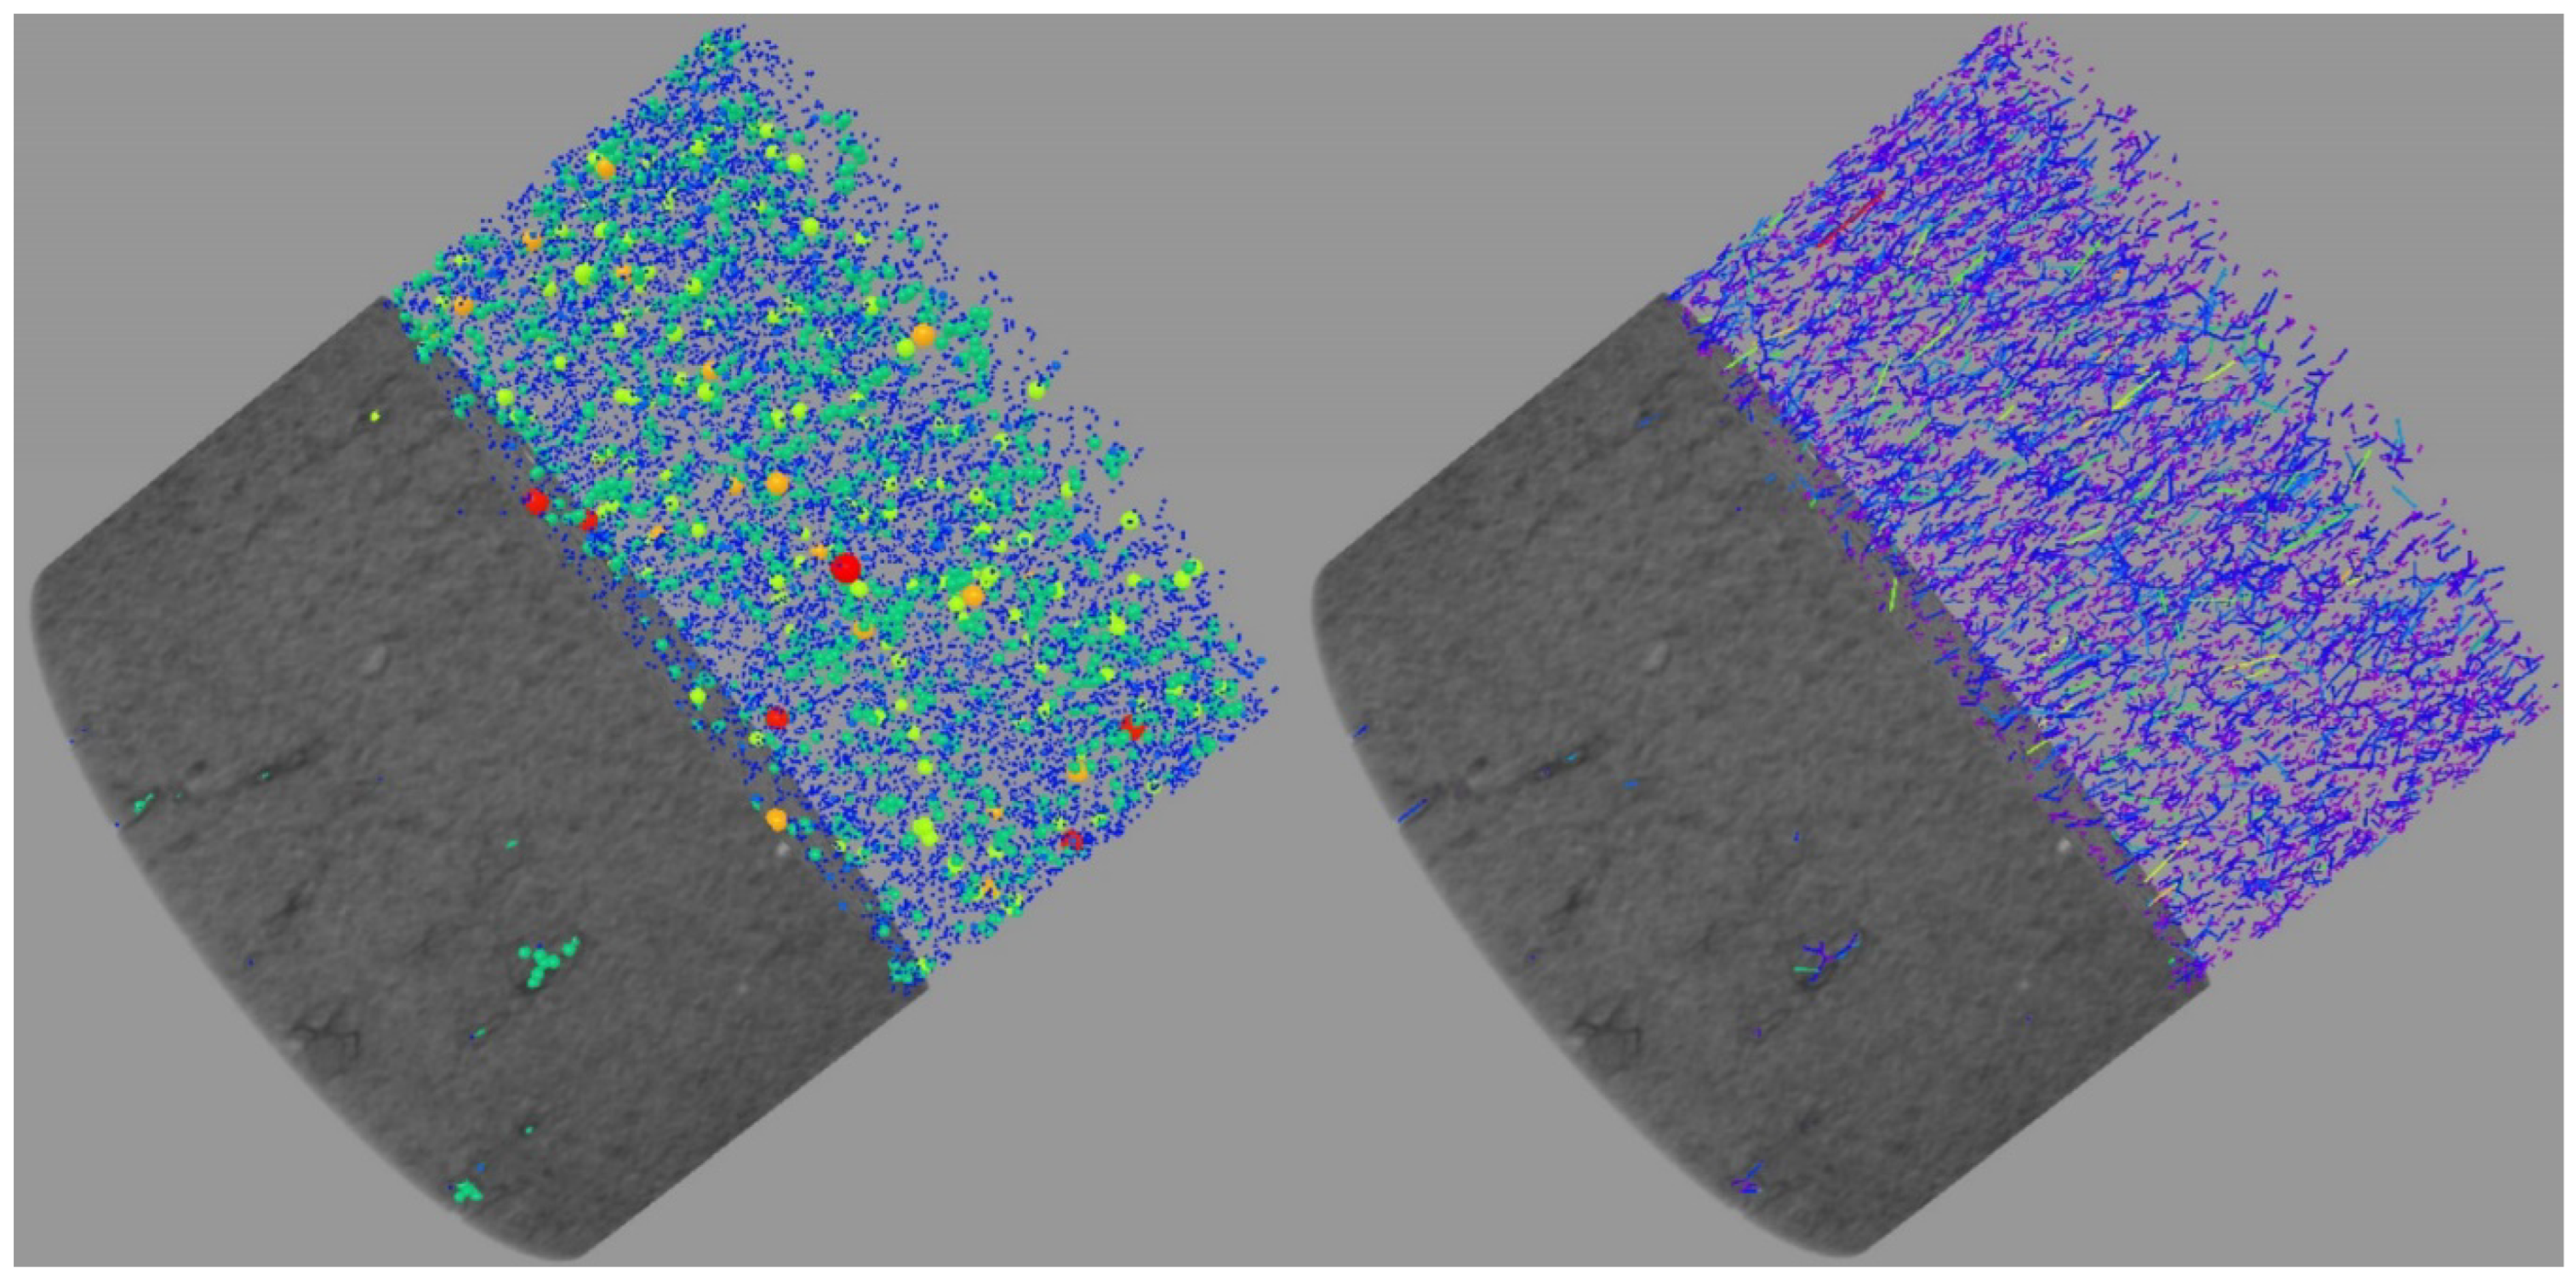
  • A sparse graph of pores was created for each image (Figure 3). This is a pore system model with spheres representing the pores and straight lines representing the connections between them (also called pore throats). These provided data primarily useful for quantitative connectivity data. Four variables were recorded: maximum and mean connectivity for the pores in each image, the connectivity standard deviation, and the percentage of pores that are completed isolated and unconnected to any other pores in the system.
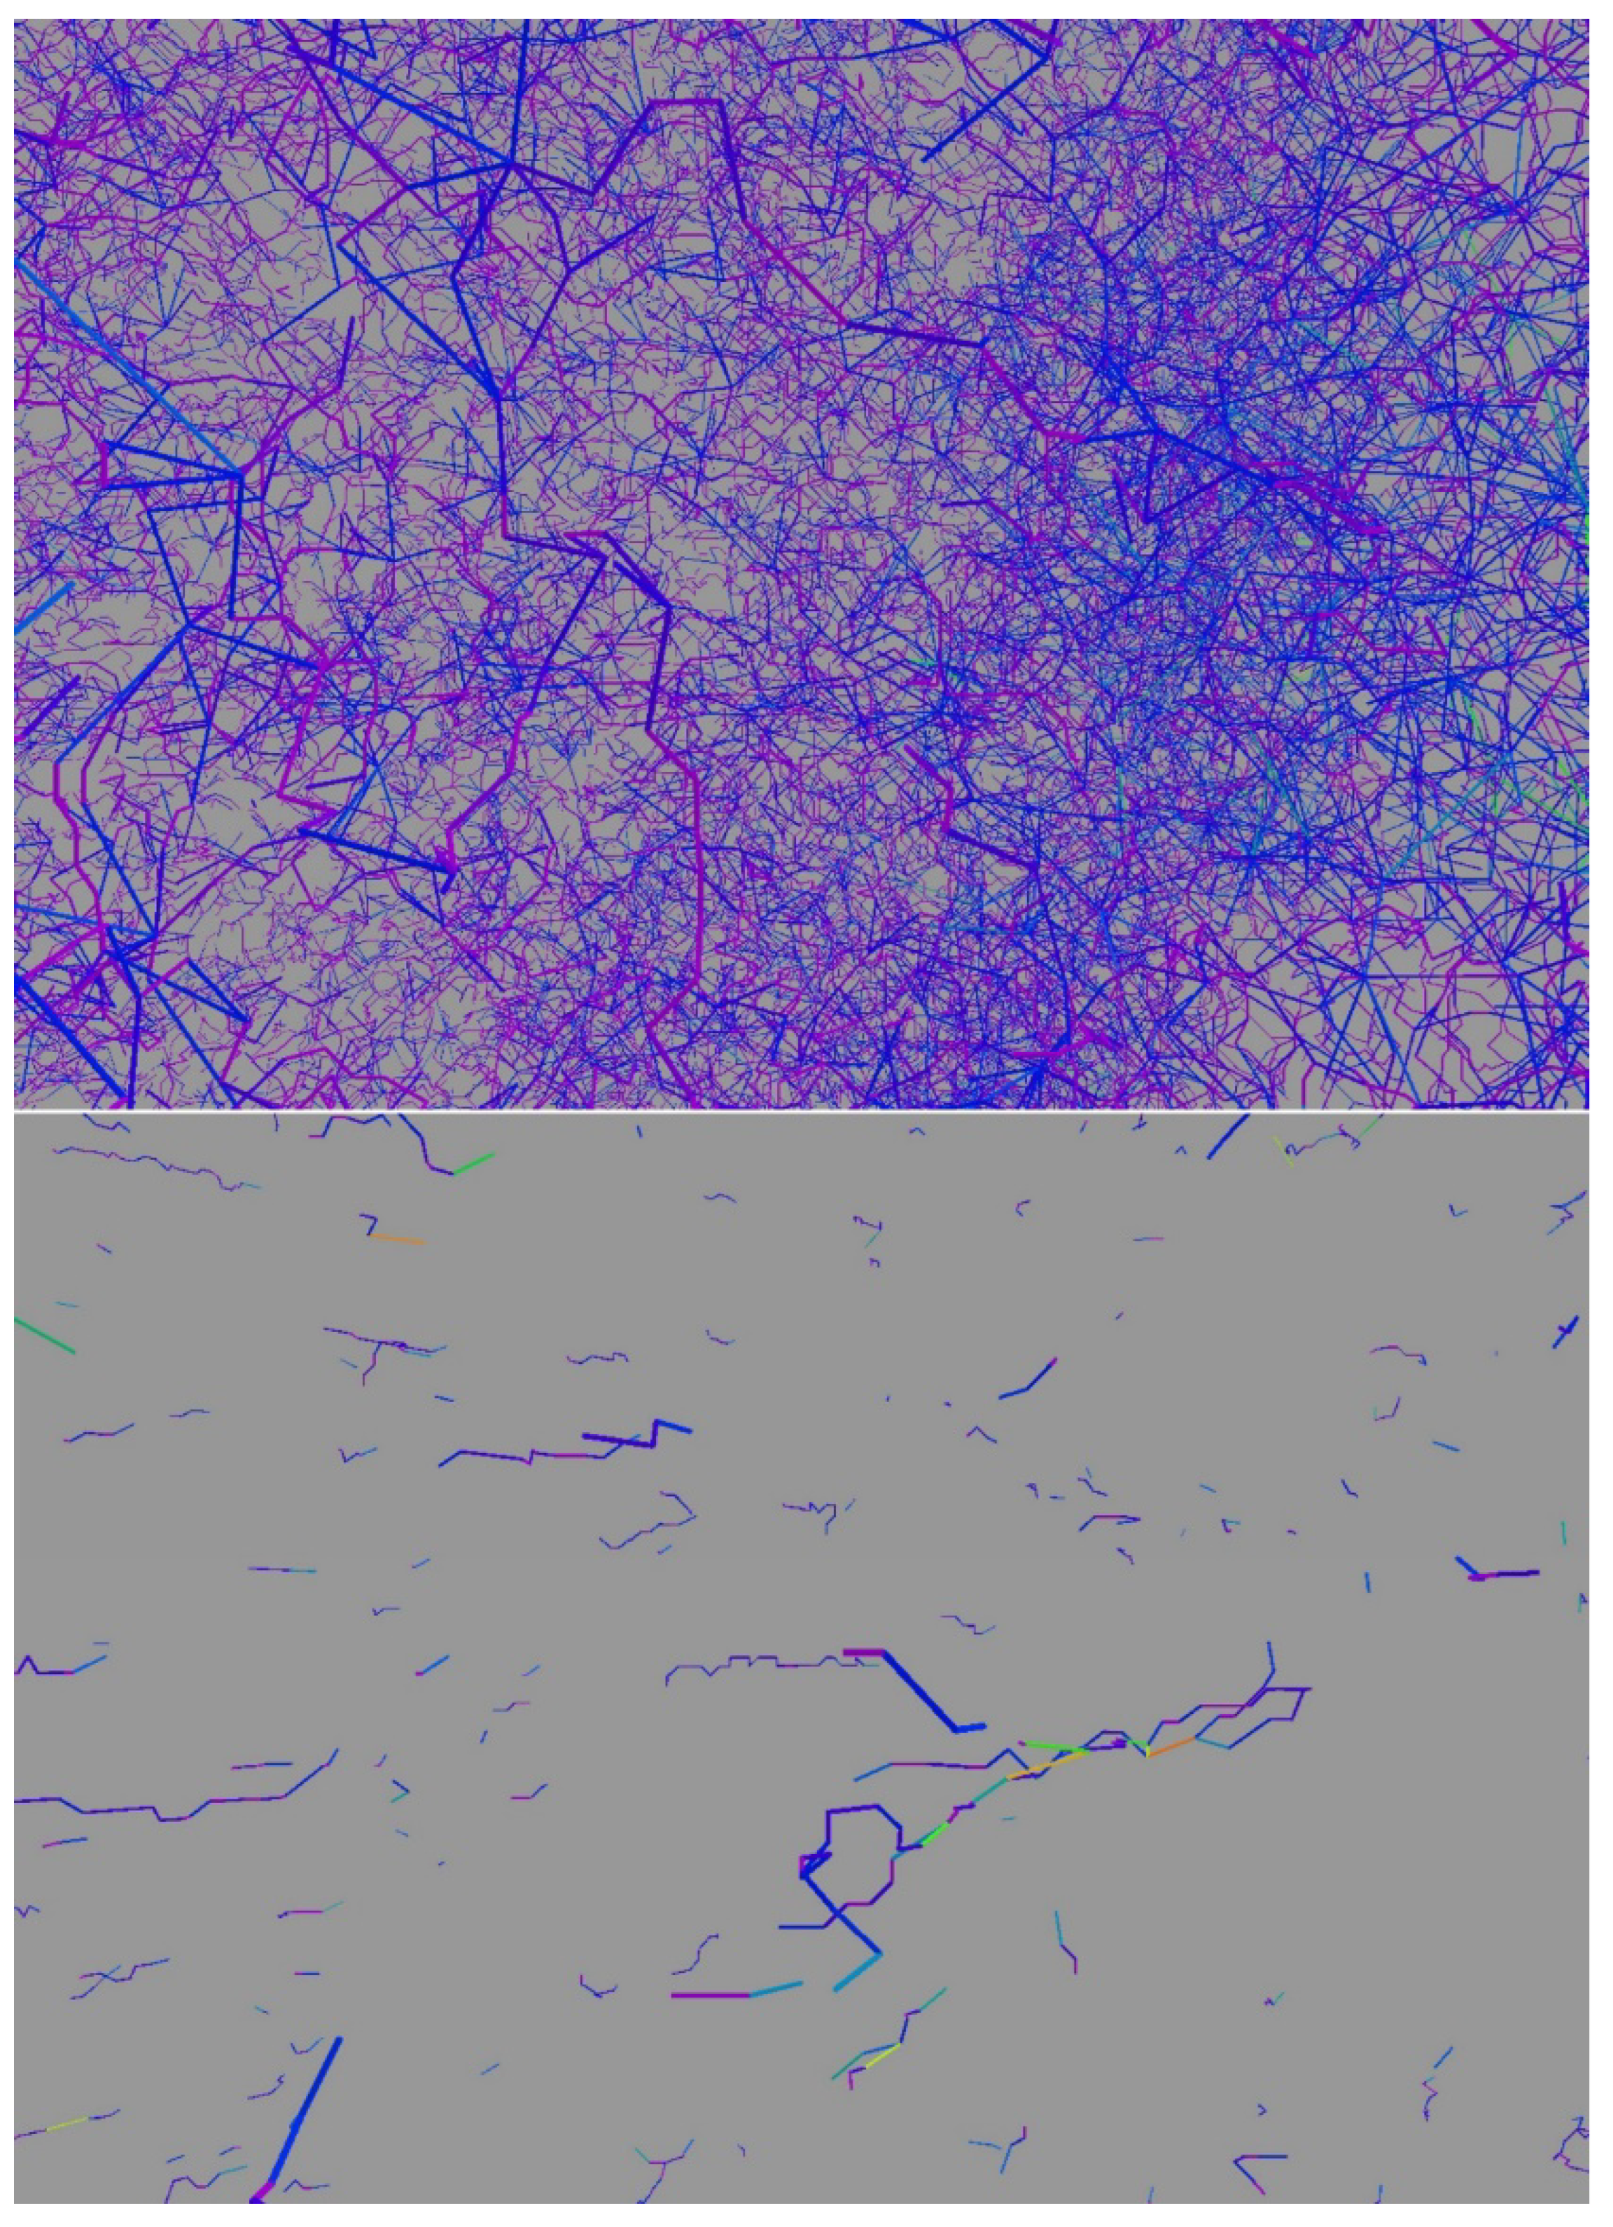
  • Additional data related to pore connections were obtained from a dense graph of pores. In this model, the lines connecting pores are more detailed and display all pixels connecting pores rather than having them reduced to a straight line. The dense graph also provides values for connection lengths and tortuosity (degree of indirectness of connection pathways) (Figure 4). Data for ten variables were obtained, all related to connectivity, tortuosity, and Euclidean length.
  • The final eight variables were collected with a model created by OpenPNM, developed at University of Waterloo and available both as a stand-alone program (open source) [69] and in Dragonfly. This model is usually used to study complex issues of flow and permeability [70]. Here, we simply used it to collect data on the total number of edges and vertices in the pore systems and their ratio, the length and equivalent diameter of edges, and the equivalent diameter of vertices.

2.4. Data Analysis Procedures

A total of 42 pore parameters were obtained by the 3D image analysis of the 24 sherd samples. Statistical analyses had the goal of identifying which, if any, of the recorded variables are related to firing temperature. Where the likely firing temperature for a ceramic is a range, rather than a single number, the mean of the range was used. For each variable, the measurement collected for both samples for each sherd was averaged together.
Python 3 was used for the statistical analyses, with the Pandas package for data handling and the statsmodels package for analysis of variance (ANOVA). The Matplotlib package was used for plots. First, the mean versus difference for the two samples for each variable was checked to make sure there were no significant patterns. Then, a one-way ANOVA was performed on the mean predicted firing temperature for each variable. Significant variables related to firing temperature across replications were then identified (at p < 0.05) (26 out of the original 42 variables were significant).

3. Results

All data discussed here are from the 5 × 5 mm fields of view (spatial resolution 10 µm) since these proved to be more strongly correlated to firing temperatures than were the 10 × 10 mm fields of view with 20 µm spatial resolution.

3.1. Pore Volume Percentages

Pore volume percentages were obtained from a comparison of the volume segmented as pores to the entire ROI. The variables found to be significant (p < 0.05) in predicting the mean firing temperature are total volume porosity (correlation with firing temperature 0.8), the percentage of pores accessible to any surface (correlation 0.8), and the ratio of surface-accessible pores versus inaccessible interior pores (correlation 0.7). Table 2 shows the means for each of these variables for each ceramic type. The highest values for all three variables are seen with the lowest firing temperature ceramic, and then values drop as firing temperatures rise. These are also shown in Figure 5, Figure 6 and Figure 7.
Table 3 shows that replication is important since samples taken from different areas of a sherd vary. No ethnographic or archaeological sherds are perfectly homogeneous.

3.2. Size and Shape Parameters from Pore Multi-ROIs

Ten of these variables were significant for indicating firing temperature at the level of p < 0.05. These variables and their correction with mean firing temperatures are:
  • Maximum pore volume (firing-temperature correlation 0.7);
  • Pore surface area maximum and standard deviation (firing-temperature correlation 0.7 for both);
  • Volume-to-surface area ratio, mean and standard deviation (firing-temperature correlation 0.9 and 0.7);
  • Mean aspect ratio (firing-temperature correlation 0.8), for 3D defined as the proportional relationship between the smallest eigenvalue and the largest one (minimum/maximum);
  • Mean Feret diameter, mean (mean of minimum and maximum distances between parallel tangents); and maximum Feret diameter, mean (firing-temperature correlation 0.8);
  • Minimum orthogonal Feret diameter, mean (the shortest distance between two points along the boundary orthogonal to the maximum Feret diameter) (firing-temperature correlation 0.8);
  • Minimum orthogonal/maximum Feret diameter, mean (this indicates pore elongation) (firing-temperature correlation 0.8).
The mean values each of these significant variables for each ceramic are given in Table 4.
These pore variables either increase or decrease with higher firing temperatures. For example, Figure 8 below shows how maximum pore volume goes down as firing temperature increases. This may be due to vitrification of the ceramic body at higher temperatures separating some large-volume pores. Lower-fired wares also tend to have larger non-clay additives such as organic material, shell, or calcium carbonate grains that may partially or wholly burn out during firing, leaving more large-volume pores. The same trend occurs with pore surface area maximum and standard deviations.
Other trends are related to pore morphological characteristics differing between lower and higher firing temperatures. One of these is seen in Figure 9, where the plot shows the pore volume-to-surface area ratio (volume in relation to the outside surface area of the pores) rises with increased firing temperatures. This is an indication of overall more spherical pores, since for a given volume, the ratio is maximized for spheres.
Figure 10 shows that mean Feret diameter also rises as firing temperatures increase. In 3D, this parameter is related to aspect ratio (minimum Feret diameter/maximum Feret diameter), which also increases with increased firing temperature.
Figure 11 shows a measure of elongation (minimum orthogonal Feret diameter/maximum Feret diameter) decreasing with increasing firing temperature, indicating that more spherical and globular pores are forming, consistent with the results for volume-to-surface area and aspect ratio.
Multiple factors may explain this phenomenon. For example, if high firing temperatures are achieved quickly, feldspars may melt non-uniformly, leaving round pores in the center with mullite formed around the edges (Figure 12, left); the release of gases during vitrification of the body may create very round pores (Figure 12, right).
Figure 13 illustrates this elongation measure in micro-CT scans with 3D image analysis. The upper image is a sample from ceramic 1, with pores mostly uniformly showing a high ratio. In contrast, the sample from ceramic 8 (lower) shows much more variability. The mean of this measure of elongation decreases with higher firing temperatures, and ceramic 8 clearly has fewer elongated pores and more spherical and globular ones.

3.3. Sparse Graphs of Pores, Connectivity

Four variables related to pore connectivity, which refers to the number of other pores a pore shares connection voxels with, as derived from the sparse graphs of pores, were found to be significant in relation to firing temperature (p < 0.05) (Table 5).
Low-fired sherds tend to have higher connectivity values for the maximum (correlation with firing temperature 0.8) (Figure 14, left), mean (correlation 0.9), and standard deviation (correlation 0.9). One explanation is that dissolution of feldspars, cracking of quartz grains, and other firing effects on the non-clay components can cause a large number of pores within that disintegrating grain to be in contact with other pores [70]. These non-plastics tend to be more numerous in lower-fired materials. The inverse is true for the percentage of pores that are unconnected, with the higher-fired sherds having higher values (correlation 0.8) (Figure 14, right). At higher temperatures, vitrification proceeds and forms a dense matrix with isolated pores formed during the release of gases.
Figure 15 illustrates the difference in connectivity between a sample from the lowest-fired sherd in the experiments (ceramic 1, 900 °C) [31] and the highest (ceramic 12, 1320–1380 °C) [65] using the sparse graphs of pores. Ceramic 1 (Figure 15, upper), with a higher volume percentage of pores (27.6%), high maximum pore connectivity (60), and mean connectivity value of 2.82, has only 1.5% of its pores unconnected so they are hard to pick out within this fully packed pore system. In contrast, the sample from ceramic 12 (Figure 15, lower) with only 2.27 vol.% pores, has a maximum connectivity of 5, mean of 0.99, and 15% of its pores unconnected to any other pores. The unconnected ones stand out here, and it is apparent that many pores are connected to only one other pore.

3.4. Dense Graphs

Six pore variables from the dense graphs were found to be significant at p < 0.05. (Table 6). Pore system models created by this graphing method show, as with the sparse graphs of pores, that pore connectivity variables for the lower-fired ceramics are much higher than for the higher-fired ones. The correlations to firing temperature are 0.9 for mean connectivity, 0.8 for maximum connectivity, and 0.7 for connectivity standard deviation.
In the dense graphs, segment tortuosity characterizes the connection paths in terms of how far they deviate from a straight line between pores. While not strongly correlated to firing temperature (0.6), the main observation here is that tortuosity values for the two highest-fired ceramics are much lower than for the other ceramics. Why this is the case is unclear, but it appears that this variable is worth further investigation in future research. Table 6 also shows that, while again only weakly correlated to firing temperature (0.4), the lower-fired ceramics tend to show less variation (lower mean standard deviations) for Euclidean lengths of vertices and edges than do the high-fired ceramics. Perhaps this reflects the complex mix of pore sizes that form at various stages including drying, then during firing at various temperatures as the kiln is ramped up to peak temperature, and then during vitrification of the ceramic matrix at higher firing temperatures.
The pore connections/throats with lower versus higher Euclidean length standard deviations are compared in Figure 16. The upper image shows a sample from ceramic 1 (firing temperature 900 °C) with the lowest value for Euclidean length standard deviation while the lower image shows a sample from ceramic 11 (firing temperature 1300–1320 °C) that has the highest standard deviation for Euclidean length of pore connections (Table 6). In Figure 16, the connections are color-coded by Euclidean length with the shortest connections between pores shown in purple, those a little longer shown in blue, then in green, and with yellow and orange for the longest connections. Since ceramic 1 has a high-volume percentage of pores (27.6%), it is packed full of pore throats but with little variation in length, so the connections are shown mainly in purple and dark blue, with a small percentage lighter blue and ranging up to green. The sample from ceramic 11 has a low volume percentage of pores (1.99%) but shows more variation in length of connections, ranging up to yellow and orange. The greater tortuosity (more winding and indirect connections) of ceramic 1 in the upper image versus ceramic 11 in the lower image is also visible in this dense graph where each pixel of the connections is shown.

3.5. OpenPNM Pore Data

The final three variables come from the OpenPNM pore network model [69]. The ratio of the number of edges/number of vertices (correlation to firing temperature 0.9), edge (connections) equivalent diameter mean (correlation 0.4), and vertex (pore) equivalent diameter mean (0.4) were all significant at p < 0.05. Table 7 shows the strongest correlation to firing temperature is of the number of edges to the number of vertices in the system, with the ratio clearly higher for the higher-fired ceramics. This strong relationship is also seen in Figure 17, and perhaps reflects the loss of pores during the vitrification of the ceramic body. The equivalent diameter variables, while significant, have a lower correlation to firing temperature; both increase for the higher-fired ceramics.

4. Discussion

The primary goal of these experiments was to explore whether data on pore systems obtained from 3D image analysis of micro-CT scans could be useful in deducing firing temperatures of ancient and historic ceramics. Firing temperatures indicate technological developments [2], and porosity and the structure of pore systems themselves have implications regarding the use functions of ceramics. None of the current methods for studying firing temperatures of archaeological ceramics are completely satisfactory on their own [38,66]. The results reported here indicate that micro-CT, in combination with 3D image analysis, has the potential to be a useful addition to the toolkit of archaeothermometry. In addition to providing data for firing temperature studies, the pore system data can contribute to an understanding of the physical and mechanical properties of ceramics that relate to their use functions [1,71].
Initially, all data were collected from both 5 × 5 mm (10 µm spatial resolution) and 10 × 10 mm (20 µm spatial resolution) fields of views. Data from the larger spatial resolution were not as strongly correlated with firing temperatures, indicating that achieving the best spatial resolution of pores as possible, while also imaging a large enough area to be representative of the sherd as a whole, is important for characterizing pores in archaeological materials. It is possible that micro-CT images of larger areas with less spatial resolution would work well for studies of particle distribution and for quantifying aspects of the glaze or slip layers and interaction layers, but that is a subject for future research.
Most methods for determining porosity measure only connected pores; in contrast, micro-CT analysis provides a measure of total porosity that includes both connected and isolated unconnected pores. The total volume porosity of sherds in this experiment was found to be significant for predicting firing temperature, with lower-fired ceramics generally exhibiting a higher volume fraction of pores than higher-fired ones (Table 2, Figure 5). The lowest fired ceramic has the largest volume percent pores and the two highest-fired ones the lowest, but with variation in the middle of the firing range. This finding corresponds to assumptions made in the archaeological science literature, where a lower volume percentage of pores generally implies higher firing temperatures [1,18,28,36]. As firing temperature increases, pores become fewer in number as vitrification of the body proceeds [32,39,40] but the amount of porosity is complicated by many other factors. Some of the production steps that affect porosity include the choice of raw materials and fabrication methods, so it is not surprising to see that for the middle of the firing range here there is no simple linear correspondence of porosity with firing temperature [1]. Firing to too high a temperature for the specific mix of raw materials used creates bloating of pores [35,72,73] and would increase porosity, and carefully selecting raw materials such as a potash flux that will promote vitrification will reduce porosity. Increasing vitrification and reducing porosity can create impermeable vessels for the storage and transport of liquids [74]. In contrast, greater porosity can be useful for lower-fired cooking vessels that often contain a high percentage of polycrystalline components. The crystals can expand on the cooking fire without exerting pressure that might crack the vessel because the many pores absorb the strain [1]. Micro-CT imaging is a good approach for building more data regarding the relationship between total volume porosity and firing temperature for various ceramic recipes and functions.
The percentage of the total volume porosity that is accessible to the surface is one indicator of the use properties of a ceramic. For example, pores accessible to the surface promote evaporation that can help keep the contents of water storage vessels cool [1]. If movement of liquids to the surface is undesirable for certain uses (such as serving vessels such as teacups, or for vessels intended for the transport or long-term storage of liquids) potters can control raw materials, fabrication methods, and firing temperatures to control the ceramic body as well as add slips or glazes to one or both surfaces. While some isolated interior pores form due to the burn-out of rounded natural carbonate inclusions in clays or of additives such as seeds, additional closed interior pores can develop during firing as vitrification of the ceramic matrix proceeds through a combination of controlled use of raw materials, fabrication methods, and firing temperatures to close off previously connected pores that may have once reached the surface [1,74]. Most methods for analyzing porosity in ceramics only quantify connected pores, but isolated ones can also impact ceramic properties important to use functions [39,75,76,77,78,79,80], so an advantage of micro-CT and 3D image analysis is that pores not connected to other pores or to the ceramic surface are analyzed [38,51,81].
Table 2 and Figure 6 show a clear relationship between firing temperature and the amount of porosity that reaches a ceramic surface versus pores confined to the interior. At 900 °C, the ratio of surface/interior pores is 20.3; ceramics fired between 1000–1150 °C show ratios ranging from 8.3 down to 1.1; and above 1150 °C, the ratios are all below 1 (0.9–0.3). Ceramic scientists have noted that a material with many small, closed pores will conduct heat more slowly, while a material with large, connected pores open to the surface will increase thermal conductivity because hot gases can pass through the ceramic body [1]. A higher percentage of connected and surface-accessible pores would be advantageous for low-fired cooking wares, to allow heat to permeate the ceramic body evenly and completely. On the other hand, small, unconnected, interior pores are better for a teacup, to keep the tea hot but not allow the heat to pass through the ceramic wall and burn the hand of the drinker. This would be another variable useful to pursue in further research, including selecting for comparison ceramics of various known functions as well as firing temperatures.
Archaeological scientists have for many years recognized that changes in average pore size, shape, and homogeneity can provide evidence to infer original firing temperature [1,7]. However, as with total volume porosity, the situation is complicated because pore size, shape, and distribution are also strongly affected by the choice of raw materials and fabrication methods. For example, low-fired cooking wares often included organic additives that char and partially or wholly burn out during firing, leaving large pores of quite varying size and shape (see Figure 1, left); little kneading and wedging of the clay can create an inhomogeneous matrix (Figure 18, left); and fabrication methods that involve the application of pressure can create long, parallel pores. This is because the clay minerals become aligned and then during drying and firing, thin, elongated, aligned pores can form throughout the matrix [16,18] (Figure 18, right).
Beyond firing temperature, pore size and shape variables contain information about material properties, product functionality, and ceramic technological developments. For example, cooking wares need thermal shock resistance, so they can be repeatedly heated and cooled without cracking; high porosity made up of mainly large pores contributes to thermal shock resistance by halting crack propagation [32]. Organic additives such as chopped straw, which will char and burn out upon firing, serve well for this purpose. For more homogeneous higher-fired wares, small, rounded pores can interrupt microcracks as they initiate, preventing them from continuing to travel through the material. While non-cooking wares have less need for thermal shock resistance, a glassy body lacking pores can exhibit lower strength [1]. Therefore, it is advantageous for higher-fired ceramics to retain some porosity and for these to be small, rounded pores.
Despite the potential importance of such information, methods for quantitatively measuring a range of pore size and shape characteristics in archaeological ceramics have been lacking and most descriptions in the literature are qualitative. Some quantitative work uses image analysis of thin sections; however, scrolling through the hundreds of slices that make up a 3D micro-CT image makes it obvious that no single 2D slice is likely to be very representative of the actual size and morphology of 3D pores. When 3D shape factors are considered, there are many methods available to subdivide and categorize pore measurements.
In our work, ten variables related to pore size and morphology were found to be significantly related to firing temperature. It is known that the size and shape of irregular networks of pores are best described with multiple rather than single measurements and they are best measured in 3D rather than in 2D [75,82]. Four variables decrease with firing temperature. Unsurprisingly, maximum pore volume is significantly larger for the low-fired ceramics and smaller for the high-fired ones. The maximum pore surface area and standard deviation are also both significantly larger for the lower-fired ceramics. Another variable that decreases with firing temperature is the measure of pore elongation (minimum orthogonal Feret diameter/maximum Feret diameter). This trend corresponds to the shift from more elongated pores to rounder ones resulting from a combination of the use of finer, more processed materials for the higher-fired ceramics and vitrification of the ceramic bodies producing new round pores as gases are released.
The other six variables, indicating shape factors, increase with firing temperature. Both the mean and standard deviation of the pore volume-to-surface area values rise with firing temperature. As a measure of the pore volume in relation to its outside surface area, this variable indicates increasing sphericity, which, as with decreasing pore elongation, describes the difference in finer materials and the higher degree of vitrification of higher-fired ceramics compared with low-fired ones; the mean aspect ratio (minimum/maximum eigenvalue) also increases with firing temperature, as the pores become more spherical. The mean of the minimum orthogonal Feret diameter also increases with temperature, another indication of increasing sphericity. Finally, the mean values of the mean Feret diameter and of the maximum Feret diameter increase with temperature; in 3D space, this is related to aspect ratio, which also increases with increased firing temperature.
Data related to the connections between pores are rarely reported for archaeological ceramics. Yet, these data provided many variables strongly related to firing temperature. The few studies in archaeological ceramic science that include such data use MIP, include only a small number of variables, and rely on visual comparisons of numbers rather than statistical analyses. Drawing from the many studies in allied fields such as sedimentary geology where micro-CT is used in conjunction with 3D image analysis to obtain data on a wide range of pore and throat variables [70,82,83,84,85] we used that approach to strengthen our study of pore system changes that occur with increased firing temperature.
Pore connectivity (maximum, mean, and standard deviation) goes down with increased firing temperatures (Table 5 and Table 6; Figure 14, left and Figure 5). This perhaps reflects a ceramic matrix that becomes more vitrified at higher temperatures, creating more isolated pores as the spaces between pores fill with glass. At lower firing temperatures, partially melted minerals such as quartz and feldspars may create more locations where many intragranular pores can be in contact with each other and with the same intergranular pore, raising the maximum connectivity number (Figure 19, left). However, at higher firing temperatures those partially melted grains completely vitrify (Figure 19, right), leaving a lower maximum connectivity value for the sherd.
These results correspond with the few studies of archaeological ceramic pore connectivity using MIP. For example, López-Arce and colleagues [86], in studies of ceramics recovered from underwater marine sites, concluded that sherds fired at higher temperatures have lower pore connectivity values. They note the implications of this for deterioration processes and conservation treatment procedures, as salts-containing water will be less likely to move through the ceramic matrix when connectivity values are low. However, MIP cannot measure unconnected pores, and that is valuable additional information provided by micro-CT. While the connectivity maximum, mean, and standard deviation go down with higher firing temperatures, the percentage of the pores that are unconnected goes up (Table 5, Figure 14, right), from 1.5% at 900 °C to 19.0% above 1320 °C.
As firing temperature rises, the standard deviations of both pore and connection (throat) Euclidean lengths increase. One hypothesis that can be tested with future research is that the higher-fired ceramics contain a complex mix of pores, some formed due to processing and fabrication methods, and some from partially melted and fully vitrified components. The two highest-fired ceramics also exhibit significantly lower tortuosity than the others; the effect of very high temperatures on this variable is another subject for future additional experiments. Finally, the ratio of the number of edges to the number of vertices in the pore systems was found to rise with increased firing temperatures (Table 7, Figure 17). This may be related to the decreasing overall volume of pores with rising temperatures, and to some pores getting cut off from previous connections as vitrification proceeds. This variable, too, will be studied further in future research.

5. Conclusions

The results of these initial experiments indicate that micro-CT imaging, enhanced by 3D image analysis, is a useful addition to the toolkit of archaeothermometry. Since this is a non-destructive technique, a sample from a ceramic sherd can be used first for micro-CT, and then the same sample can be used for other characterization methods such as thin-section petrography for mineralogical analysis. Having both mineralogical and pore system data together would provide a wealth of information to study the effects of firing temperature on archaeological ceramic materials.
It would be useful to add controlled experiments with known and realistic firing scenarios to identify which pore variables are most closely associated with which firing variations. However, given the many variations in past raw materials, fabrication methods, and firing technologies, another future approach might be to routinely obtain porosity data by conducting micro-CT scanning followed by 3D image analysis on many sherds in a project prior to now-routine thin-section preparation. This could result in data that can be compared within and between archaeological sites for identifying the range of firing effects on pore systems.
The ANOVA proved crucial in clarifying which of the many variables that can be recorded in image analysis are significantly related to firing temperatures and which are not. Most archaeological ceramic porosity studies rely on visually examining data tables rather than using statistical analyses, so a data science approach is also recommended for any applications of micro-CT image analysis to archaeothermometry.
Finally, it should be noted that this work only touched the surface of the full capabilities of current 3D image analysis software for studying pore systems in archaeological ceramics. We used OpenPNM to collect a few simple pore system parameters, but it can also be used for modeling physical parameters such as diffusion and permeability [69,70]. There are other image analysis programs that analyze physical and mechanical properties affected by pore systems that could be used with micro-CT data to study firing effects. One example is Porous Microstructure Analysis (PuMA) developed by NASA, available as open-source software [87] and as a plug-in within Dragonfly, for determining effective thermal conductivity and effective diffusivity. There are many other examples of software designed for studying pore systems that might benefit archaeological ceramic studies of the effects of firing temperatures on microstructures and functional use properties.

Author Contributions

Conceptualization, C.L.R. (Chandra L. Reedy); methodology, C.L.R. (Chandra L. Reedy); software, C.L.R. (Cara L. Reed); validation, C.L.R. (Chandra L. Reedy); formal analysis, C.L.R. (Cara L. Reed); investigation, C.L.R. (Chandra L. Reedy); resources, C.L.R. (Chandra L. Reedy); data curation, C.L.R. (Chandra L. Reedy) and C.L.R. (Cara L. Reed); writing—original draft preparation, C.L.R. (Chandra L. Reedy); writing—review and editing, C.L.R. (Chandra L. Reedy) and C.L.R. (Cara L. Reed); visualization, C.L.R. (Chandra L. Reedy) and C.L.R. (Cara L. Reed); supervision, C.L.R. (Chandra L. Reedy); project administration, C.L.R. (Chandra L. Reedy); funding acquisition, C.L.R. (Chandra L. Reedy). All authors have read and agreed to the published version of the manuscript.

Funding

This research was partially funded by the U.S. National Park Service, National Center for Preservation Technology and Training, grant number P19AP00143.

Institutional Review Board Statement

Not applicable.

Informed Consent Statement

Not applicable.

Data Availability Statement

The data presented in this study are available on request from the corresponding author.

Acknowledgments

Terry J. Reedy provided valuable advice on data interpretation and review of the text. We also thank Gerald Poirier and the Advanced Materials Characterization Laboratory at University of Delaware for making the HR micro-CT equipment available.

Conflicts of Interest

The authors declare no conflict of interest.

References

  1. Rice, P.M. Pottery Analysis: A Sourcebook, 2nd ed.; The University of Chicago Press: Chicago, CA, USA, 2005. [Google Scholar]
  2. Tite, M.S. Determination of the firing temperature of ancient ceramics by measurement of thermal expansion: A reassessment. Archaeometry 2007, 11, 131–143. [Google Scholar] [CrossRef]
  3. Palmiter, T.V.; Johnson, P.F. Techniques for archaeothermometry. In Materials Issues in Art and Archaeology; Sayre, E.V., Vandiver, P., Druzik, J., Stevenson, C., Eds.; Materials Research Society: Pittsburgh, PA, USA, 1988; pp. 135–140. [Google Scholar]
  4. Hodges, H.W.M. The examination of ceramic materials in thin section. In The Scientist and the Archaeologist; Pyddock, E., Ed.; Roy: New York, NY, USA, 1963; pp. 101–110. [Google Scholar]
  5. Tite, M.S. Firing temperature determinations—How and why? In The Aim of Laboratory Analyses of Ceramics in Archaeology; Lindahl, A., Stilborg, O., Eds.; Almqvist and Wiksell International: Stockholm, Sweden, 1995; pp. 37–42. [Google Scholar]
  6. Santacreu, D.A. Materiality, Techniques and Society in Pottery Production; De Gruyter Open: Berlin, Germany, 2014. [Google Scholar]
  7. Maggetti, M. Phase analysis and its significance for technology and origin. In Archaeological Ceramics; Olin, J.S., Franklin, A.D., Eds.; Smithsonian Institution Press: Washington, DC, USA, 1982; pp. 121–133. [Google Scholar]
  8. Freestone, I.C.; Hughes, M.J. Appendix III: Examination of ceramics from Qasrij Cliff and Khirbet Qasrij. In Excavations at Qasrij Cliff and Khirbet Qasrij; Curtis, J., Collon, D., Eds.; British Museum: London, UK, 1989; pp. 61–75. [Google Scholar]
  9. González-Garcia, F.; Romero-Acosta, V.; García-Ramos, G.; González- García, M. Firing transformations of mixtures of clays containing illite, kaolinite and calcium carbonates used by ornamental tile industries. Appl. Clay Sci. 1990, 5, 361–375. [Google Scholar] [CrossRef]
  10. Echallier, J.C.; Mery, S. L’evolution mineralogique et physico-chimique des pates calcaires au cours de la caisson: Expérimentation en laboratoire et application archéologique. In Sciences de la Terre et Céramique Archéologiques: Experimentations, Applications, Documents et Travaux No. 16; Mery, S., Ed.; Centre Polytechnique Saint-Louis à Cercy: Cercy, France; pp. 87–120.
  11. Vaughn, S.J. Ceramic petrology and petrography in the Aegean. Am. J. Archaeol. 1995, 99, 115–117. [Google Scholar]
  12. Henderson, J. The Science and Archaeology of Materials; Routledge: London, UK, 2000. [Google Scholar]
  13. Chandler, G.M. Development of a Field Petrographic Analysis System and Its Application to the Study of Socioeconomic Interaction Networks of the Early Harappan Northwestern Indus Valley of Pakistan; British Archaeological Reports: Oxford, UK, 2001. [Google Scholar]
  14. Day, P.M.; Kilikoglou, V. Analysis of ceramics from the kiln. Hesperia Suppl. 2001, 30, 111–133. [Google Scholar] [CrossRef]
  15. Broekmans, T.; Adriaens, A.; Pantos, E. Insights into North Mesopotamian ‘metallic ware’. Archaeometry 2006, 48, 219–227. [Google Scholar] [CrossRef]
  16. Reedy, C.L. Thin-Section Petrography of Stone and Ceramic Cultural Materials; Archetype: London, UK, 2008. [Google Scholar]
  17. Allepuz, E.T. Colour transformation and texture change in biotite: Some remarks for the interpretation of firing technology in greyware pottery thin-sections. Minerals 2021, 11, 428. [Google Scholar] [CrossRef]
  18. Quinn, P.S. Thin Section Petrography Geochemistry & Scanning Electron Microscopy of Archaeological Ceramics; Archaeopress: Oxford, UK, 2022. [Google Scholar]
  19. Benetto, G.E.; Laviano, R.; Sabbatini, L.; Zambonin, P.G. Infrared spectroscopy in the mineralogical characterization of ancient pottery. J. Cult. Herit. 2002, 3, 177–186. [Google Scholar] [CrossRef]
  20. Kingery, W.D.; Vandiver, P.B. Ceramic Masterpieces: Art, Structure, and Technology; Free Press: New York, NY, USA, 1986. [Google Scholar]
  21. De Andres, A.M.; Balcazar, J.L. Study of ceramic sherds of Early Bronze Age shelters (Peña Corva, Guadalajara, Spain). In Archaeometry: Proceedings of the 25th International Symposium; Maniatis, Y., Ed.; Elsevier: Amsterdam, The Netherlands, 1989; pp. 593–601. [Google Scholar]
  22. Schneider, G. A technological study of North-Mesopotamian stoneware. World Archaeol. 1989, 21, 30–50. [Google Scholar] [CrossRef]
  23. Al-Saa’d, Z.; Roussan, A. Determination of the initial firing conditions of Ayyubid/Mamluk painted pottery excavated from northern Jordan. Geoarchaeology 1999, 14, 333–349. [Google Scholar] [CrossRef]
  24. Daszkiewicz, M.; Maritan, L. Experimental firing and re-firing. In The Oxford Handbook of Archaeological Ceramic Analysis; Hunt, A.M.W., Ed.; Oxford University Press: Oxford, UK, 2017; pp. 487–508. [Google Scholar]
  25. Reedy, C.L.; Vandiver, P.B.; He, T.; Xu, Y.; Wang, Y. Research into coal-clay composite ceramics of Sichuan Province, China. MRS Adv. 2017, 2, 2043–2079. [Google Scholar] [CrossRef]
  26. Reedy, C.L.; Vandiver, P.B.; He, T.; Xu, Y. Talc-rich black Tibetan pottery of Derge County, Sichuan Province, China. MRS Adv. 2017, 2, 1943–1968. [Google Scholar] [CrossRef]
  27. Trindade, M.J.; Dias, M.I.; Coroado, J.; Richa, F. Firing tests on clay-rich raw materials from the Algarve Basin (southern Portugal): Study of mineral transformations with temperature. Clay. Clay. Miner. 2010, 58, 188–204. [Google Scholar] [CrossRef]
  28. Rasmussen, K.L.; De La Fuente, G.A.; Bond, A.D.; Karshom Mathiesen, K.; Vera, S.D. Pottery firing temperatures: A new method for determining the firing temperature of ceramics and burnt clay. J. Archaeol. Sci. 2012, 39, 1705–1706. [Google Scholar] [CrossRef] [Green Version]
  29. Zhu, J.; Zhang, Y.; Wang, T.; Zhao, C.H.; Yu, J.C.; Glascock, M.D.; Wang, C.S. Determining the firing temperature of low-fired ancient pottery: An example from the Donghulin site, Beijing, China. Archaeometry 2014, 56, 562–572. [Google Scholar] [CrossRef]
  30. Maggetti, M.; Neururer, C.; Ramseyer, D. Temperature evolution inside a pot during experimental surface (bonfire) firing. Appl. Clay Sci. 2011, 53, 500–508. [Google Scholar] [CrossRef] [Green Version]
  31. Heinsch, M.F.; Vandiver, P.B.; Lyublyanovics, K.; Choyke, A.M.; Reedy, C.; Tourtellotte, P.; Chang, C. Ceramics at the emergence of the Silk Road: A case of village potters from southeastern Kazakhstan during the Late Iron Age. Mater. Res. Soc. Symp. Proc. 2015, 1656, 251–281. [Google Scholar] [CrossRef]
  32. Rye, O.S. Keeping your temper under control: Materials and the manufacture of Papuan pottery. APAO 1976, 9, 106–137. [Google Scholar]
  33. Park, K.S.; Milke, R.; Rybacki, E.; Reinhold, S. Application of image analysis for the identification of prehistoric ceramic production technologies in the North Caucasus (Russia, Bronze/Iron Age). Heritage 2019, 2, 2327–2342. [Google Scholar] [CrossRef] [Green Version]
  34. Morariu, V.V.; Bogdan, M.; Ardelean, I. Ancient pottery: Its pore structure. Archaeometry 1977, 19, 187–221. [Google Scholar] [CrossRef]
  35. Koh Choo, C.K.; Lee, Y.E.; Shim, I.W.; Choo, W.K.; Kim, G.H.; Huh, W.Y.; Chun, S.C. Compositional and microstructural study of Koryŏ celadon and whiteware excavated from Sŏri kiln in Kyŏnggi province. Archaeometry 2004, 46, 247–265. [Google Scholar] [CrossRef]
  36. Harry, G.K.; Johnson, A. A non-destructive technique for measuring ceramic porosity using liquid nitrogen. J. Archaeol. Sci. 2004, 31, 1567–1575. [Google Scholar] [CrossRef]
  37. Freyburg, S.; Schwarz, A. Influence of the clay type on the pore structure of structural ceramics. J. Eur. Ceram. Soc. 2006, 27, 1727–1733. [Google Scholar] [CrossRef]
  38. Coletti, C.; Cultrone, G.; Maritan, L.; Mazzoli, C. Combined multi-analytical approach for study of pore system in bricks: How much porosity is there? Mater. Charact. 2016, 121, 82–92. [Google Scholar] [CrossRef]
  39. Delbrouck, O.; Janssen, J.; Ottenburgs, R.; Van Oyen, P.; Viaene, W. Evolution of porosity in extruded stoneware as a function of firing temperature. Appl. Clay Sci 1993, 8, 187–192. [Google Scholar] [CrossRef]
  40. Ricci, G. Archaeometric Studies of Historical Ceramic Materials. Ph.D. Thesis, Università Ca’ Foscari, Venezia, Italy, 2016. Available online: http://dspace.unive.it/bitstream/handle/10579/10321/956083-1186678.pdf?sequence=2 (accessed on 7 November 2022).
  41. Dunsmuir, J.H.; Vandiver, P.B.; Chianelli, R.R.; Deckman, H.W.; Hardenberg, J.H. X-ray microtomography of ceramic artifacts. In Materials Issues in Art and Archeology IV; Vandiver, P.B., Druzik, J.R., Galvin Madrid, J.L., Freestone, I.C., Wheeler, G.S., Eds.; Materials Research Society: Pittsburgh, PA, USA, 1995; pp. 73–83. [Google Scholar]
  42. Kahl, W.-A.; Ramminger, B. Non-destructive fabric analysis of prehistoric pottery using high-resolution X-ray microtomography. J. Archeol. Sci. 2012, 39, 2206–2212. [Google Scholar] [CrossRef]
  43. Sobott, R.; Bente, K.; Kittel, M. Comparative porosity measurements on ceramic materials. Old Potter’s Almanack 2014, 19, 18–25. [Google Scholar]
  44. Sanger, M.C. Investigating pottery vessel manufacturing techniques using radiographic imaging and computed tomography: Studies from the Late Archaic American Southwest. J. Archaeol. Sci. Rep. 2016, 9, 586–598. [Google Scholar] [CrossRef]
  45. Gomart, L.; Weiner, A.; Gabriele, M.; Durrenmath, G.; Sorin, S.; Angeli, L.; Colombo, M.; Fabbri, C.; Maggi, R.; Panelli, C.; et al. Spiralled patchwork in pottery manufacture and the introduction of farming to Southern Europe. Antiquity 2017, 91, 1501–1514. [Google Scholar] [CrossRef]
  46. Kozatsas, J.; Kotsakis, K.; Sagris, D.; David, K. Inside out: Assessing pottery forming techniques with micro-CT scanning. J. Archaeol. Sci. 2018, 100, 102–119. [Google Scholar] [CrossRef]
  47. Bernardini, F.; Leghissa, E.; Prokop, D.; Velušček, A.; De Min, A.; Dreossi, D.; Donato, S.; Tuniz, C.; Princivalle, F.; Montagnari Kokelj, M. X-ray computed tomography of Late Copper Age decorated bowls with cross-shaped foots from central Slovenia and the Trieste Karst (North-Eastern Italy): Technology and paste characterization. Archaeol. Anthropol. Sci. 2019, 11, 4711–4728. [Google Scholar] [CrossRef]
  48. St. John, A. Inside Perspectives on Ceramic Manufacturing: Visualizing Ancient Potting Practices through Micro-CT Scanning. Ph.D. Thesis, University of Western Ontario, Ontario, ON, Canada, 2020. Available online: https://ir.lib.uwo.ca/etd/7502/ (accessed on 7 November 2022).
  49. Nickerson, S.; Shu, Y.; Zhong, D.; Könke, C.; Tandia, A. Permeability of porous ceramics by X-ray CT image analysis. Acta Mater. 2019, 172, 121–130. [Google Scholar] [CrossRef]
  50. Buchner, T.; Kiefer, T.; Zelya-Lainez, L.; Gaggi, W.; Konegger, T. A multitechnique quantitative characterization of the pore space of fired bricks made of the five clayey raw materials used in European brick industry. Appl. Clay Sci. 2021, 200, 105884. [Google Scholar] [CrossRef]
  51. Reedy, C.L.; Reedy, C.L. High-resolution micro-CT with 3D image analysis for porosity characterization of historic bricks. Herit. Sci. 2022, 10, 83. [Google Scholar] [CrossRef]
  52. Du Plessis, A.; Babatunde, J.O.; Boshoff, W.P.; le Roux, S.G. Simple and fast porosity analysis of concrete using X-ray computed tomography. Mater. Struct. 2016, 49, 553–562. [Google Scholar] [CrossRef]
  53. Stark, M. The chronology, technology and contexts of earthenware ceramics in Cambodia. In Earthenware in Southeast Asia; Miksic, J.N., Ed.; Singapore University Press: Singapore, 2003; pp. 208–229. [Google Scholar]
  54. Ea, D. Angkorian kilns in mainland South East Asia. South East Asian Rev. 2009, 34, 1–50. [Google Scholar]
  55. Marriner, G.P.; Grave, P.; Kealhofer, L.; Stark, M.T.; Ea, D.; Chhay, R.; Kaseka, P.; Boun Suy, T. New dates for old kilns: A revised radiocarbon chronology of stoneware production for Angkorian Cambodia. Radiocarbon 2018, 60, 901–924. [Google Scholar] [CrossRef]
  56. Thirion-Merle, V.; Desbat, A.; Thierrin-Michael, G.; Hong, R. The kiln sites of the “Torp Chey” area (Cambodia). Bull. De l’ÉCole Française d’ExtrĚMe-Orient 2020, 106, 195–224. [Google Scholar] [CrossRef]
  57. Rawson, J.; Tite, M.S.; Hughes, M.J. The export of Tang Sancai wares: Some recent research. TOCS 1989, 52, 39–61. [Google Scholar]
  58. Kerr, R.; Wood, N. Science and Civilization in China. Vol. 5, Chemistry and Chemical Technology, Part XII: Ceramic Technology; Cambridge University Press: Cambridge, UK, 2004; pp. 474–488. [Google Scholar]
  59. Jiang, Q. Tang Sancai. Ph.D. Thesis, University of Oxford, Oxford, UK, 2009. [Google Scholar]
  60. Cui, J.; Rehren, T.; Lei, Y.; Cheng, X.; Jiang, J.; Wu, X. Western technical traditions of pottery making in Tang Dynasty China: Chemical evidence from the Liquanfang Kiln site, Xi’an city. J. Archaeol. Sci. 2010, 37, 1502–1509. [Google Scholar] [CrossRef]
  61. Reedy, C.L.; Kivi, N.J.; Vandiver, P.B. Technological achievements of the Xiba Kiln of Leshan City, Sichuan Province. In 2018 International Symposium on Ancient Ceramics —It’s Scientific and Technological Insights; Chen, S., Ed.; Shanghai Institute of Ceramics, Chinese Academy of Sciences: Shanghai, China, 2018; pp. 68–77. [Google Scholar]
  62. Li, W.; Luo, H.; Li, J.; Lu, X.; Guo, J. The white porcelains from Dehua kiln site of China: Part II: Microstructure and its physicochemical basis. Ceram. Int. 2011, 37, 651–658. [Google Scholar] [CrossRef]
  63. Vandiver, P.B. Variability of Song Dynasty green glaze technology using microstructure, microcomposition and thermal history to compare Yaozhou, Jun, Ru, Yue, Longquan, Guan, and Korean Koryo Dynasty materials and practices. In Proceedings of International Symposium on Science and Technology of Five Great Wares of the Song Dynasty; Shi, N., Miao, J., Eds.; Science Press: Beijing, China, 2016; pp. 391–432. [Google Scholar]
  64. Rastelli, S. The Yaozhou Kilns: A Re-Evaluation. Ph.D. Thesis, School of Oriental and African Studies, University of London, London, UK, 2017. [Google Scholar]
  65. Huang, S.; Freestone, I.C.; Zhu, Y.; Shen, L. The introduction of celadon production in North China: Technological characteristics and diversity of the earliest wares. J. Archaeol. Sci. 2020, 114, 105057. [Google Scholar] [CrossRef]
  66. Bugani, S.; Camaiti, M.; Morselli, L.; Van de Casteele, E.; Janssens, K. Investigation on porosity changes of Lecce stone due to conservation treatments by means of X-ray nano- and improved micro-computed tomography: Preliminary results. X-ray Spectrom. 2007, 36, 316–320. [Google Scholar] [CrossRef]
  67. Object Research Systems. Available online: http://www.theobjects.com/company/index.html (accessed on 15 September 2022).
  68. Otsu, N. A threshold selection method from gray-level histograms. IEEE Trans. Man. Cybern. 1979, 9, 62–66. [Google Scholar] [CrossRef] [Green Version]
  69. Gostick, J.; Aghighi, M.; Hinebaugh, J.; Tranter, T.; Hoeh, M.A.; Day, H.; Spellacy, B.; Sharqawy, M.H.; Bazylak, A.; Burns, A.; et al. OpenPNM: A pore network modeling package. Comput. Sci. Eng. 2016, 18, 60–74. [Google Scholar] [CrossRef] [Green Version]
  70. Munawar, M.J.; Lin, C.; Cnudde, V.; Bultreys, T.; Dong, C.; Zhang, X.; De Boever, W.; Zahid, M.A. Petrographic characterization to build an accurate rock model using micro-CT: Case study on low-permeable to tight turbidity sandstone from Eocene Shahejie Formation. Micron 2018, 109, 22–33. [Google Scholar] [CrossRef] [PubMed]
  71. Stefanidou, M.A. Assimilation of porosity in modern bricks by computational means. WIT Trans. Eng. Sci. 2007, 57, 313–318. [Google Scholar]
  72. Reedy, C.L. Incorporating image analysis into ceramic thin-section petrography. In Twenty-Year Retrospective of National Center for Preservation Technology and Training Sponsored Archeology; Britt, T., Ed.; National Center for Preservation Technology and Training: Natchitoches, LA, USA, 2017; pp. 47–54. [Google Scholar]
  73. Cultrone, G.; Sebastián, E.; Elert, K.; de la Torre, M.J.; Cazalla, O.; Rodriguez-Navarro, C. Influence of mineralogy and firing temperature on the porosity of bricks. J. Eur. Ceramic. Soc. 2004, 24, 547–564. [Google Scholar] [CrossRef]
  74. Vandiver, P.B.; Koehler, C.G. Structure, processing, properties, and style of Corinthian transport amphoras. In Technology and Style; Kingery, W.D., Ed.; The American Ceramic Society, Inc.: Columbus, OH, USA, 1986; pp. 173–215. [Google Scholar]
  75. Klobes, P.; Meyer, K.; Murro, R.G. Porosity and Specific Surface Area Measurements for Solid Materials. NIST Special Publication 960–17; National Institute of Standards and Technology: Washington, DC, USA, 2006. [Google Scholar]
  76. Grubeša, I.N.; Vračevič, M.; Ducman, V.; Marković, B.; Szenti, I.; Kukovecz, Á. Influence of the size and type of pores on brick resistance to freeze-thaw cycles. Materials 2020, 13, 3717. [Google Scholar] [CrossRef]
  77. Borelli, E. Porosity; ICCROM: Rome, Italy, 1999. [Google Scholar]
  78. Gavilán, A.B.R.; Esteban, M.A.R.; Iglesias, M.N.A.; Perez, M.P.S.; Olea, M.S.C.; Valdizán, J.C. Experimental study of the mechanical behaviour of bricks from 19th and 20th century buildings in the province of Zamora (Spain). Infrastructures 2018, 3, 38. [Google Scholar] [CrossRef] [Green Version]
  79. Studart, A.R.; Gonzenback, U.T.; Tervoort, E.; Gauckler, L.J. Processing routes to microporous ceramics: A review. J. A, Ceram. Soc. 2006, 89, 1771–1789. [Google Scholar] [CrossRef]
  80. Orts, M.J.; Escardino, A.; Amorós, J.L.; Negre, F. Microstructural changes during the firing of stoneware floor tiles. Appl. Clay Sci. 1993, 8, 193–225. [Google Scholar] [CrossRef]
  81. Kariem, H.; Hellmich, C.; Kiefer, T.; Jäger, A.; Füssi, J. Micro-CT-based identification of double porosity in fired clay objects. J. Mater. Sci. 2018, 53, 9411–9428. [Google Scholar] [CrossRef] [Green Version]
  82. Haruzi, P.; Katsman, R.; Halisch, M.; Waldmann, N.; Spiron, B. Benchmark study using a multi-scale, multi-methodological approach for the petrophysical characterization of reservoir sandstones. Solid Earth 2021, 12, 665–689. [Google Scholar] [CrossRef]
  83. Puskarczyk, E.; Krakowska, P.; Jedrychowski, M.; Habrat, M.; Madejski, P. A novel approach to the quantitative interpretation of petrophysical parameters using nano-CT: Example of Paleozoic carbonates. Acta Geophys. 2018, 66, 1453–1461. [Google Scholar] [CrossRef] [Green Version]
  84. Thomson, P.-R.; Aituar-Zhakupova, A.; Hier-Majumder, S. Image segmentation and analysis of pore network geometry in two natural sandstones. Front. Earth Sci. 2018, 6, 58. [Google Scholar] [CrossRef] [Green Version]
  85. Liu, H.; Ma, C.; Zhu, C. X-ray micro CT based characterization of pore-throat network for marine carbonates from South China Sea. Appl. Sci. 2022, 12, 2611. [Google Scholar] [CrossRef]
  86. López-Arce, P.; Zornoza-Indart, A.; Gomez-Villalba, L.; Pérez-Monserrat, E.M.; Alvarez de Buergo, M.; Vivar, G.; Fort, R. Archaeological ceramics amphorae from underwater marine environments: Influence of firing temperature on salt crystallization decay. J. Eur. Ceram. Soc. 2013, 33, 2031–2042. [Google Scholar] [CrossRef]
  87. Porous Microstructure Analysis (PuMA). Available online: https://software.nasa.gov/software/ARC-17920-1A (accessed on 29 September 2022).
Figure 1. Typical pore size, shape, and homogeneity of a low-fired organic tempered ceramic (left) versus a high-fired fine-sand tempered ceramic (right). Thin sections mounted in blue-dyed epoxy and viewed in plane polarized light.
Applsci 12 11448 g001
Figure 2. The cylindrical ROI of one of the samples from ceramic 4, viewed from one end (left); the same ROI segmented with a deep learning model based on sensor 3D architecture to separate pores (marked as blue here) from silica-rich particles (marked as red) and ceramic matrix (marked as yellow) (center); and an ROI with only pores (18.7 vol.%) visible (right).
Applsci 12 11448 g002
Figure 3. Cylindrical ROI, viewed from the side, of a sample from ceramic 10 (3.95 vol.% pores) combined with a sparse graph of pores (upper ROI transparent so pore system is fully visible). On the left, only the pores are shown; on the right, only the connections. Pore size is colored by connectivity (fewest to most connections: blue, green, yellow, orange, red) and connections are colored by length (shortest to longest: purple, blue, green, yellow, orange, red).
Applsci 12 11448 g003
Figure 4. A dense graph of pores for the same sample shown in Figure 3, showing only the connections (shortest to longest: purple, blue, green, yellow, orange, red). Since all individual pixels in connections are shown, the pathways are depicted in more detail than in the sparse graph in Figure 3, right.
Applsci 12 11448 g004
Figure 5. Volume percent pores for ceramic type (mean of 2) by firing temperature.
Applsci 12 11448 g005
Figure 6. Ratio of pores that are accessible to any surface and the interior-only pores by firing temperature for each ceramic type (mean of 2).
Applsci 12 11448 g006
Figure 7. A sample from ceramic 2 (left) (13.9 vol.% pores, 12.2% accessible to a surface) has a surface/interior pores ratio of 7.1. In contrast, a sample from ceramic 11 (right) (1.3 vol.% pores, 0.2% surface-accessible) has a surface/interior pores ratio of 0.2. Pores accessible to a surface are shown in blue, and interior-only pores are in red.
Applsci 12 11448 g007
Figure 8. Maximum pore volume goes down as firing temperature rises. Points are mean of 2.
Applsci 12 11448 g008
Figure 9. Pore volume-to-surface area increases with firing temperature, indicating more spherical pores at the higher temperatures. Points are mean of 2.
Applsci 12 11448 g009
Figure 10. Pore mean Feret diameter increases with firing temperature. Points are mean of 2.
Applsci 12 11448 g010
Figure 11. The minimum orthogonal Feret diameter/maximum Feret diameter, a measure of pore elongation, decreases with higher firing temperatures. Points are mean of 2.
Applsci 12 11448 g011
Figure 12. A thin section of ceramic 11 (left) shows a feldspar that melted quickly, leaving a rounded pore surrounded by a nest of mullite; a high-fired Jun-glazed ceramic (right) formed glass in place of the feldspar, with round pores from the release of gases during vitrification. Both images are viewed in transmitted plane polarized light; pores are blue.
Applsci 12 11448 g012
Figure 13. Minimum orthogonal Feret diameter/maximum Feret diameter. A sample from ceramic 1 (900 °C) (upper) compared with one from ceramic 8 (1150 °C) (lower).
Applsci 12 11448 g013
Figure 14. Maximum pore connectivity mean values (left) go down with increased firing temperature, indicating more isolated unconnected pores form in the higher-fired ceramic products. This situation is also indicated by the fact that the percentage of pores unconnected (right) is shown to rise with higher firing temperatures. Points are mean of 2.
Applsci 12 11448 g014
Figure 15. Sparse graphs of pores: (upper), low-fired ceramic 1; (lower), high-fired ceramic 12. Pores are colored by connectivity, with dark red for high connectivity down through degrees of red to white for low connectivity. Connections color-coded by length.
Applsci 12 11448 g015
Figure 16. Dense graphs of pores, with pores not shown, only the connections/throats that join them. (Upper), ceramic 1 (27.6 vol.% pores); (lower), ceramic 11 (1.99 vol.% pores). Connections are color-coded by Euclidean length. The many connections for ceramic 1 are all on the shorter end of the spectrum (purple, blue, and a few green) whereas the connections in ceramic 11 have more variation and range up to yellow and orange on the longer end of the spectrum. Ceramic 1 also shows more tortuosity (winding rather than direct connections) than ceramic 11.
Applsci 12 11448 g016
Figure 17. The ratio of edges to vertices rises with increased firing temperature. Points are the mean of 2.
Applsci 12 11448 g017
Figure 18. Processing and fabrication effects include inhomogeneous distribution of pore sizes and shapes (left) from incomplete kneading of the clay; and elongated parallel-aligned pores (right) from fabrication methods involving application of pressure. Both views are in transmitted plane polarized light, with pores blue.
Applsci 12 11448 g018
Figure 19. At lower firing temperatures (left), minerals such as quartz begin to melt, creating many connected intragranular pores. At higher temperatures (right), more grains will completely vitrify, leaving more isolated pores. Both are transmitted plane polarized light, with pores blue.
Applsci 12 11448 g019
Table 1. Ceramic sherds studied with firing temperature ranges.
Ceramic TypeSherd AppearanceFiring Temperature
  • Southeast Kazakhstan, Late Iron Age, red-washed earthenware
Applsci 12 11448 i001900 °C [31]
2.
Southeast Kazakhstan, Late Iron Age, reduced earthenware, cream slip
Applsci 12 11448 i0021000 °C [31]
3.
Cambodia, Bangkong Kiln, 9th–10th C., Siem Reap, stoneware
Applsci 12 11448 i0031000–1200 °C [53,54,55]
4.
Cambodia, Torpchey Kiln 13th–15th C., Siem Reap, brown-glazed stoneware
Applsci 12 11448 i0041000–1200 °C [54,55,56]
5.
Gaoxian, Sichuan, China, modern workshop, coal cinder-tempered, ash-glazed
Applsci 12 11448 i0051050 °C [25]
6.
Derge, Sichuan, China, modern workshop, black graphite-rich clay
Applsci 12 11448 i0061050–1150 °C [26]
7.
Sancai glazed whiteware, Gongyi, Henan, China, Tang Dynasty *
Applsci 12 11448 i0071100–1200 °C [56,57,58,59,60]
8.
Yingjing, Sichuan, China, modern workshop, coal cinder-tempered, ash-glazed
Applsci 12 11448 i0081150 °C [25]
9.
Xiba Kiln, Sichuan, China, Song Dynasty *, grey stoneware with thick glaze
Applsci 12 11448 i0091150–1225 °C [61]
10.
Dehua Kiln, Fujian, China, Song Dynasty *, white-glazed porcelain
Applsci 12 11448 i0101240–1390 °C [62]
11.
Celadon, Yaozhou Kiln, Shaanxi, China, Song Dynasty *, green-glazed
Applsci 12 11448 i0111300–1320 °C [63,64]
12.
Xing Kiln, Hebei, China, Song Dynasty *, white-glazed porcelain
Applsci 12 11448 i0121320–1380 °C [65]
* Tang Dynasty, 618–907; Song Dynasty, 960–1279.
Table 2. Mean volume percent pores, mean percentage surface accessible, and the ratio of pores accessible to a surface versus interior-only pores.
CeramicPore Volume %% Surface
Accessible
Ratio of Surface/
Interior Pores
130.529.020.3
215.413.47.0
314.09.52.4
417.215.28.0
517.215.38.3
613.512.07.7
72.81.51.1
815.711.42.7
93.51.60.9
103.41.00.4
111.10.20.3
122.10.50.3
The lowest value of the means for each variable is in blue; the highest value is in red. Each value is the mean of 2 for that ceramic type.
Table 3. Volume percent pores, percent surface accessible, and the ratio of pores accessible to a surface versus interior-only pores.
CeramicPore Volume %% Surface
Accessible
Ratio of Surface/
Interior Pores
127.626.016.4
133.332.024.2
216.814.76.9
213.912.27.1
315.712.23.4
312.36.871.3
418.717.09.9
415.713.46.0
517.215.27.7
517.115.48.9
612.911.47.7
614.112.57.8
72.461.301.1
73.151.651.1
815.611.32.6
815.711.52.8
93.581.600.8
93.481.670.9
103.951.080.4
102.830.8500.4
110.8700.2100.3
111.290.2200.2
121.990.4400.3
122.270.4800.3
Table 4. Significant (p < 0.05) variables related to size and shape parameters of pore multi-ROIs.
No.Volume Max
109 µm3
Surface Area Max
108 µm2
Surface Area SD
106 µm2
Vol/Surface Area Mean µmVol/Surface Area SD µmAspect Ratio MeanMean Feret Diameter Mean µmMax Feret Diameter Mean µmMin Ortho Feret Diameter Mean µmMin Ortho/Max Feret Diameter Mean µm
125.817.54.722.911.050.14030.136.220.90.660
29.545.661.963.211.360.17535.342.623.40.630
35.472.871.354.102.430.22551.262.231.20.600
410.78.493.453.251.450.16037.545.423.80.635
510.25.392.693.511.810.19039.648.326.40.635
65.524.212.073.211.400.16535.844.624.30.640
70.6440.4980.3534.412.200.28549.861.333.30.610
87.866.012.163.711.890.20543.553.128.00.620
90.1670.1430.1634.672.620.27057.471.134.30.575
100.08730.02790.05745.602.840.31568.085.138.70.525
110.03010.01060.02975.532.680.28568.086.738.50.525
120.02730.01020.02225.412.230.33560.773.437.70.565
The lowest value of the means for each variable is in blue; the highest value is in red. Each value is the mean of 2 for that ceramic type number.
Table 5. Significant (p < 0.05) connectivity variables; sparse graphs of pores.
CeramicPore Connectivity MaxPore Connectivity MeanPore Connectivity SD% of the Pores Unconnected
153.52.922.031.5
228.02.131.593.0
317.01.861.345.0
421.02.391.562.0
518.52.191.503.0
620.02.241.552.3
714.01.601.3911.3
822.52.241.654.5
913.01.471.179.0
106.51.060.76016.0
115.50.9850.60513.5
125.50.9250.64019.0
The lowest value of the means for each variable is in blue; the highest value is in red. Each value is the mean of 2 for that ceramic type.
Table 6. Significant pore variables (p < 0.05); dense graphs.
CeramicPore Connectivity MaxPore Connectivity MeanPore Connectivity SDSegment Tortuosity MeanVertex Length SDEdge Length SD
164.52.231.101.2550.438.1
232.02.060.8351.2658.747.7
317.01.970.6801.2563.953.1
427.02.100.7901.2450.738.8
519.52.050.7301.2760.749.6
622.52.070.8101.2549.938.3
716.01.880.8101.2452.740.7
824.52.070.8601.2552.640.8
913.01.850.6951.2564.554.2
106.51.710.6101.2477.766.9
115.51.650.6001.1794.187.2
126.01.550.6751.1861.353.1
The lowest value of the means for each variable is in blue; the highest value is in red. Each value is the mean of 2 for that ceramic type.
Table 7. Significant (p < 0.05) pore network variables from Open PNM.
CeramicRatio of # of Edges/# of VerticesEdge Equivalent Diameter Mean, µmVertex Equivalent Diameter Mean, µm
14.35127235
25.10129239
35.60120232
45.55119235
55.15125240
65.35122232
76.45155308
85.75120234
96.15163324
106.40146292
116.50182363
126.45150302
The lowest value of the means for each variable is in blue; the highest value is in red. Each value is the mean of 2 for that ceramic type.
Publisher’s Note: MDPI stays neutral with regard to jurisdictional claims in published maps and institutional affiliations.

