Abstract
Unstable slip of a fault block is considered to be the main cause of shallow earthquakes. However, the underlying mechanism of the stability-to-instability transition of faults has not been fully understood. Here, we used the stiffness ratio, which is the ratio between the shear stiffness of the fault subjected to direct shear and the critical stiffness to evaluate the fault stability degree from stable to unstable slip, and examined the effects of normal stress, roughness, and slip displacement on the fault stability. Our experimental results show that with the increase in slip displacement, the shear stiffness change in stable slip mainly includes four stages, namely “rapid increase–keep unchanged–slow increase–rapid decrease”, and unstable slip tends to occur in the last two stages. This process of shear stiffness change is accelerated by the increase in normal stress and the decrease in fault roughness. Our study reveals that fault stability over slip is mutually dictated by asperity interlocking and wear-induced gouge. Asperity interlocking controls fault stability when the gouge amount is low, whereas the fault gouge prevails with the increased wear of the fault surface since the gouge generated during slip can participate in the subsequent friction process. Thus, we infer that the stable–unstable transition of fault over slip is a spontaneous process due to the interplay of asperity interlocking and wear-induced gouge lubrication.
1. Introduction
Stick-slip, as a form of unstable slip on faults, is a source of crustal earthquakes [1]. According to the stick-slip theory, the occurrence of most crustal earthquakes is due to the sudden slip of pre-existing faults blocks, while the rock fracturing is only reflected in the extension of fault ends and the wear on the fault surface [2,3]. Therefore, the occurrence of crustal earthquakes depends on the stability rather than the strength of seismic faults. A large number of seismic activities have occurred in sedimentary rocks due to the fluid injections for shale gas development and the disposal of wastewater from oil and gas fields [4,5,6,7]. Sandstone was chosen as the study object for this test.
In recent years, many scholars have studied the unstable slip of faults blocks [8,9,10,11,12,13,14,15,16,17,18,19,20]. They found that the high normal stress and the rough surface increase the shear stress drop during unstable slip. Fault gouge also has an important influence on the slip both in natural faults and experimental-laboratory faults [21,22,23,24,25,26,27]. Most previous studies focused on the effects of normal stress, roughness, and slip displacement on the fault strength or friction coefficient but have not fully researched the transition of faults from stable to unstable slip. Additionally, the impact of fault gouge on fault block slip stability also needs to be further explored.
In order to study the effect of fault gouge on fault block slip stability, some researchers conducted shear tests using fault gouge of different materials, shapes, thicknesses, and humidity conditions [28,29,30,31,32,33] and observed the changes in the thickness, composition, porosity, and microstructure of the gouge [34,35,36,37,38]. It is found that the faults could be weakened by fault gouge when the seismic slip rate is 0.1–10 m/s, independent of the rock type [34], and the weakening mechanisms that they assume to be dominant include flash heating, nanopowder lubrication, a dehydration reaction, decarbonation reaction and thermal pressure [39,40,41,42,43,44,45,46,47,48,49,50,51,52]. These studies reveal as the fault gouge influences fault mechanical properties. As a matter of fact, the fault gouge layer generated by fault block slip, due to the wear of the fault surface, participates in the slip and affects the fault stability, but it was not fully examined in previous research.
This study aims to explore the transition of fault from stable to unstable slip and evaluates the impact of the fault gouge layer on slip stability which has not been fully researched. We conducted direct shear tests with three kinds of normal stress and two kinds of roughness surfaces under constant normal load, measured the shear stiffness of the fault stable slip, and then studied the factors affecting the stability of fault block slip.
2. Materials and Methods
2.1. Sample Materials
The tests were carried out on rock samples. To reduce the influence of other factors on tests, the red sandstone with uniform material and stable mechanical properties was selected as the research object. The red sandstone used in our test was sourced from the Shaximiao Formation formed during the Middle to Late Jurassic period, Zigong City, Sichuan Province, China. The grain size of red sandstone ranges from 0.3 to 270 μm, and the average grain size was 101.9 μm. The cementation of red sandstone will be measured when we have the available equipment. According to the XRD analysis, the main mineral components of the red sandstone are quartz and feldspar, indicating that it consists of a subarkose type sandstone. The specific mineral composition and basic mechanical parameters of the red sandstone are shown in Table 1 and Table 2, respectively.

Table 1.
Rock mineral composition.
Table 2.
Basic mechanical parameters of red sandstone.
During the test, samples of the same batch were used to eliminate the differences in composition and grain size between rocks. To make the moisture content of samples consistent, samples were dried before the start of each test. The mass of the sample remains constant with the increase in drying time after oven drying at 60 ℃ for 24 hours. We define the sample in this state as dry.
The sandstone surface was roughened with silicon carbide grit sandpapers. This can make the surface flat and give the surface the same roughness. The size of the upper sample in the slip direction was smaller than that of the lower sample to ensure the same contact area during fault block slip. Photographs and dimensions of the rock samples and photos of the 3D laser survey of the fault surface are shown in Figure 1.
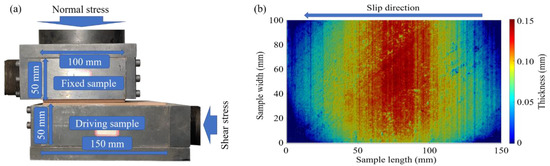
Figure 1.
Sample photographs. (a) Photograph and dimension of the rock samples. (b) Photo of the 3D laser survey of the fault surface, which was roughened with #60 silicon carbide grit sandpapers.
2.2. Test Scheme
The direct shear apparatus was chosen as the test machine. The machine is mainly composed of three parts: a shear box, a loading system, and displacement measurement system. Both normal and shear stress loading systems provide a maximum load of 500 KN with a load accuracy of 0.01 KN. The displacement measurement system consists of a normal displacement sensor and a shear displacement sensor. The loading method of the testing machine includes force loading and displacement loading.
In this study, direct shear tests were used to simulate fault block slip in natural state. The normal stress, surface roughness, and slip displacement were selected as variables for indoor small-scale test research. The shear stiffness of faults under different test conditions was measured. To reduce the cross-influence between different factors, this test adopted the method of controlling a single variable. Only one influencing factor was changed in each group of tests to reduce the interaction between different factors.
The specific test process is divided into two stages: the pre-loading stage and the formal-loading stage. During the pre-loading stage, a shear force preload is required to eliminate poor interlock between surface asperities and ensure the accuracy of the shear stiffness calculation. The specific steps of the pre-loading stage are to load the normal force to the target value and then load the shear force. After the shear displacement reaches 1 mm (Figure 2b), the shear and normal forces are unloaded. During the formal-loading stage, the normal force is first loaded at a loading rate of 0.5 KN/s. When this normal force is loaded to the target value, it remains constant, and then the shear displacement is loaded at a loading rate of 0.05 mm/s. Until the shear displacement at this stage reaches 4 mm (Figure 2b), the shear and normal forces are unloaded. When the force is completely unloaded, the second stage is repeated until an unstable slip occurs or the fault cumulative slip displacement reaches 41 mm.
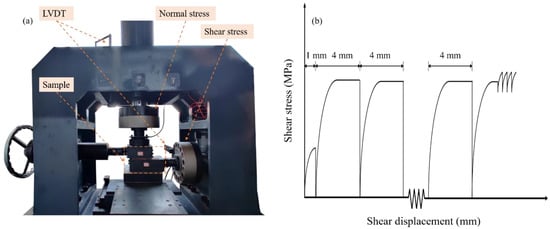
Figure 2.
Fault block slip experiment. (a) Shear test apparatus (LVDT: Linear Variable Displacement Transducer). (b) Schematic diagram of loading method.
2.3. Stability Evaluation
In our study, fault block slip is stable when the shear stress/friction coefficient remains nearly constant after reaching its peak, and it is unstable when the stick-slip occurs with periodic up-and-down in the shear stress/friction coefficient [28,54].
Shear stiffness (ks) and critical stiffness (kc) are two physical quantities in the process of fault block slip. The shear stiffness is governed by the mechanical state of faults, while the critical stiffness is governed by the interaction between the elastic stiffness of the shear test apparatus and the friction properties of faults. The ratio between ks and kc is called the stiffness ratio. Rice [55] proposed that stiffness ratio can predict the slip state of faults. When ks > kc, the fault block slip is stable; when ks < kc, the fault block slip is unstable; and when the ks and kc are close to each other, the faults behave as slow-slip faults [28,54]. This means that the fault block slip behavior spectrum is a function of the stiffness ratio, and the change trend of slip stability of faults can be reflected by the stiffness ratio.
2.4. Shear Stiffness
Shear stiffness is the ratio of shear stress to the corresponding shear displacement prior to reaching the peak shear strength. Figure 3a shows the calculation method of the shear stiffness, and the calculation formula is [56,57]:
where ks is the shear stiffness of the fault in GPa; Δτ is the increment of shear stress in MPa; and Δu is the increment of the corresponding shear displacement in mm.
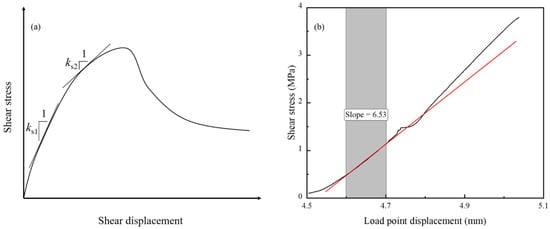
Figure 3.
Shear stiffness calculation. (a) Typical stress-related displacement [57]. (b) Loading curve of direct shear test. The red line is the best-fitting line with the smallest error for the loading curve, which is fitted by the curve in the shade.
The shear stiffness under various stresses is different before the shear strength peaks. Therefore, it is necessary to find the elastic loading stage, that is, the linear segment of the loading curve. The shear stiffness is calculated according to the curve gradient at this stage. A program was developed to calculate the gradient of the elastic loading curve. The main idea is to start from the first data point and select one-fifth of the total number of data points for grouping. Each group of data adopts the least square method to fit the straight line. All fitted straight lines were subjected to error analysis. The gradient of straight line with the smallest error is selected as the gradient of the elastic loading curve, and this gradient corresponds to the fault shear stiffness.
As shown in Figure 3b, the shear test was carried out with a shear loading rate of 0.05 mm/s under constant normal stress of 5 MPa, and the surface was roughened with #60 sandpaper [29,54]. The gradient of the fitted straight line with the smallest error is 6.53 in this test, so the shear stiffness of the fault is taken as 6.53 GPa m−1.
2.5. Roughness Evaluation
To study the effect of the fault surface roughness on the slip stability, the surfaces of samples were roughened either with #1200 or #60 silicon carbide grit sandpapers. Thereby, two kinds of fault surfaces with different roughness are obtained. After the surface roughening was completed, the INNO-SCAN handheld 3D scanner was used to measure the surface data to obtain contour coordinates of the fault surface topography. The instrument has a scanning accuracy of 0.025 mm. In this study, the surface roughness was quantified to distinguish the fault surfaces roughened with different sandpapers.
In 1973, Barton first proposed the concept of the joint roughness coefficient (JRC), which is used to describe the roughness of joint surface quantitatively. Ten typical contour lines of JRC in the range of 0~20 were proposed [58,59].
In order to better quantify the roughness of joint surfaces, the following statistical parameters were defined based on the coordinate information of the two-dimensional contour line of the joint surface: root mean square value (RMS), centerline mean value (CLA), first derivative root mean square (Z2), second derivative root mean square (Z3), direction characteristic parameter (Z4), and structure function (SF), etc.
In this study, two roughness parameters, the Z2 proposed by Myers [60] in 1962 and the Z2s proposed by T. Belem [61] in 2000, were tested to assess the surface roughness of faults. According to the test results, the most suitable surface roughness quantification parameters for this study were selected. The applied formulas were:
where L is the horizontal length of the contour line, and yi is the height of the contour line when the abscissa is equal to xi, and
where Nx was the number of points along the x-axis; Ny was the number of points along the y-axis; Δx and Δy were the sampling steps along the x and y axes; and was the height at the coordinates .
Both methods need to take points on the fault surface and then calculate the roughness parameters according to the coordinates of the points. The selection of the spacing between adjacent points is very important, and different point spacing may lead to different results.
A test was carried out to select a suitable point spacing. As shown in Figure 4, the size of the fault surface is 100 mm × 150 mm, and the transverse direction is the shearing direction. The main step is to take three sets of contour lines along the shearing direction on the same fault surface. Each set of contour lines contains more than 950 contour lines. In each group of contour lines, the interval between adjacent contour lines is 0.1 mm. In different contour line groups, the distances between adjacent contour lines are 0.03 mm, 0.03 mm, and 0.04 mm, respectively. The point spacing on the contour lines is 0.03 mm, 0.05 mm, 0.1 mm, 0.3 mm, 0.5 mm, 0.7 mm, and 1 mm. Z2 and Z2s are calculated according to the coordinates of the point.
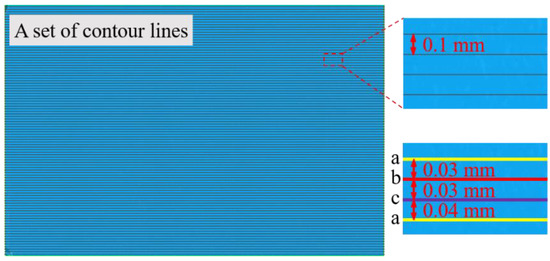
Figure 4.
Selection of fault surface contour lines. The different letters (a, b, c) represent the contour lines in different contour line groups respectively.
Figure 5a shows the standard deviations of the roughness parameters at different positions on fault surfaces. When the distance between adjacent points is less than 0.3 mm, the standard deviation of Z2 and Z2s calculated by the three sets of contour lines is larger. The calculation results of roughness parameters are unstable under this condition. When the distance between adjacent points is 0.3 mm–1 mm, the standard deviation of Z2 and Z2s calculated by 3 sets of profile lines is small. The roughness parameters are relatively stable under this condition. Figure 5b shows the ratio of the average values of roughness parameters on the fault surfaces that were roughened with #60 and #1000 sandpapers. When the distance between adjacent points is 0.3 mm, the ratio of Z2s calculated for the two kinds of surfaces is the largest. Therefore, when the point spacing is 0.3 mm, Z2s ensures the stability of the calculation results and distinguishes two kinds of roughness surfaces.
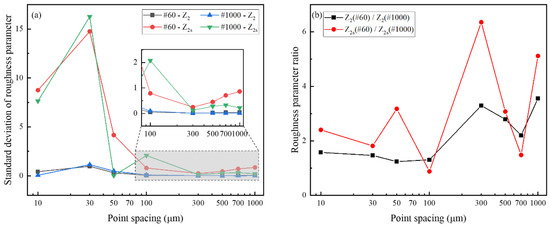
Figure 5.
Roughness parameter calculation results. (a) Standard deviation of roughness parameters calculated by taking into account points with different point spacings for three groups of contour lines. (b) Ratio of average values of different roughness parameters of fault surfaces which were roughened with #60 and #1000 sandpapers.
Therefore, before the pre-loading stage, points were taken on the contour line at 0.3 mm intervals, and Z2s was calculated to evaluate the surface roughness. As shown in Table 3, according to the roughness parameter results, it is necessary to ensure that the Z2s of surfaces roughened with #60 sandpaper is 0.7~2.1, and the Z2s of surfaces roughened with #1000 sandpaper is 0.12~0.34.
Table 3.
Results of average roughness parameters at different point spacings.
3. Results
3.1. Normal Stress
The surface of the sandstone samples was roughened with #60 sandpaper. Tests were carried out at shear rate of 0.05 mm/s and normal stress of 3 MPa, 4 MPa, and 5 MPa, respectively. Three groups of tests were conducted with the same loading method. The result curves of tests with the same loading method were drawn using the same color. The influence of normal stress on slip stability is studied. The shear stiffness is calculated according to the elastic section gradient of the shear stress loading curve before the shear strength peaks.
As shown in Figure 6a,b, when the normal stress is 3 MPa, the slip is stable throughout tests. When the normal stress is 5 MPa, two groups of tests produce unstable slip when the slip displacement reaches 29 mm and 33 mm, respectively, while the third group of tests does not produce unstable slip. When the normal stress is 7 MPa, the three groups of tests produce unstable slip when the slip displacement reaches 21 mm, 26 mm, and 27 mm, respectively.
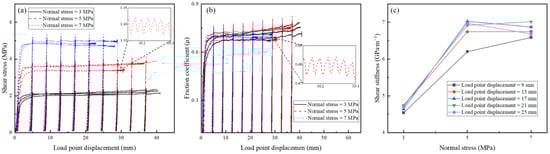
Figure 6.
Test results with different normal stress. (a) Trend of shear stress on faults with slip displacement. (b) Trend of friction coefficient on faults with slip displacement. (c) Trend of the average shear stiffness on faults with normal stress.
Figure 6c shows the trend of the average shear stiffness of faults calculated for the three sets of repeatable tests with the normal stress. The shear stiffness of the fault is smaller at normal stress of 3 MPa and larger at normal stress of 5 MPa and 7 MPa. Meanwhile, the shear stiffness of the fault is constant at normal stress comprised between 5 MPa and 7 MPa.
3.2. Roughness
The surface of the sandstone samples was roughened with #60 and #1000 sandpapers to study the effect of surface roughness on slip stability. The normal stress of the tests was 5 MPa, and the shear rate was 0.05 mm/s. A surface roughened with #60 sandpaper is defined as a rough surface, while a surface roughened with #1000 sandpaper is defined as a smooth surface.
Figure 7a,b shows that when the rough surface is used for shear tests, two groups of tests produce unstable slip when the slip displacement reaches 29 mm and 33 mm, respectively, and the third group of tests does not produce unstable slip. When the smooth surface is used for the shear tests, one group of tests produced unstable slip when the slip displacement reached 37 mm, and the other two groups of tests maintained stable slip during the whole shearing process. The more unstable slip occurs on the rough surface, but this does not mean that the rough surface is more prone to unstable slip. The slip displacement is similar when two kinds of surface tests produce unstable slip.
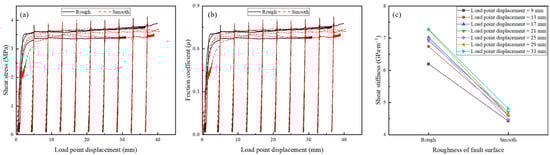
Figure 7.
The test results with two kinds of fault surfaces. The surface roughened with #60 sandpaper is defined as a rough surface, and the Z2s is 0.7~2.1. The surface roughened with #1000 sandpaper is defined as a smooth surface, and the Z2s is 0.12~0.34. (a) Trend of shear stress on faults with slip displacement. (b) Trend of friction coefficient on faults with slip displacement. (c) Trend of the average shear stiffness on faults with roughness of fault surfaces.
Figure 7c shows the relationship between surface roughness and the average shear stiffness calculated from three sets of repeatable tests. The average shear stiffness is between 6.1 and 7.3 in rough surface tests, whereas it is between 4.4 and 4.9 in smooth surface tests.
3.3. Slip Displacement
The surface of the sandstone samples was roughened with #60 and #1000 sandpapers. Tests were carried out at a shear rate of 0.05 mm/s and normal stress of 3 MPa, 4 MPa, and 5 MPa, respectively. The shear stiffness at different loading points displacements is measured.
Figure 8a shows the trend of shear stiffness with slip displacement under different normal stress. When the normal stress is 3 MPa and 5 MPa, the shear stiffness shows a rapid increase trend at the beginning, then remains constant, and finally shows a slow increase trend again after the slip displacement reaches 33 mm and 29 mm, respectively. When the normal stress is 7 MPa, the shear stiffness shows a trend of “rapid increase–keep unchanged–slow increase–rapid decrease”. Figure 8b shows the trend of shear stiffness with slip displacement under different roughness surfaces. The shear stiffnesses of smooth and rough surfaces increases rapidly until the shear displacements reach 9 mm and 17 mm, respectively, then remains unchanged, and finally increases slowly again.
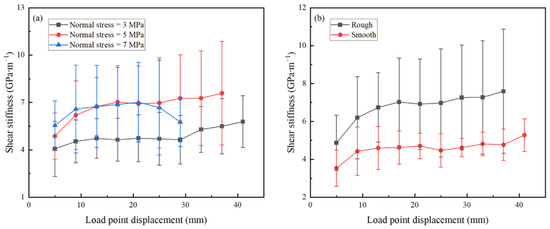
Figure 8.
Test results with different slip displacements. The average value of the repeated test results is each data point, and the standard deviation is the length of error bar. (a) Trend of the average shear stiffness with the slip displacement under different normal stresses. (b) Trend of the average shear stiffness with the slip displacement under different roughness of the fault surfaces.
4. Discussion
The whole process of fault from stable to unstable slip was tested with different normal stress, roughness, and slip displacement to study the slip stability. Shear stiffness, as a key parameter of fault, was measured to evaluate fault stability.
4.1. Normal Stress
The large normal stress leads to a small stiffness ratio and a greater tendency to unstable slip. The value of shear stiffness increases with the normal stress when the normal stress is low, and it remains constant when the normal stress is large.
When the normal stress is 3 MPa, the shear stiffness of faults is small, and the shear stiffness of faults is greater than the critical stiffness, so faults maintain stable slip. Both the shear stiffness and critical stiffness of faults increase with increasing normal stress, and the increase in critical stiffness is larger. This results in the shear stiffness at a normal stress of 5 MPa and 7 MPa being larger than that at 3 MPa, but unstable slip still occurs when the slip displacement is larger. The shear stiffness remains constant as the normal stress increases from 5 MPa to 7 MPa, but the critical stiffness continues to increase.
The interaction between asperities and the lubrication of fault gouge may be the main reason for the variation in shear stiffness. As shown in Figure 9, when fault block slip, the climbing mode and the fracture mode occur simultaneously between the asperities on fault surfaces. When the normal stress is low, the climbing mode is the dominant form of asperities interaction, resulting in low shear stiffness. When the normal stress is high, the interlocking between the surface asperities is stronger, resulting in the fracture mode accounting for the main form during the shearing process and an increase in shear stiffness. As the normal stress continues to increase, the interaction mode between asperities does not change. Higher normal stress would lead to strong asperity interlocking, thereby increasing shear stiffness, and the enhanced interaction between asperities causes more asperities to fracture, producing more fault gouge particles. The fault gouge could participate in the shearing process of the fault as a lubricant reducing the shear stiffness. A combination of two factors results in a constant shear stiffness under high normal stress.
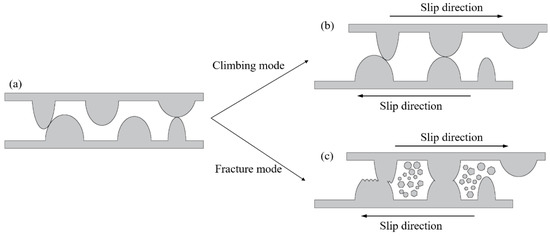
Figure 9.
Two asperities interaction modes. (a) The state of the asperities before the slip of the fault block. (b) Climbing mode: When the normal stress is small, the asperities will not break. The friction behavior is mainly dominated by the overriding/climbing between the asperities. (c) Fracture mode: Fracture of the asperities occurs due to large shear stress when the normal stress is large. Fracture mode associated with the production of fault gouge [15].
In summary, when the normal stress is low, both the shear stiffness and the critical stiffness increase with the normal stress, but the critical stiffness increases faster. As the normal stress increases, the fault shear stiffness remains constant, and the critical stiffness continues to increase when the normal stress is high, which causes faults to be more prone to unstable slip.
4.2. Roughness
The value of shear stiffness of the rough surface is significantly greater than that of the smooth surface, even though the two kinds of surfaces used in the test studies are both flat at large scales. It shows that the shear stiffness is strongly influenced by the surface roughness.
The shear displacement at the stable slip of tests with rough and smooth surfaces is 30~40 mm. Therefore, the stiffness ratios of the two kinds of surfaces are close to each other. The smooth surface causes small shear stiffness and critical shear stiffness. The fault gouge generated by the wear of the fault surface may be the main reason for the difference in shear stiffness.
The interlock is stronger due to the small variation of asperities on the smooth surface. This result in the faster generation of the fault gouge and the smaller size of fault gouge particles, which favors the faults lubrication and shear stiffness reduction. The large variation between asperities leads to poor interlock, small true contact area, and large true normal stress on rough surfaces, so the fault block with rough surface produces more unstable slip
4.3. Slip Displacement
The value of shear stiffness is the smallest at the beginning of tests, and it increases with the slip of the fault block. The fault block slip is unstable when the shear stiffness value is less than the critical stiffness value. The critical stiffness is low when the fault block slip displacement is short. As the shear slip displacement increases, the critical stiffness gradually increases. This result is similar to that obtained by Leeman in 2016 [28]. The research used a 3 mm thick layer of quartz mud to simulate fault gouge and found that the critical stiffness increased first and then remained stable with slip displacement.
The interplay of asperity interlocking and gouge lubrication may be the main reason for the variation in shear stiffness. At the beginning of tests, the interaction between the asperities on fault surfaces is poor, making the small value of shear stiffness. As the displacement of the slip increases, the interaction between asperities becomes strong, and the contact area between fault surfaces increases due to the high asperities being sheared, which leads to a rapid increase in shear stiffness.
Fault gouge is continuously generated during the fault block slip, and it can lubricate the fault. Furthermore, the lubrication effect would be enhanced as the fault gouge particles break up and tend to be spherical in shape. Therefore, as the displacement of the slip increases, although the asperity interlocking gradually increases, the shear stiffness remains constant.
Two kinds of surfaces of the sandstone samples used in the test studies are rough at small scales but flat at large scales. Therefore, the sample first experience a transient, high wear rate followed by a considerably lower steady-state wear rate [47,62]. We believe that the amount of fault gouge remains constant when the slip displacement of the fault block is large. The fault gouge is continuously crushed and compacted under normal stress, which leads to an increase in the fault gouge compactness and the shear stiffness. The shear stiffness is more likely to enter the slowly increasing stage with high normal stress and tight compaction effect of fault gouge.
As the displacement of the slip increases, the particle size of the fault gouge decreases. A high-strain shear zone appears in the fault gouge and is parallel to the fault surface boundary, which obviously weakens the fault and decreases shear stiffness [35,47]. High normal stress is more conducive to the formation of high-strain shear zones. Therefore, the value of shear stiffness decreases rapidly in the final stage when the normal stress is large.
5. Conclusions
We studied the effect of new fault gouge produced by the wear of the fault surface and revealed that fault stability over slip is influenced by asperity interlocking and the fault gouge.
The experimental measurements showed that the shear stiffness is mainly four phases, including “rapid increase, keep unchanged, slow increase, and rapid decrease” over the whole slip process. An unstable slip is more likely to occur in the last two stages. The small fault surface roughness and the large normal stress favor fault unstable slip. When the slip displacement is short, the mechanical properties of the fault are mainly controlled by the interaction of asperities. If the main form of asperities interaction is climbing mode, the fault is more prone to stable slip. If it is fracture mode, more fault gouge could produce due to large normal stress, smooth surface, and long slip displacement. After fault gouge separates the asperities, it becomes the main factor controlling the fault block slip. Faults are more prone to unstable slip due to more fault gouge particles, smaller gouge particle sizes, and near-spherical gouge particle shapes. In addition, when the slip displacement is long, a high-strain shear zone is formed inside the fault gouge, which leads to a rapid decrease in shear stiffness and the unstable slip of the fault block.
The present study shows that the external test conditions mainly control the fault block slip stability by affecting the interaction of asperities on the fault surface and the lubrication properties of the fault gouge. The analysis of asperity interaction and the fault gouge lubrication may become a promising way to judge whether the fault could cause an earthquake.
Author Contributions
Conceptualization, Y.L. and C.T.; Data curation, W.S. and X.W.; Formal analysis, W.S. and X.W.; Methodology, Y.L.; Project administration, Y.L. and C.T.; Resources, C.T.; Writing—original draft, W.S. and X.W.; Writing—review & editing, Y.L. and C.T. All authors have read and agreed to the published version of the manuscript.
Funding
This research received financial support from the ‘Xinghai Scholar’ program of Dalian University of Technology.
Institutional Review Board Statement
Not applicable.
Informed Consent Statement
Not applicable.
Data Availability Statement
All the data associated with this study has been reported in the manuscript.
Conflicts of Interest
The authors declare no conflict of interest.
References
- Brace, W.F.; Byerlee, J.D. Stick-slip as a mechanism for earthquakes. Science 1966, 153, 990–992. [Google Scholar] [CrossRef] [PubMed]
- Brace, W.F. Laboratory studies of stick-slip and their application to earthquakes. Tectonophysics 1972, 14, 189–200. [Google Scholar] [CrossRef]
- Scholz, C.H. Earthquakes and friction laws. Nature 1998, 391, 37–42. [Google Scholar] [CrossRef]
- Wang, L.; Kwiatek, G.; Rybacki, E.; Bohnhoff, M.; Dresen, G. Injection-induced seismic moment release and laboratory fault slip: Implications for fluid-induced seismicity. Geophys. Res. Lett. 2020, 47, e2020GL089576. [Google Scholar] [CrossRef]
- Lei, X.L.; Su, J.R.; Wang, Z.W. Growing seismicity in the Sichuan Basin and its association with industrial activities. Sci. China-Earth Sci. 2020, 63, 1633–1660. [Google Scholar] [CrossRef]
- Deng, F.H.; Dixon, T.H.; Xie, S.R. Surface deformation and induced seismicity due to fluid injection and oil and gas extraction in western texas. J. Geophys. Res. Solid Earth 2020, 125, e2019JB018962. [Google Scholar] [CrossRef]
- Vasco, D.W.; Alfi, M.; Hosseini, S.A.; Zhang, R.; Daley, T.; Ajo-Franklin, J.B.; Hovorka, S.D. The seismic response to injected carbon dioxide: Comparing observations to estimates based upon fluid flow modeling. J. Geophys. Res. Solid Earth 2019, 124, 6880–6907. [Google Scholar] [CrossRef]
- Ji, Y.; Wu, W.; Zhao, Z. Unloading-induced rock fracture activation and maximum seismic moment prediction. Eng. Geol. 2019, 262, 105352. [Google Scholar] [CrossRef]
- Tinti, E.; Scuderi, M.M.; Scognamiglio, L.; Di Stefano, G.; Marone, C.; Collettini, C. On the evolution of elastic properties during laboratory stick-slip experiments spanning the transition from slow slip to dynamic rupture. J. Geophys. Res. Solid Earth 2016, 121, 8569–8594. [Google Scholar] [CrossRef]
- Bürgmann, R. The geophysics, geology and mechanics of slow fault slip. Earth Planet. Sci. Lett. 2018, 495, 112–134. [Google Scholar] [CrossRef]
- Passelégue, F.X.; Aubry, J.; Nicolas, A.; Fondriest, M.; Deldicque, D.; Schubnel, A.; Di Toro, G. From fault creep to slow and fast earthquakes in carbonates. Geology 2019, 47, 744–748. [Google Scholar] [CrossRef]
- Gu, Y.; Wong, T.F. Effects of loading velocity, stiffness, and inertia on the dynamics of a single degree of freedom Spring-Slider System. J. Geophys. Res. Solid Earth 1991, 96, 21677–21691. [Google Scholar] [CrossRef]
- Passelègue, F.X.; Schubnel, A.; Nielsen, S.; Bhat, H.S.; Deldicque, D.; Madariaga, R. Dynamic rupture processes inferred from laboratory microearthquakes. J. Geophys. Res. Solid Earth 2016, 121, 4343–4365. [Google Scholar] [CrossRef]
- Segall, P.; Rubin, A.M.; Bradley, A.M.; Rice, J.R. Dilatant strengthening as a mechanism for slow slip events. J. Geophys. Res. Solid Earth 2010, 115, 1–37. [Google Scholar] [CrossRef]
- Chen, X.F.; Carpenter, B.M.; Reches, Z. Asperity failure control of stick-slip along brittle faults. Pure Appl. Geophys. 2020, 177, 3225–3242. [Google Scholar] [CrossRef]
- Ji, Y.; Hofmann, H.; Duan, K.; Zang, A. Laboratory experiments on fault behavior towards better understanding of injection-induced seismicity in geoenergy systems. Earth Sci. Rev. 2022, 226, 103916. [Google Scholar] [CrossRef]
- Yamashita, F.; Fukuyama, E.; Xu, S.; Kawakata, H.; Mizoguchi, K.; Takizawa, S. Two end-member earthquake preparations illuminated by foreshock activity on a meter-scale laboratory fault. Nat. Commun. 2021, 12, 4302. [Google Scholar] [CrossRef]
- Bedford, J.D.; Faulkner, D.R.; Allen, M.J.; Hirose, T. The stabilizing effect of high pore-fluid pressure along subduction megathrust faults: Evidence from friction experiments on accretionary sediments from the Nankai Trough. Earth Planet. Sci. Lett. 2021, 574, 117161. [Google Scholar] [CrossRef]
- Lei, X.L.; Li, S.N.; Liu, L.Q. Seismic b-value for foreshock AE events preceding repeated stick-slips of pre-cut faults in granite. Appl. Sci. 2018, 8, 2361. [Google Scholar] [CrossRef]
- Li, Y.; Du, X.; Ji, Y. Prediction of the transitional normal stress of rock joints under shear. Int. J. Rock Mech. Min. Sci. 2022, 159, 105203. [Google Scholar] [CrossRef]
- Yund, R.A.; Blanpied, M.L.; Tullis, T.E.; Weeks, J.D. Amorphous material in high strain experimental fault gouges. J. Geophys. Res. Solid Earth 1990, 95, 15589–15602. [Google Scholar] [CrossRef]
- Marone, C. Earthquake science faults greased at high speed. Nature 2004, 427, 405–406. [Google Scholar] [CrossRef] [PubMed]
- Reches, Z.E.; Wilson, B.; Dewers, T.; Brune, J. Particle size and energetics of gouge from earthquake rupture zones. Nature 2005, 434, 749–752. [Google Scholar]
- Mizoguchi, K.; Hirose, T.; Shimamoto, T.; Fukuyama, E. Moisture-related weakening and strengthening of a fault activated at seismic slip rates. Geophys. Res. Lett. 2006, 33, L16319. [Google Scholar] [CrossRef]
- Scholz, C.H. Wear and gouge formation in brittle faulting. Geology 1987, 15, 493–495. [Google Scholar] [CrossRef]
- Sibson, R.H. Fault rocks and fault mechanics. J. Geol. Soc. 1977, 133, 191–213. [Google Scholar] [CrossRef]
- Engelder, J.T. Cataclasis and the generation of fault gouge. Bull. Geol. Soc. Am. 1974, 85, 1515–1522. [Google Scholar] [CrossRef]
- Leeman, J.R.; Saffer, D.M.; Scuderi, M.M.; Marone, C. Laboratory observations of slow earthquakes and the spectrum of tectonic fault slip modes. Nat. Commun. 2016, 7, 11104. [Google Scholar] [CrossRef]
- Scuderi, M.M.; Marone, C.; Tinti, E.; Di Stefano, G.; Collettini, C. Precursory changes in seismic velocity for the spectrum of earthquake failure modes. Nat. Geosci. 2016, 9, 695–700. [Google Scholar] [CrossRef]
- Leeman, J.R.; Marone, C.; Saffer, D.M. Frictional mechanics of slow earthquakes. J. Geophys. Res. Solid Earth 2018, 123, 7931–7949. [Google Scholar] [CrossRef]
- Shreedharan, S.; Bolton, D.C.; Rivière, J.; Marone, C. Preseismic fault creep and elastic wave amplitude precursors scale with lab earthquake magnitude for the continuum of tectonic failure modes. Geophys. Res. Lett. 2020, 47, e2020GL086986. [Google Scholar] [CrossRef]
- Lyu, Z.; Rivière, J.; Yang, Q.; Marone, C. On the mechanics of granular shear: The effect of normal stress and layer thickness on stick-slip properties. Tectonophysics 2019, 763, 86–99. [Google Scholar] [CrossRef]
- Mngadi, S.B.; Tsutsumi, A.; Onoe, Y.; Manzi, M.; Nakatani, M. The effect of a gouge layer on rupture propagation along brittle shear fractures in deep and high-stress mines. Int. J. Rock Mech. Min. Sci. 2020, 137, 104454. [Google Scholar] [CrossRef]
- Di Toro, G.; Han, R.; Hirose, T.; De Paola, N.; Nielsen, S.; Mizoguchi, K.; Ferri, F.; Cocco, M.; Shimamoto, T. Fault lubrication during earthquakes. Nature 2011, 471, 494–498. [Google Scholar] [CrossRef] [PubMed]
- Smith, S.A.F.; Nielsen, S.; Di Toro, G. Strain localization and the onset of dynamic weakening in calcite fault gouge. Earth Planet. Sci. Lett. 2015, 413, 25–36. [Google Scholar] [CrossRef]
- Kocharyan, G.G.; Novikov, V.A.; Ostapchuk, A.A.; Pavlov, D.V. A study of different fault slip modes governed by the gouge material composition in laboratory experiments. Geophys. J. Int. 2017, 208, 521–528. [Google Scholar] [CrossRef]
- Scuderi, M.M.; Collettini, C.; Viti, C.; Tinti, E.; Marone, C. Evolution of shear fabric in granular fault gouge from stable sliding to stick slip and implications for fault slip mode. Geology 2017, 45, 731–734. [Google Scholar] [CrossRef]
- Kenigsberg, A.R.; Rivière, J.; Marone, C.; Saffer, D.M. The effects of shear strain, fabric, and porosity evolution on elastic and mechanical properties of clay-rich fault gouge. J. Geophys. Res. Solid Earth 2019, 124, 10968–10982. [Google Scholar] [CrossRef]
- Hirose, T.; Shimamoto, T. Growth of molten zone as a mechanism of slip weakening of simulated faults in gabbro during frictional melting. J. Geophys. Res. Solid Earth 2005, 110, B05202. [Google Scholar] [CrossRef]
- Nielsen, S.; Di Toro, G.; Hirose, T.; Shimamoto, T. Frictional melt and seismic slip. J. Geophys. Res. Solid Earth 2008, 113, B01308. [Google Scholar] [CrossRef]
- Han, R.; Shimamoto, T.; Hirose, T.; Ree, J.-H.; Ando, J.-I. Ultralow friction of carbonate faults caused by thermal decomposition. Science 2007, 316, 878–881. [Google Scholar] [CrossRef] [PubMed]
- Han, R.; Hirose, T.; Shimamoto, T. Strong velocity weakening and powder lubrication of simulated carbonate faults at seismic slip rates. J. Geophys. Res. Solid Earth 2010, 115, B03412. [Google Scholar] [CrossRef]
- Mizoguchi, K.; Hirose, T.; Shimamoto, T.; Fukuyama, E. High-velocity frictional behavior and microstructure evolution of fault gouge obtained from Nojima fault, southwest Japan. Tectonophysics 2009, 471, 285–296. [Google Scholar] [CrossRef]
- De Paola, N.; Hirose, T.; Mitchell, T.; Di Toro, G.; Viti, C.; Shimamoto, T. Fault lubrication and earthquake propagation in thermally unstable rocks. Geology 2011, 39, 35–38. [Google Scholar] [CrossRef]
- Rice, J.R. Heating and weakening of faults during earthquake slip. J. Geophys. Res. Solid Earth 2006, 111, B05311. [Google Scholar] [CrossRef]
- Beeler, N.M.; Tullis, T.E.; Goldsby, D.L. Constitutive relationships and physical basis of fault strength due to flash heating. J. Geophys. Res. Solid Earth 2008, 113, B01401. [Google Scholar] [CrossRef]
- Reches, Z.; Lockner, D.A. Fault weakening and earthquake instability by powder lubrication. Nature 2010, 467, 452–456. [Google Scholar] [CrossRef]
- Noda, H.; Dunham, E.M.; Rice, J.R. Earthquake ruptures with thermal weakening and the operation of major faults at low overall stress levels. J. Geophys. Res. Solid Earth 2009, 114, B07302. [Google Scholar] [CrossRef]
- Brantut, N.; Schubnel, A.; Rouzaud, J.N.; Brunet, F.; Shimamoto, T. High-velocity frictional properties of a clay-bearing fault gouge and implications for earthquake mechanics. J. Geophys. Res. Solid Earth 2008, 113, B10401. [Google Scholar] [CrossRef]
- Yuan, F.; Prakash, V. Use of a modified torsional Kolsky bar to study frictional slip resistance in rock-analog materials at coseismic slip rates. Int. J. Solids Struct. 2008, 45, 4247–4263. [Google Scholar] [CrossRef][Green Version]
- Wu, N.; Liang, Z.Z.; Zhang, Z.H.; Li, S.H.; Lang, Y.X. Development and verification of three-dimensional equivalent discrete fracture network modelling based on the finite element method. Eng. Geol. 2022, 306, 106759. [Google Scholar] [CrossRef]
- Wu, N.; Liang, Z.; Li, Y.; Qian, X.; Gong, B. Effect of confining stress on representative elementary volume of jointed rock masses. Geomech. Eng. 2019, 18, 627–638. [Google Scholar]
- Alejano, L.R.; Muralha, J.; Ulusay, R.; Li, C.C.; Perez-Rey, I.; Karakul, H.; Chryssanthakis, P.; Aydan, O. ISRM suggested method for determining the basic friction angle of planar rock surfaces by means of tilt tests. Rock Mech. Rock Eng. 2018, 51, 3853–3859. [Google Scholar] [CrossRef]
- Mei, C.; Barbot, S.; Wu, W. Period-multiplying cycles at the transition between stick-slip and stable sliding and implications for the parkfield period-doubling tremors. Geophys. Res. Lett. 2021, 48, e2020GL091807. [Google Scholar] [CrossRef]
- Rice, J.R.; Ruina, A.L. Stability of Steady Frictional Slipping. J. Appl. Mech. 1983, 50, 343–349. [Google Scholar] [CrossRef]
- Muralha, J.; Grasselli, G.; Tatone, B.; Blümel, M.; Chryssanthakis, P.; Yujing, J. ISRM suggested method for laboratory determination of the shear strength of rock joints: Revised version. Rock Mech. Rock Eng. 2014, 47, 291–302. [Google Scholar] [CrossRef]
- Shahverdiloo, M.R.; Zare, S. Studying the normal stress influential factor on rock joint stiffness using CNL direct shear test. Arab. J. Geosci. 2021, 14, 2082. [Google Scholar] [CrossRef]
- Barton, N. Review of a new shear-strength criterion for rock joints. Eng. Geol. 1973, 7, 287–332. [Google Scholar] [CrossRef]
- Barton, N.; Choubey, V. The shear strength of rock joints in theory and practice. Rock Mech. 1977, 10, 1–54. [Google Scholar] [CrossRef]
- Myers, N.O. Characterization of surface roughness. Wear 1962, 5, 182–189. [Google Scholar] [CrossRef]
- Belem, T.; Homand-Etienne, F.; Souley, M. Quantitative parameters for rock joint surface roughness. Rock Mech. Rock Eng. 2000, 33, 217–242. [Google Scholar] [CrossRef]
- Power, W.L.; Tullis, T.E.; Weeks, J.D. Roughness and wear during brittle faulting. J. Geophys. Res. Solid Earth 1988, 93, 15268–15278. [Google Scholar] [CrossRef]
Publisher’s Note: MDPI stays neutral with regard to jurisdictional claims in published maps and institutional affiliations. |
© 2022 by the authors. Licensee MDPI, Basel, Switzerland. This article is an open access article distributed under the terms and conditions of the Creative Commons Attribution (CC BY) license (https://creativecommons.org/licenses/by/4.0/).