Featured Application
The results from this work demonstrate the effective use of machine vision and learning technologies to support the development and implementation of smart agriculture.
Abstract
This paper presents the application of machine vision and learning techniques to detect and identify the number of flower clusters on apple trees leading to the ability to predict the potential yield of apples. A new field robot was designed and built to collect and build a dataset of 1500 images of apples trees. The trained model produced a cluster precision of 0.88 or 88% and a percentage error of 14% over 106 trees running the mobile vehicle on both sides of the trees. The detection model was predicting less than the actual amount but the fruit flower count is still significant in that it can give the researcher information on the estimated growth and production of each tree with respect to the actions applied to each fruit tree. A bias could be included to compensate for the average undercount. The resulting F1-Score of the object detection model was 80%, which is similar to other research methods ranging from an F1-Score of 77.3% to 84.1%. This paper helps lay the foundation for future application of machine vision and learning techniques within apple orchards or other fruit tree settings.
1. Introduction
Apples are a predominate tree fruit crops grown world-wide with an estimated annual production of 124 million Mt produced over 4 million ha [1,2]. To increase economic sustainability and compete globally, apple growers are strategically improving returns by adopting new cultivars, rootstocks and orchard management practices that improve fruit quality. Additionally, there is also an urgent need to reduce labour, which accounts for over 60% of production costs.
Fruit trees must now be managed spatially at the single-tree level with a prescribed number of fruit per tree based on potential yield per hectare, and target fruit size at harvest [3,4]. Fruit trees produce an overabundance of flowers and excessive number of fruits for them to reach marketable size. Extra fruits are removed by chemical and hand thinning, which is one of the most important practices that determines profitability and influences fruit quality. The thinning process is currently a very inexact science and highly labor intensive, accounting for 35% of total labour costs, which is equal to the labour costs of harvesting. Employing mobile robotics, vision sensing, and artificial intelligence (AI) systems to estimate the number of flowers and developing apples, will transform the precision at which apples can be managed [5,6,7].
When an overabundance of fruit flowers is present during the blooming stage, the resulting size of the apples may become undesirable for the market. Processes such as hand or chemical thinning are used to ensure the proper number of fruits per tree [8,9]. By developing a mechanism that is capable of drastically decreasing the time needed to count the fruit flower will allow for a more efficient process, bringing researchers closer to discovering optimal techniques [5]. Pollination and pest control are the two main factors that determine the quality and the yield of the apples, but the lack of information with regard to how to properly maintain and balance ecosystem services are the main reason for crop failure [4]. Implementation of pollination and chemical pest control will not help if the knowledge behind when and how to incorporate them to the orchard is unknown.
1.1. Typical Orchard Setup
Most apple orchards follow a similar layout of multiple trees lined up in a row which are then spaced out by a specific distance and repeated for multiple rows. For most cases, apple orchards are setup with the trees spaced between m to and the row spacing between to [4,10,11,12] and narrower trees spaced to with row spacing of to [13,14].
Another measurement that was stated in all of the papers was the height of the tree. This depends on the age and type of tree, therefore the range for the height can vary significantly based on the apple tree used. The majority of the trees researched seemed to have a height ranging between to [7,11,12].
1.2. Benefits of Object Detection for Apple Orchards
The current issue in the agriculture field is that most of the machinery currently being used requires worker supervision [15,16,17]. The inclusion of automated machinery can greatly increase the yield produced compared to manual labour and lessen the load required as it is a very labour-intensive job [16,18,19,20].
Another benefit is that object detection allows for more information to be presented or collected at a faster rate. For each experiment, the number of fruit flowers is needed to understand the impact that the adjustments have made on the apple tree yield. This process can take a very long time based on the type of apple tree due to the significant number of fruit flowers or apples present. The authors in [6] experimented on the effects of pollination by covering some of the branches of an apple tree. To determine the benefits of pollination, the number of fruit flowers were counted and then compared to the amount fruits yielded by that branch [6]. It took approximately to observe and count two branches. With two observations per tree, each tree needed to fully count the fruit flowers. The authors also stated that during bloom period, each orchard was visited twice in two different observation periods [6]. Depending on the number of trees needed to be counted, the process would be excruciatingly long and tedious. With object detection, this process can be brought down to just 46 s per frame to detect an image which was obtained using the two-stage detector, Faster R-CNN [5].
The inclusion of automation can drastically increase the efficiency of the operation as well as the quality. The authors in [8,19,21] showed multiple computation speeds of different detection algorithms for an object detection application in agriculture with heavily occluded objects where the speeds ranged from the fastest () to the longest () [8]. The authors in [22] showed that detection algorithms were capable of obtaining an accuracy of 99.5% for segmentation and 95% for classification for almonds while having a computation time of less than .
There have been many different object detection algorithms used in the process of implementing autonomous operations for agriculture, with each algorithm having benefits for different applications and parameters. A common algorithm that is used is the two-stage detector, Faster R-CNN [17,23,24]. It can produce very accurate detections which is important in developing an efficient process [25]. Though the detection speed is not as fast compared to one-stage detectors, the purpose of the operation was to correctly identify the fruits and or branches in the orchard. Ref. [17] used Faster R-CNN to design a shake-and-catch robot for apples. The algorithm was trained to differentiate between the apples, leaves and branches and then locate the optimal location on the branch to have a robotic arm grab the branch. The authors in [23,24] both used Faster R-CNN to detect multiple different fruits and other produce on a tree, such as apples, mangoes, almonds, peppers, etc. They both were successful in obtaining accurate results with minor errors, especially in cases where less data was available [24] or with the detection of smaller objects [23].
The authors in [15] used MobileNet and a single-state detector (SSD) for the detection of tomatoes. MobileNet was used to implement the model on a smaller device, specifically the Raspberry Pi, which MobileNet allows due to having a low computational cost. SSD was selected for fast detection rate, while having an appropriate level of accuracy. Two tests were run, the first being object detection of tomatoes based on sample images and the second using a robotic arm to identify the location of the tomatoes and grabbing them [15]. The results produced a mean accuracy of 84% for the detection and 89% for the robotic arm successfully grabbing the fruit [15]. The loss in accuracy for the object detection was due to some of the images closely resembling the features of the trained tomato data, such as having similar shape or the tomato being too small and located in a dense region. This was a common issue as the purpose of the experiment was to differentiate between ripe and immature tomatoes [15].
Another one-stage detection algorithm that was used was YOLOv3. Ref. [20] used YOLOv3 to detect tomatoes, while [26] used YOLOv3 to detect apple lesions as the algorithm is known to have strong results with respect to small object detection [26]. Both papers used a similar technique to improve the performance of YOLOv3. By using a different backbone network from the original Darknet-53, both experiments were capable of obtaining higher accuracies [20,26]. This change was the implementation of DenseNet which allowed YOLOv3 to better utilize the image features compared to Darknet-53. As Darknet-53, having 53 layers resulted in the loss of features and weakening them. With this simple change, YOLOv3-Tomato was able to produce an identification rate of 94.58% [20] and YOLOv3-dense outperformed the original YOLOv3 and Faster R-CNN. Not only can YOLOv3 outperform Faster R-CNN in some applications, YOLOv4 which is the newest version of YOLO at the time was able to produce high accuracy results while being significantly faster than the other models [27].
Some adjustments and techniques that were used to improve the results were seen across the aforementioned papers. A simple step was adding external illumination to the machine to decrease the variance of natural light during the detection process [23]. Ref. [20] introduced training data that had different conditions to allow the model to be more robust to changes of natural conditions, such as illumination. Another approach was seen in [28], which obtained training data with a black cloth behind the white flowers of the trees to have the model set the images to a binary image. This allows for a simple segmentation of the flowers and everything else. The authors in [20,23] changed to ground truth boxes from rectangle to circle for objects with a circular shape such as apples and tomatoes. This produced better results as the ground truth encapsulated more of the actual object of interest than the rectangular ground truth boxes [20,23]. The final adjustment that was common between [20,23,26] were data augmentation. Whether it was flipping, scaling, flip and then scaling or crop and patching, they all helped the model produce better results, due to inducing the model to more variance. Ref. [26] also indicates that the more images being trained by the model, the higher the F1-score of the model will be. While [23] concluded that having data augmentations allows the model to achieve the same accuracy as a model with no data augmentation and more training images. In general, it can be assumed that implementing data augmentation techniques to the model as well as having more training data will produce the best results for the model.
1.3. Challenges
The most challenging problem is dealing with occlusion as there are usually many objects in a dense location in an agricultural setting [17,23,24,29]. Another important challenge that must be considered when designing an object detection system in agriculture is illumination [23,24,29]. Due to most operations occurring in an outside environment, variance in natural lighting can greatly affect the performance of the object detection algorithm. The authors in [23] explained that the distance from the object of interest is important as the smaller the object is when presented to the camera, the less information can be extracted. Other challenges consist of similar appearance, such as shape and colour, as well as multi-fruit detection cases. The authors in [20] experienced issues with differentiating between ripe and immature tomatoes in some cases due to the similarities in shape and colour [24].
Occlusion and illumination are the two challenges that this paper looks to address as they were the most relevant in terms of the environment used for the experiment. For occlusion, data from both sides of the apple tree is taken which will be used to average the data to decrease the effect of occlusion on the resulting fruit flower count. For the case of this experiment, illumination was overcome by being constant with the time of day for observation as well as the amount of sunlight for data collection to ensure proper detection of the fruit flowers. This paper presents a new fruit flower cluster detection strategy based on machine vision and learning which could be used as farmers work towards the concept of smart agriculture.
The remaining information of the paper will be presented as follows. Section 2 explains the experimental setup and the process and methods used for obtaining the fruit flower count. Section 3 presents results that were found from the object detection model, such as the flower count, precision and F1-Score, average error and distribution of flower count of the detected and hand-counted. Section 4 discusses the main findings and results. Section 5 concludes the paper.
2. Experimental Setup and Detection Method
This section describes the setup where and how the data was collected. It also describes the data collection process and proposed machine vision and learning method.
2.1. Environmental and Experimental Setup
The apple orchard studied was the Simcoe Research Station, located in Simcoe, Ontario, Canada, and involved a small portion of the research center which consisted of 86.8 hectares of land. The apple orchard that will be utilized for the experiments consisted of two rows of Ambrosia trees on M.9 rootstocks. Each row had 106 trees which had different treatment methods, which resulted in varying fruit flower yields. The trees were grouped by treatment methods with three in each group and two non-treated trees in-between. The Ambrosia trees had an in-row distance of and between-row distance of . The average height of the trees was and the canopy width was . An example of the placement of the Ambrosia trees can be observed in Figure 1.
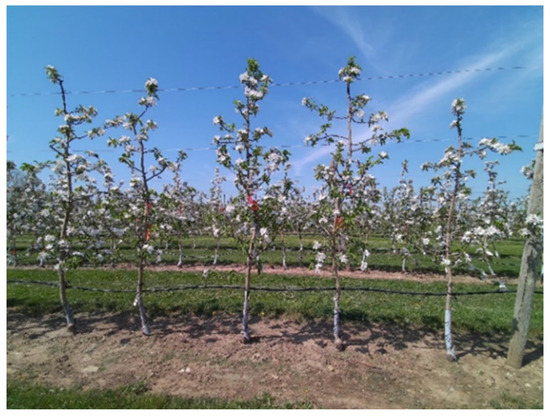
Figure 1.
Spacing of the Ambrosia trees at the Simcoe Research Station in Ontario, Canada.
Figure 2 shows a bird’s-eye view of the apple orchard. The camera was mounted on a mobile vehicle and was run between the two rows of the Ambrosia trees, placed so the trees are properly in frame of the camera. One side per run was scanned and the number of fruit flower and apples per tree was estimated. There were some challenges with regard to the occlusion of the fruit flower and/or apples. To combat this, either some predictor function was needed or both sides of the apple tree were observed and the results were combined (this is the most realistic solution for farmers). The camera that was used for data collection and online detection was Microsoft’s Azure Kinect DK.
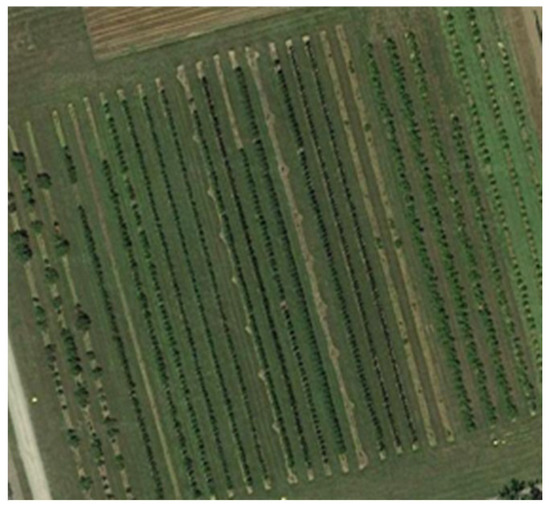
Figure 2.
Birds-eye view of the apple orchard used in the study.
The object detection algorithm, YOLOv4, will be trained on data similar to the one shown in Figure 1 to have a view of the full tree as well as the fruit flower clusters. An example of a fruit flower cluster can be seen in Figure 3. Once fully trained, the algorithm will be tested on data that the algorithm has not seen before, to ensure the algorithm is working properly. Once the algorithm is deemed successful with the dataset, physical testing will be conducted at the Simcoe Research Station using the aforementioned mobile vehicle shown in Figure 4 as the mounting platform.
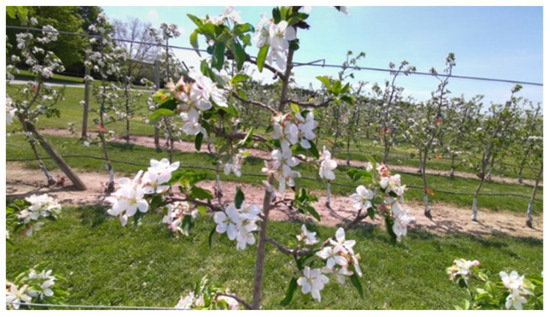
Figure 3.
Close-up view of the fruit flowers used in the study.
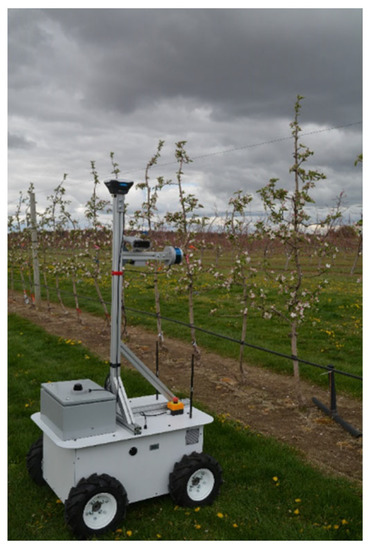
Figure 4.
Mobile robot platform that was used for the data collection.
2.2. Data Collection Process
2.2.1. Data Collection of Fruit Flowers
As briefly explained in Section 2.1, the photos and video for the dataset will be collected using the Azure Kinect DK camera from Microsoft. This camera has multiple different sensors implemented into the camera to help with different AI applications, such as a depth sensor, spatial microphone array, gyroscope and accelerometer [30]. It is also capable of regular color or RGB capturing as well as an infrared camera [30]. With these features in mind, this camera is capable of obtaining very detailed information for a wide variety of applications.
For the first collection of the fruit flower data for this specific case, the camera was connected to a 2015 MacBook Air running Ubuntu due to limitations with resources at the time. The camera was used to take zoomed-out photos and close-up photos, similar to Figure 1 and Figure 3, respectively. For the zoomed-out photos, the Azure Kinect DK camera was placed on top of a tripod for a stable photo. The purpose of these photos was to capture the entire tree, while the close-up photos were used to obtain a more detailed view of the fruit flowers. The close-up photos were obtained by taking a video of the fruit flowers and walking up and down the rows of the orchard. Then, using a video splicing tool, separate photos were obtained which were then filtered to take out any photos that had visual issues, such as blurry photos. These steps were repeated for 3 trips at the Simcoe Research Station until a satisfactory amount of fruit flower photos were obtained for labelling.
When more resources were available, such as the development of the mobile vehicle by another Graduate Student, more data was collected the following year. This consisted of driving the mobile vehicle up and down the orchard rows at a set distance to obtain zoomed-out photos of the apple trees. Multiple trips were completed to ensure enough data was collected. Manual counting of the fruit flower clusters was also conducted to have a comparison for the performance of the model when fully trained.
2.2.2. Labelling Process for the Dataset
After all the images were collected and properly filtered, they were transferred from a storage device to OneDrive for easy access on multiple platforms. The labelling process uses an online labelling platform called Labelbox [31]. As this is an online service, labelling the dataset can be done with any computer as long as they have access to the project. This again helps when collaboratively working on labeling the dataset as there is no need in transferring and downloading large number of photos. This platform was also chosen as it keeps track of how many photos still need labelling and the estimated time it took per photo. The platform was also very easy to use as there were no other external setup needed other than an account to the service.
With the help of hired undergraduate students at the University of Guelph, it took about a month to completely label 1499 photos. The photos consisted of a mixture of close-up and zoomed-out photos which involved classes, labelled as “Fruit Flower Single”, “Fruit Flower Cluster” and “Tree”. An example of the training dataset can be seen in below in Figure 5.
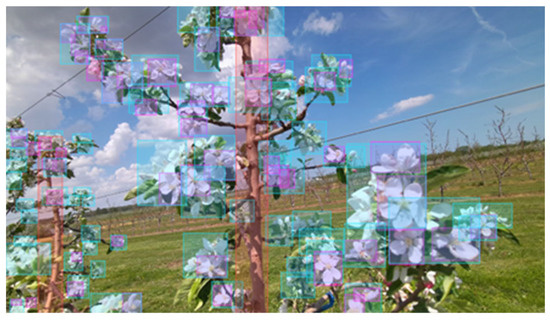
Figure 5.
Training dataset in its first iteration.
Upon further testing, which will be explained within Section 3, the previously annotated dataset was not sufficient for the use case of this project and additional labelling was to be conducted. This resulted in the two separate classes, “Clusters” and “Tree”. The purpose of the two classes was to be able to detect the fruit flower clusters while also being able to determine the number of clusters per tree. The “Tree” class was also changed to show a larger view of the tree, instead of the zoomed-in, partially seen tree. An example of the updated “Tree” bounding boxes can be seen in Figure 6.
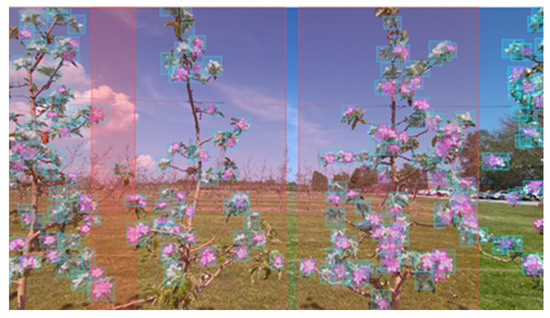
Figure 6.
Training dataset with updated tree bounding box.
The next few iterations of the annotation process consisted of experimenting on the approach that would produce the best possible outcome. It was concluded that the training images should be as similar to the actual use case of the robot which was zoomed-out images. Therefore, only images that encompassed the entire tree was used in the training data. This involved using the mobile vehicle to collect data in the following year. Figure 7 is an example of the finalized dataset. In general, the final dataset consisted of a very large number of bounding boxes, due to the significant amount of fruit flower clusters present in each tree.
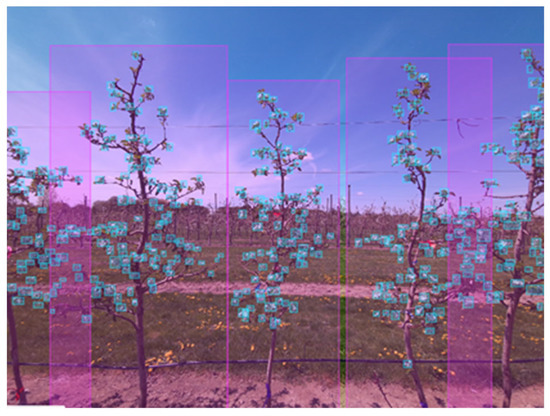
Figure 7.
Final iteration of the training dataset with each flower cluster identified (blue boxes), and each corresponding apple tree identified (pink boxes).
2.2.3. Processing the Dataset
To properly implement the dataset created using Labelbox, another online platform was used initially to process the dataset. This platform was called Roboflow [32]. Roboflow was chosen as it was a compatible platform for Labelbox and was also capable of converting the .JSON file from Labelbox into a darknet compatible dataset. This darknet dataset consisted of a .TXT annotation file as well as the photos that correspond to each annotation. The dataset was split into training, validation and test with 1042 images going to training, 298 into validation and the remaining 149 into testing. Finally, all images were resized for images of different sizes. This dataset would then be used for the YOLOv4 algorithm for training and testing the system to observe the performance. As well as to determine if any adjustments or improvements are needed.
Following the first iteration of the data annotation and processing, as stated previously, a different setup and data was needed to produce a more robust and stronger model. This also resulted in the implementation of a conversion script for the Labelbox .JSON files as Roboflow only allowed limited usage on guest accounts. This script would read the .JSON file and output the compatible .TXT file which had bounding boxes for each image. Additionally, it was later discovered that YOLOv4 did not need to have the input images resized before training as the algorithm would have a default image resolution that would automatically apply zero padding to images to fit the scale of the model, this can be seen in Figure 8.
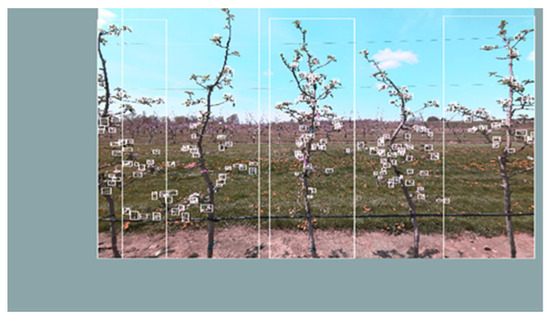
Figure 8.
Example of zero padding on an image.
2.3. Proposed Method for Flower Cluster Detection
Figure 9 shows the process that was taken to create the results shown in Section 3. Before anything can be started, data to train and test the model is needed. As stated before, this was collected at the Simcoe Research Station. Images and videos of the apple tree were collected, and the number of fruit flower clusters per tree were hand-counted to provide a direct comparison for studying the performance of the model. This comparison shows the level of performance of the model in estimating the yield of the apples from the fruit flower clusters.
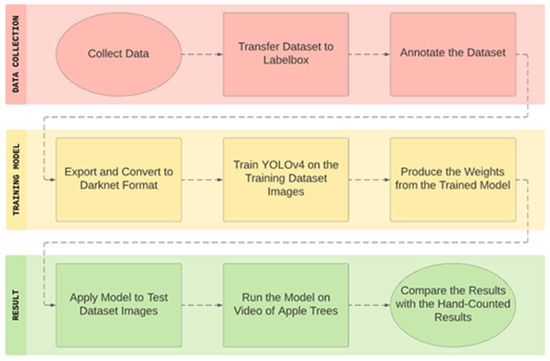
Figure 9.
Flowchart of the data collection and results process.
YOLOv4 will be used for the detector of the fruit flower estimation model. This method has high accuracy and speed produced from the detector (as well, it was the most advanced detector while conducting the trials). YOLOv4 introduced many new features compared to YOLOv3 which was already considered a very good one-stage detector.
This version of YOLO improved YOLOv3′s accuracy and speed by 10% and 12%, respectively [27]. Two new data augmentation training methods were included with YOLOv4. The first being Mosaic Training and the second, Self-Adversarial Training (SAT) [27]. Mosaic Training combines 4 training images into a single input photo to allow for detections outside the normal environment due to YOLO using the entire images features to identify the object [27]. The SAT data augmentation method operates in 2 stages. During the first stage, the neural network changes the inputted images as if there is no desired image present. Therefore, when entering the second stage, the model is trained to detect the desired object based on the altered image [27]. In general, the architecture of YOLOv4 is as follows: CSPDarknet53 backbone, Spatial Pyramid Pooling (SPP) [33] additional module, Path Aggregation Network (PANet) [34] instead of FPN for neck, and YOLOv3 head [27], which can be seen in Figure 10. With these changes, YOLOv4 is expected to produce results that outperform other state-of-the-art object detection algorithms, such as SSD, RetinaNet and Faster R-CNN in both speed and accuracy [27].
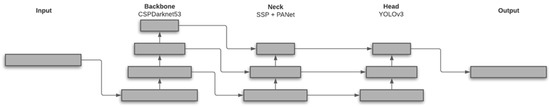
Figure 10.
General structure of YOLOv4.
After the dataset was created, some additional changes were needed in order to obtain the desired result of estimating the yield of the apple trees. Before describing what was added, the method on how to estimate the yield of the apple trees will be explained first. The reason for the need to detect the fruit flower clusters of the apple trees is that each fruit flower tree corresponds to a potential apple growing on the tree. A fruit flower cluster usually consists of 3 flowers, with one being the master and can be identified due to blooming faster than the others. Due to this, a method of counting the total number of fruit flower clusters per tree needs to be collected. The model needed to keep track of each tree and update the count per tree. An Intersection-Over-Union (IOU) tracker was introduced, as well as a maximum fruit flower cluster counter.
The IOU tracker works by checking the bounding boxes in the detection and comparing each bounding box with another bounding box to identify which one has the greatest overlap.
As the tracking is only needed for the tree class, the IOU calculation was only conducted on the bounding boxes with the class “Tree”. This allowed the model to remember the trees which was needed for the next step. The next step was saving the maximum number of fruit flower clusters detected for each specific tree. By keeping track of the trees and its corresponding cluster detections, the number of clusters per tree can be collected.
3. Results
Table 1 shows the total precision of the model, recall, F1-Score and just the cluster precision of the results from the final iteration described in Section 2.2.2. The difference between “Precision” and “Cluster Precision” in the two tables is that “Precision” also includes the “Tree” class, whereas, like the name suggests, “Cluster Precision” is the precision of the model when detecting fruit flower clusters. After 6000 iterations of training, the cluster precision for the training phase was 0.98 or 98% and when testing the trained model with new data, the result was 0.88 or 88%. As expected, all 4 results decrease during the testing phase. Though, lower precision could be considered a bad result, running the model on a brand-new dataset gives a more accurate idea of the actual performance of the model to make sure no severe overfitting/underfitting is occurring. When comparing the results in Table 1 with existing research, the performance of the YOLOv4 is similar to the experience such as in [35], where [35] obtained an F1-Score of 77.3% and 83.3% from two different apple tree datasets. The authors in [36] conducted research on the kiwi tree but also produced a similar F1-Score ranging from 80% to 84.1% depending on datasets. Additional information on how to calculate these parameters may be found in [27].

Table 1.
Training and testing results for YOLOv4.
Figure 11 shows an example of the resulting detections of the right side compared to the hand-counted result side-by-side and Figure 12 shows all detected and counted clusters for the 106 trees. In almost all the cases, the detector predicted less fruit flower clusters than what was there.
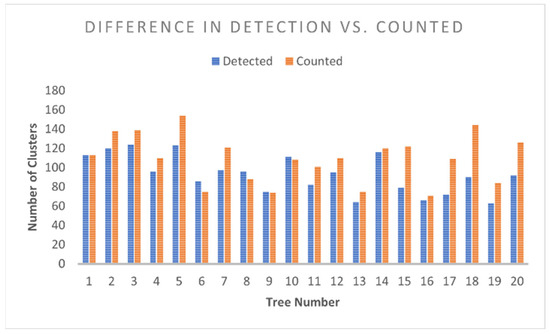
Figure 11.
Comparison of the first 20 trees from the ‘right side’ of the row.
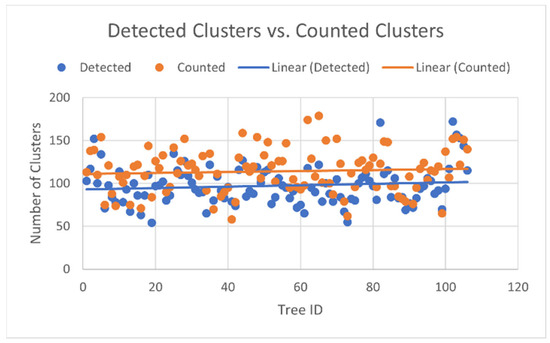
Figure 12.
Comparison of all 106 trees surveyed. Note that the regression lines simply illustrate the average detected vs. counted clusters, and helps show the under-detected number of clusters. In reality, there is no generally increasing trend with increasing tree ID.
The percentage error, maximum difference, minimum difference and average difference were calculated for each side of the trees and shown below in Table 2. For the detection of fruit flower clusters on the right side, the percentage error averaged to −14.52%, which is similar to the result for the left side, which is −13.49%. The minimum difference and the average difference were also similar between the right and left side with 0 to 1 and 21 to 20. The maximum difference between the detection of the fruit flower clusters and the counted clusters for the right and left side had a difference of 15 clusters, though this does not mean that the maximum difference were obtained from the same tree.
Table 2.
Fruit flower cluster count from right side of row.
The average results of both the right and left sides of the tree are shown in Table 3. This table takes the average of the four values in the previous tables as well as the average number of clusters considering all results from both sides of the tree, the most and least number of clusters detected, as well as the counted and the average standard deviation. Similar to the maximum difference values in the previous tables, the most and least clusters detected and counted may not be obtained from the same tree.
Table 3.
Average results obtained for both sides of the orchard row.
Figure 13 present a snapshot from the resulting detection video. This is an example of the final results and how the data such as, number of detected clusters were obtained. Looking at the top left of the figure a number can be seen which is used to keep track of the current number of trees detected in the frame. There are also numbers located in the center of the bounding boxes of the trees which are used to identify the tree position. This was crucial as the objective was to combine the right and left results to find the average as well as the difference between the two sides. Therefore, centroid tracking was implemented to keep track of the bounding boxes for the trees only and update the number of clusters with the respective tree. Once the video or livestream is concluded, the results for the max number of clusters found per tree would be outputted as a list.
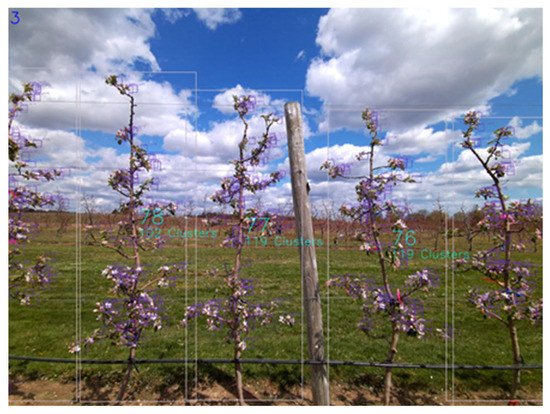
Figure 13.
Snapshot of the detection video generated by the system. Note that each tree was identified (by a bounding box and large number in the center) and assigned the number of estimated clusters (smaller number below the tree ID number).
4. Discussion
Detecting the fruit flower clusters is a very difficult task. This is mainly due to the sheer number of clusters as well as the size of the clusters. Observing the results shown in the previous section in Table 3, the average error calculated was −14%. This means that on average, the fruit flower cluster detection model is predicting 14% less than what is actually there. As previously explained in Section 1.3, there are many challenges to this problem. The biggest challenge is the issue of occlusion due to the fruit flower cluster being in very dense clumps. This makes it extremely difficult for the model to differentiate between separate clusters as well as what fruit flower belongs to which cluster. This issue is not only a problem for the model but while preparing the dataset, it was very quickly realized that manually annotating the bounding boxes around the training set was very confusing and difficult.
Slightly incorrectly annotating the training dataset most likely played a part in the error of the model being −14.00% off from the hand-counted values. Compared to annotating the trees, due to occlusion and many other factors, the process was very time consuming and difficult, whereas with hand-counting the fruit flower clusters was just very time-consuming, since being physically there allowed the ability to move the branches or clusters to see what was behind them.
The maximum difference shown in the same table can be observed as a big problem with the model or it may be an issue with the hand counting for that specific tree. Though on average, the model had a difference in prediction of 21 clusters with the average number of clusters counted per tree being 114. This means if a tree had 114 clusters, the model would only predict that there were 93 clusters present. Accounting for occlusion, annotation error, cluster to apple accuracy, etc., 21 clusters off the actual would still give a researcher or farmer sufficient information to understand the number of expected apples from each apple tree.
The results of the object detection model are very promising as the F1-Score being 80% is similar to that of previously research papers, with an F1-Score of ranging between 77.3% to 84.1%. The only difference is that YOLOv4 is significantly faster in terms of computational speed than the other methods. Additional information on this project may be found in [37].
5. Conclusions
This research paper presents the results of attempting to detect and differentiate fruit flower clusters of apple trees using the novel one-stage detector, YOLOv4. This paper helps support the growth of research in the area of smart agriculture. The performance of the YOLOv4 model performs on a similar level to other methods of fruit flower detection and improvements in the methodology would produce better results. The density of the apple tree can play a significant role in the precision of the fruit flower cluster detection model, not only in the issue of occlusion for the model to detect the clusters but also for the process of annotating the dataset in preparation for training the model. It is expected that in most cases, the proposed model will predict fewer than the actual number of clusters present on the tree by about 14%. The results of this study can be used by orchard mangers or farmers to perform other activities beyond labor-intensive fruit counting, including: studying the behavior of trees in terms of fruit growth; determining whether or not additional hand-trimming or chemical trimming is needed to ensure a desired fruit quality; and, predicting potential fruit yield at time of harvest to support food supply management and security. Future research will look at additional growing conditions and more data to further refine the proposed fruit flower cluster detection strategy.
Author Contributions
Conceptualization, S.A.G. and M.B.; methodology, all authors; software, J.L., S.A.G. and M.B.; validation, all authors; formal analysis, J.L.; investigation, all authors; resources, S.A.G., M.B. and J.A.C.; data curation, J.L.; writing—original draft preparation, J.L.; writing—review and editing, S.A.G., M.B. and J.A.C.; visualization, all authors; supervision, S.A.G., M.B. and J.A.C.; project administration, S.A.G., M.B. and J.A.C.; funding acquisition, S.A.G., M.B. and J.A.C. All authors have read and agreed to the published version of the manuscript.
Funding
This research was partially funded and supported by George Weston Limited (Toronto, Ontario) #SFI19-0349, MITACS (Toronto, Ontario) #IT18697, and the University of Guelph (Guelph, Ontario) #054387.
Institutional Review Board Statement
Not applicable.
Informed Consent Statement
Not applicable.
Data Availability Statement
No data is currently available to the public for this project. However, interested readers are encouraged to contact the authors.
Conflicts of Interest
The authors declare no conflict of interest.
References
- Melton, A. USDA ERS—Chart Detail. United States Department of Agriculture. 2019. Available online: https://www.ers.usda.gov/data-products/chart-gallery/gallery/chart-detail/?chartId=58322 (accessed on 28 December 2020).
- FAOSTAT. Available online: http://www.fao.org/faostat/en/#data/QC (accessed on 28 December 2020).
- Samnegård, U.; Alins, G.; Boreux, V.; Bosch, J.; García, D.; Happe, A.; Klein, A.; Miñarro, M.; Mody, K.; Porcel, M.; et al. Management trade-offs on ecosystem services in apple orchards across Europe: Direct and indirect effects of organic production. J. Appl. Ecol. 2019, 56, 802–811. [Google Scholar] [CrossRef]
- Sun, G.; Wang, X.; Yang, H.; Zhang, X. A canopy information measurement method for modern standardized apple orchards based on UAV multimodal information. Sensors 2020, 20, 2985. [Google Scholar] [CrossRef] [PubMed]
- Häni, N.; Roy, P.; Isler, V. A comparative study of fruit detection and counting methods for yield mapping in apple orchards. J. Field Robot. 2020, 37, 263–282. [Google Scholar] [CrossRef]
- Porcel, M.; Andersson, G.K.S.; Pålsson, J.; Tasin, M. Organic management in apple orchards: Higher impacts on biological control than on pollination. J. Appl. Ecol. 2018, 55, 2779–2789. [Google Scholar] [CrossRef]
- Chouinard, G.; Veilleux, J.; Pelletier, F.; Larose, M.; Philion, V.; Joubert, V.; Cormier, D. Impact of exclusion netting row covers on ‘honeycrisp’ apple trees grown under northeastern north American conditions: Effects on photosynthesis and fruit quality. Insects 2019, 10, 214. [Google Scholar] [CrossRef]
- Christiansen, P.; Nielsen, L.N.; Steen, K.A.; Jørgensen, R.N.; Karstoft, H. DeepAnomaly: Combining background subtraction and deep learning for detecting obstacles and anomalies in an agricultural field. Sensors 2016, 16, 1904. [Google Scholar] [CrossRef]
- Thinning of Tree Fruit. Available online: http://www.omafra.gov.on.ca/english/crops/hort/thinning.htm (accessed on 28 December 2020).
- Sáez, A.; di Virgilio, A.; Tiribelli, F.; Geslin, B. Simulation models to predict pollination success in apple orchards: A useful tool to test management practices. Apidologie 2018, 49, 551–561. [Google Scholar] [CrossRef]
- Stefas, N.; Bayram, H.; Isler, V. Vision-based monitoring of orchards with UAVs. Comput. Electron. Agric. 2019, 163, 104814. [Google Scholar] [CrossRef]
- Wang, D.; Wang, L. Canopy interception of apple orchards should not be ignored when assessing evapotranspiration partitioning on the Loess Plateau in China. Hydrol. Process. 2019, 33, 372–382. [Google Scholar] [CrossRef]
- Blok, P.M.; van Boheemen, K.; van Evert, F.K.; Jsselmuiden, J.I.; Kim, G.H. Robot navigation in orchards with localization based on Particle filter and Kalman filter. Comput. Electron. Agric. 2019, 157, 261–269. [Google Scholar] [CrossRef]
- Kayani, F.A. Effect of climatic factors on sooty blotch, flyspeck intensity andfruit quality of apple (Malus domestica Borkh.). Pure Appl. Biol. 2018, 7, 727–735. [Google Scholar] [CrossRef]
- Horng, G.J.; Liu, M.X.; Chen, C.C. The Smart Image Recognition Mechanism for Crop Harvesting System in Intelligent Agriculture. IEEE Sens. J. 2020, 20, 2766–2781. [Google Scholar] [CrossRef]
- Kragh, M.F.; Christiansen, P.; Laursen, M.; Steen, K.A.; Green, O.; Karstoft, H.; Jørgensen, R.N. FieldSAFE: Dataset for obstacle detection in agriculture. Sensors 2017, 17, 2579. [Google Scholar] [CrossRef]
- Zhang, J.; Karkee, M.; Zhang, Q.; Zhang, X.; Yaqoob, M.; Fu, L.; Wang, S. Multi-class object detection using faster R-CNN and estimation of shaking locations for automated shake-and-catch apple harvesting. Comput. Electron. Agric. 2020, 173, 105384. [Google Scholar] [CrossRef]
- Baek, I.; Cho, B.-K.; Gadsden, S.A.; Eggleton, C.; Oh, M.; Mo, C.; Kim, M.S. A novel hyperspectral line-scan imaging method for whole surfaces of round shaped agricultural products. Biosyst. Eng. 2019, 188, 57–66. [Google Scholar] [CrossRef]
- Bonadies, S.; Smith, N.; Niewoehner, N.; Lee, A.S.; Lefcourt, A.M.; Gadsden, S.A. Development of Proportional-Integral-Derivative and Fuzzy Control Strategies for Navigation in Agricultural Environments. J. Dyn. Syst. Meas. Control. Trans. ASME 2018, 140, 061007. [Google Scholar] [CrossRef]
- Liu, G.; Nouaze, J.C.; Mbouembe, P.L.T.; Kim, J.H. YOLO-tomato: A robust algorithm for tomato detection based on YOLOv3. Sensors 2020, 20, 2145. [Google Scholar] [CrossRef]
- Bonadies, S.; Gadsden, S.A. An overview of autonomous crop row navigation strategies for unmanned ground vehicles. Eng. Agric. Environ. Food 2019, 12, 24–31. [Google Scholar] [CrossRef]
- Rong, D.; Xie, L.; Ying, Y. Computer vision detection of foreign objects in walnuts using deep learning. Comput. Electron. Agric. 2019, 162, 1001–1010. [Google Scholar] [CrossRef]
- Bargoti, S.; Underwood, J. Deep fruit detection in orchards. In Proceedings of the 2017 IEEE International Conference on Robotics and Automation (ICRA), Singapore, 29 May–3 June 2017; pp. 3626–3633. [Google Scholar] [CrossRef]
- Sa, I.; Ge, Z.; Dayoub, F.; Upcroft, B.; Perez, T.; McCool, C. Deepfruits: A fruit detection system using deep neural networks. Sensors 2016, 16, 1222. [Google Scholar] [CrossRef]
- Yang, Q.; Xiao, D.; Lin, S. Feeding behavior recognition for group-housed pigs with the Faster R-CNN. Comput. Electron. Agric. 2018, 155, 453–460. [Google Scholar] [CrossRef]
- Tian, Y.; Yang, G.; Wang, Z.; Li, E.; Liang, Z. Detection of apple lesions in orchards based on deep learning methods of cyclegan and YoloV3-dense. J. Sens. 2019, 2019, 1–13. [Google Scholar] [CrossRef]
- Bochkovskiy, A.; Wang, C.-Y.; Liao, H.-Y.M. YOLOv4: Optimal Speed and Accuracy of Object Detection. 2020. Available online: https://github.com/AlexeyAB/darknet (accessed on 11 June 2020).
- Aggelopoulou, A.D.; Bochtis, D.; Fountas, S.; Swain, K.C.; Gemtos, T.A.; Nanos, G.D. Yield prediction in apple orchards based on image processing. Precis. Agric. 2011, 12, 448–456. [Google Scholar] [CrossRef]
- Wang, Q.; Nuske, S.; Bergerman, M.; Singh, S. Automated Crop Yield Estimation for Apple Orchards. In Experimental Robotics; Springer: Berlin/Heidelberg, Germany, 2013; pp. 745–758. [Google Scholar] [CrossRef]
- Azure Kinect DK Documentation | Microsoft Docs. Available online: https://docs.microsoft.com/en-us/azure/kinect-dk/ (accessed on 3 January 2021).
- Labelbox: The Leading Training Data Platform. Available online: https://labelbox.com/ (accessed on 3 January 2021).
- Roboflow: Raw Images to Trained Computer Vision Model. Available online: https://roboflow.com/ (accessed on 3 January 2021).
- He, K.; Zhang, X.; Ren, S.; Sun, J. Spatial pyramid pooling in deep convolutional networks for visual recognition. In Lecture Notes in Computer Science (Including Subseries Lecture Notes in Artificial Intelligence and Lecture Notes in Bioinformatics); Springer: Cham, Switzerland, 2014; Volume 8691, pp. 346–361. [Google Scholar] [CrossRef]
- Liu, S.; Qi, L.; Qin, H.; Shi, J.; Jia, J. Path Aggregation Network for Instance Segmentation. In Proceedings of the IEEE Computer Society Conference on Computer Vision and Pattern Recognition, Salt Lake City, UT, USA, 18–23 June 2018; pp. 8759–8768. [Google Scholar] [CrossRef]
- Dias, P.A.; Tabb, A.; Medeiros, H. Multi-species fruit flower detection using a refined semantic segmentation network. IEEE Robot. Autom. Lett. 2018, 3, 3003. [Google Scholar] [CrossRef]
- Lim, J.Y.; Ahn, H.S.; Nejati, M.; Bell, J.; Williams, H.; MacDonald, B.A. Deep neural network based real-time kiwi fruit flower detection in an orchard environment. In Proceedings of the Australasian Conference on Robotics and Automation, ACRA, Adelaide, Australia, 9–11 December 2019. [Google Scholar]
- Lee, J. The Detection of Fruit Flower Clusters in Apple Orchards Using Machine Learning. Master’s Thesis, University of Guelph, Guelph, ON, Canada, December 2021. [Google Scholar]


Publisher’s Note: MDPI stays neutral with regard to jurisdictional claims in published maps and institutional affiliations. |
© 2022 by the authors. Licensee MDPI, Basel, Switzerland. This article is an open access article distributed under the terms and conditions of the Creative Commons Attribution (CC BY) license (https://creativecommons.org/licenses/by/4.0/).