Article

Experimental Investigation of Task Performance and Human Vigilance in Different Noise Environments

1
School of Aeronautic Science and Engineering, Beihang University, Beijing 100191, China
2
Marine Human Factors Engineering Laboratory, China Institute of Marine Technology & Economy, Beijing 100081, China
3
College of Aeronautics and Astronautics, Taiyuan University of Technology, Taiyuan 030024, China
*
Author to whom correspondence should be addressed.
These authors contributed equally to this work.
Appl. Sci. 2022, 12(22), 11376; https://doi.org/10.3390/app122211376
Submission received: 20 October 2022 / Revised: 7 November 2022 / Accepted: 8 November 2022 / Published: 9 November 2022

Abstract

:
Twelve healthy male college-age students were recruited to investigate the effects of different noise exposure conditions on complex task performance and vigilance. During each noise exposure, the Multi-Attribute Task Battery (MATB) with low, medium, and high mental workloads were conducted in the order designated by the Latin square method. Meanwhile, a psychomotor vigilance test (PVT) was used to evaluate human vigilance. Heart rate variability (HRV) signals were also collected while participants performed the tasks. The generalized additive mixed-effect model (GAMM) results showed that the increased mental workload had an inverted U-shaped effect on MATB task performance. Noise exposure had no significant impact on the overall performance of MATB tasks. However, when exposed to increased noise sharpness at low mental workloads, Tracking Task (TRA) performance significantly decreased, whereas the System Monitoring Task (SYS) performance was significantly improved. In addition, higher noise sound pressure level and sharpness would impair human vigilance, which was reflected in a lower mean sample entropy of HRV and worse performance on the PVT. The results indicated that noise control in the workplace should consider both sound pressure level and sharpness.

1. Introduction

Noise that is irrelevant to a task poses a risk to the working efficiency, safety, and personal health of operators [1]. Especially in a closed cabin environment, when operators are exposed to noisy environments for a long time, adverse reactions may occur to the cardiovascular system, nervous system, etc., and even increase the probability of operators suffering from diabetes and hypertension [2,3,4]. Most research has indicated that exposure to a harsh noise environment will interfere with an operator’s task performance. For example, Ke et al. [5] recruited 27 subjects to compare the impact of six noise exposure conditions on the task performance of operators. The results showed that there was a negative correlation between the task performance (accuracy and response time) of participants and noise exposure. Monteiro et al. [6] investigated the effects of three kinds of noise conditions on attention and short-term memory. The results showed that performance in an environment with alarm sounds was low; that is, there was a high number of errors high and long response times. In addition, Monteiro et al. [7] also evaluated the cognitive ability of 84 naval personnel exposed to noise. The test results showed that compared with personnel exposed to <72.6 dB(A), when the noise sound pressure level was >85.2 dB(A), the task performance of operators was significantly reduced. However, in other research reports, noise was shown to stimulate participant attention, improve vigilance and task participation, and improve task performance [8]. Moreover, relevant studies have found that the impact of noise on task performance could be related to task difficulty [9,10,11].
Noise exposure may also affect human vigilance. Some scholars believed that when operators worked for a long time, they would become sleepy and inefficient, and that the addition of noise could improve the vigilance of operators [12]. However, Button et al. [13] indicated that response times to alertness tasks exposed to 95 dB(A) of noise was significantly longer than those exposed to 53 dB(A) of noise. The test results of Smith [14] also showed that noise reduced the cognitive vigilance of operators. The psychomotor vigilance task (PVT) and Karolinska sleepiness scale (KSS) have been widely used to measure human vigilance performance. In addition, relevant literature has confirmed the consistency between the sample entropy (SampEn) of heart rate variability (HRV) and participant vigilance [15,16]. SampEn was proposed by Richman and Moorman [17], which has been shown to be an improved method for measuring the complexity of physiological time-series signals based on approximate entropy [18].
Although there have been many studies on the effects of sound pressure level on task performance and vigilance, few studies have been conducted on the effects of other noise parameters, such as sharpness. The SampEn of HRV signals has also been less commonly used to assess noise effects on human vigilance from a physiological perspective. To address these issues, we used the Multi-Attribute Task Battery (MATB) with multiple workload levels and PVT to investigate the effects of sound pressure level and noise sharpness on task performance and human vigilance. The sample entropy of recorded HRV signals was further calculated to physiologically assess vigilance.

2. Materials and Methods

2.1. Study Design

Twelve male students with science and engineering backgrounds were recruited for this experiment. All of them passed the personality psychological test and signed the informed consent forms. The mean age of the participants was 23.250 ± 2.314 years, and their mean body mass index (BMI) was 22.57 ± 1.95 Kg/m2. The subjects were healthy, right-handed, with normal or corrected vision, normal hearing, and normal electrocardiograph results (ECG). Before the experiments, participants received sufficient training on the tasks. The subjects had adequate sleep and a good mental state, abstaining from drinking any stimulant substances such as caffeine and alcohol and did not take any drugs before and during the experiments. All participants completed the tests without dropping out, and accepted financial compensation after the experiments.
The twelve subjects were divided into three groups: there were four subjects in each group. Each subject was exposed to one noise condition every day and completed all test assignments at the same time for three consecutive days. The three noise exposure sequences were counterbalanced. In addition, the MATB task with three different mental workload levels was also counterbalanced by traversing all possible sequences at three noise conditions. The research protocol has been approved by the Institute Review Board (IRB) of Beihang University.

2.2. Experimentation

2.2.1. MATB Task

The Multi-Attribute Task Battery (MATB) was adopted as the experimental task for this research [19]. Three components of the MATB were utilized: the Tracking Task (TRA), System Monitoring Task (SYS), and Resource Management Task (RES) [20], as shown in Figure 1. Table 1 describes the operation steps of each subtask [21].
In this research, each subtask set the trigger number to 2, 12, and 36 at low mental workload (LMW), medium mental workload (MMW), and high mental workload (HMW), respectively, every 12 min. The MATB tasks with LMW, MMW, and HMW were separately carried out in the order designed by the Latin square method at each noise exposure. The subtask performance of accuracy and response time were automatically recorded by the computer. The ratio of accuracy to average response time (Equation (1)) was used to evaluate the weighted MATB task performance for each subject.
W e i g h t e d   t a s k   p e r f o r m a n c e = A v e r a g e ( A C C i R T i ) ,   i = 1 , 2 , 3
where W e i g h t e d   t a s k   p e r f o r m a n c e is the ratio of accuracy to the average response time of the MATB task; ACCi and RTi are the accuracy and response times of subtask i for each subject, respectively; and the corresponding subtasks are SYS, TRA, and RES with subscript i as 1, 2, and 3, respectively.

2.2.2. NASA-TLX Scale

NASA-Task Load Index (TLX) was developed by Hart and Staveland [22], which includes six dimensions: mental demand, physical demand, temporal demand, performance, effort, and frustration [23]. NASA-TLX consists of two stages: one is the scoring stage, which aims to separately evaluate the six subscales, and the other is the weighting stage, where the weight of each factor is determined by comparing the importance of six factors in pairs. The weight of each factor is multiplied by the scale score of each factor, and finally added up to calculate the overall index of overall mental workload (see Equation (2)).
O v e r a l l   M e n t a l   W o r k l o a d   S c o r e = i = 1 6 S c a l e i × W e i g h t i
where Overall Mental Workload Score is the index of NASA-TLX; Scalei represents the scale scores of factor i; Weighti are the weight scores of factor i; and the corresponding factors include mental demand, physical demand, temporal demand, performance, effort, and frustration level with subscript i as 1–6, respectively. Higher scores mean a higher mental workload.

2.2.3. SampEn of HRV

A Bio-Radio wireless physiological monitor was used to collect ECG data of each participant at a sampling rate of 250 Hz. The HRV signals were obtained based on the QRS waves of the ECG signal extracted by the BioCapture physiological monitoring system. In this study, SampEn was used to assess the complexity of HRV (cardiovascular dynamics), which was calculated as follows [24]:
Given N data points from a time series { x ( n ) } = x ( 1 ) , x ( 2 ) , , x ( N ) , the m vectors X m ( 1 ) , X m ( 2 ) , , X m ( N m + 1 ) were reconstructed to be X m ( i ) = [ x ( i ) , x ( i + 1 ) , , x ( i + m 1 ) ] , for ( 1 i N m + 1 ) .
(1)
The vector distance d [ X m ( i ) , X m ( j ) ] between vector X m ( i ) and vector X m ( j ) was defined as the maximum absolute difference between their corresponding elements (Equation (3))
d [ X m ( i ) , X m ( j ) ] = m a x k = 0 , 1 , , m 1 ( | x ( i + k ) x ( j + k ) | )
(2)
Given a similar capacity r (r > 0), the number of j satisfying the formula (Equations (4) and (5)) was counted and denoted as Bi.
d [ X m ( i ) , X m ( j ) ] r   ( 1 j N m , j i )
Then, for 1 i N m ,
B i m ( r ) = B i N m 1
(3)
B i m ( r ) of the average value of i, was represented as B m ( r ) (see Equation (6)).
B m ( r ) = i = 1 N m B i m ( r ) N m
(4)
Another m + 1 vectors were constructed with above steps to obtain B m + 1 ( r ) . Then, the SampEn could be estimated as:
S a m p E n ( m , r , N ) = l n B m ( r ) B m + 1 ( r )

2.2.4. PVT

PVT metrics have been shown to be significantly correlated with vigilance [15,25]. To investigate whether noise quality affects the vigilance of participants, PVT was performed on the participants under three noise conditions. The stimulus was presented on the center screen. Participants immediately pressed the “J” button in response when the center screen changed from “+” to an increased figure. If the subject responded correctly, the number would stop increasing and change to a “+” to proceed to the next trial. In this study, four PVT performance metrics were calculated to explore the impact of different noise exposure conditions on objectively measured human alertness, as shown in Table 2.

2.3. Experimental Set-Up

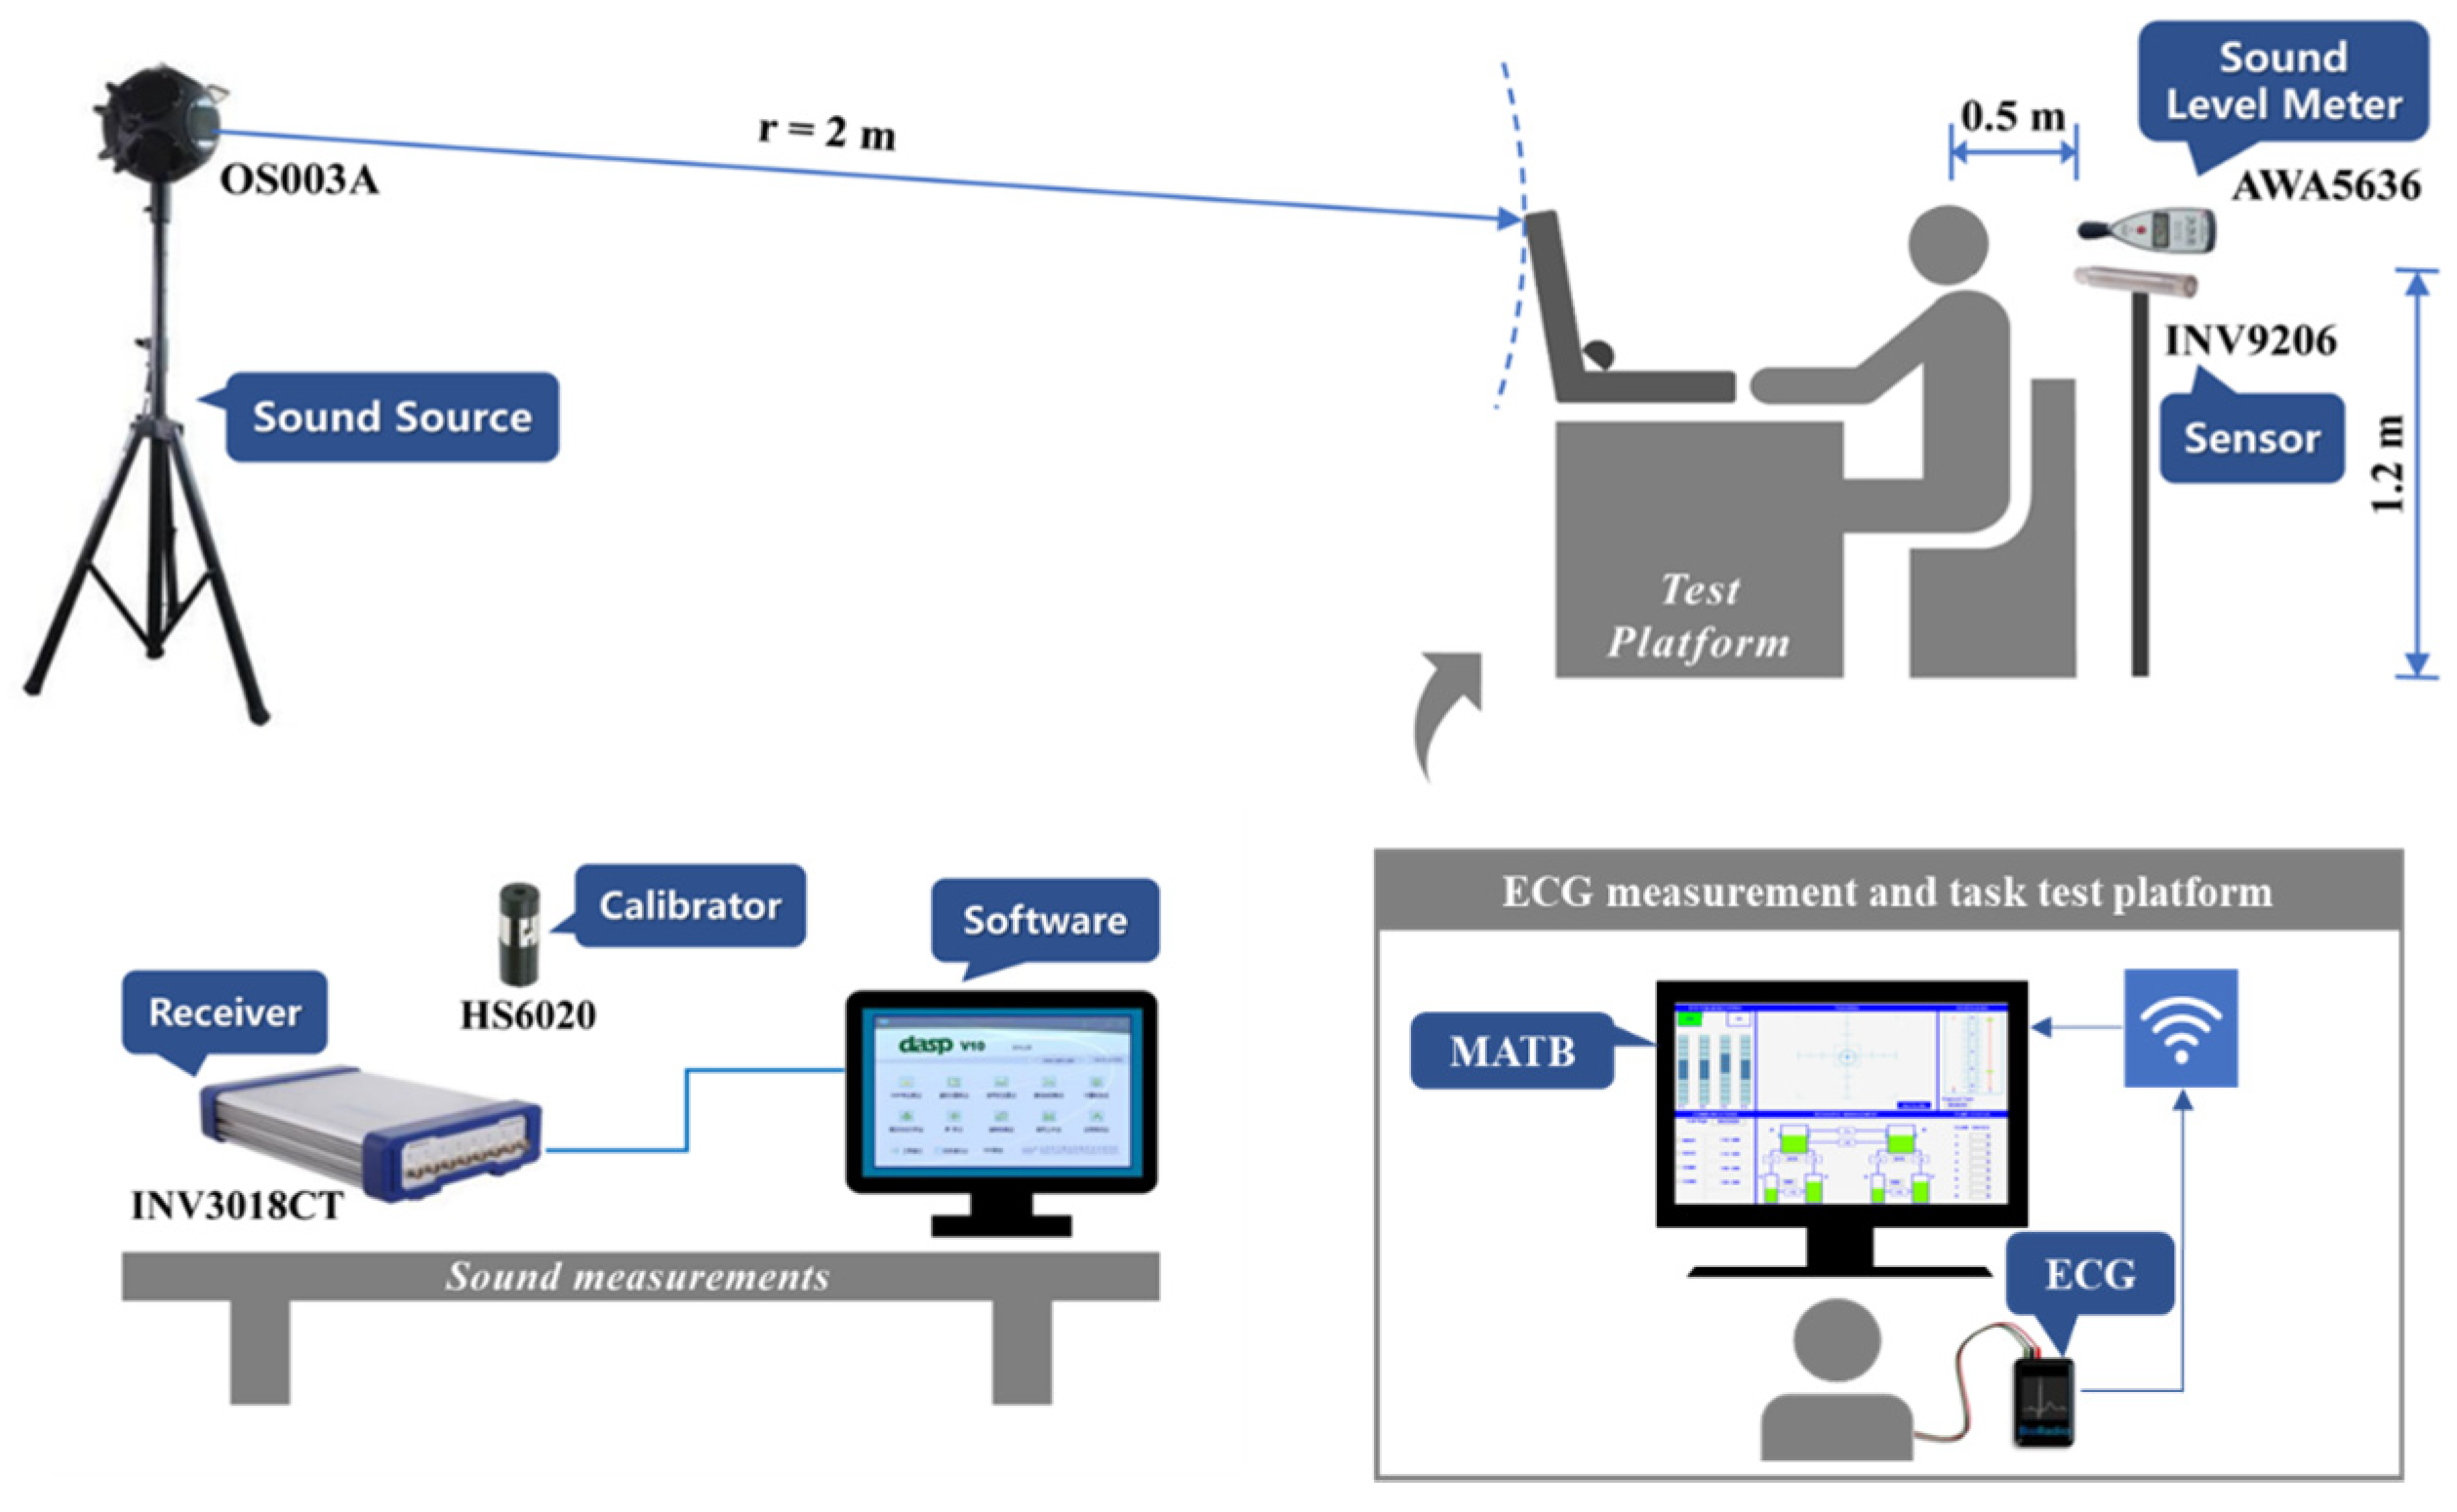
Figure 2 shows the experimental set-up of noise play and measurement. A sound level meter (AWA5636, Aihua Instruments Co., Hangzhou, China) was placed near the left ear of the subject to perform real-time measurement of the sound pressure level. The sound level meter was calibrated once a day by the sound calibrator (HS6020), with a measurement range of 40–130 dB(A) and a measurement accuracy of ±1.0 dB(A). The system consisted of a sound pressure sensor (INV9206, COINV, Beijing, China), USB collection instrument (INV3018CT, COINV, Beijing, China), and sound measurement software (DASP-V10, COINV, COINV, Beijing, China).
This study focused on both sound pressure level and noise sharpness. An equivalent A-weighted sound pressure level (LAeq) in dB(A) is typically used to represent the energy-averaged sound level over some time as measured by a sound pressure level meter. Noise sharpness (acum) is used to measure the high-frequency content of sound, which can reflect the subjective feeling of individuals on the roughness of sound [26]. The sharpness of the sound signal is closely related to the proportion of high-frequency components. The higher the proportion of high-frequency components, the higher the sharpness, and the stronger the subjective feeling of roughness. During the experiment, the outliers of all segments were eliminated with three times the standard deviation, and the mean value and standard deviation were further calculated to obtain the original sound quality parameter (N85-S1). Hu et al. [27] set the allowable safe noise level in the submarine cabin to be less than 80 dB(A) during navigation. Therefore, the second noise exposure condition was N80-S1. Next, the noise sound pressure level was further reduced to 75 dB(A) and the noise sharpness was increased to obtain the third noise exposure condition of N75-S2. The objective noise parameters of the three exposure conditions are shown in Table 3.
A comprehensive indoor environment quality tester (MI6401, METREL, Eckental, Germany) was used to measure indoor thermal environment parameters (Table 3). It was assumed that the metabolic rate of the human body was 90 W/m2 [28] and the thermal resistance of clothing was 0.9 [29]. The predicted mean vote (PMV) during the experiment was estimated to be between −0.117 and 0.375, which indicated that the subjects performed tasks in a thermally neutral state.

2.4. Experimental Procedure

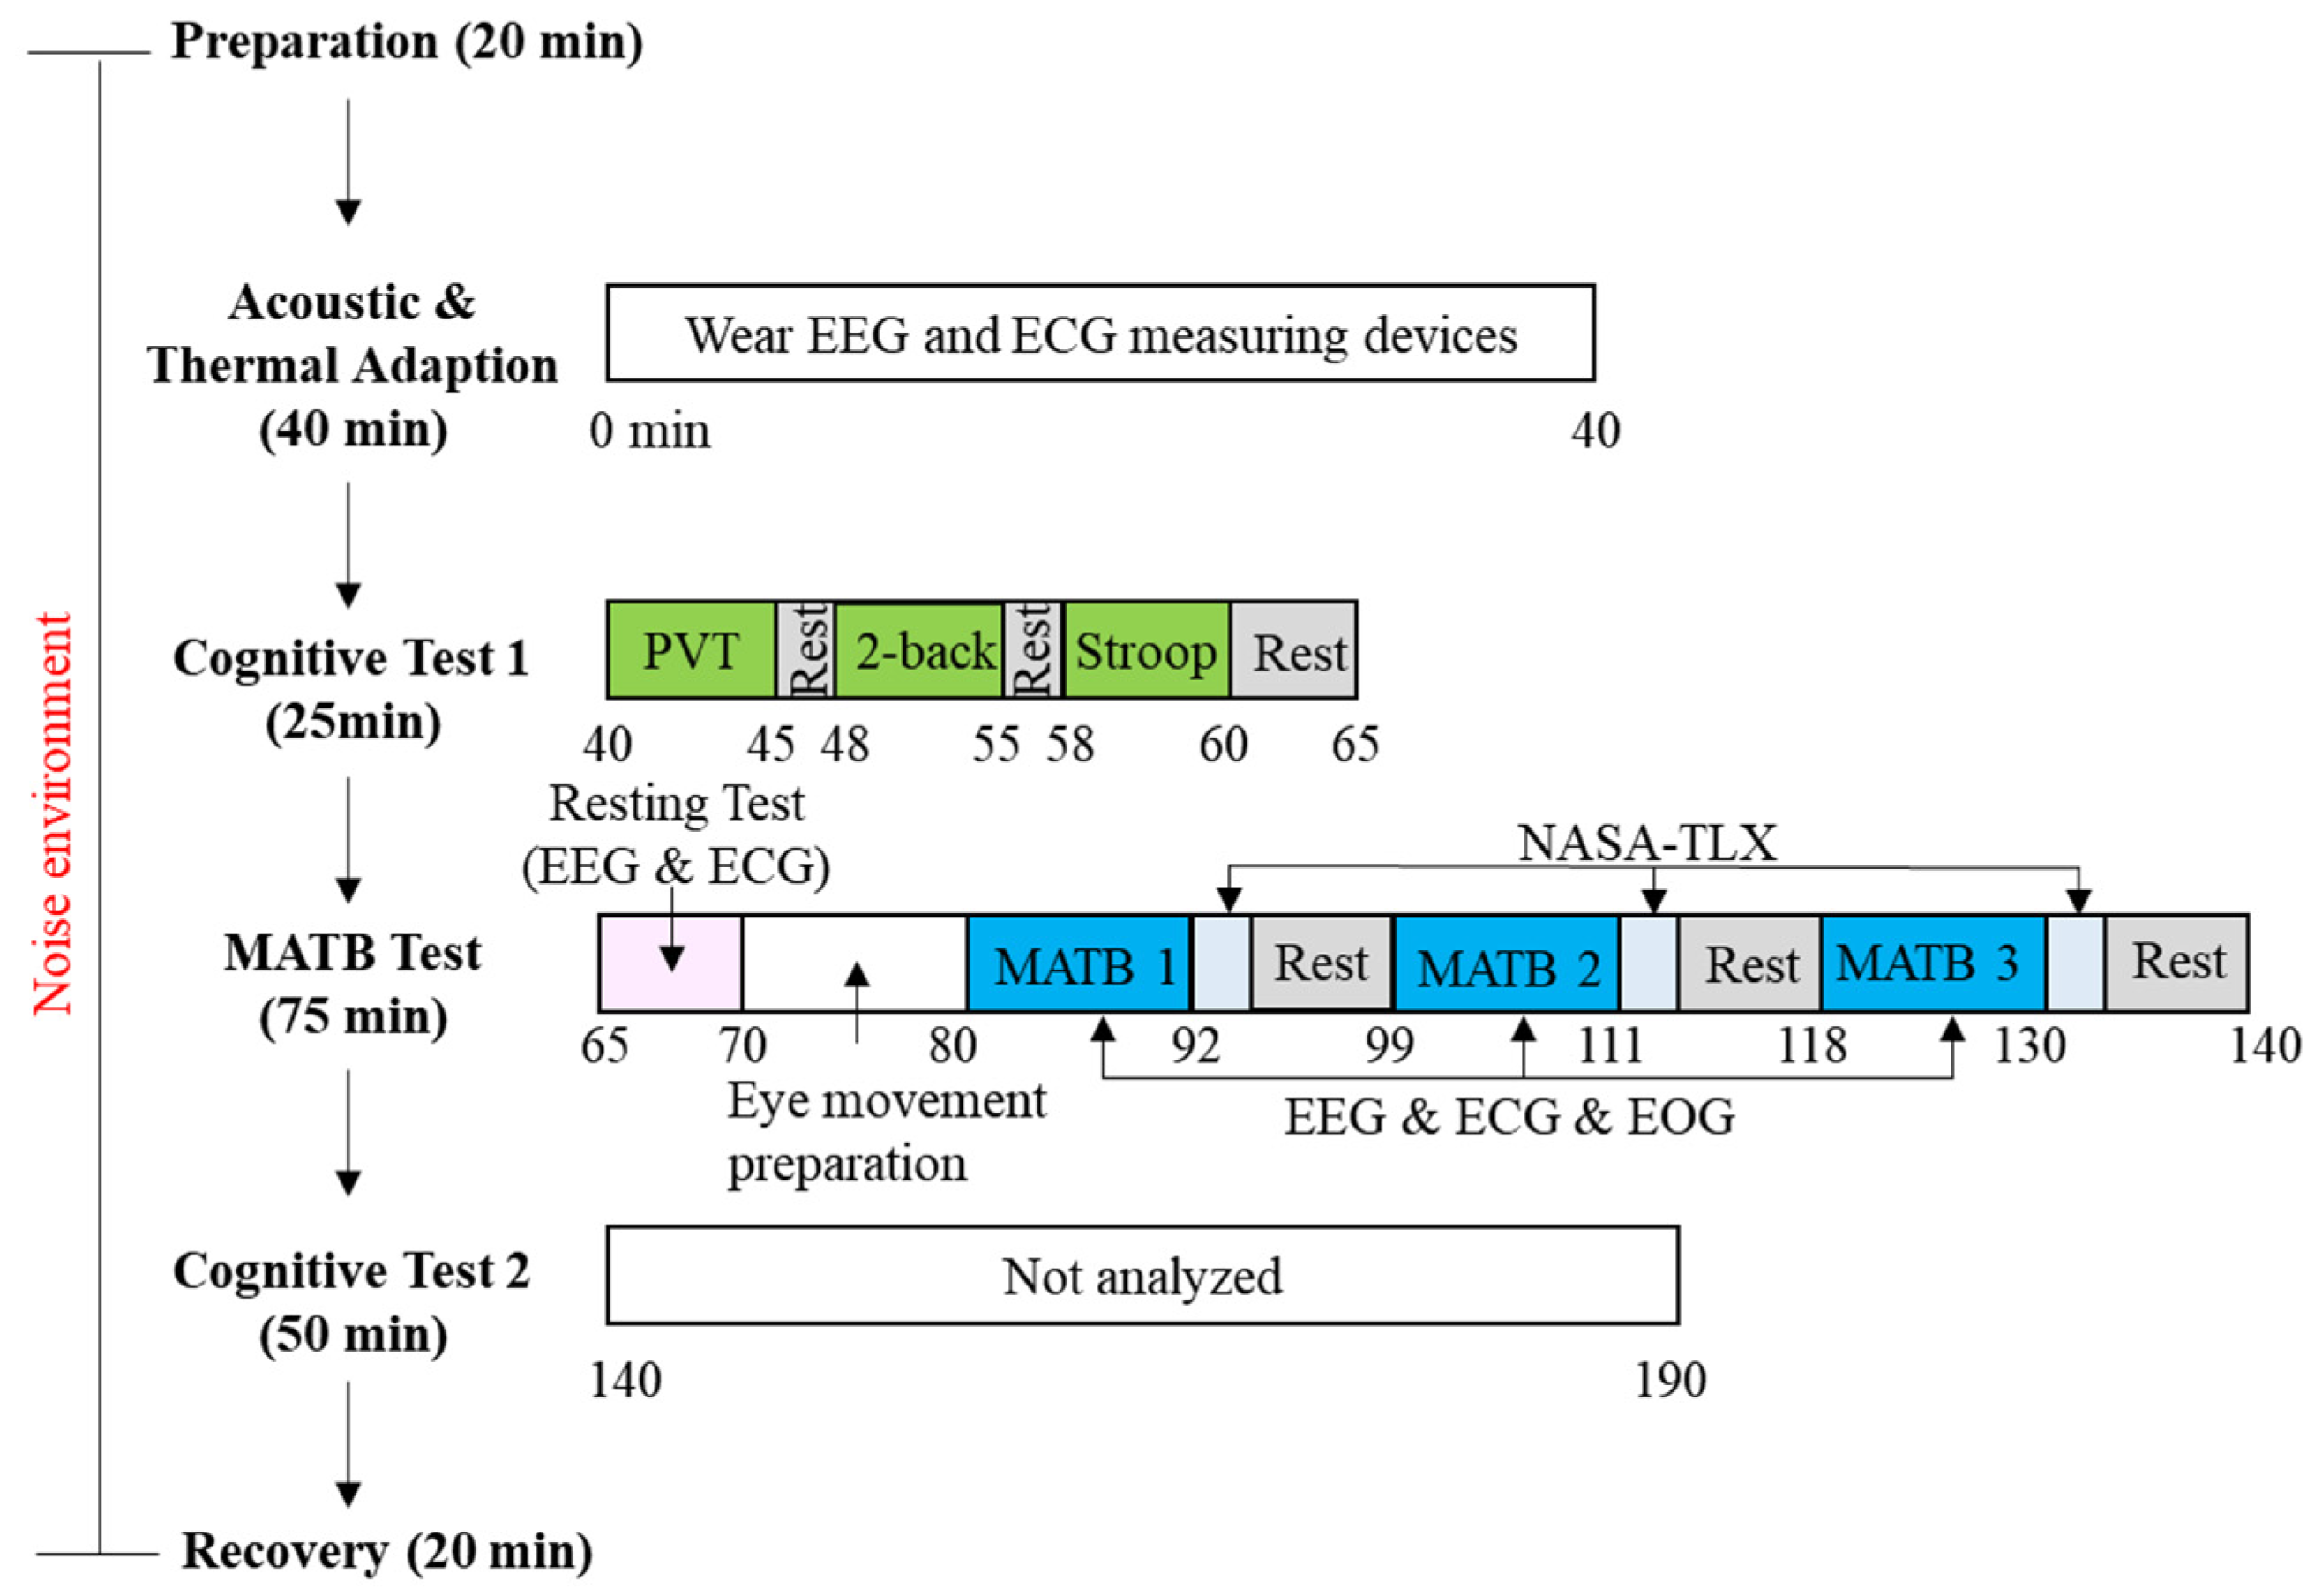
The experiment was conducted in November 2020. Before the formal test, subjects were provided with experimental training on the experimental process, with guidance on filling out the subjective questionnaire, test exercises, and explanation of the consent form. During the formal experiment, the subjects completed four experimental tests under each noise exposure condition (Figure 3). (1) Acoustic and Thermal Adaption (40 min): The experimenter played the specified sound file and began to record the sound signal in the left ear of the subject until the end of the experiment. At the same time, the experimenter measured the environmental parameters in the working area of the subjects. For the rest of the experiment, the participants wore EEG and ECG measuring equipment. (2) Cognitive Test 1 (25 min): Under the guidance of the experimenter, the subjects completed the PVT test, 2-BACK test, and Stroop test, in turn, with a 5 min rest after each test. (3) MATB Test (75 min): Before carrying out the MATB test, the subjects first carried out a resting test for about 5 min. After that, the subjects completed calibration of the eye movement equipment under the guidance of the principal investigator. Finally, the subjects completed the MATB tasks under three mental workload levels according to the preset task load order. At the end of each MATB test, the subjects completed the NASA-TLX scale, and then took a 5 min rest. (4) The focus of this study was MATB task and vigilance performance. Therefore, the data from Cognitive Test 2 (50 min) is not analyzed in this manuscript.

2.5. Statistical Analysis

Generalized additive mixed effect model (GAMM) analyses were performed using the open-source statistical package R, version 3.6.1 (R Project for Statistical Computing, Vienna, Austria), to test the fixed effects estimates of potential influencing factors on human task performance and vigilance, treating the subject as a random effect. The parameters analyzed in this study included the overall mental workload score of NASA-TLX, weighted task performance (overall performance, SYS performance, TRA performance, and RES performance), mean SampEn of HRV, and PVT metrics (performance, response time, fastest 10% response time, and slowest 10% response time). Among them, the GAMMs of the parameters such as subjective mental workload, task performance, and mean SampEn of HRV are shown in Equations (8) and (9), whereas the GAMMs of task performance under different mental workload and PVT performance are shown in Equations (10) and (11). Differences were considered statistically significant when p < 0.05.
y = β 1 + β 2 ( N 85 - S 1 ) + β 3 ( N 80 - S 1 ) + β 4 ( L M W ) + β 5 ( M M W ) + b + e
y = β 1 + β 2 ( N 85 - S 1 ) + ( β 3 ( N 75 - S 2 ) ) + β 4 ( L M W ) + ( β 5 ( H M W ) ) + b + e
y 1 = β 1 + β 2 ( N 85 - S 1 ) + β 3 ( N 80 - S 1 ) + b + e
y 1 = β 1 + β 2 ( N 85 - S 1 ) + ( β 3 ( N 75 - S 2 ) ) + b + e
where y is the index of subjective mental workload, task performance, and mean SampEn of HRV, including overall mental workload score of NASA-TLX, overall performance, SYS performance, TRA performance, RES performance, and mean SampEn of HRV; y1 is the index of task performance and PVT performance, including overall performance, SYS performance, TRA performance, RES performance, PVT performance, PVT response time, PVT fastest 10% response time, and PVT slowest 10% response time; β1 and β 1 are the fixed intercepts; β2 and β3 are the fixed effects of N85-S1 and N80-S1 compared with N75-S2, respectively; β 2 is the fixed effects of comparison between N85-S1 and N80-S1; β4 and β5 are the fixed effects of LMW and MMW compared with HMW, respectively; β 4 is the fixed effects of comparison between LMW and MMW; b and b* are the random effects of the intercept for subjects; and e and e* are the residuals.

3. Results

3.1. Effects of Noise Parameters

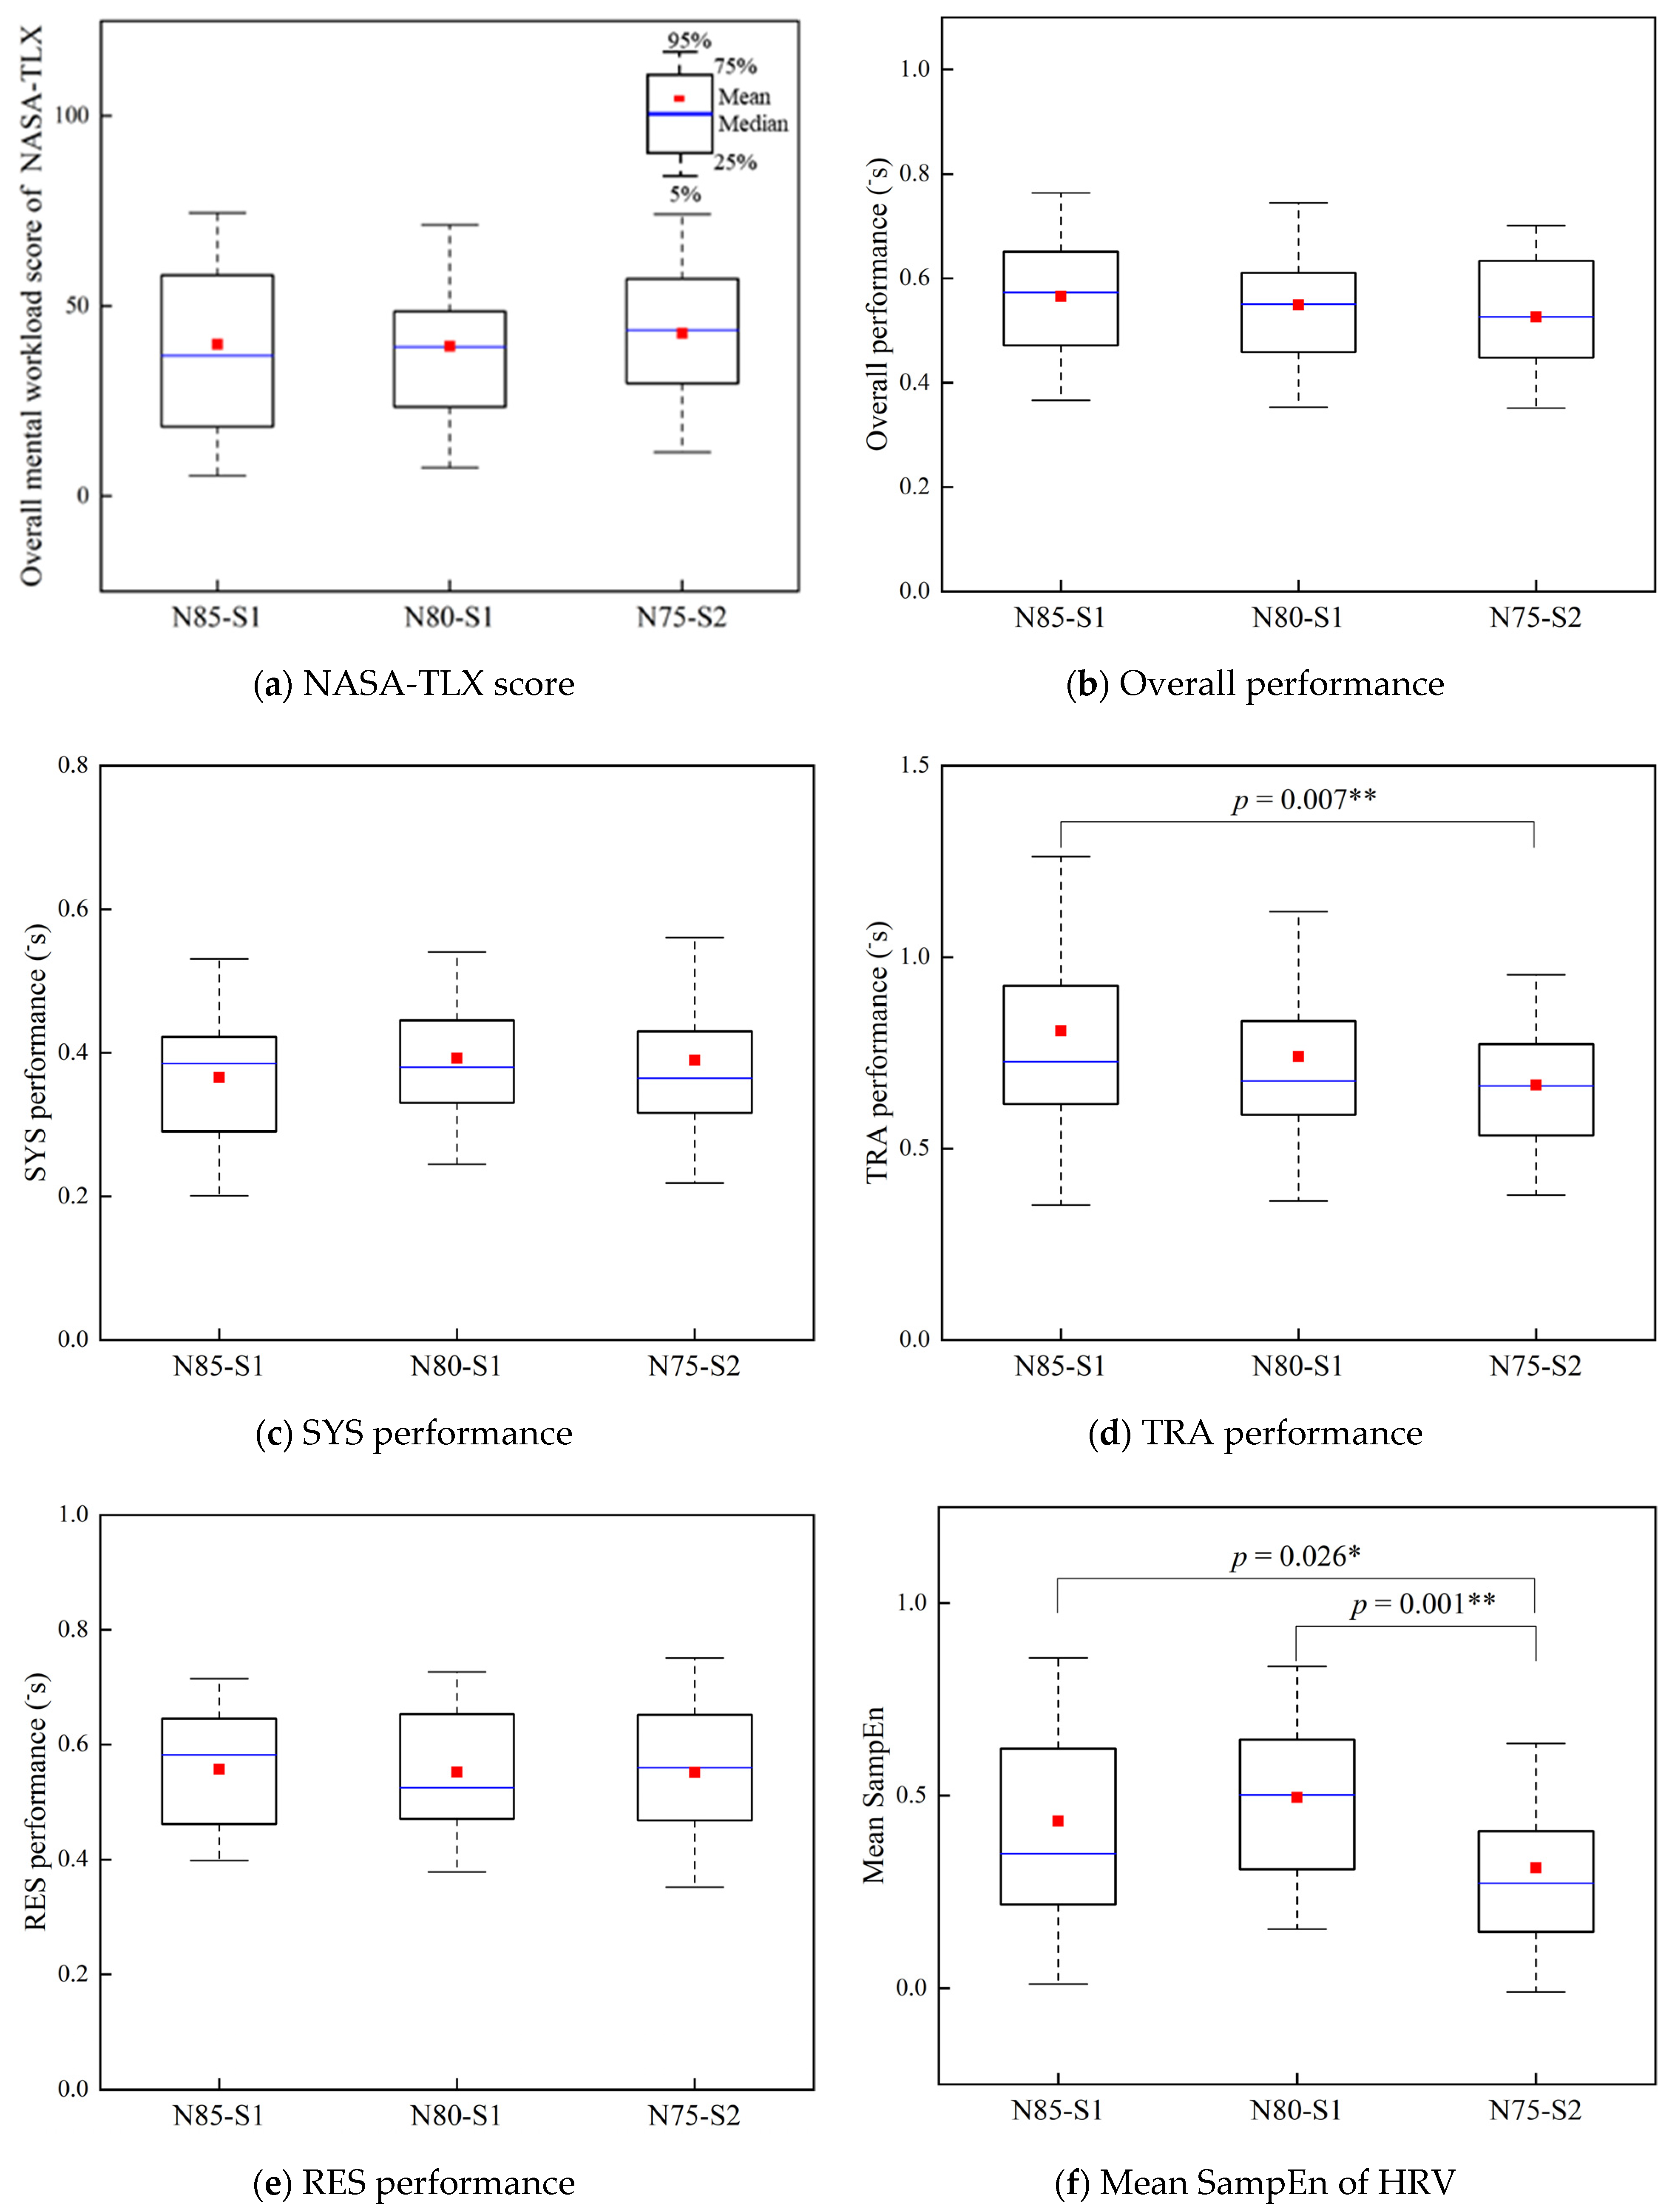
Figure 4 shows the NASA-TLX scale scores, MATB task performance, and mean SampEn of HRV under different noise conditions. As shown in Figure 4a, the results of the NASA-TLX subjective scale showed that different sound pressure levels and sharpness had no significant effect on the subjective mental workload of participants. However, the overall mental workload score of NASA-TLX was relatively high under N75-S2 and relatively low under N80-S1.
Although there was no significant difference in the overall performance of MATB under different noise conditions, the overall performance of MATB under N75-S2 was relatively lower (Figure 4b). Figure 4c–e shows the performance of the three subtasks, SYS, TRA, and RES of MATB, respectively. Among them, only TRA performance significantly changed with different noise conditions. TRA performance under N75-S2 was significantly lower than that under N85-S1 (p = 0.007). When the noise sound pressure and sharpness changed, SYS and RES performance of the participants did not significantly change. As shown in Figure 4f, the mean SampEn of HRV under N7S-S2 was significantly lower than that under N85-S1 (p = 0.026) and N80-S1 (p = 0.001). The mean SampEn of HRV was overall high under N80-S1.
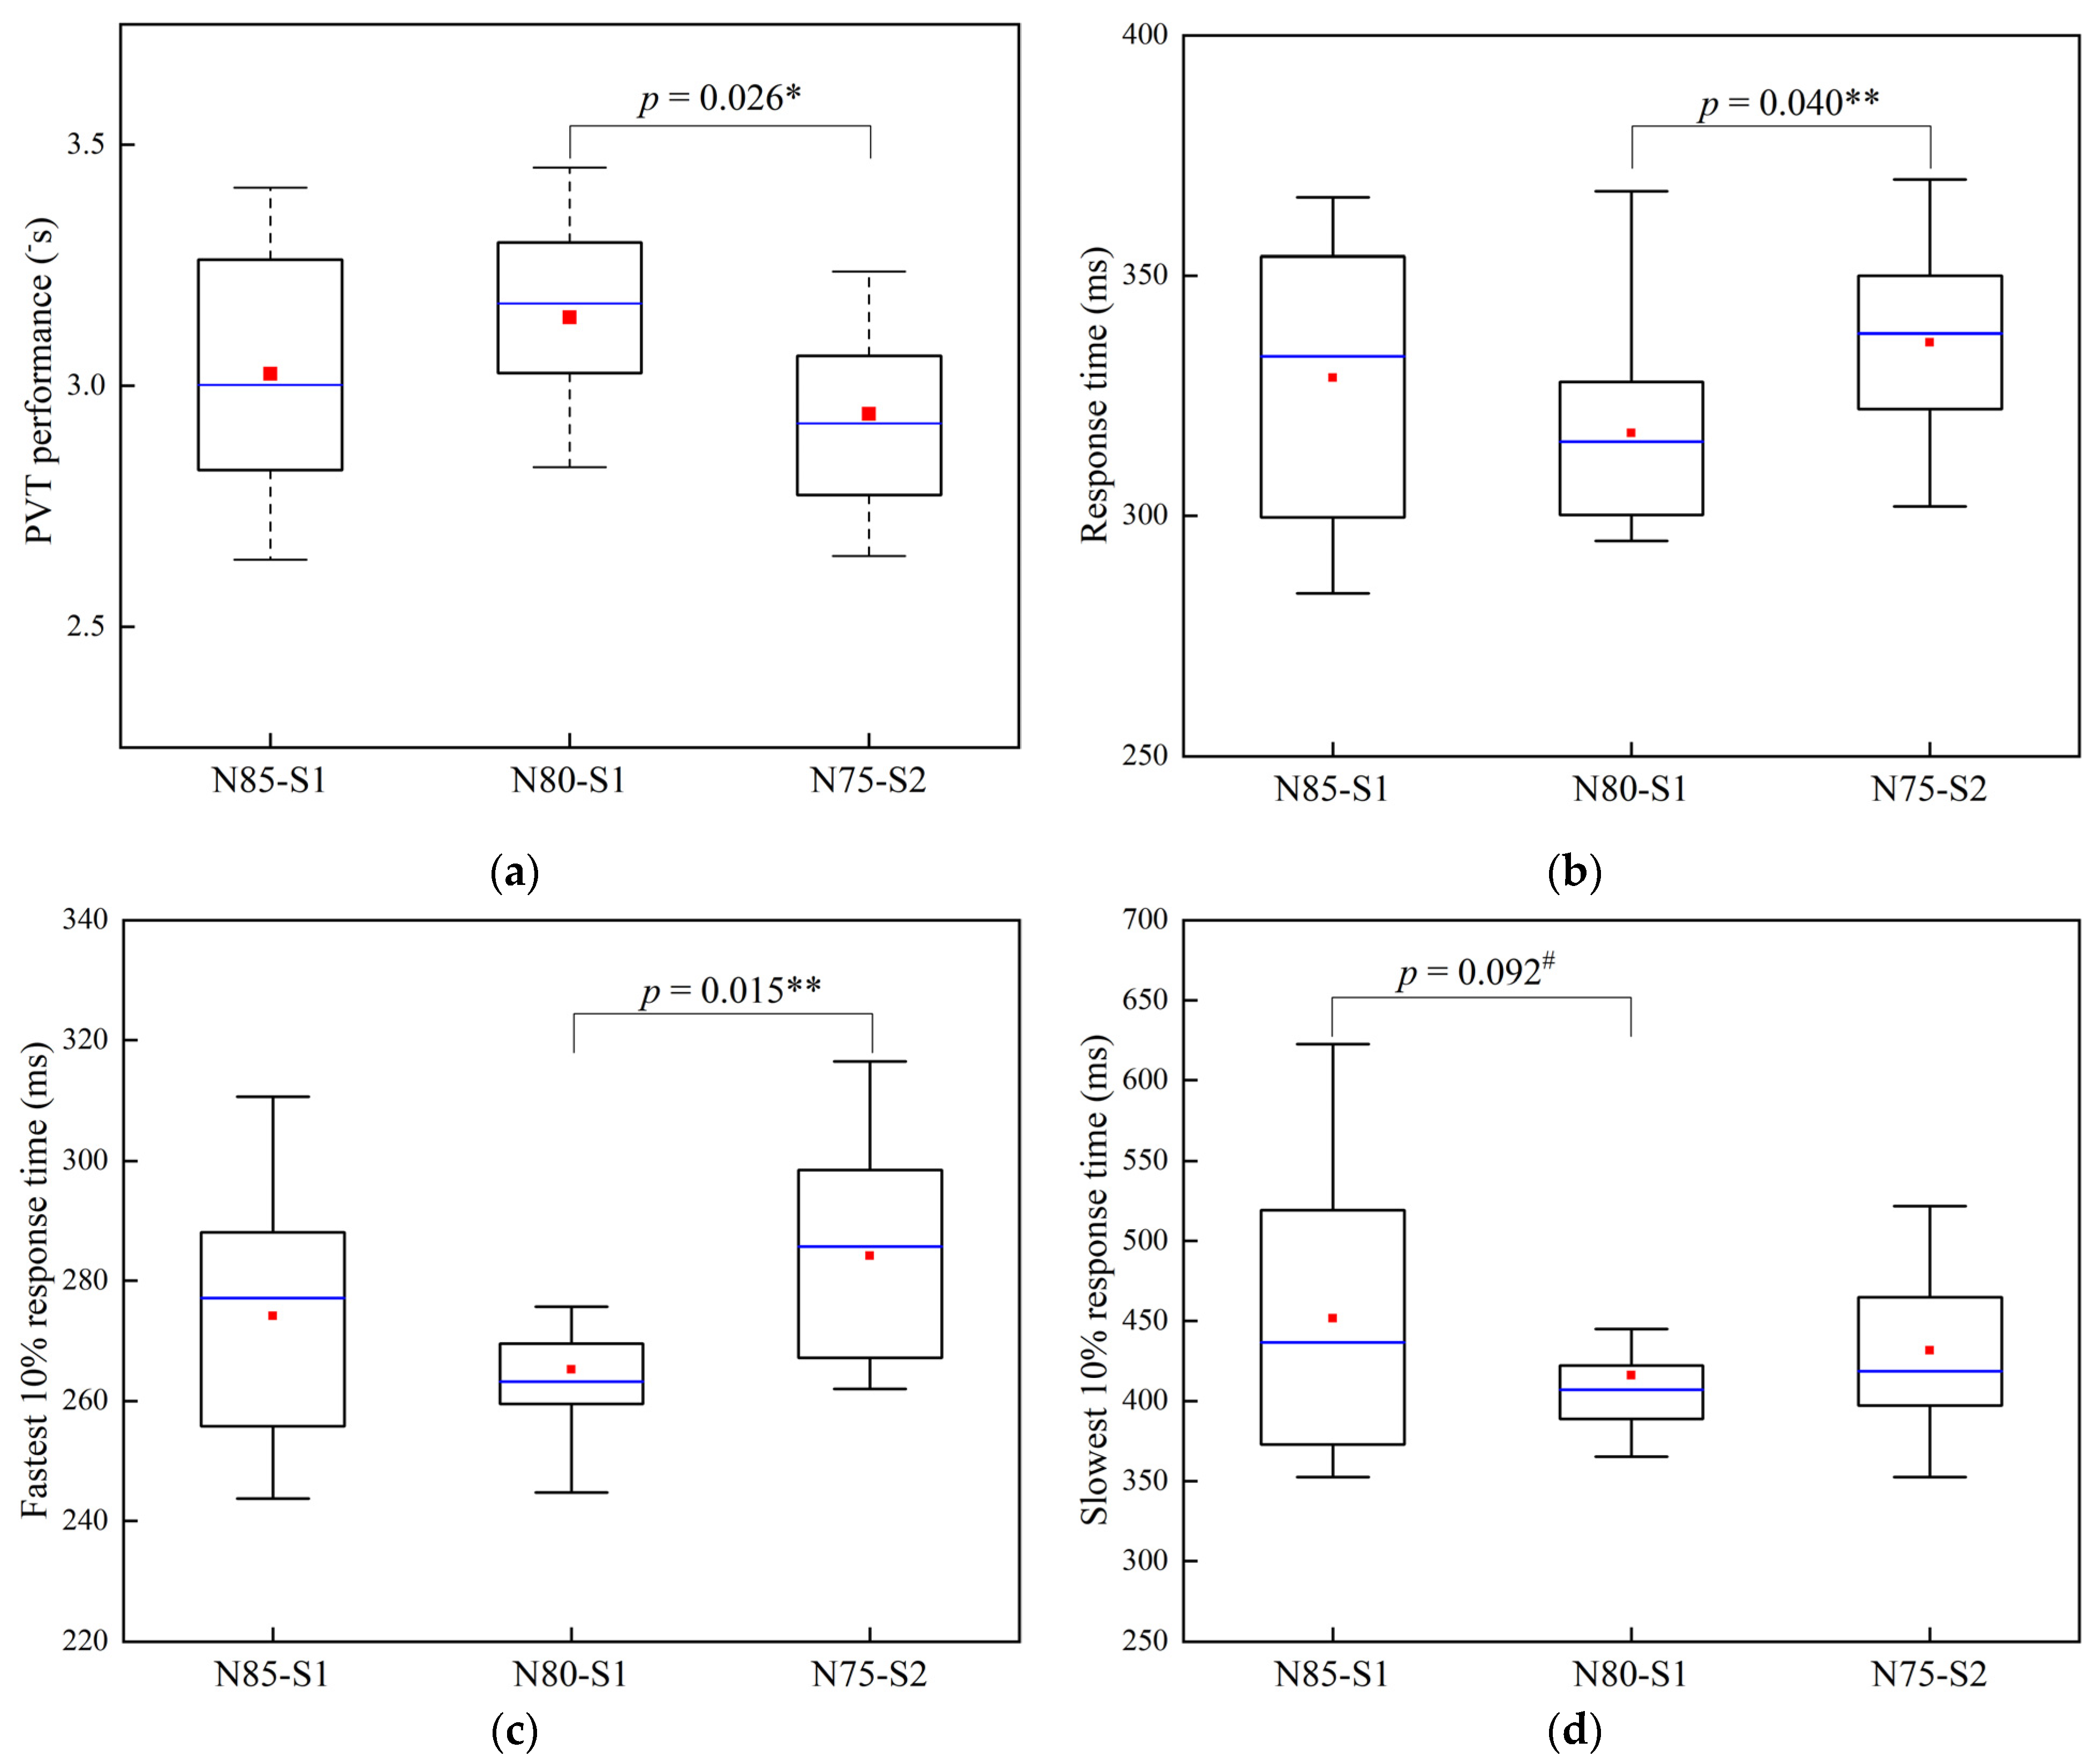
As shown in Figure 5, the best PVT performance was found under N80-S1, which was significantly better than that under N75-S2 (p = 0.026). Moreover, both the response time and fastest 10% response time under N80-S1 were significantly lower than those under N75-S2. Figure 5d also shows that the slowest 10% response time under N80-S1 was relatively lower than that under N85-S1 (p = 0.092).

3.2. Effects of Mental Workload

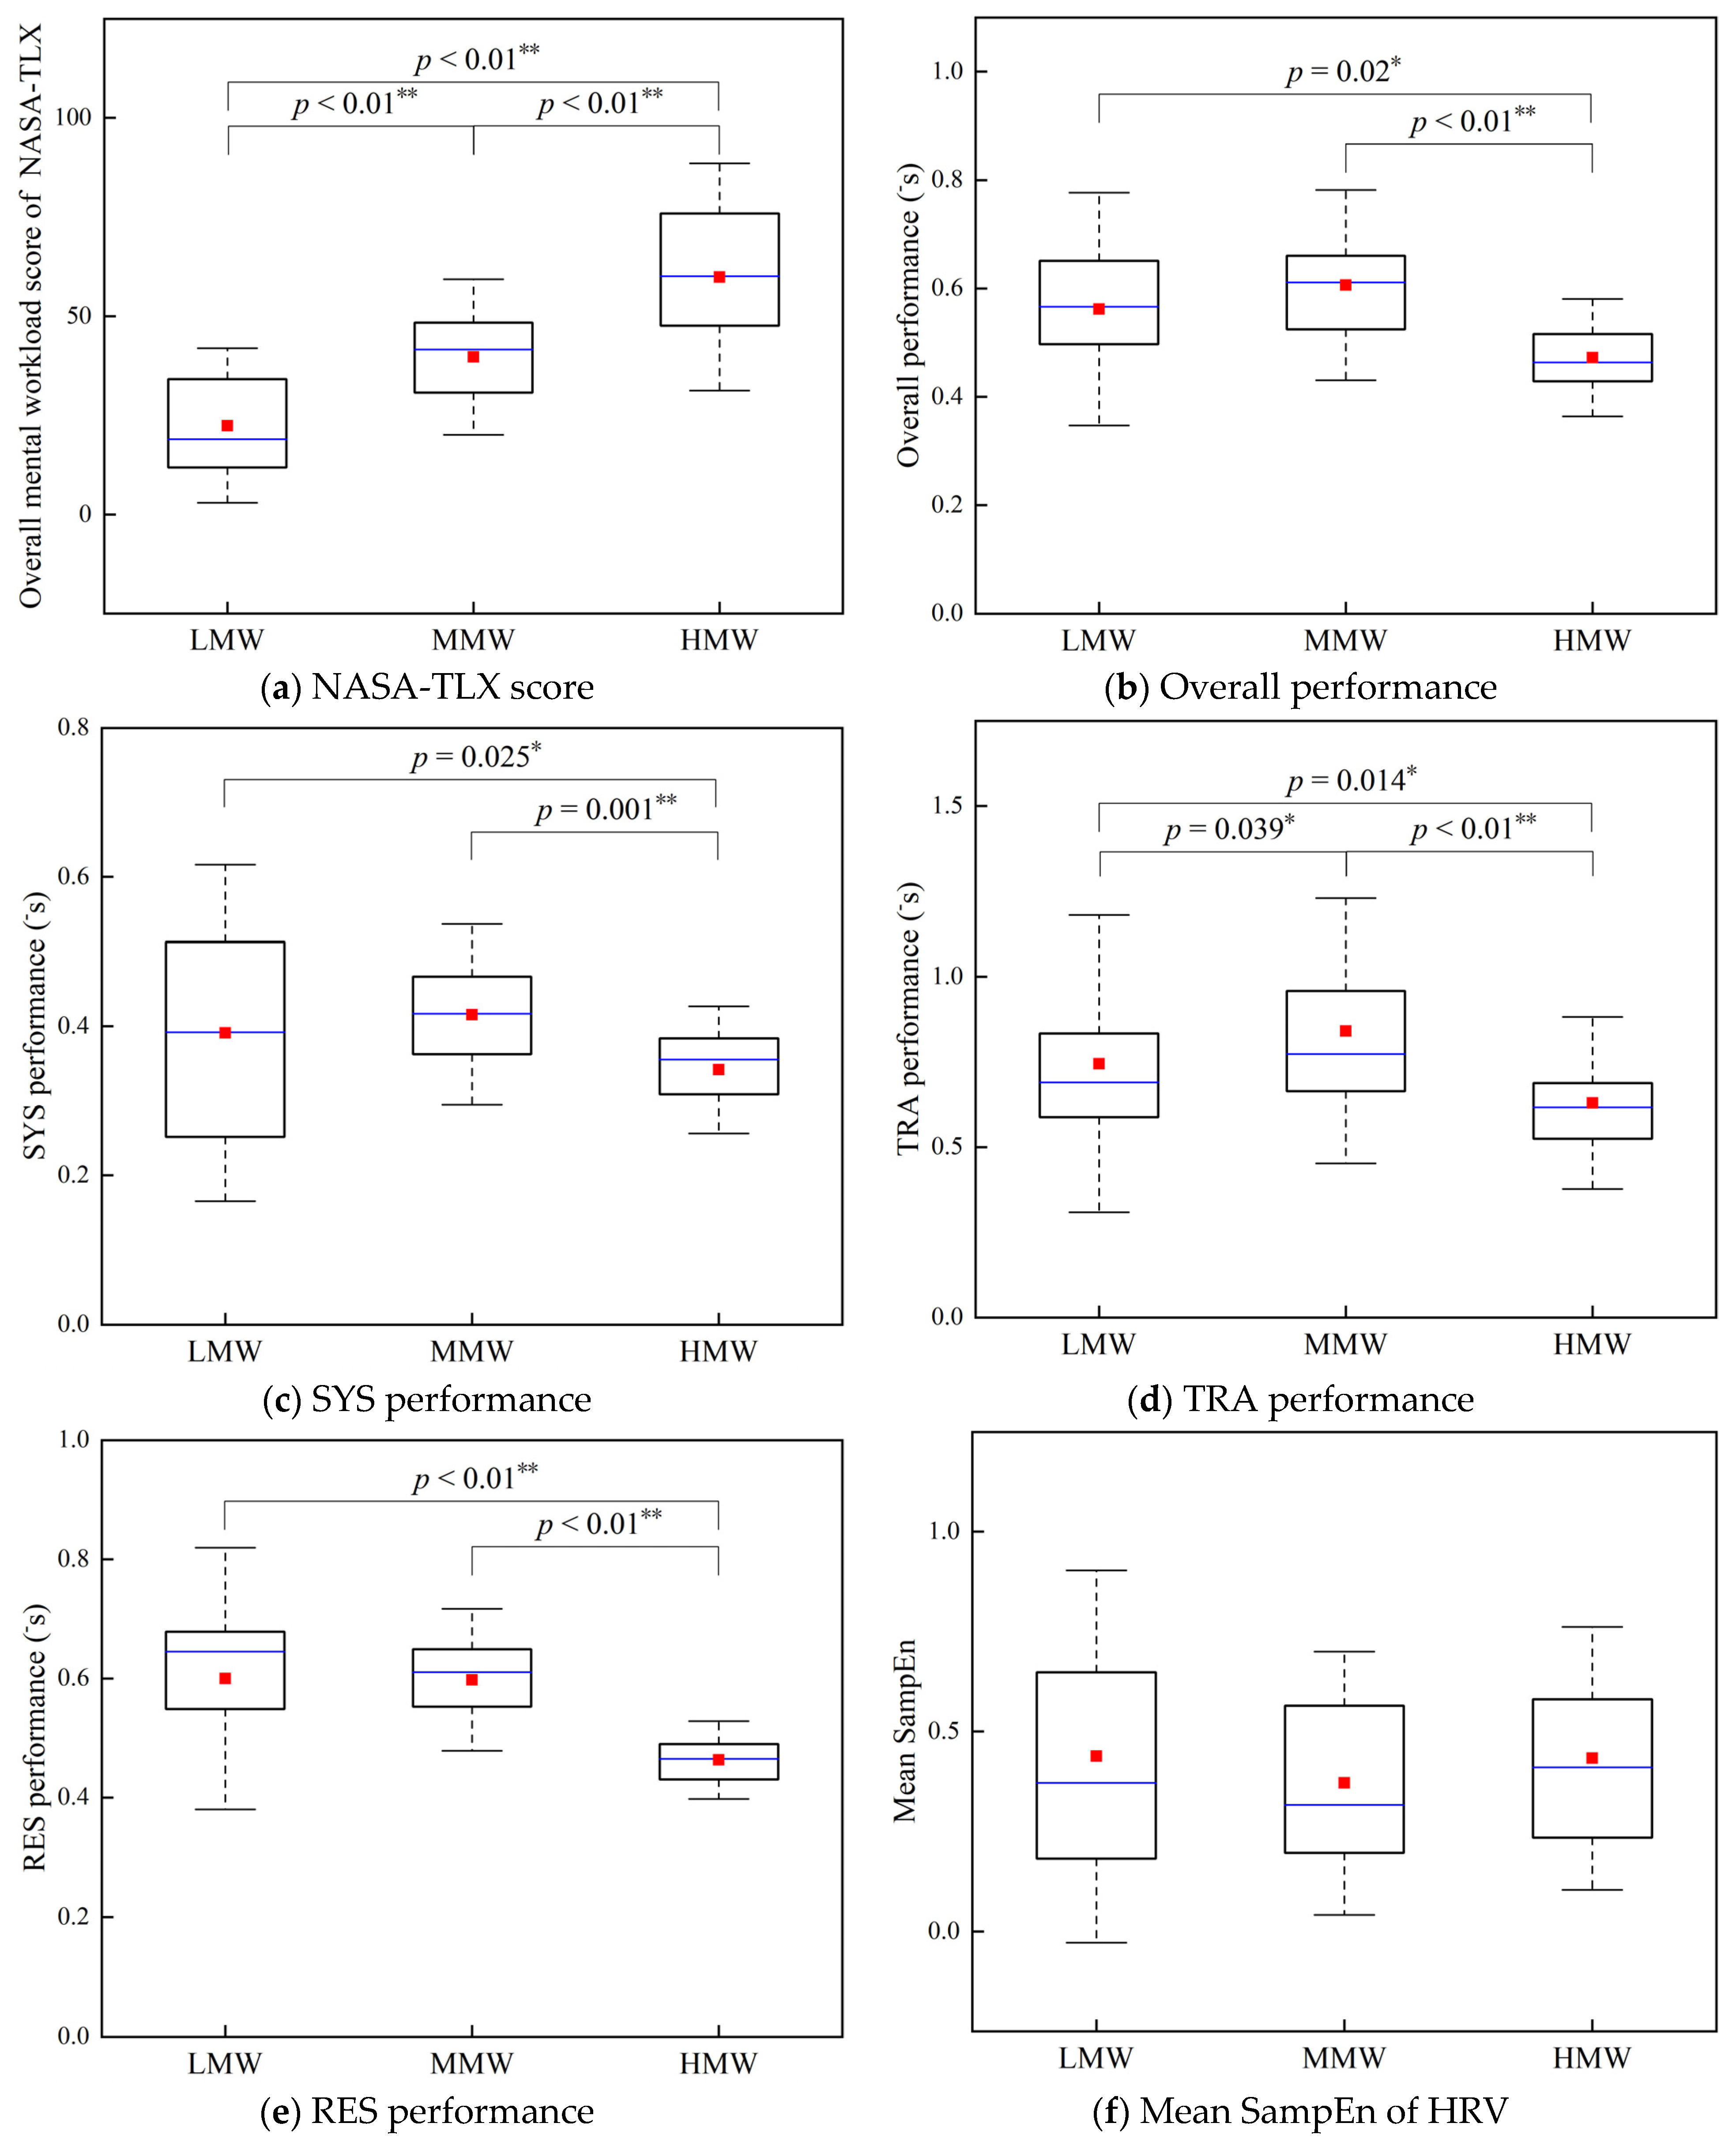
Figure 6 presents the NASA-TLX scale scores, MATB task performance, and mean SampEn of HRV at different mental workloads. As can be seen from Figure 6a, with the increase in difficulty of the MATB task, the subjective mental load of subjects significantly increased, confirming that the workload design of the MATB tests was effective. As shown in Figure 6, the best performance of the overall task and three subtasks was found for MMW, whereas the worst performance was found for HMW. Both the overall performance and performance of the three subtasks had inverted U-shaped relationships with elevated mental workload, which was consistent with the findings of Zhang et al. [21] and Rueb et al. [30]. The lack of vigilance at LMW may have resulted in delayed responses. However, the demand for participant attention resources increased for HMW, which would not only delay response times, but also reduce task accuracy [31]. There was no significant difference in the mean SampEn of HRV among participants during the MATB task at different mental workloads, although the mean SampEn of HRV was slightly lower for MMW (Figure 6f).

3.3. Interactive Effects on Task Performance

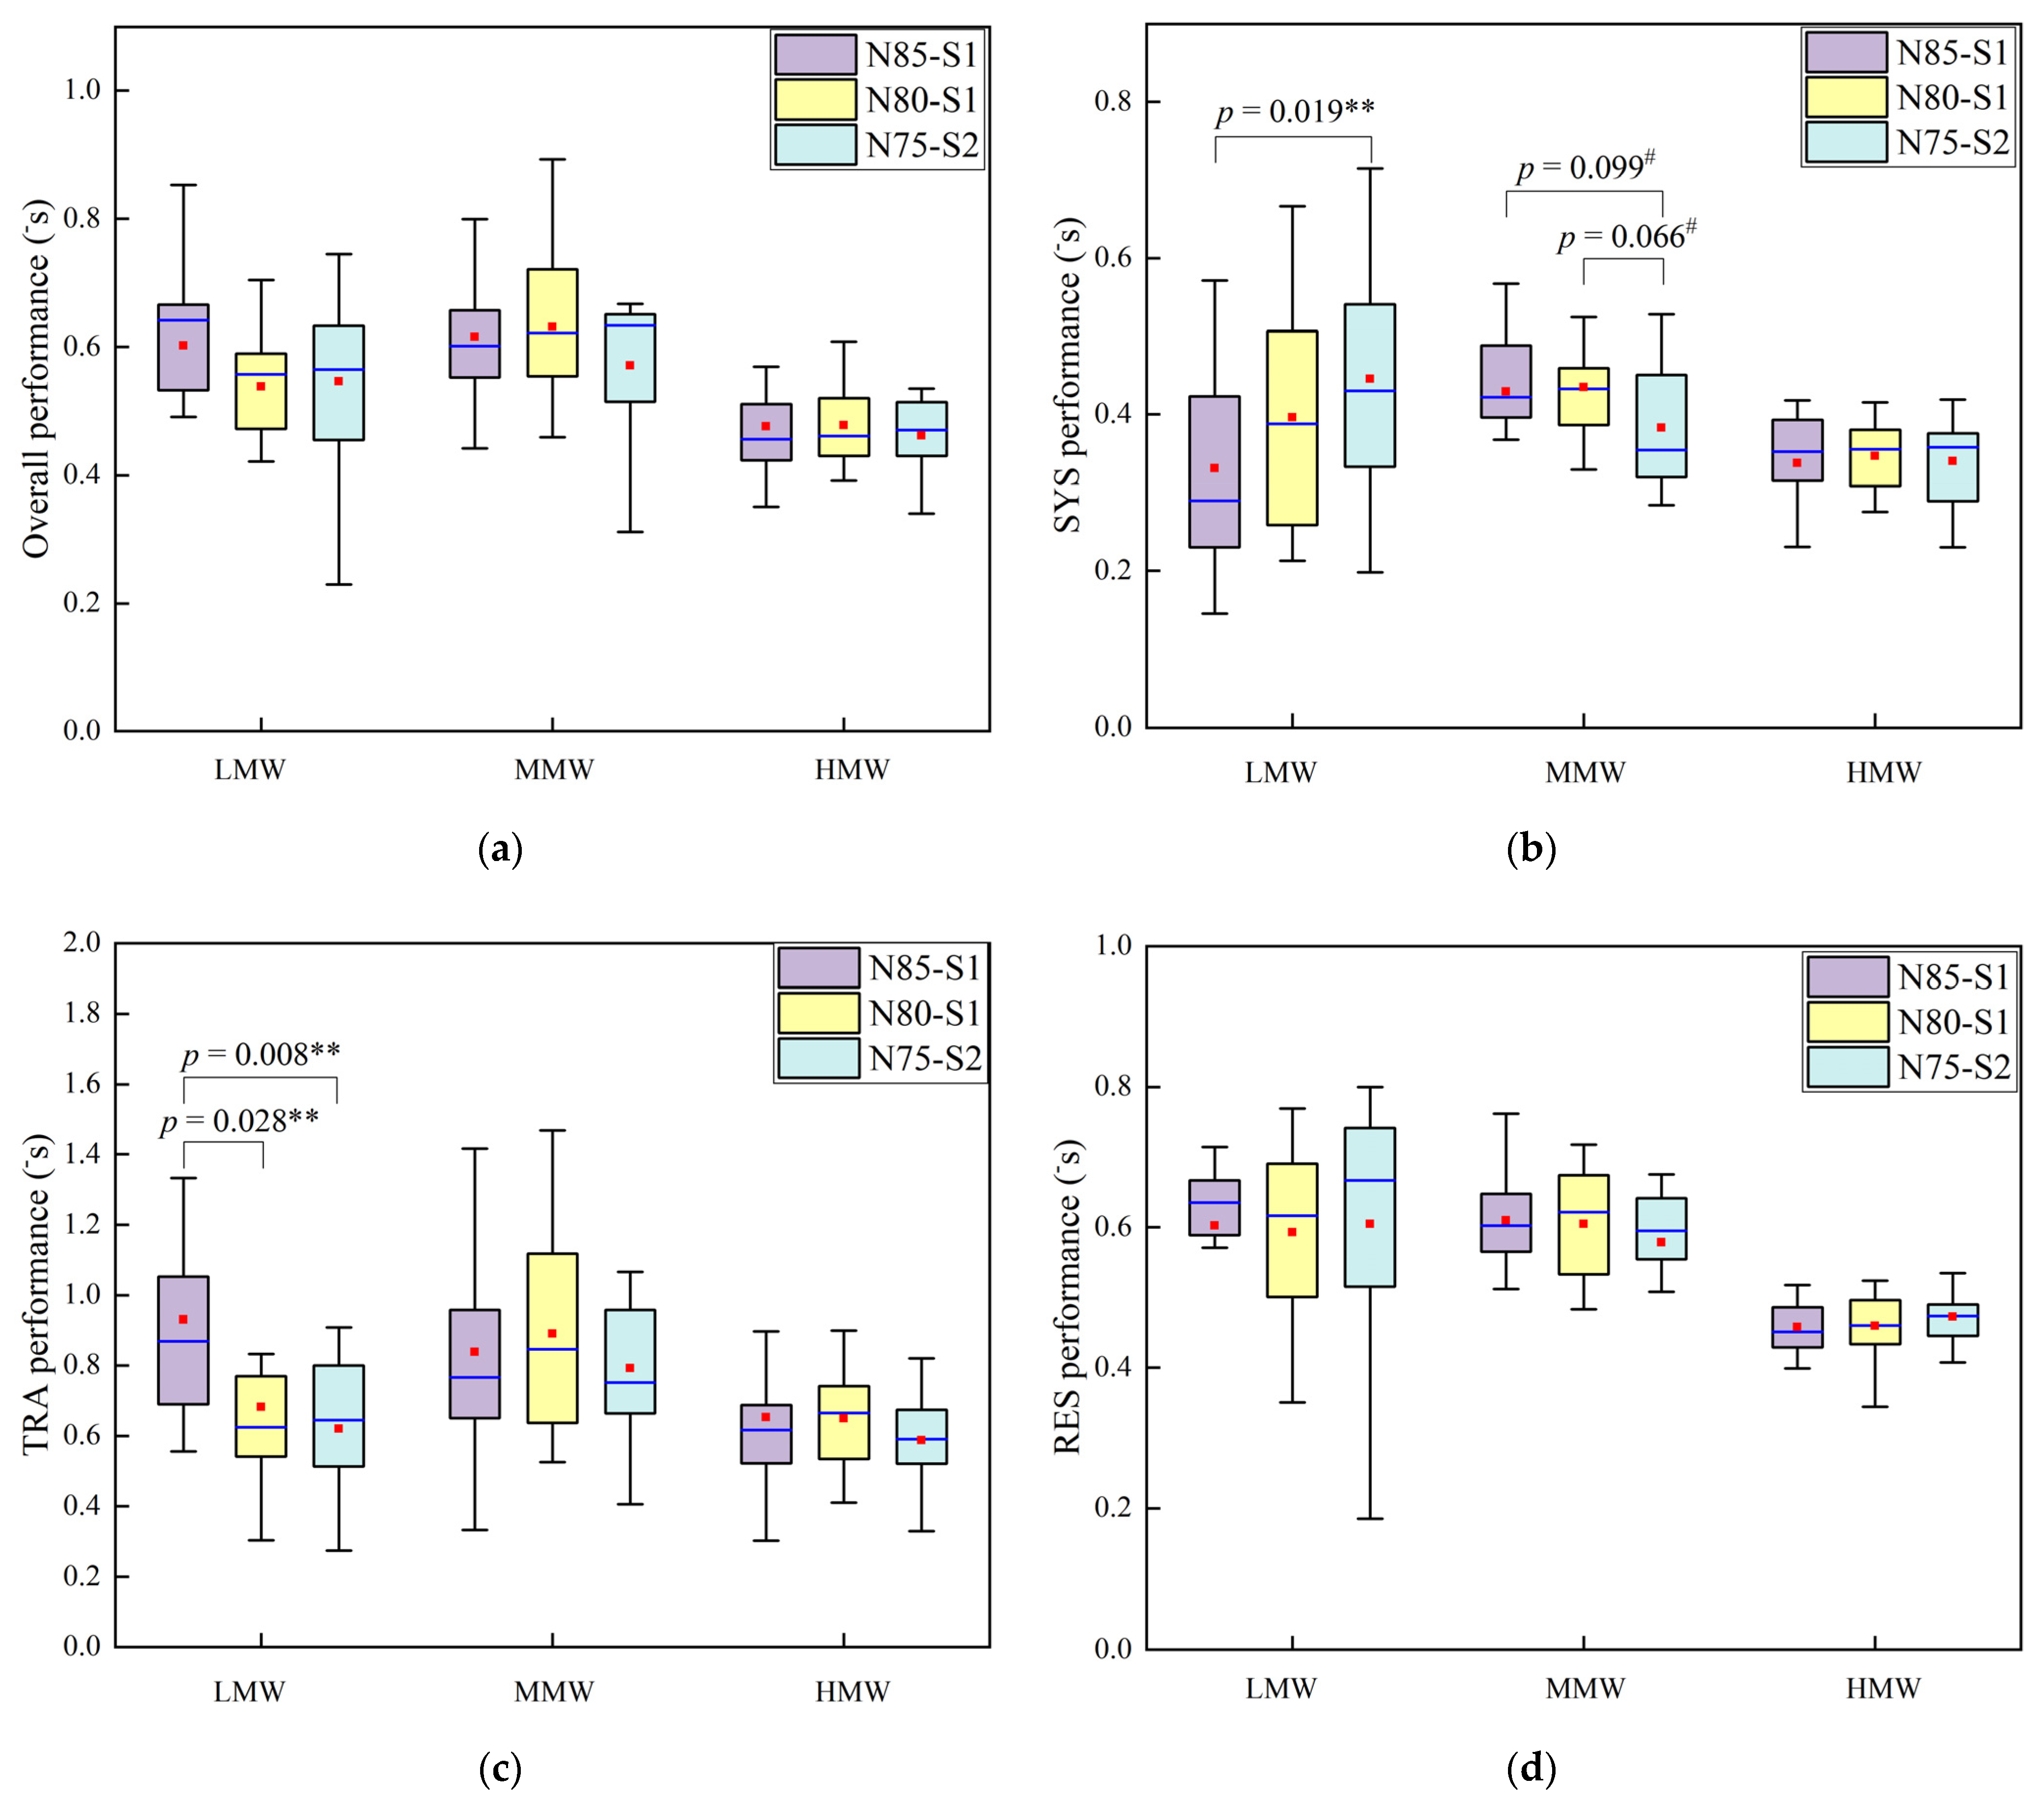
Figure 7 shows the interactive effects of noise and mental workload on MATB task performance. Noise had no significant impact on the overall performance and RES performance at different mental workloads (Figure 7a,d). However, noise had a significant impact on SYS performance at LMW and MMW (Figure 7b). The impact of noise on SYS performance was opposite for the LMW and MMW. At LMW, SYS performance was significantly higher under N75-S2 than that under N85-S1 (p = 0.019). In contrast, SYS performance was relatively lower under N75-S2 than that under N85-S1 (p = 0.099) and N80-S1 (p = 0.066) at MMW. As shown in Figure 7c, TRA performance was significantly higher under N85-S1 than that under N80-S1 (p = 0.028) and N75-S2 (p = 0.008).

4. Discussion

The main purpose of this study was to explore the effects of noise exposure and mental workload on task and vigilance performance. The results indicated that increased noise sharpness had a detrimental effect on performance of the TRA subtask. In addition, higher sound pressure level and sharpness could impair human vigilance, as indicated by the lower mean sample entropy of HRV and worse PVT metrics. Therefore, a reduction in noise sharpness was also important for improving performance during task execution.
Changes in noise exposure conditions may affect the subjective mental workload. Shkembi et al. [32] evaluated five occupational noise indicators of open-pit miners in the United States Midwest with 15 subjects. The results showed that the risk of mental workload increased from a sound pressure level of 80 dB(A). It was suggested that noise exposure at high sound pressure levels could be an independent risk factor for a high mental workload. In addition, Golmohammadi et al. [33] investigated mental load and cognitive ability under five noise conditions: a quiet environment (54 ± 0.3 dB(A)), closed office (64 ± 0.4 dB(A),), open office (68 ± 0.8 dB(A)), control room (73 ± 0.3 dB(A)), and industrial place (80 ± 0.1 dB(A)). By testing 31 subjects on their cognitive performance and NASA-TLX scale scores under different noise conditions, they found that the higher the sound pressure level, the greater the perception of mental workload level. In our study, we did not find any significant effect of sound pressure level on subjective mental workload. However, the subjective mental workload was slightly increased with higher noise sharpness.
The impact of noise on task performance remains controversial [34]. William et al. [35] collected the performance indicators of 192 subjects under two noise conditions (95 dB(A) intermittent aircraft noise vs. quiet), and the results confirmed that performance under the noise condition was better than that of the quiet condition. However, Golmohammadi et al. [33] showed that an increase in sound pressure level led to increases in errors in job performance. In our study, different noise exposure conditions had no significant impact on overall MATB task performance. However, it was found that TRA performance was significantly lower under N75-S2 than under N85-S1. The difference in the results of noise effects on task performance may be related to task difficulty. TRA is a subtask with the least cognitive challenge in MATB [20], which is more likely to be affected by deteriorating noise exposure. Meanwhile, participants may be more distractable during task processing at low workload demands [36]. At this time, an increase in noise sharpness may lead to narrowed attention of the subjects, causing them to ignore the lower difficulty TRA subtask and focus on the more complex SYS subtask [8]. This suggests that an increase in noise sharpness could narrow attentional focus, inducing participants to concentrate on the more complex tasks.
In an experimental study conducted by Elmenhorst et al. [37], 112 participants were exposed to aircraft noise for nine consecutive nights in a laboratory, while 64 participants were tested in an airport for nine consecutive nights. The experimental results showed that the sound pressure level could increase the PVT response time of operators in both the laboratory and airport. Our results also confirmed that severe noise exposure could impair human vigilance, which was manifested in worse PVT performance and longer response times. The higher the mean SampEn value, the more complex the time-series HRV signal, indicating that the sympathetic nerve system and parasympathetic nerve system have stronger mutual regulation and better adaptability to changes in the external environment [38]. Therefore, higher mean SampEn of HRV typically reflects better human vigilance [15]. In this study, although the mean SampEn of HRV did not significantly change with an elevated sound pressure level, it significantly decreased with an increase in noise sharpness. In sum, our results indicated that an increase in either sound pressure level or noise sharpness would adversely affect human vigilance.
There are several limitations to this study, which are listed as follows: (1) This study only focused on the mean SampEn of HRV as an indicator of vigilance. Other physiological indicators, such as respiration, cortisol, blood pressure, electroencephalogram, and electromyogram, should also be considered in future studies. (2) In this study, only noise sharpness was used as an indicator of sound quality. More sound quality parameters are suggested to be evaluated in future works, such as loudness, roughness, and psychoacoustic annoyance. (3) The sample size was relatively small and the subjects were limited to healthy college-age male students, indicating that the statistical results could be under-powered. Therefore, the statistical differences with modestly higher p-values (<0.1) are also worthy of attention. A larger and mixed sample population is needed to further extend our findings.

5. Conclusions

In this study, twelve healthy college-age male subjects were recruited to perform MATB tasks with three mental workloads and PVT tests under three noise exposure conditions. The overall MATB task performance showed an inverted U-shaped trend with increased mental workload. Although noise exposure had no significant effect on overall task performance, higher noise sharpness could lead to significantly reduced TRA performance. An increase in noise sharpness also narrowed the subjects’ attention to the more complex SYS subtask. In addition, higher sound pressure level and noise sharpness were both detrimental to human vigilance performance, as indicated by lower mean SampEn of HRV and decreased PVT performance. These results indicate that an increase in noise sharpness could lead to adverse effects on human work performance during operational task execution. Therefore, noise control design of workplaces should not only lower sound pressure levels, but also consider reductions in noise sharpness.

Author Contributions

Conceptualization, L.P., X.C. and C.Y.; methodology, C.Y.; software, C.Y.; validation, C.Y., L.P. and J.L.; formal analysis, C.Y.; investigation, C.Y., Y.F. and J.Z.; resources, L.P. and J.L.; data curation, C.Y.; writing—original draft preparation, C.Y.; writing—review and editing, L.P. and X.C.; visualization, C.Y.; supervision, L.P. and X.C.; project administration, L.P. and X.C; funding acquisition, X.C., L.P. and J.L. All authors have read and agreed to the published version of the manuscript.

Funding

This research was funded by the Fundamental Research Funds for the Central Universities (YWF-22-L-1009).

Institutional Review Board Statement

The study was conducted in accordance with the Declaration of Helsinki, and approved by the Institutional Review Board of Beihang University (protocol code BM20200181).

Informed Consent Statement

Informed consent was obtained from all subjects involved in the study.

Data Availability Statement

The data presented in this study are available upon request from the corresponding author.

Acknowledgments

The authors would like to thank all subjects involved in this study.

Conflicts of Interest

The authors declare no conflict of interest.

References

  1. Basner, M.; Babisch, W.; Davis, A.; Brink, M.; Clark, C.; Janssen, S.; Stansfeld, S. Auditory and non-auditory effects of noise on health. Lancet 2014, 383, 1325–1332. [Google Scholar] [CrossRef] [Green Version]
  2. Zare Sakhvidi, M.J.; Zare Sakhvidi, F.; Mehrparvar, A.H.; Foraster, M.; Dadvand, P. Association between noise exposure and diabetes: A systematic review and meta-analysis. Environ. Res. 2018, 166, 647–657. [Google Scholar] [CrossRef] [PubMed]
  3. van Kempen, E.; Babisch, W. The quantitative relationship between road traffic noise and hypertension: A meta-analysis. J. Hypertens. 2012, 30, 1075–1086. [Google Scholar] [CrossRef] [PubMed] [Green Version]
  4. de Kluizenaar, Y.; van Lenthe, F.J.; Visschedijk, A.J.; Zandveld, P.Y.; Miedema, H.M.; Mackenbach, J.P. Road traffic noise, air pollution components, and cardiovascular events. Noise Health 2013, 15, 388–397. [Google Scholar] [CrossRef]
  5. Ke, J.; Du, J.; Luo, X. The effect of noise content and level on cognitive performance measured by elec-troencephalography (EEG). Autom. Constr. 2021, 130, 103836. [Google Scholar] [CrossRef]
  6. Monteiro, R.; Tomé, D.; Neves, P.; Silva, D.; Rodrigues, M.A. The interactive effect of occupational noise on attention and short-term memory: A pilot study. Noise Health 2018, 20, 190–198. [Google Scholar]
  7. Irgens-Hansen, K.; Gundersen, H.; Sunde, E.; Baste, V.; Harris, A.; Bråtveit, M.; Moen, B.E. Noise exposure and cognitive performance: A study on personnel on board Royal Norwegian Navy vessels. Noise Health 2015, 17, 320–327. [Google Scholar] [CrossRef] [Green Version]
  8. Broadbent, D.E. The current state of noise research: Reply to Poulton. Psychol. Bull. 1978, 85, 1052–1067. [Google Scholar] [CrossRef]
  9. Smith, A. Noise, performance efficiency and safety. Int. Arch. Occup. Environ. Health 1990, 62, 1–5. [Google Scholar] [CrossRef]
  10. Robinson, O.J.; Vytal, K.; Cornwell, B.R.; Grillon, C. The impact of anxiety upon cognition: Perspectives from human threat of shock studies. Front. Hum. Neurosci. 2013, 7, 203. [Google Scholar] [CrossRef] [Green Version]
  11. Patel, N.; Vytal, K.; Pavletic, N.; Stoodley, C.; Pine, D.S.; Grillon, C.; Ernst, M. Interaction of threat and verbal working memory in adolescents. Psychophysiology 2016, 53, 518–526. [Google Scholar] [CrossRef] [PubMed]
  12. Koelega, H.S.; Brinkman, J.A. Noise and vigilance: An evaluative review. Human Factors 1986, 28, 465–481. [Google Scholar] [CrossRef] [PubMed]
  13. Button, C.D.; Behm, G.D.; Holmes, M.; Mackinnon, N.S. Noise and muscle contraction affecting vigilance task performance. Occup. Ergon. 2004, 4, 157–171. [Google Scholar] [CrossRef]
  14. Smith, A.P. Acute effects of noise exposure: An experimental investigation of the effects of noise and task parameters on cognitive vigilance tasks. Int. Arch. Occup. Environ. Health 1988, 60, 307–310. [Google Scholar] [CrossRef]
  15. Lin, C.; Nascimben, M.; King, J.; Wang, Y. Task-related EEG and HRV entropy factors under different re-al-world fatigue scenarios. Neurocomputing 2018, 311, 24–31. [Google Scholar] [CrossRef]
  16. Wang, F.; Xu, Q.; Fu, R.; Sun, G. Study of driving skill level discrimination based on human physiological signal characteristics. RSC Adv. 2018, 8, 42160–42169. [Google Scholar] [CrossRef] [PubMed] [Green Version]
  17. Richman, J.; Moorman, J.R. Physiological time-series analysis using approximate entropy and sample en-tropy. American journal of physiology. Heart Circ. Physiol. 2000, 278, H2039–H2049. [Google Scholar] [CrossRef] [Green Version]
  18. Pincus, S.M. Approximate entropy as a measure of system complexity. Proc. Natl. Acad. Sci. USA 1991, 88, 2297–2301. [Google Scholar] [CrossRef] [Green Version]
  19. Comstock, J.R. Mat-Multi-Attribute Task Battery for Human Operator Workload and Strategic Behavior Research. 1995. Available online: https://xueshu.baidu.com/usercenter/paper/show?paperid=1b090tr00f730060y94v08y09b694508&site=xueshu_se&hitarticle=1 (accessed on 19 October 2022).
  20. Fairclough, S.H.; Venables, L.; Tattersall, A. The influence of task demand and learning on the psycho-physiological response. Int. J. Psychophysiol. 2005, 56, 171–184. [Google Scholar] [CrossRef]
  21. Zhang, J.; Pang, L.; Cao, X.; Wanyan, X.; Wang, X.; Liang, J.; Zhang, L. The effects of elevated carbon dioxide concentration and mental workload on task performance in an enclosed environmental chamber. Build. Environ. 2020, 178, 106938. [Google Scholar] [CrossRef]
  22. Hart, S.G.; Staveland, L.E. Development of NASA-TLX (Task Load Index): Results of Empirical and The-oretical Research. Adv. Psychol. 1988, 52, 139–183. [Google Scholar]
  23. Ramiro, E.M.; Valdehita, S.R.; García, J.L.; Moreno, L. Estudio Psicométrico del Índice de Carga Mental NASA-TLX con una Muestra de Trabajadores Españoles. Rev. Psicol. Trab. Organ. 2010, 26, 191–199. [Google Scholar]
  24. Song, Y.; Lio’, P. A new approach for epileptic seizure detection: Sample entropy based feature extraction and extreme learning machine. J. Biomed. Sci. Eng. 2010, 3, 556–567. [Google Scholar] [CrossRef]
  25. Bermudez, E.B.; Klerman, E.B.; Czeisler, C.A.; Cohen, D.A.; Wyatt, J.K.; Phillips, A.J. Prediction of Vigilant Attention and Cognitive Performance Using Self-Reported Alertness, Circadian Phase, Hours since Awakening, and Accumulated Sleep Loss. PLoS ONE 2016, 11, e0151770. [Google Scholar] [CrossRef] [PubMed] [Green Version]
  26. Fastl, H.; Zwicker, E. Psychoacoustics: Facts and Models; Springer Science & Business Media: Berlin/Heidelberg, Germany, 1990. [Google Scholar]
  27. Hu, Z.Y.; Shi, X.F.; Liang, Z.F. Discussion on noise level in submarine cabin during navigation. Chin. J. Marine Med. 1997, 69–71. [Google Scholar]
  28. ISO 7933; Ergonomics of the Thermal Environment–Analytical Determination and Interpretation of Heat Stress Using Calculation of the Predicted Heat Strain. ISO: Geneva, Switzerland, 2004.
  29. ANSI/ASHRAE 55-2010; Thermal Environmental Conditions for Human Occupancy. American Society of Heating, Refrigerating and Air-Conditioning Engineers: Atlanta, GA, USA, 2010.
  30. Rueb, J.D.; Vidulich, M.A.; Hassoun, J.A. Establishing Workload Acceptability: An Evaluation of a Pro-posed Kc-135 Cockpit Redesign. Proc. Hum. Factors Ergon. Soc. Annu. Meet. 1992, 36, 17–21. [Google Scholar] [CrossRef]
  31. Yang, C.; Yang, L.; Cheng, T.; Jou, Y.; Chiou, S. Assessing mental workload and situation awareness in the evaluation of computerized procedures in the main control room. Nucl. Eng. Des. 2012, 250, 713–719. [Google Scholar] [CrossRef]
  32. Shkembi, A.; Smith, L.M.; Le, A.B.; Neitzel, R.L. Noise exposure and mental workload: Evaluating the role of multiple noise exposure metrics among surface miners in the US Midwest. Appl. Ergon. 2022, 103, 103772. [Google Scholar] [CrossRef]
  33. Golmohammadi, R.; Darvishi, E.; Faradmal, J.; Poorolajal, J.; Aliabadi, M. Attention and short-term memory during occupational noise exposure considering task difficulty. Appl. Acoust. 2020, 158, 107065. [Google Scholar] [CrossRef]
  34. Szalma, J.L.; Hancock, P.A. Noise effects on human performance: A meta-analytic synthesis. Psychol. Bull. 2011, 137, 682–707. [Google Scholar] [CrossRef] [Green Version]
  35. Helton, W.S.; Matthews, G.; Warm, J.S. Stress state mediation between environmental variables and per-formance: The case of noise and vigilance. Acta Psychol. 2009, 130, 204–213. [Google Scholar] [CrossRef] [PubMed]
  36. De Waard, D.; Brookhuis, K.A. On the measurement of driver mental workload. In Traffic and Transport Psychology. Theory and Application; Elsevier: Amsterdam, The Netherlands, 1997; pp. 161–171. Available online: https://trid.trb.org/view/635112 (accessed on 19 October 2022).
  37. Elmenhorst, E.; Elmenhorst, D.; Wenzel, J.; Quehl, J.; Mueller, U.; Maass, H.; Vejvoda, M.; Basner, M. Effects of nocturnal aircraft noise on cognitive performance in the following morning: Dose–response relationships in la-boratory and field. Int. Arch. Occup. Environ. Health 2010, 83, 743–751. [Google Scholar] [CrossRef] [PubMed]
  38. Wu, Q. Research on Driving Fatigue Detection Method Based on ECG Signal. Ph.D. Thesis, Zhejiang University, Hangzhou, China, 2008. [Google Scholar]
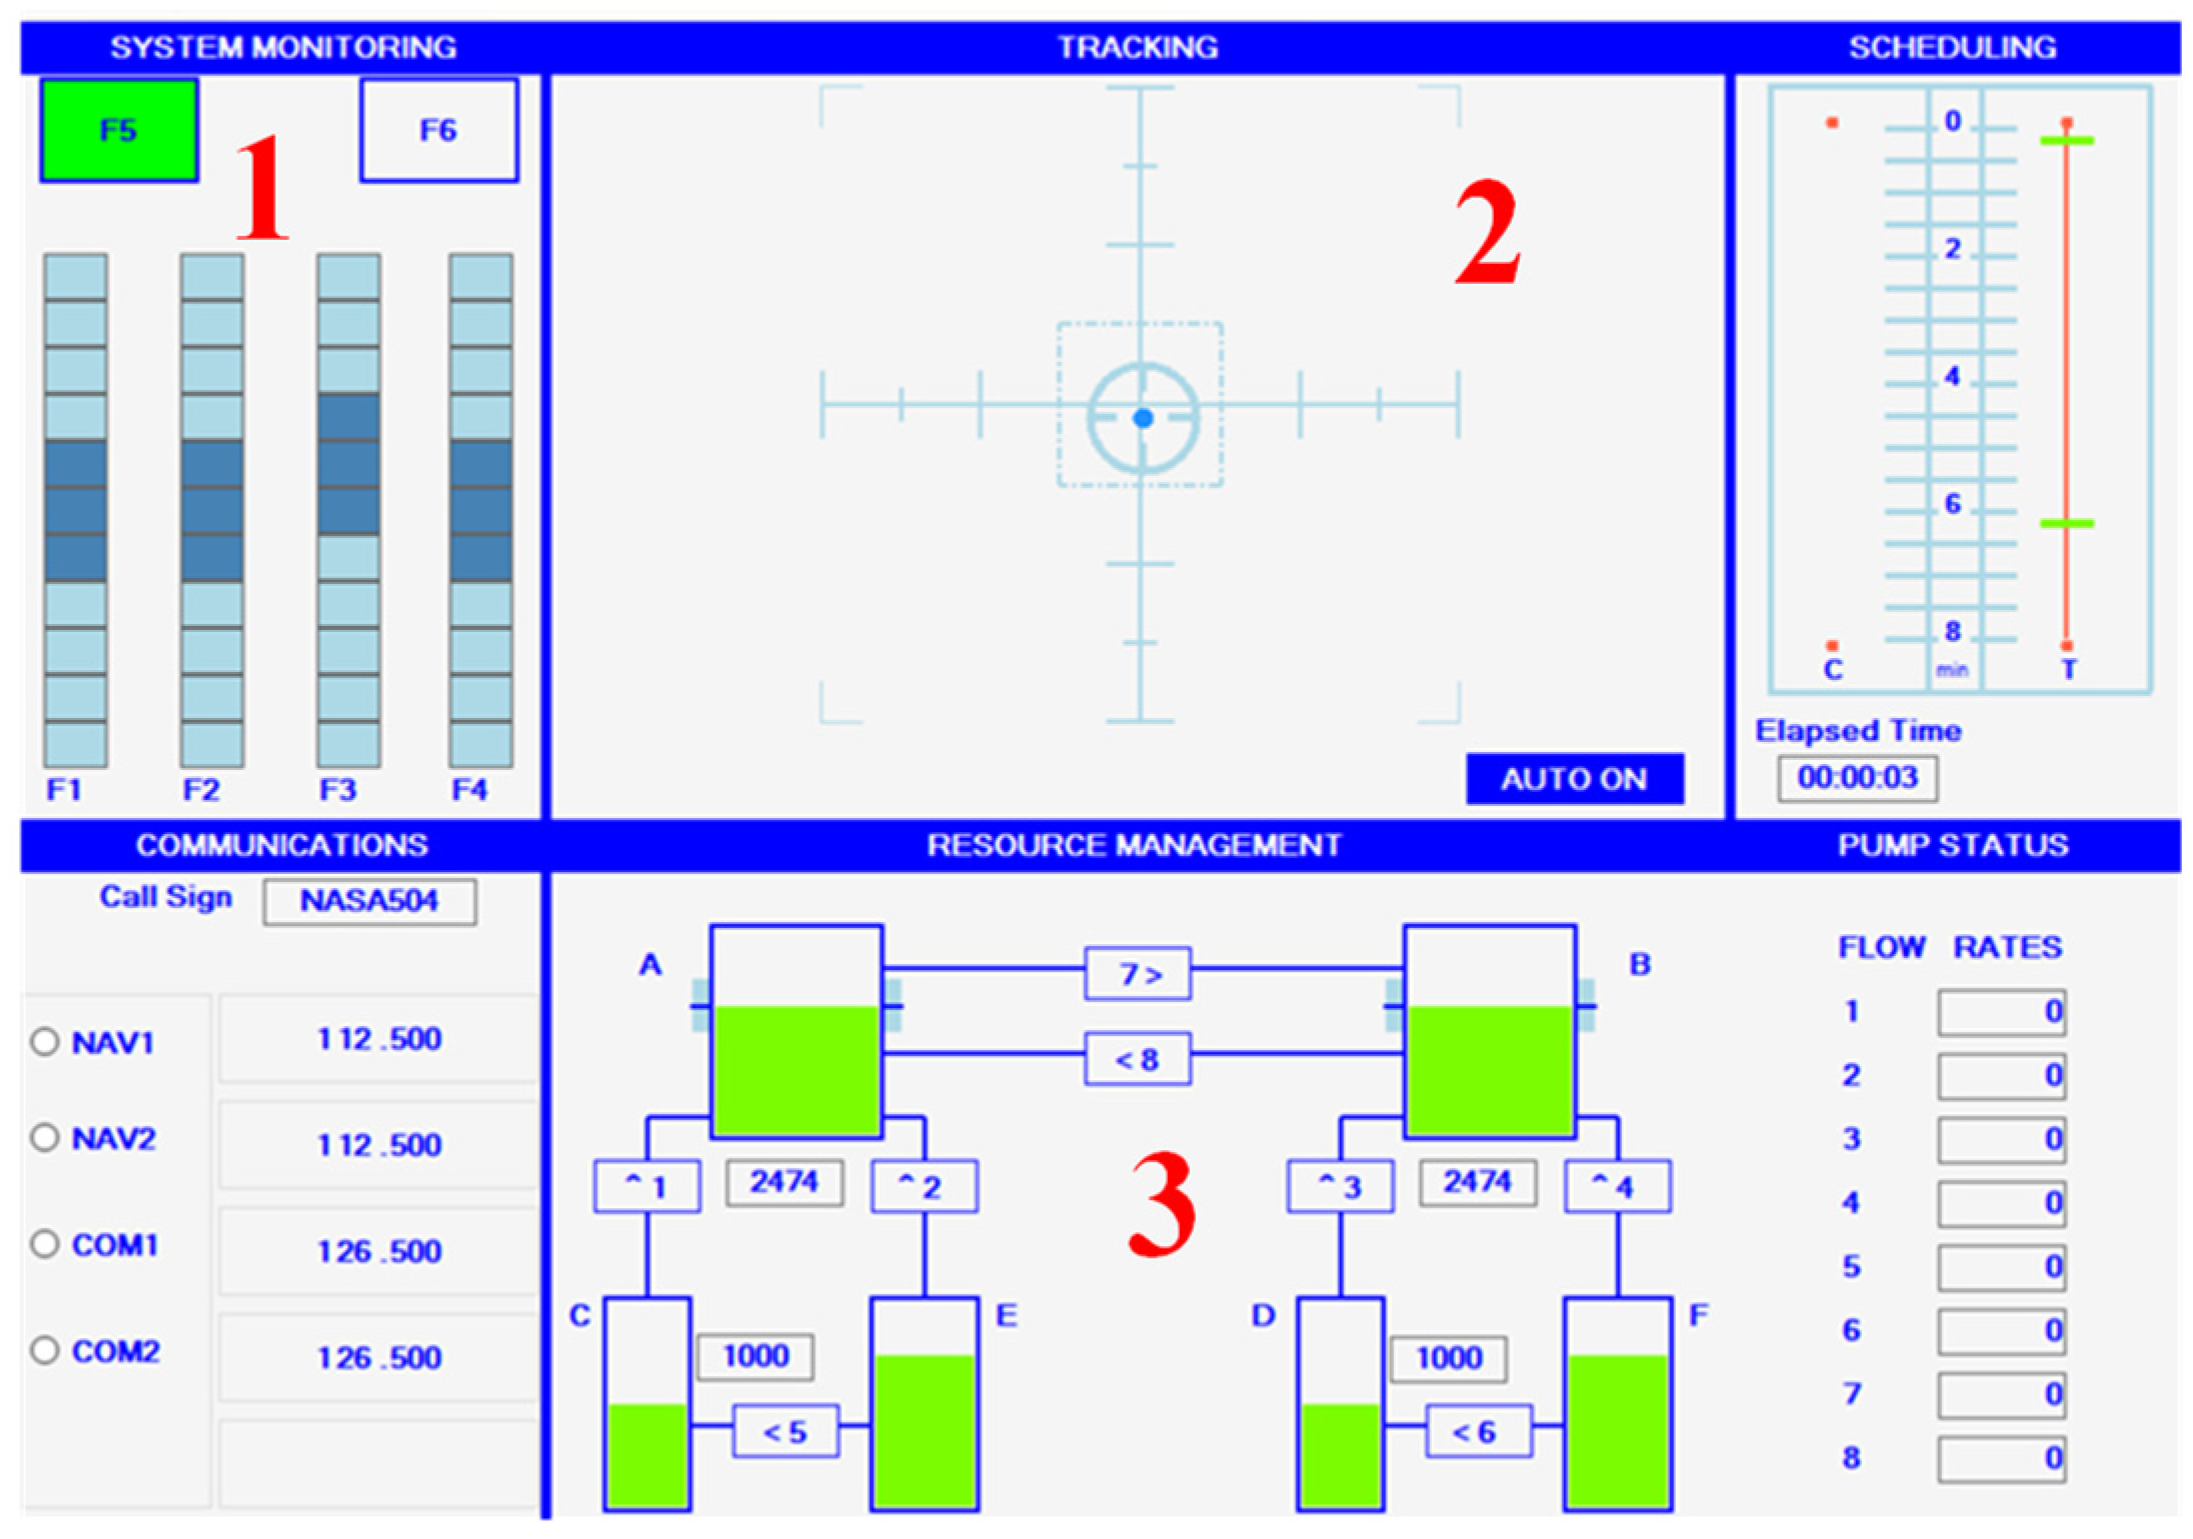
Figure 1. User interface of the MATB (1: SYS, 2: TRA, 3: RES).
Applsci 12 11376 g001
Figure 2. Schematic diagram of the experimental set-up.
Applsci 12 11376 g002
Figure 3. Flowchart of the formal experimental procedure.
Applsci 12 11376 g003
Figure 4. Boxplots of (a) NASA-TLX score, (be) weighted task performance, and (f) mean SampEn of HRV under the three noise exposure conditions (* p < 0.05; ** p < 0.01).
Applsci 12 11376 g004
Figure 5. Boxplots of PVT metrics under the three noise exposure conditions. (a) PVT performance. (b) Response time. (c) Fastest 10% response time. (d) Slowest 10% response time (# p < 0.1; * p < 0.05; ** p < 0.01).
Applsci 12 11376 g005
Figure 6. Boxplots of (a) NASA-TLX score, (be) weighted task performance, and (f) mean SampEn of HRV at the three mental workloads (* p < 0.05; ** p < 0.01).
Applsci 12 11376 g006
Figure 7. Boxplots of the interactive effects of noise condition and mental workload on MATB task performance. (a) Overall performance. (b) SYS performance. (c) TRA performance. (d) RES performance (# p < 0.1; ** p < 0.01).
Applsci 12 11376 g007
Table 1. Description of the MATB subtasks.
SubtaskAreaInstruction
SYS1Monitor the scales of F1–F4 and click the corresponding scale with the mouse when the dynamic targets touch the upper or lower three bars of any scale.
TRA2Keep the target at the grid center by joystick in MANUAL mode and no action is required in AUTO mode.
RES3Monitor the status of pumps numbered 1–8 and click the corresponding pump with the mouse when a failure occurs.
Table 2. Description of PVT performance metrics.
PVT MetricsDescription
PVT performance (-s)The ratio of accuracy to average response times.
Response time (ms)The average response times for all trials.
Fastest 10% response time (ms)The fastest 10% response times for all trials.
Slowest 10% response time (ms)The slowest 10% reciprocal response times for all trials.
Table 3. Measured environmental parameters under different experimental conditions.
Environmental ParametersN85-S1N80-S1N75-S2
LAeq (dB(A))84.2 ± 0.878.3 ± 0.775.0 ± 0.8
Noise sharpness (acum)1.28 ± 0.031.30 ± 0.032.42 ± 0.04
Air temperature (°C)20.9 ± 0.621.0 ± 0.621.1 ± 0.6
Relative humidity (%)26.5 ± 8.129.0 ± 7.524.7 ± 5.6
Air velocity (m/s)0.12 ± 0.010.13 ± 0.010.12 ± 0.01
Black globe temperature (°C)21.1 ± 0.621.2 ± 0.621.3 ± 0.5
Publisher’s Note: MDPI stays neutral with regard to jurisdictional claims in published maps and institutional affiliations.