Abstract
Transfusion-associated bacterial infections continue to occur which may be due to the formation of bacterial biofilms on the inner surface of the blood bag. Plasticized poly (vinyl chloride) (p-PVC) platelet storage bags in three surface roughness states (rough, smooth and flattened) were used to determine the effect that a conditioning film (CF) of human plasma had on surface properties and its interaction with Staphylococcus epidermidis and Serratia marcescens. SEM and optical profilometry determined changes in surface roughness, whilst EDX and ATR-FTIR determined surface chemistry. The physicochemistry of the surfaces and bacteria was assessed using contact angle measurements and MATH assays respectively. When applied to a rougher surface, the CF reduced the surface topography, masked certain surface chemistry features and made the surfaces more hydrophilic. The CF reduced the adhesion of the bacteria to most of the hydrocarbons. When human plasma was combined with bacteria, most of the physicochemical properties changed similarly to those of human plasma alone, with the most significant changes observed after 24 h especially with Ser. marcescens. The results demonstrated that the presence of human plasma had a significant effect on the surface properties of the platelet bags and also on microbial interactions with the bag surface.
1. Introduction
Bacterial contamination of blood products poses one of the biggest risks of transfusion medicine [1]. This contamination is most commonly associated with the transfusion of platelet concentrates (PC) due to their storage conditions within the blood bank, providing ideal conditions for bacterial growth and proliferation. It is reported that approximately 1 in 2000–5000 PCs are contaminated with bacterial species [2,3,4].
Although bacteria can, and do, exist in a planktonic state (single cells suspended in medium) the majority of species implicated in PC contamination possess the ability to form biofilms within the transfusion bag [5]. This occurs since bacteria preferentially adhere to a surface. Once large numbers of bacteria become attached and retained to a surface, a biofilm is formed. It has been suggested that once in a biofilm, bacterial metabolism is slowed [6]. This hampers the ability of bacterial detection systems that rely on threshold levels of CO2 being produced to detect bacterial contamination pre-transfusion.
It is widely accepted that the physical and chemical properties of a surface will have a significant influence on the ability of bacterial species to form biofilms [7]. It has been well established that once a surface becomes exposed to an environment, it immediately starts to adsorb a conditioning film (CF) and thus becomes fouled [8]. Whilst surface properties massively influence bacterial adhesion, bacterial cells often do not attach to the surface directly but instead attach to an interface of the surface which has been exposed to its surrounding environment and ‘conditioned’ [9]. This CF acts as a layer between the surface itself and the environment, altering how the surface interface interacts with external materials [10]. Indeed, a CF on a surface can mask the underlying features of the surface and alter the ability of bacteria to be retained, with the adsorbed molecules potentially stimulating or decreasing bacterial attachment [11]. However, the nature of the CF can vary significantly depending upon the conditions of the surrounding environment [12]. For example, environmental CFs can be formed on surfaces exposed to seawater as described by Loeb and Neihof (2009) [8], but can also be formed by bodily fluids (such as blood, tears, saliva and urine) on biomaterials [12].
When considering the attachment of bacteria and the formation of biofilms onto platelet bag surfaces, it is important to understand the type of CF and how this adsorption to the surface affects the surface properties in terms of the topography, chemistry and physicochemistry [13]. The adsorption of a CF has been demonstrated to affect the degree of bacterial attachment [14]. The addition of human plasma to media has been shown to increase Staphylococcus aureus biofilm formation and affect the biofilm phenotype and cell morphology [15]. However, in another study, it was demonstrated that human serum components had anti-biofilm effects on S. epidermidis biofilms, but did not affect established biofilms [16]. Further, a study has demonstrated that conditioning surfaces with adsorbed fibronectin, a protein abundant in blood plasma, reduced the adhesion of S. epidermidis to a surface, but this was dependent upon the amount of adsorbed fibronectin [17]. These studies demonstrate the complexity of conditioned surfaces and how they can significantly alter the interactions between the bacteria and a substrate.
S. epidermidis and Serratia marcescens are regularly identified as bacterial contaminants isolated from contaminated PCs. S. epidermidis is highly implicated in platelet contamination, probably due to being abundant as part of normal human skin flora [18,19]. Ser. marcescens has only been considered as an opportunistic pathogen over the last 30 years [20]. It is likely that the abundance of Ser. marcescens in the environment has resulted in it being identified as a major PC contaminant [21]. Further, it has been implicated in some hospital acquired infections in immunocompromised patients due to its opportunistic nature, including platelet transfusion patients, with the severity of infection being significantly greater than those caused by S. epidermidis [20].
Since the presence of a CF on a surface is clearly of huge significance in determining the capacity for biofilm formation, it is important to clarify how the CF produced in PCs influences biofilm formation on the transfusion bag surfaces. Such information will enable the development of novel strategies for biofilm prevention, potentially leading to improved detection of bacterial contaminants prior to transfusion. The aim of this work was to determine the effect of human blood plasma CFs on the surface properties of the blood bag and the interaction with subsequent bacterial contamination.
2. Methods
2.1. Surface Selection
Platelet storage bags made of plasticised poly(vinyl chloride) pPVC were obtained from Terumo BCT (Lakewood, CO, USA). Bags were either used as supplied or were flattened using a hot press. Flattened bags were made by cutting sections of the platelet storage bags into 150 mm × 25 mm strips. The strips were placed into a template made of polyethylene terephthalate (PET) to ensure depth consistency, of 0.25 mm, of the PVC and were then protected between two sheets of Kapton. A hot press (Bradley & Turton Ltd., Worcestershire, UK) was pre-heated to 150 °C and the strip protected by the Kapton sheets were placed between two sheets of stainless steel (300 mm × 100 mm × 1.5 mm). This was placed between two sheets of steel (300 mm × 200 mm × 45 mm) and placed into the hot press with 10 tonnes of pressure for 10 min at 150 °C. The plates were transferred to a cold press and cooled with 10 tonnes of pressure for 10 min. This resulted in three surfaces used for the experiments, a rough surface from the diamond cross-print side of the platelet bags, a smooth surface from the other side of the platelet bags and a flat surface from the flattening process.
2.2. Sterilisation of Coupons
Round coupons, 11 mm in diameter, were punched out of the platelet bags and flattened platelet bags. The coupons were sterilised using 70% (v/v) ethanol in a 30 mL sterile plastic universal which was vortexed for one min and left to soak for 15 min. The coupons were aseptically transferred to a sterile Petri dish containing sterile distilled water (dH2O). The coupons were transferred to another sterile Petri dish containing sterile dH2O a further two times to remove excess ethanol before being dried in a class II microbiological cabinet for 1 h.
2.3. Bacterial Growth Conditions
Frozen cultures of Serratia marcescens (NCTC 9741) and Staphylococcus epidermidis (DSM 28319) were plated onto tryptone soya agar (TSA) and incubated at 37 °C overnight. A single colony was removed from the TSA plate and inoculated into a 10 mL of sterile tryptone soya broth (TSB) which was incubated overnight at 37 °C on an orbital shaker (150 rpm). Fresh agar plates were streaked from the freezer stock every four weeks to ensure the continuity of the bacteria was maintained for all experiments, with streaked plates stored at 4 °C.
2.4. Human Plasma
The Manchester Metropolitan University ethics board granted approval for the study and whole blood was acquired from the NHS Blood and Transplant (NHSBT) service. Human plasma was prepared by centrifuging the whole blood at 180× g for 20 min and isolating the resultant platelet-rich suspension at the top of the container. This was centrifuged at 5000× g for 5 min to compact the platelets and the remaining platelet-poor plasma was decanted into a fresh tube ready for use in experimentation. All processing was carried out under aseptic conditions to keep the human plasma sterile, and this was stored at −20 °C until required. Prior to use, the human plasma was defrosted slowly by submerging tubes into a 37 °C water bath until fully defrosted and human plasma was stored for no longer than 12 months.
2.5. Conditioning Film (CF) Preparation
CFs of human plasma were prepared alone and in the presence of bacteria. For inoculated CFs, an overnight culture was centrifuged at 2210× g and washed once with sterile dH2O before re-centrifugation and suspension in sterile dH2O. The suspension was diluted to a colony forming units per mL (CFU / mL) of 1.0 × 10⁸ before diluting into human plasma to obtain a working concentration of 1.0 × 10⁷ CFU/mL. Once prepared, sterile test p-PVC coupons were added to a 12 well plate with the test side facing up and 1 mL of the suspension was added to each well, ensuring the coupon remained at the bottom of the well and was covered. The 12 well plate was left for either 1 h or 24 h at 22 °C with gentle agitation (68 rpm) on an orbital shaker. After incubation, the contents of each well was removed with pipetting and the coupons washed by adding 2 mL of sterile dH2O to each well. Sterile forceps were used to transfer the coupon to a new 12 well plate which was placed in a class II cabinet for 1 h to dry the coupons.
2.6. Scanning Electron Microscopy and Energy Dispersive X-ray (EDX)
Coupons prepared with a CF were placed into a 12 well plate and covered with 4% v/v glutaraldehyde made up in phosphate-buffered saline overnight. The coupons were removed from the glutaraldehyde using tweezers and rinsed with sterile dH2O to remove the remaining solvent before an ethanol gradient of 10%, 30%, 50%, 70%, 90% and 100% made up from absolute ethanol diluted with sterile dH2O was performed. Coupons were left in each concentration of ethanol for 10 min moving from the lowest to greatest concentration. The coupons were removed from the 100% ethanol and stored in a desiccator. The coupons were attached to SEM stubs with carbon tabs prior to being sputter coated with a gold and palladium coating (Model: SC7640, Polaron, Au/Pd target, deposition time: 1.5 min) before being stored in a desiccator until imaged.
For EDX, the surfaces were prepared in the same way as for the SEM but were not sputter coated. Samples were imaged using the SEM at 20 KV with a 15 mm working distance before EDX was run on the samples using the EDX attachment on the SEM (n = 3).
2.7. Surface Roughness and Optical Surface Profiles
A ZeGage 3D Optical Surface Profiler (Zygo; Middlefield, CT, USA) was used to calculate the average surface roughness (Sa) for all the coupons. Measurements were taken using the 50× magnification lens with a scanning distance of 50 µm from the centre position (n = 3).
2.8. Attenuated Total Reflection- Fourier Transform Infrared Spectroscopy (ATR-FTIR)
An ATR-FTIR (Nicolet 380 FTIR with a Smart iTR attachment, with diamond internal reflection element (IRE) Thermo Scientific, Loughborough, UK) was used to obtain chemical bonding spectra. Spectra were obtained at room temperature from 16 scans with a resolution of 4 cm−1 using Omnic 5.2 (Thermo Scientific, Loughborough, UK) software. The average spectra of each control surface were subtracted from the spectra obtained with a CF present to obtain a spectra of the differences between the control and conditioned spectra (n = 3).
2.9. Physicochemistry of Surfaces
Left and right contact angles () were determined using a MobileDrop goniometer (Krüss GMBH, Hamburg, Germany) with the solvents HPLC grade water (BDH, Dorset, UK), ethylene glycol or dioodomethane (Alfa Aesar, Haverhill, MA, USA) used (n = 10). Untested coupons were used for each solvent to ensure cross contamination of the solvents did not occur. The surface energy () was calculated using the method of van Oss et al. (1988) [22] via the following equation:
The surface energy of the solid and liquid were denoted by the subscripts l and s respectively. The Lifshitz-van der Waals components of the surface energy were denoted by the superscript LW, and the Lewis acid and Lewis base parameters of the surface energy were denoted by the superscripts A and B respectively. The Lewis acid base (superscript AB) component of the surface energy is combined using the acid and base via the following:
The overall surface energy was subsequently calculated as the sum of the Lifshitz-van der Waals and Lewis acid base components using the following:
The hydrophobicity, or Gibbs free energy of attraction between the surface and water (surface energies are denoted by subscript w), was determined using the components of the surface energy and calculated using the following [22]:
Conditioning Film Microbial Adhesion to Hydrocarbons (MATH) Assay
The MATH assay was performed as previously described [23], with the addition of a CF. After washing and prior to testing, 7.5 mL of standardised bacterial suspension (OD 1.0 at 540 nm) was added to 3.25 mL of human plasma or TSB and vortexed for one min. This was centrifuged at 2210× g for ten min and rinsed once with phosphate urea magnesium sulphate (PUM) buffer before re-centrifugation. The pellet was re-suspended in PUM buffer and an OD of 1.0 at 400 nm was obtained before the MATH assay was performed. A MATH assay without the CF was performed as a control and the assay was performed in triplicate (n = 3).
3. Results
3.1. Scanning Electron Microscopy (SEM)
The SEM images (Figure 1) demonstrated that when the surfaces were fouled with a human plasma CF alone all the surfaces had noticeable build-up of material which was likely to consist of aggregated human plasma components. After 24 h, the rough surface (Figure 1d) demonstrated the most significant amount of human plasma derived material on its surface. The smooth and flattened surfaces did not demonstrate any visible changes.
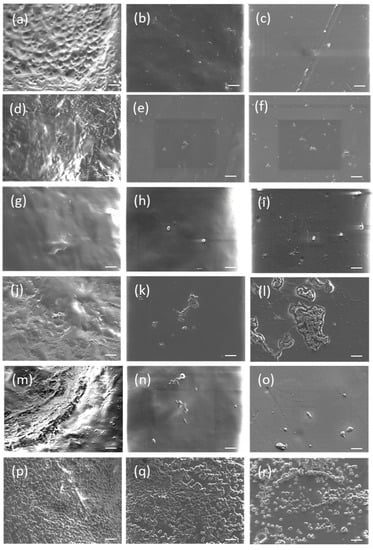
Figure 1.
SEM images of rough (top row), smooth (middle row) and flat (bottom row) surfaces after 1 h (a–c) or 24 h (d–f) incubation with a human plasma conditioning film, 1 h (g–i) or 24 h (j–l) incubation with a human plasma with S. epidermidis conditioning film and 1 h (m–o) or 24 h (p–r) incubation with a human plasma with Ser. marcescens conditioning film. Scale bar = 10 µm.
The combination of human plasma and S. epidermidis had both bacteria and particles from the human plasma observable on all the surfaces, with only the rough surface after 1 h (Figure 1g) having no observable cells. Both the smooth and flat surfaces with a 1 h incubation (Figure 1h,i) only had a low number of particles and only a few bacteria observable. However, after 24 h all the surfaces demonstrated a significant increase in bacteria and particles present on the surfaces. After 24 h the rough surface (Figure 1j) demonstrated small clumps of bacteria that were concentrated around pits present on the surface with a spread of particles across the whole surface. The smooth surface after 24 h (Figure 1k) demonstrated small clumps of bacteria on the surface with some particles present. Finally, the flat surface after 24 h (Figure 1l) demonstrated a significant increase in the number of bacteria present, which again formed clumps, and a significant increase in particles spread over the surface.
When human plasma and Ser. marcescens were combined a substantial difference between the 1 h and 24 h CFs was observed. After 1 h, some particles and a few cells were observable on the surfaces, but the number of cells was significantly increased after 24 h. All three surfaces demonstrated a layer of cells spread over them following a 24 h incubation, with a coverage of greater than 50%, on both the rough and smooth surfaces (Figure 1p,q) appearing to have the most cells present.
3.2. Optical Surface Profiling
Optical surface profiling of the surfaces was performed to determine the average surface roughness of each surface after CF treatments (Figure 2). The average roughness (Sa value) of the rough surface demonstrated a reduction in the roughness following application of all the different CFs (human plasma, S. epidermidis and human plasma and Ser. marcescens in human plasma). The CF that demonstrated a significant reduction (p < 0.05) on the rough surface compared to the rough control value (3.55 µm) was the 1 h human plasma CF (2.2 µm), 24 h human plasma CF (2.1 µm) closely followed by the 24 h Ser. marcescens in human plasma CF (2.1 µm) (Figure 2a).
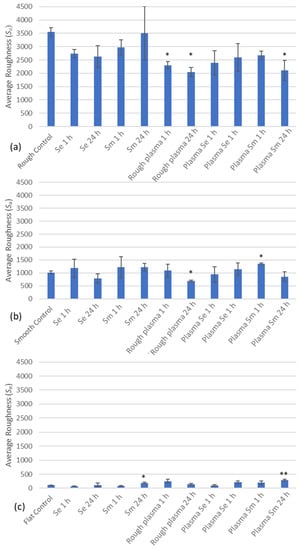
Figure 2.
Average roughness of the conditionings on the (a) rough, (b) smooth and (c) flat surfaces. Surfaces had CFs applied for 1 h or 24 h with human plasma, human plasma with S. epidermidis (Plasma Se) or human plasma with Ser. marcescens (Plasma Sm) (n = 3). Data presented as mean ± SE. (* p < 0.05 and ** p < 0.01).
Unlike the rough surface, the smooth surface demonstrated both reductions and increases in the average roughness of the surface after CF treatment compared to the smooth control (1.0 µm) depending on the conditions. The 24 h human plasma CF (0.7 µm) demonstrated the greatest reduction in roughness on the smooth surface when compared to the control (p < 0.05), with the 1 h Ser. marcescens in human plasma (1.1 µm) demonstrating a significant increase (p < 0.05). (Figure 2b).
Finally, for the flat surface, due to the surface roughness already being significantly low (0.1 µm) when compared with the other two surfaces, most of the CFs demonstrated an increase in the average roughness. Only the 24 h Ser. marcescens (0.2 µm) (p < 0.05) and the 24 h Ser. marcescens in human plasma on the flat surface (0.3 µm) (p < 0.01) demonstrated significant differences in Sa value when compared to the control surface (Figure 2c).
3.3. Energy Dispersive X-ray Spectroscopy (EDX)
All three surfaces had no significant differences in the atomic weight of their elemental makeup when determined using EDX, typically between 78–80% carbon, 12–14% chlorine and 7–8% oxygen. After treatment with the CFs, all the surfaces had a change in these values, averaging 68% to 75% Carbon, 12% to 22% Chlorine and 8% to 12% Oxygen (Figure 3).
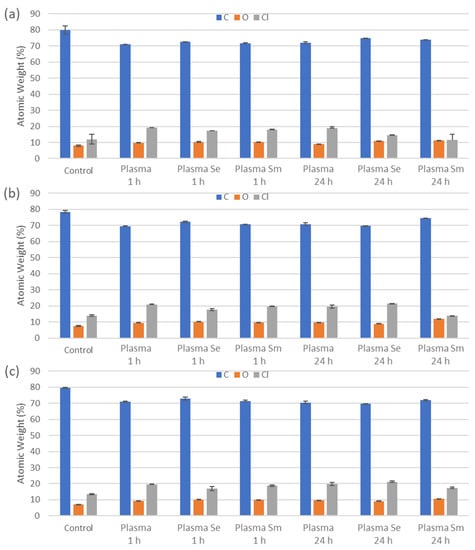
Figure 3.
Determination of elements present according to atomic weight as determined by EDX on the (a) rough, (b) smooth and (c) flat surfaces. Surfaces had CFs applied for 1 h or 24 h with human plasma, human plasma with S. epidermidis (Plasma Se) or plasma with Ser. marcescens (Plasma Sm). (n = 3). Data presented as mean ± SE.
3.4. Attenuated Total Reflection-Fourier Transform Infrared Spectroscopy (ATR-FTIR)
Using ATR-FTIR, the human plasma conditioned surfaces (Figure 4a/b), human plasma and S. epidermidis (Figure 4c/d) and human plasma and Ser. marcescens (Figure 4e/f) were analysed. For the human plasma conditioned, human plasma and S. epidermidis and human plasma and Ser. marcescens conditioned surfaces, on the rough, smooth and flat surfaces, at both 1 h (a, c and e) and 24 h (b, d and f). Note that these spectra are substrate subtracted in order to better resolve new IR bands associated with adsorption of the plasma and/or organism. Note that it is not possible to differentiate between the organisms and the plasma. The positive peaks are the new adsorption-related IR bands and the negative peaks relate to there being slightly less substrate related absorptions in the sample than the substrate reference. This is due better contact between the internal reflection element (IRE) and the treated samples than between the untreated substrate controls and the IRE. ATR-FTIR of the pPVC substrates has been discussed in a previous paper [23]—assignments for the negative peaks can be found here.
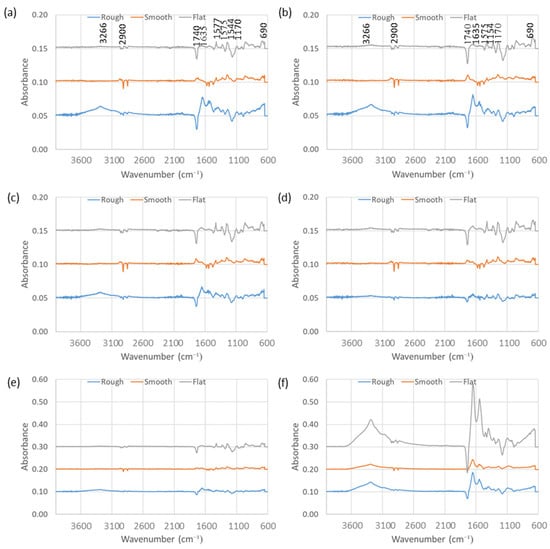
Figure 4.
ATR-FTIR of human plasma conditioning films after (a) 1 h and (b) 24 h, S. epidermidis and human plasma conditioning films after (c) 1 h and (d) 24 h, and Ser. marcescens and human plasma conditioning films after (e) 1 h and (f) 24 h, after subtraction of non-conditioned control surfaces. Note that scale differs for e/f due to absorbance intensity. (n = 3).
Human plasma in isolation showed strongest adsorption (amide I and II bands at 1635 cm−1 and 1575 cm−1, respectively and the O-H and N-H stretching at 3266 cm−1) on to the rough surfaces with only a slight increase after 24 h, indicating rapid adsorption to an almost limiting level (Figure 4a,b). Resolvable levels of plasma adsorption were not observed on the smooth and flat surfaces, even after 24 h.
S. epidermidis and human plasma interestingly showed no resolvable adsorption on to the smooth and flat surfaces after 1 h and 24 h. A small amount of adsorption was evident on the rough surface after 1 h (amide I (1635 cm−1) (Figure 4c)), after 24 h the level of adsorption appeared to reduce to non-resolvable levels observed on the smooth and flat surfaces. This observation at first thought appears to unexpected, though after further consideration it may be proposed that the S. epidermidis and human plasma interact so strongly with each other that all the adsorption active groups are used in the latter interaction and are not available for interaction with the substrate, resulting in no adsorption. In the case of the rough surface a small amount of (maybe plasma) adsorption occurred initially, though with time interaction with the S. epidermidis (or vice-versa – or a combination of both) led to its removal from the surface.
Ser. marcescens and human plasma showed no resolvable adsorption on to the smooth and flat surfaces after 1 h whilst the rough surface showed a small amount of adsorption after this period (Figure 4e). After 24 h adsorption of Ser. marcescens and human plasma on to the flat surface increased significantly, so much so that the absorbance scale had to be increased three-fold to accommodate the amide I peak (Figure 4f). Adsorption of this combination on to the rough surface also increased significantly after 24 h, to roughly twice the levels seen with plasma alone. The smooth surface also showed increased adsorption to broadly similar levels to that of plasma alone on the rough surface.
The substrate with the subtracted FTIR spectra showed varying levels of adsorption of the proteins in the human plasma and/or the bacteria onto the various pPVC substrates. The amide I and II carbonyl absorptions were present at ca. 1630 cm−1, and ca. 1575–80 cm−1 and the amide III may also be visible in the S. marcescens and human plasma sample after 24 h. The rough surface showed more adsorption of the plasma than the smooth and the flat with no difference after 1 h and 24 h. The S. epidermidis and human plasma treated sample showed little adsorption of human plasma or the S. epidermidis after 1 h and 24 h and it may have been in this case that the S. epidermidis and human plasma preferred to interact with themselves forming a “complex” or adduct that involved most of the interacting groups which resulted in much reduced interaction of either the human plasma or S. epidermidis with the substrate. The S. marcescens and human plasma treated flat sample showed strong adsorption of either the human plasma, organism or both and after 24 h the rough and the smooth samples also showed strong adsorption after 24 h relative to the other samples when the difference in the absorbance scale was considered (0.2 versus 0.6). After just 1 h, adsorption of S. marcescens with human plasma could not be detected on any of the samples.
3.5. Physicochemistry
The application of a human plasma CF had a significant effect on the surface physicochemistry after 1 h or 24 h, with both the Gibbs Free energy (ΔG) and the base energy (γs-) demonstrating significant changes. When a CF was formed on the rough surface, the Gibbs Free energy increased from −53 mJ/m2 for the control surface to −28.5 mJ/m2 after 1 h and to −6 mJ/m2 after 24 h whilst the base energy increased from 7.3 mJ/m2 for the control surface to 16.8 mJ/m2 after 1 h and 27.2 mJ/m2 after 24 h. Similar results were observed when the smooth surface was conditioned, with 1 h CF increasing the Gibbs Free energy to −7.5 mJ/m2 and after 24 h it increased to 9.5 mJ/m2. Further, the acid-base energy increased to 13.9 mJ/m2 after 1 h and 11.4 mJ/m2 after 24 h, due to the significant increases in the base energy component which increased from 7.5 mJ/m2 to 37.9 mJ/m2 after 1 h and 50 mJ/m2 after 24 h. A human plasma CF on the flat surface caused an increase in the Gibbs Free energy, with a 1 h incubation increasing it to −22 mJ/m2 and a 24 h incubation increasing it to −5.5 mJ/m2. Whilst small changes in values were observed, the only other significant change was the increase in base energy from 9.7 mJ/m2 to 22.7 mJ/m2 after 1 h and then 29.3 mJ/m2 after 24 h.
When a CF was applied on the rough surface (Table 1) combining the bacteria with human plasma, the combination of human plasma with S. epidermidis caused a significant increase in the Gibbs Free energy, from −53 mJ/m2 to −31.3 mJ/m2 after 24 h, whilst a significant increase in the basic energy was observed after 24 h, from 7.3 mJ/m2 to 14.9 mJ/m2. However, when Ser. marcescens and human plasma combined demonstrated a significant increase after 1 h, with the Gibbs Free energy decreased to −21.5 mJ/m2 and the basic energy increased to 21.5 mJ/m2. However, after 24 h no significant changes were apparent.

Table 1.
Physicochemistry of the rough surface after applying 1 h or 24 h conditioning films of the bacteria alone, human plasma alone or a combination of bacteria and human plasma. Se denotes the bacteria Staphylococcus epidermidis and Sm denotes Serratia marcescens (n = 5). Statistical differences were considered below the p < 0.05 confidence level and are highlighted in grey with bold text.
When the smooth surface was conditioned with human plasma and either S. epidermidis or Ser. marcescens both organisms demonstrated a reduction in Gibbs Free energy after 1 h, from −50.1 mJ/m2 to −68.2 mJ/m2 for S. epidermidis and −57.9 mJ/m2 for Ser. marcescens (Table 2). However, after 24 h the Gibbs Free energy values were similar to human plasma alone, with 7.6 mJ/m2 for human plasma with S. epidermidis and 4.8 mJ/m2 for human plasma with Ser. marcescens. Both organisms demonstrated significantly different values for the other physicochemical properties after 24 h. The combined human plasma and Ser. marcescens’ CF demonstrated an increase in acid-base energies at 9.2 mJ/m2 due to the significant increase in base energy (34.7 mJ/m2). However, human plasma and S. epidermidis combined 24 h CF demonstrated a significantly reduced the total free energy, Lifschitz van der Waals forces and the base energies (1.2 mJ/m2, 1.7 mJ/m2 and 0.9 mJ/m2 respectively) when compared to the controls (49.6 mJ/m2, 45.7 mJ/m2 and 7.5 mJ/m2).
Table 2.
Physicochemistry of the smooth surface after applying 1 h or 24 h conditioning films of the bacteria alone, human plasma alone or a combination of bacteria and human plasma. Se denotes the bacteria Staphylococcus epidermidis and Sm denotes Serratia marcescens (n = 5). Statistical differences were considered below the p < 0.05 confidence level and are highlighted in grey with bold text.
The conditioning of the flat surface (Table 3) with a combination of human plasma and S. epidermidis caused the Gibbs Free energy to reduce from −40.2 mJ/m2 to −60.5 mJ/m2 after 1 h and −58.6 mJ/m2 after 24 h. A slight reduction in the total free energy was observed after one hour (46.8 mJ/m2) but was not significant until 24 h where the total free energy was reduced from 53.3 mJ/m2 to 38.3 mJ/m2. However, when a human plasma and Ser. marcescens CF was applied the Gibbs Free energy was initially reduced to −63.2 mJ/m2 after 1 h but significantly increased to 6.9 mJ/m2 after 24 h. The total free energy for Ser. marcescens followed the same trend as S. epidermidis, where an initial slight reduction was observed after 1 h (45.5 mJ/m2) but then a further reduction to 38.7 mJ/m2 was observed after 24 h. Finally, the basic energy did not have a significant change after 1 h, but after 24 h was significantly increased from 9.7 mJ/m2 to 32.2 mJ/m2.
Table 3.
Physicochemistry of the flat surface after applying 1 h or 24 h conditioning films of the bacteria alone, human plasma alone or a combination of bacteria and human plasma. Se denotes the bacteria Staphylococcus epidermidis and Sm denotes Serratia marcescens (n = 5). Statistical differences were considered below the p < 0.05 confidence level and are highlighted in grey with bold text.
In summary, the physicochemical results (Table 1, Table 2 and Table 3) demonstrated that on all the three surface types (rough, smooth and flat) that when the one and 24 h results were compared for all three conditioning films (human plasma, S. epidermidis and human plasma and Ser. marcescens and human plasma) that the Gibbs Free energy (ΔG) decreased in all instances with the exception of the Ser. marcescens and human plasma on the rough surface which became more hydrophobic after 24 h (−21.5 mJ/m2 to −4.3 mJ/m2). On the smooth and flat surfaces when the one and 24 h results were compared for all three conditioning films (human plasma, S. epidermidis and human plasma and Ser. marcescens and human plasma) were compared, the values for the γs, γlw, γs+, all the values decreased, but this was not evidenced on the rough surface, suggesting that the surface topography was having an effect on the physicochemical properties even in the presence of a conditioning film. The Ser. marcescens and human plasma results were generally different to those seen with the human plasma, S. epidermidis and human plasma conditioning films since γsAB and γs- values increased for all the surfaces between 1 and 24 h.
3.6. Conditioning Film MATH Assay
The effect of a human plasma CF on Ser. marcescens (Figure 5a) lowered the polar energy of the cells. Both the acid (chloroform) and basic (ethyl acetate) hydrocarbons demonstrated a reduction in the percent adherence after exposing the cells to the CF (from 42.2% to 21.9% for chloroform and from 48.3% to 33.9% for ethyl acetate), demonstrating that the ability for the cell to donate and accept electrons had been reduced, but was still within the moderate adhesion range (between 10% and 55%). The highly hydrophilic properties of Ser. marcescens did not change, with both non-polar hydrocarbons (decane and hexadecane) demonstrating almost no adherence (0.29% and 0.58% respectively).
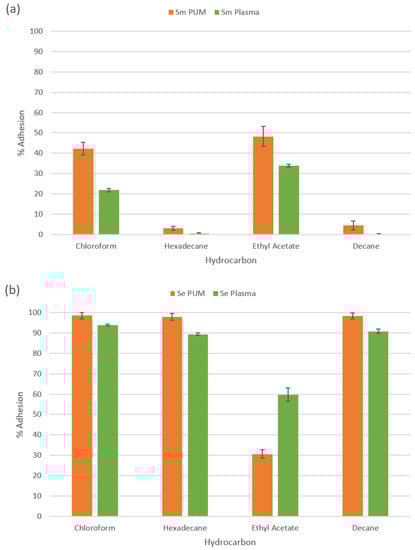
Figure 5.
MATH assay of (a) Ser. marcescens and (b) S. epidermidis with and without the presence of a human plasma conditioning film. (n = 3). Data presented as mean ± SE.
S. epidermidis (Figure 5b) demonstrated a reduced adherence to both non-polar (decane and hexadecane) hydrocarbons and the polar hydrocarbon chloroform (reductions from 98.2%, 95.8% and 98.4% to 90.8%, 89.2% and 93.8% for decane, hexadecane and chloroform respectively), but the reductions were a trend and were not significant. As this was still classed as high adhesion (>55%), whilst the cells may be slightly less hydrophobic the changes were unlikely to affect the hydrophobicity or the electron donating properties. However, a significant increase in the adherence of S. epidermidis to the basic hydrocarbons’ ethyl acetate (30.67% without and 59.74% with the CF) signified that the cells ability to accept electrons had increased significantly, especially as the cells were classed as moderately adhered without the CF (between 10% and 55%) but strongly adhered with the CF (>55%).
4. Discussion
It is known that under environmental conditions that surfaces will adsorb molecules from their surroundings, which can alter surface properties and hence bacterial retention. From the results it was apparent that the application of a CF can have significant effects on the surface properties of the three surfaces used in this study. When physical properties were tested, the human plasma CF appeared to have the most significant effect on the rough surface, with the SEM results demonstrating visible increases of material on the rough surface from 1 h to 24 h, likely caused by a continuous building up of molecules being adsorbed onto the surface and onto other molecules already adsorbed [12]. This was only apparent on the rough surface, as both the smooth and flat did not appear to demonstrate any significant differences between the time points. This is in agreement with work by Hadjesfandiari et al. (2016) who found that bacterial adhesion and biofilm formation were significantly higher on the rough surfaces of platelet bags compared to the smooth surfaces [24]. The effect likely appeared on the rough surface due to the pits within the surface which made it harder to wash away the excess CF and became filled with organic material. In support of this, it has been shown that surface roughness on the scale of bacterial size promotes their adhesion by increasing the contact area between the material and bacteria and by protecting the bacteria from shear forces [25]. This was supported by the optical surface profile data, which also demonstrated the most significant changes with the rough surface. The CF that had the greatest effect on the surface roughness was the human plasma CF, with both 1 h and 24 h incubations significantly reducing the roughness values. The reduction in roughness was likely to be caused by polymeric materials in the human plasma adsorbing and aggregating onto the surface. Further, it has previously been demonstrated that the addition of a CF can drastically reduce surface roughness of glass [12].
On the smooth surface, human plasma had no significant effect after 1 h, but after 24 h a reduction in surface roughness was observed. Whilst the smooth surface did not have the pits that were present on the rough surface, it still had a greater surface roughness than the flattened surface which could have been smoothed out by adsorption and aggregation of polymeric materials. Finally, on the flat surface a slight increase in roughness was observed after 1 h but this change was not sustained when assessing at 24 h. This could potentially be due to an uneven adsorption/aggregation of material onto the surface after 1 h, causing more irregularity in the surface features, but was smoothed out as more material was adsorbed/aggregated onto the surface. It may be suggested that these findings are due in part to the Vroman effect. Protein adsorption generally involves rapid monolayer adsorption with an almost flat orientation followed by a slow conformational and orientational rearrangement of previously adsorbed molecules known as the Vroman effect [26]. The adsorbed proteins can form different thicknesses (2–10,000 nm), which affects protein conformation, and this may affect the physicochemistry of what was determined on the surfaces. Many physical interactions at the surface interface influence both initial protein attachment and subsequent conformational rearrangement, as was demonstrated by the rough surfaces. In addition, the Ser. marcescens and human plasma demonstrated different physicochemical results than the human plasma, S. epidermidis and human plasma conditioning films, and it may be that the more hydrophilic nature of the Ser. marcescens demonstrated in the MATH assay contributed to the different physicochemical results observed. This is important since it would seem that both the physicochemical characteristics of the bacteria, the surface roughness and amount of time the conditioning film wss retained influenced the surface properties.
The most significant physical change observable for any of the CFs was the significant increase in cells present on all of the surfaces after a 24 h incubation of human plasma and Ser. marcescens under SEM. This demonstrated that the Ser. marcescens proliferated during the 24 h incubation period using nutrients present in the human plasma, as this same effect was not observed when Ser. marcescens was incubated without the addition of human plasma. Further, when the roughness was determined for the three surfaces under these conditions it was apparent that human plasma combined with Ser. marcescens demonstrated a reduction in surface roughness. However, both SEM and surface profile results demonstrated that S. epidermidis either was not capable of using the nutrients as efficiently as Ser. marcescens or that the human plasma was reducing the S. epidermidis proliferation. This may be due to the specific strain of S. epidermidis used being potentially sensitive to human plasma, whilst the strain of Ser. marcescens used likely was less sensitive and could therefore demonstrate plentiful growth and freely use the human plasma as a nutrient source. In agreement with this result, work by others has demonstrated that bacterial growth can be influenced by the presence of plasma and serum [27]. Further, bacteria preferentially adhere within gaps or pits on a surface due to protection from unfavourable environmental factors and an increase in contact area between the cell wall of the organism and the substrate [28,29]. Higher bacterial adhesion on rough surfaces can contribute to missed detection of bacterial strains that tend to adhere on surfaces, and this can affect the quality and safety of platelet storage bags by promoting more bacterial adhesion and biofilm formation on surfaces [24]. The growth of Ser. marcescens may have caused some pits to be filled in by a combination of bacterial cells, human plasma and products produced by the bacteria, such as extracellular polymeric substances (EPS). Overall, the effects of the conditioning films on the roughness of the surfaces demonstrated that the presence of material from the human plasma or from bacterial cells was able to fill in some of the gaps present on the rougher surface.
When differences in the effect of the CFs were determined chemically, the EDX analysis demonstrated some small but insignificant changes. This demonstrated that whilst other methods of analysis determined changes in the surface properties, the elemental makeup of the surfaces were not significantly altered. Overall, the small changes appeared to be a reduction in the detection of carbon and subsequent increases in the oxygen and chlorine detected for EDX.
The analysis of the surface chemistry via ATR-FTIR demonstrated that the addition of a CF resulted in new IR absorptions that were assignable to the proteins in the plasma and the organisms. The penetration depth of the evanescent wave into the sample was likely to be influenced by the differing refractive indices of the CF and the p-PVC substrate (the refractive index and thickness of the CF is also unknown). The latter is in addition to the usual relationship between the refractive indices of the sample and IRE, the wavelength of the IR radiation and the angle of incidence of the IR beam with the contact surface of the IRE (fixed at 45 degrees in the system used) thus making estimation of the absolute amounts of specific components in the spectrum difficult or impossible, though on a given sample at a given frequency, changes in the relative level of an adsorbed species can be observed and compared qualitatively. The minimum concentration of plasma and/or organism on the substrate required for detection by the IR method used is unknown. The most notable observations were related to the interaction of S. epidermidis and human plasma on to the pPVC substrates, in this case strong interactions between the plasma S. epidermidis may have hindered adsorption on to the substrate. Time dependance in forming these interactions explained the reduction in adsorption on the rough surface after 24 h. The effect of surface roughness affected the adsorption plasma, the rough surface showed notably high levels of adsorption. Adsorption of plasma also occurred rapidly with a near-limiting level being adsorbed after just one hour. Interaction of Ser. marcescens and human plasma with the pPVC substrates was shown to be time dependent with no adsorption being resolvable on to the smooth and flat surfaces and a small amount of adsorption onto the rough surface. The observations after 24 h confounded expectations somewhat in that the flat surface showed significantly higher levels of adsorption than the rough and smooth surfaces, though both the latter did show increases over the 24 h period. The time dependance of the adsorption processes was also observed in the physico chemical data. There was also broad correlation between the IR observations and changes in physicochemical characteristics. Total correlation, however, cannot be expected due to the physicochemical aspects being dependent on lower levels of adsorption than the limit of IR detection and the distribution of adsorbed species on the surface.
One of the biggest changes demonstrated due to the surfaces being conditioned was how the CFs influenced the physicochemical characteristics. The changes not only differed depending on what CF was applied to a surface but also upon the surface to which the CF was applied. However, whilst all the properties demonstrated changes, the most significant changes in physicochemistry occurred to the Gibbs Free energy and the Lewis base component of surface energy. The greatest change of those two components was in the Gibbs Free energy, which can be used to determine surface hydrophobicity. Whilst most of the surfaces demonstrated a negative Gibbs Free energy value, indicative of a hydrophobic surface, many demonstrated increases in this value when human plasma was used in the CF, with some CFs demonstrating increases great enough to become positive values. This indicated that whilst many of the surfaces remained hydrophobic, the magnitude of the hydrophobicity was reduced. Further, some of the surfaces demonstrating positive Gibbs Free energy values indicated that they had become hydrophilic, even if only weakly. Most of the surfaces that changed to display hydrophilic properties were the smooth surfaces, with or without bacteria, which had been conditioned on the surface for 24 h. The only other hydrophilic surface was the flat surface with human plasma and Ser. marcescens after 24 h.
The changes observed in the Lewis base component were also likely related to the effects of macromolecules adsorbed from the human plasma, as the significant changes in the Lewis base component went hand in hand with human plasma being conditioned onto them. An increase in Lewis base component indicated an increase in the negative charge present within a surface. This change was significant as all of the physicochemical factors can influence the attachment and adhesion of bacteria. Further, bacteria in solution are typically negatively charged and an increase in surface negative charge may create a repulsion effect which could reduce attachment [30].
The changes in the Gibbs Free energy and basic-energy demonstrated how an initial CF can significantly differ from a CF that has been allowed to develop over a longer period; both the amount or types of macromolecules adsorbed may increase and changes in their mode of adsorption; for example the density of packing may increase over time. The data obtained clearly showed that longer incubation times increased the amount of adsorbed macromolecules whilst increasing their adherence to the surfaces, which led to a greater influence on the physicochemistry of the surfaces, the latter effects have been previously demonstrated [12]. Overall, the CFs were capable of altering the physicochemical properties by increasing the hydrophilic property, especially human plasma due to the large variety of plasma factors present.
Finally, when MATH assays were performed using a human plasma CF, most of the levels of adherence to any of the hydrocarbons for either S. epidermidis or Ser. marcescens was reduced, with the exception of S. epidermidis to ethyl acetate. The varying reduction indicated that properties of the human plasma were interfering with the adherence of the bacteria to the hydrocarbons. In one study, it was found that platelet bags preconditioned with human plasma demonstrated a significant increase in bacterial adhesion by S. epidermidis [31]. This signified that the adherence capabilities of bacteria may be influenced by the presence of human plasma factors. Further, the only increase observed in the MATH assays of S. epidermidis to ethyl acetate may have been due to interaction with human plasma factors which led, in this instance, to an increase adherence. This indicated that the human plasma factors could increase or decrease different aspects of bacterial adherence, or the human plasma factors were binding to bacterial receptors and altering how they interact with their environment. This has previously been demonstrated using Staphylococcus aureus with bovine serum albumin, γ-globulins and serum with noted changes in adhesion of S. aureus after removal of its IgG binding protein observed [32]. As such, it is likely that the changes observed in the MATH assays were due to interactions between molecular/macro-molecular blood plasma components and the bacteria. This demonstrated that the human plasma was able to reduce overall adhesion of the bacteria to most of the hydrocarbons, indicating that the human plasma factors can play a role in altering physicochemical interactions and affecting bacterial adherence to a surface.
5. Conclusions
CFs can affect surface properties in a variety of ways depending on the original surface properties and the properties of the CF applied. It was apparent that when applied to a rougher surface CFs were capable of reducing surface roughness potentially by greater adsorption within surface features. It was also apparent that the adsorption of a CF was capable of masking certain surface chemistry features, as indicated via ATR-FTIR. CFs were also capable of altering the physicochemical properties by increasing the hydrophilic property, especially the human plasma CF, likely due to the large variety of plasma factors present. Finally, the human plasma was able to reduce overall adhesion of the bacteria to most of the hydrocarbons, indicating that the plasma factors can play a role in altering physicochemical interactions, thereby affecting bacterial adherence. Overall, the data demonstrate that when considering methods to reduce biofilm formation or considering novel strategies for improved detection of biofilm contamination in the blood transfusion setting, it is important to factor in the significant changes that human plasma-derived CF can make to surface features, and hence to the degree of bacterial attachment.
Author Contributions
Project administration, funding acquisition, and conceptualization, N.D.-H. and K.A.W.; methodology, validation, formal analysis, investigation, data curation, writing—original draft preparation, writing—review and editing, N.D.-H., J.W.-N., C.M.L. and K.A.W.; resources, visualization and supervision, N.D.-H., C.M.L. and K.A.W. All authors have read and agreed to the published version of the manuscript.
Funding
This work was undertaken by Manchester Metropolitan University and was funded by the Sir Halley Stewart Trust UK [300714]. The views expressed within this report are those of the authors and not necessarily those of the trust.
Data Availability Statement
The data from this study are readily available from the author.
Conflicts of Interest
The authors declare no conflict of interest.
References
- Blajchman, M.A.; Beckers, E.A.M.; Dickmeiss, E.; Lin, L.; Moore, G.; Muylle, L. Bacterial detection of platelets: Current problems and possible resolutions. Transfus. Med. Rev. 2005, 19, 259–272. [Google Scholar] [CrossRef] [PubMed]
- Greco, C.; Martincic, I.; Gusinjac, A.; Kalab, M.; Yang, A.F.; Ramírez-Arcos, S. Staphylococcus epidermidis forms biofilms under simulated platelet storage conditions. Transfusion 2007, 47, 1143–1153. [Google Scholar] [CrossRef] [PubMed]
- Greco-Stewart, V.S.; Brown, E.E.; Parr, C.; Kalab, M.; Jacobs, M.R.; Yomtovian, R.A.; Ramírez-Arcos, S.M. Serratia marcescens strains implicated in adverse transfusion reactions form biofilms in platelet concentrates and demonstrate reduced detection by automated culture. Vox Sang. 2012, 102, 212–220. [Google Scholar] [CrossRef] [PubMed]
- Martini, R.; Horner, R.; de Abreu Rodrigues, M.; Kempfer, C.B.; Tizotti, M.K.; Ratzlaff, V. Bacteriological analysis of platelets and cases of septic reactions associated with transfusion of contaminated samples. Transfus. Apher. Sci. 2012, 47, 313–318. [Google Scholar] [CrossRef] [PubMed]
- Levy, J.H.; Neal, M.D.; Herman, J.H. Bacterial contamination of platelets for transfusion: Strategies for prevention. Crit. Care 2018, 22, 1–8. [Google Scholar] [CrossRef]
- Wan, N.; Wang, H.; Ng, C.K.; Mukherjee, M.; Ren, D.; Cao, B.; Tang, Y.J. Bacterial Metabolism During Biofilm Growth Investigated by 13C Tracing. Front. Microbiol. 2018, 9, 2657. [Google Scholar] [CrossRef]
- Whitehead, K.A.; Verran, J. Formation, architecture and functionality of microbial biofilms in the food industry. Curr. Opin. Food Sci. 2015, 2, 84–91. [Google Scholar] [CrossRef]
- Loeb, G.I.; Neihof, R.A. Marine Conditioning Films. In Applied Chemistry at Protein Interfaces; Advances in Chemistry; American Chemical Society: Washington, DC, USA, 2009; Volume 145, pp. 319–335. [Google Scholar]
- Donlan, R.M. Biofilms: Microbial life on surfaces. Emerg. Infect. Dis. 2002, 8, 881–890. [Google Scholar] [CrossRef]
- Garrett, T.R.; Bhakoo, M.; Zhang, Z. Bacterial adhesion and biofilms on surfaces. Prog. Nat. Sci. 2008, 18, 1049–1056. [Google Scholar] [CrossRef]
- Greco-Stewart, V.S.; Ali, H.; Kumaran, D.; Kalab, M.; Rood, I.G.H.; de Korte, D.; Ramírez-Arcos, S. Biofilm formation by Staphylococcus capitis strains isolated from contaminated platelet concentrates. J. Med. Microbiol. 2013, 62, 1051–1059. [Google Scholar] [CrossRef]
- Lorite, G.S.; Rodrigues, C.M.; de Souza, A.A.; Kranz, C.; Mizaikoff, B.; Cotta, M.A. The role of conditioning film formation and surface chemical changes on Xylella fastidiosa adhesion and biofilm evolution. Colloid Interface Sci. 2011, 359, 289–295. [Google Scholar] [CrossRef] [PubMed]
- Busscher, H.J.; van der Mei, H.C. How do bacteria know they are on a surface and regulate their response to an adhering state? PLoS Pathog. 2012, 8, e1002440. [Google Scholar] [CrossRef] [PubMed]
- Slate, A.J.; Wickens, D.; Wilson-Nieuwenhuis, J.; Dempsey-Hibbert, N.; West, G.; Kelly, P.; Verran, J.; Banks, C.E.; Whitehead, K.A. The effects of blood conditioning films on the antimicrobial and retention properties of zirconium-nitride silver surfaces. Colloids Surf. B Biointerfaces 2019, 173, 303–311. [Google Scholar] [CrossRef] [PubMed]
- Cardile, A.P.; Sanchez, C.J.; Samberg, M.E.; Romano, D.R.; Hardy, S.K.; Wenke, J.C.; Murray, C.K.; Akers, K.S. Human plasma enhances the expression of Staphylococcal microbial surface components recognizing adhesive matrix molecules promoting biofilm formation and increases antimicrobial tolerance In Vitro. BMC Res. Notes 2014, 7, 457. [Google Scholar] [CrossRef] [PubMed]
- She, P.; Chen, L.; Qi, Y.; Xu, H.; Liu, Y.; Wang, Y.; Luo, Z.; Wu, Y. Effects of human serum and apo-Transferrin on Staphylococcus epidermidis RP62A biofilm formation. Microbiol. Open 2016, 5, 957. [Google Scholar] [CrossRef] [PubMed]
- Linnes, J.C.; Mikhova, K.; Bryers, J.D. Adhesion of Staphylococcus epidermidis to biomaterials is inhibited by fibronectin and albumin. J. Biomed. Mater. Res. A 2012, 100, 1990–1997. [Google Scholar] [CrossRef]
- Becker, K.; Heilmann, C.; Peters, G. Coagulase negative Staphylococci. Clin. Microbiol. Rev. 2014, 27, 870–926. [Google Scholar] [CrossRef]
- Widerström, M.; Wiström, J.; Sjöstedt, A.; Monsen, T. Coagulase-negative staphylococci: Update on the molecular epidemiology and clinical presentation, with a focus on Staphylococcus epidermidis and Staphylococcus saprophyticus. Eur. J. Clin. Microbiol. Infect. Dis. 2012, 31, 7–20. [Google Scholar] [CrossRef]
- Kim, S.B.; Jeon, Y.D.; Kim, J.H.; Kim, J.K.; Ann, H.W.; Choi, H.; Kim, M.H.; Song, J.E.; Ahn, J.Y.; Jeong, S.J.; et al. Risk factors for mortality in patients with Serratia marcescens bacteremia. Med. J. 2015, 56, 348–354. [Google Scholar]
- Védy, D.; Robert, D.; Gasparini, D.; Canellini, G.; Waldvogel, S.; Tissot, J.D. Bacterial contamination of platelet concentrates: Pathogen detection and inactivation methods. Hematol. Rev. 2009, 1, e5. [Google Scholar] [CrossRef]
- Van Oss, C.J.; Giese, R.F. The hydrophilicity and hydrophobicity of clay minerals. Clays Clay Miner. 1995, 43, 474–477. [Google Scholar] [CrossRef]
- Wilson-Nieuwenhuis, J.S.T.; Dempsey-Hibbert, N.; Liauw, C.M.; Whitehead, K.A. Surface modification of platelet concentrate bags to reduce biofilm formation and transfusion sepsis. Colloids Surf. B Biointerfaces 2017, 160, 126–135. [Google Scholar] [CrossRef] [PubMed]
- Hadjesfandiari, N.; Schubert, P.; Toosi, S.F.; Chen, Z.; Culibrk, B.; Ramirez-Arcos, S.; Devine, D.V.; Brooks, D.E. Effect of texture of platelet bags on bacterial and platelet adhesion. Transfusion 2016, 56, 2808–2818. [Google Scholar] [CrossRef]
- Hsu, L.C.; Fang, J.; Borca-Tasciuc, D.A.; Worobo, R.W.; Moraru, C.I. Effect of micro and nanoscale topography on the adhesion of bacterial cells to solid surfaces. Appl. Environ. Microbiol. 2013, 79, 2703–2712. [Google Scholar] [CrossRef] [PubMed]
- Anand, G.; Sharma, S.; Dutta, A.K.; Kumar, S.K.; Belfort, G. Conformational transitions of adsorbed proteins on surfaces of varying polarity. Langmuir 2010, 26, 10803–10811. [Google Scholar] [CrossRef]
- Ramírez-Arcos, S.; Jenkins, C.; Dion, J.; Bernier, F.; Delage, G.; Goldman, M. Canadian experience with detection of bacterial contamination in apheresis platelets. Transfusion 2007, 47, 421–429. [Google Scholar] [CrossRef] [PubMed]
- Whitehead, K.A.; Colligon, J.; Verran, J. Retention of microbial cells in substratum surface features of micrometer and sub-micrometer dimensions. Colloids Surf. B Biointerfaces 2005, 41, 129–138. [Google Scholar] [CrossRef]
- Lorenzetti, M.; Dogša, I.; Stošicki, T.; Stopar, D.; Kalin, M.; Kobe, S.; Novak, S. The influence of surface modification on bacterial adhesion to titanium-based substrates. ACS Appl. Mater. Interfaces 2015, 7, 1644–1651. [Google Scholar] [CrossRef]
- Katsikogianni, M.; Missirlis, Y.F. Concise review of mechanisms of bacterial adhesion to biomaterials and of techniques used in estimating bacteria-material interactions. Eur. Cells Mater. 2004, 7, 37–57. [Google Scholar] [CrossRef]
- Loza-Correa, M.; Kalab, M.; Yi, Q.-L.; Eltringham-Smith, L.J.; Sheffield, W.P.; Ramirez-Arcos, S. Comparison of bacterial attachment to platelet bags with and without preconditioning with plasma. Vox Sang. 2017, 112, 401–407. [Google Scholar] [CrossRef]
- Schuster, S.; Yu, W.; Nega, M.; Chu, Y.-Y.; Zorn, S.; Zhang, F.; Götz, F.; Schreiber, F. The role of serum proteins in Staphylococcus aureus adhesion to ethylene glycol coated surfaces. Int. J. Med. Microbiol. 2014, 304, 949–957. [Google Scholar] [CrossRef] [PubMed]
Publisher’s Note: MDPI stays neutral with regard to jurisdictional claims in published maps and institutional affiliations. |
© 2022 by the authors. Licensee MDPI, Basel, Switzerland. This article is an open access article distributed under the terms and conditions of the Creative Commons Attribution (CC BY) license (https://creativecommons.org/licenses/by/4.0/).