Abstract
The Richards equation has high plasticity and compatibility. Compared with other curve equations, it has higher applicability and accuracy in describing S-shaped curves. It can describe the changes in the initial growth stage, rapid growth stage, and stable growth stage of organisms well and reflect the slow-fast-slow change characteristics of growth. In this paper, the Richards model is introduced into the settlement deformation prediction of loess-filled foundation. Taking a high-loess fill site in northern Shaanxi Province as an example, continuous settlement deformation monitoring is carried out for the filling during the project operation period, and the settlement characteristics of a loess-filled foundation are studied using the monitoring results. It is considered that the settlement deformation curve of a loess-filled foundation has similar characteristics; that is, its deformation increases slowly in the early stage, rapidly in the middle stage, and is basically stable at a fixed value in the later stage. Its cumulative deformation time history curve is a smooth S-shaped curve, and the cumulative settlement increases with time and tends to converge. Analysis shows that the time history curves of cumulative settlement, the settlement deformation rate, and the acceleration of loess foundation filling are highly consistent with the Richards model. Compared with the modified exponential model and hyperbolic model, the predicted results are closer to the measured results; that is, the Richards growth model can be used to predict the settlement deformation of a fill foundation.
1. Introduction
In light of the immature theory of unsaturated soil and insufficient understanding of the nature of unsaturated soil high fills, it is common to see accidents caused by instability of high fills or a short project life caused by differential settlement. Therefore, the research on the deformation law of unsaturated soil high-fill foundations and their reasonable prediction and control have always been key issues to be solved [1]. At the same time, due to the complexity and variability of the geotechnical materials, deformation prediction of the foundation is not accurate [2]. More accurate prediction of the foundation’s deformation is one of the main tasks to be solved in the future for geotechnical engineering [3].
In order to solve the defect that the analytical calculation and numerical calculation based on the classical theory cannot accurately predict soil deformation, a regression analysis method based on a large amount of engineering experience and deformation observation data is particularly important. The mathematical models commonly used for regression analysis of foundation settlement are as follows: the hyperbolic method, exponential curve method, three-point method, parabola method, Poisson curve method, Xinye method, Asaok method, Gompertz curve method, Verhulst curve method, etc. [4,5,6,7]. In recent years, grey theory, artificial neural networks, and other methods have also been introduced. A large number of scholars have widely applied, compared, improved, and optimized these methods [8,9,10] and introduced more prediction model applications such as the ant colony algorithm, Felhaas model method, and logistic model method [11,12,13,14,15,16].
The Richards equation was proposed by Richards in 1959 on the basis of the Bertalanffy equation [17]. This equation is a four-parameter nonlinear equation which is a generalized form of other growth models, such as the Mitsucherlich equation, Bertalanffy equation, Gompertz equation, and logistic equation, and has higher applicability and accuracy for describing the growth of S-shaped curves [18]. The Richards equation is widely used to establish the growth models of animals and plants. In recent years, many scholars have introduced this model in the settlement prediction of road subgrades, the surface settlement prediction of mining areas, and the deformation prediction of a tunnel’s surrounding rock [19,20,21,22].
The settlement deformation characteristics of an unsaturated fill foundation and their effective prediction and control have always been key problems puzzling scholars, and some relevant research has been carried out [23,24,25]. This paper takes a high-fill loess site in the loess gully area of northern Shaanxi as an example. During the construction and operation period, continuous deformation monitoring was carried out for the fill foundation. Based on a large amount of valuable measured data obtained from 731 days (40 periods) of monitoring, the surface settlement deformation characteristics of a loess-filled foundation are studied. According to the characteristics of its settlement deformation time history curve, the Richards growth model is introduced in the settlement prediction of the loess-filled foundation with the method of regression analysis. The model is compared with the commonly used modified exponential model and hyperbolic model, proving the superiority of the Richards model. The research results will help to solve the problem of prediction and control of the settlement of fill foundations in similar projects and have certain reference and practical value.
2. Richards Model
Richards (1959) proposed the general differential form of the Bertalanffy equation as follows:
The authors of [26,27] gave the general solution to Equation (1) under the conditions of initial values of t = t0 and v = v0 as follows:
Here, A, B, K, and m are the parameters to be estimated, where A is the limit value of biological growth, B is a parameter related to the initial conditions of biological growth, K = γ (1 − m) is a parameter describing the growth rate, and m is the shape parameter of the curve.
Because of the introduction of the shape parameter m, the Richards equation has strong plasticity and a strong description ability for S curves with various deformations. According to Equation (2), we can find the different forms of the Richards equation under different m values, as shown in Table 1.

Table 1.
Compatibility of Richards equation.
In this study, the cumulative deformation of a fill foundation at time t is defined as S(t), the average deformation rate is v(t), and the acceleration is a(t). When the Richards model is used to describe the deformation of a fill foundation, Equation (2) can be rewritten as follows:
We calculate the first derivative and the second derivative of S(t) with respect to time t to obtain the expressions of the deformation rate and acceleration, as shown in Equations (4) and (5), respectively:
In combination with the characteristics of the Richards equation and foundation deformation, the possibility of using this model to describe the deformation of a fill foundation is explained below.
- (1)
- Monotonic increasing characteristic
The Richards model curve is an asymmetric S-shaped curve. It can be seen from Equation (4) that v(t) = dS(t)/dt > 0, indicating that S(t) is a monotone increasing function about t; that is, under the action of additional load, the settlement deformation of a foundation continuously increases with time, and its settlement deformation rate is always positive.
- (2)
- Asymptote
It can be seen from Equations (3)–(5) that S(∞) = a, v(0) = 0, and a(∞) = 0. This shows that with the gradual completion of the consolidation of the fill foundation, the final settlement of the foundation converges to a certain value, and the settlement deformation rate and acceleration converge to zero.
- (3)
- Inflection point
From Equation (5), let a(t) = 0 to find the inflection point of the Richards model curve (, ), where v(t) reaches the maximum value v(τ) = vmax, a(τ) = 0. When t∈(0, τ), v(t): v(0)→vmax, a(t): a(0) → + amax → 0, and when t∈(τ,∞), v(t):vmax → v(∞) = 0, and a(t):0 → −amax → 0. This curve reflects the characteristics that the surface settlement deformation of the fill foundation increases slowly in the early stage, rapidly in the middle stage, and slowly in the later stage while tending to be stable under the additional construction load.
- (4)
- Meet the consolidation conditions
According to the definition of the degree of consolidation of the foundation, we have
According to Equation (6), U(0) = 0, U(∞) = 1. Thus, when t∈(0, ∞), 0 < U(t) < 1. This means that the Richards model meets the consolidation conditions.
3. Overview of the Research Project and Monitoring Plan
The project was located in the loess hilly and gully area in northern Shaanxi. The original terrain of the site is undulating, having the shape of three ridges with two ditches. The maximum relative elevation difference is about 190.0 m, and scarps with heights of 20.0–40.0 m are distributed in local sections of the site. The landform of the site is shown in Figure 1. The original stratum of the site is mainly loess, and the bedrock at the bottom and side walls of the local gullies is exposed. There is seasonal flow in the original gully, which is the main discharge channel of groundwater and surface water.
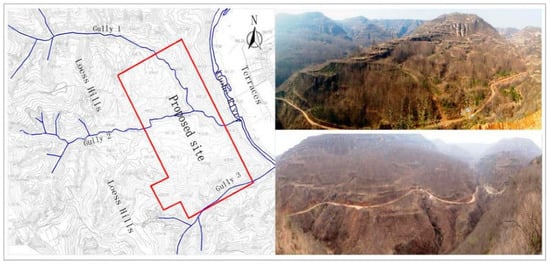
Figure 1.
Landform of the project site.
The filling body was divided into eight layers and filled by dynamic compaction. The first layer was a gravel blind ditch, and the tamping energy was 8000 kN.m. The filling material above the blind ditch was loess, and the maximum thickness of the filling was about 60 m. The filling construction was divided into seven layers, and the tamping energy was 4000~12,000 kN.m. The plan for layered dynamic compaction filling is shown in Figure 2, and the typical section of the filling body is shown in Figure 3, while the basic physical properties of each layer of filling are shown in Table 2.
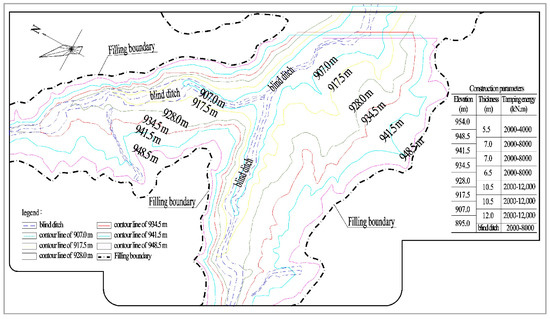
Figure 2.
Plan of the layered filling.
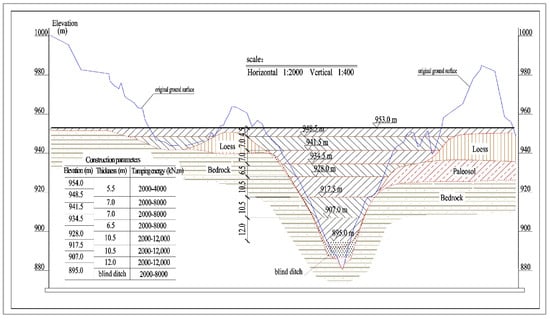
Figure 3.
Typical section of the filling body.
Table 2.
Physical and mechanical properties of the filling.
It can be seen from Table 2 that the physical and mechanical property indexes of each layer of filling under different tamping energy conditions had little difference. After compaction, each layer of filling was in a hard plastic state, and the soil was dense.
The construction of the filling body began in March 2012, and the blind ditch construction was completed in June 2012. Layered dynamic compaction filling started in September 2012 and was basically completed in December 2013. After that, continuous post-construction deformation monitoring was carried out, and the construction of the upper buildings began after the deformation became stable. The construction work was basically completed (and buildings started to operate) in April 2018, and the deformation monitoring during the project operation period was carried out at the same time.
In order to study the deformation characteristics of the loess-filled foundation, 64 surface displacement monitoring points were arranged in this study, including 25 in the fill area and 39 in the excavation area. The layout plan of the monitoring points is shown in Figure 4. The monitoring point is the observation pier with a forced centering device, and the specification of the mark stone was 120 cm × 20 cm × 20 cm. The vertical displacement datum network was arranged in the form of a node network. The datum points were buried in the undisturbed soil layer outside the construction area. The surface vertical displacement monitoring points formed a closed or attached line with the nearby vertical displacement datum points. A Tianbao DiNi digital level was used for observation. Deformation monitoring started on 15 April 2018 and ended on 15 April 2020, with a total of 731 days in 40 phases.
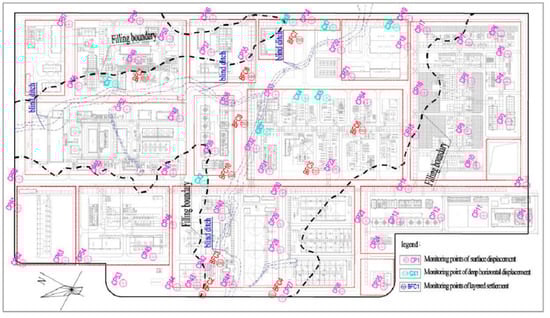
Figure 4.
Layout plan of monitoring points.
4. Basic Characteristics of Settlement Deformation of Loess-Filled Foundation
In order to study the settlement deformation characteristics of the fill foundation, the monitoring results of 25 settlement deformation monitoring points located in the fill area were used. The basic information of each monitoring point and their final monitoring results are shown in Table 3 and Figure 5, Figure 6 and Figure 7, respectively.
Table 3.
List of settlement monitoring results.
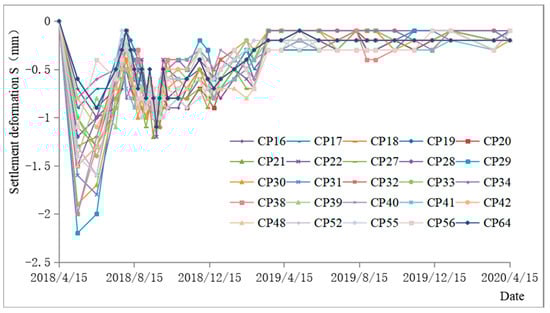
Figure 5.
Time history curve of settlement in each phase.
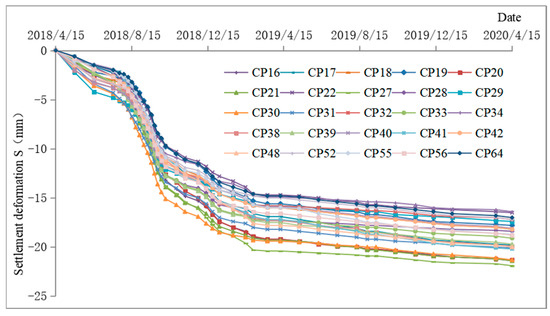
Figure 6.
Time history curve of cumulative settlement.
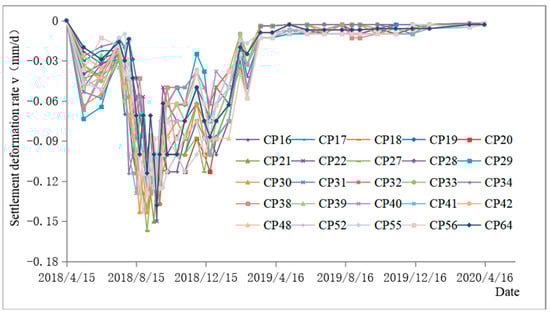
Figure 7.
Scatter plot of settlement deformation rate and time.
It can be seen from Table 3 and Figure 5, Figure 6 and Figure 7 that the settlement deformation of the thick, compacted loess foundation had the following characteristics:
- (1)
- The vertical deformation of the ground surface showed settlement deformation without rebound deformation;
- (2)
- In the early stage of monitoring, the deformation of each stage had a large vibration, and in the later stage, it gradually decreased and tended to be stable;
- (3)
- The cumulative deformation curve of each monitoring point basically presented a smooth curve, and the curve increased with time and tended to converge;
- (4)
- The deformation rate of each monitoring point in each phase had large dispersion in the early monitoring period, and the deformation rate had a trend of increasing over time and gradually decreasing and converging to zero with time in the later monitoring period.
5. Application of the Richards Model
It can be seen from Figure 6 and Figure 7 that the characteristics of the cumulative settlement deformation time history curve of each monitoring point were basically similar, and the settlement deformation rate also showed an obvious trend, that being that the settlement deformation had the basic characteristics of slow growth in the early stage, rapid growth in the middle stage, and basically being stable at a fixed value in the later stage. It reflects the characteristics of foundation settlement with the addition of additional load.
According to the previous analysis, the Richards growth model has the characteristics of slow-fast-slow change. The initial value is small and gradually increases with time before finally stabilizing at a saturation value. The curve characteristics were highly consistent with the time history curve of surface settlement deformation of the fill foundation.
The monitoring points CP20 and CP38 in this study were representative because they were located at the bottom of the gully at the original site, with a large filling thickness and continuous and complete monitoring data. The monitoring data were selected to draw the cumulative settlement deformation and time scatter plot, as shown in Figure 8. We used the monitoring results of these two monitoring points to estimate the parameters of Equation (3). The results are shown in Table 4 and Figure 8.
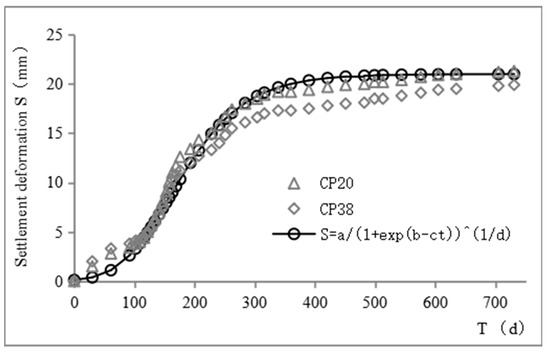
Figure 8.
Regression time history curve of cumulative settlement.
Table 4.
Parameter estimation results.
Using the monitoring results of 25 monitoring points located in the filling area in this study, the average settlement deformation rate of each phase was calculated. A scatter plot of the settling rate over time is shown in Figure 9. We also drew a settlement deformation acceleration time scatter plot, shown in Figure 10.
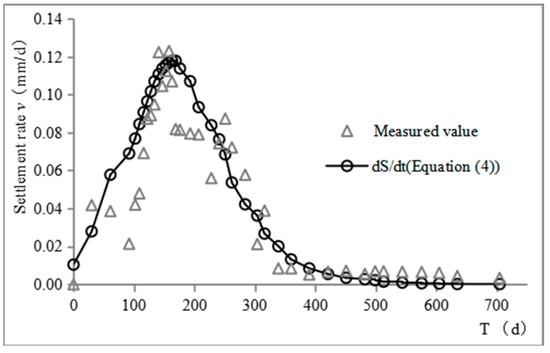
Figure 9.
Scatter diagram of settlement rate and time.
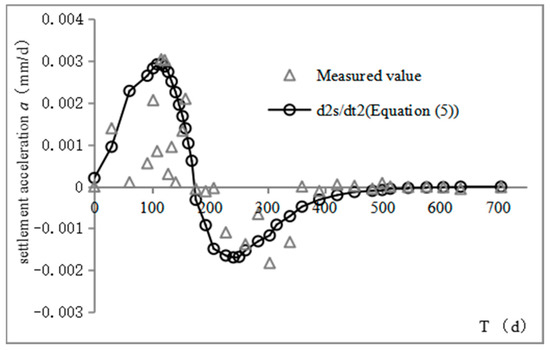
Figure 10.
Scatter diagram of settlement acceleration and time.
It can be seen from Figure 8, Figure 9 and Figure 10 that the time history curves of the measured cumulative settlement, settlement deformation rate, and acceleration were highly consistent with the Richards model curve. The Richards growth model can be used to describe the time history characteristics of the settlement deformation of a loess-filled foundation and predict its settlement deformation.
6. Comparative Analysis
The Richards model, modified exponential model, and hyperbolic model were used to predict the settlement of the typical monitoring point CP20 in this study, and the predicted value was compared with the measured value. The comparison results are shown in Table 5 and Figure 11 and Figure 12. The parameters involved in each prediction model in the calculation were determined by regression analysis based on the monitoring data.
Table 5.
Comparison of prediction results of different models.
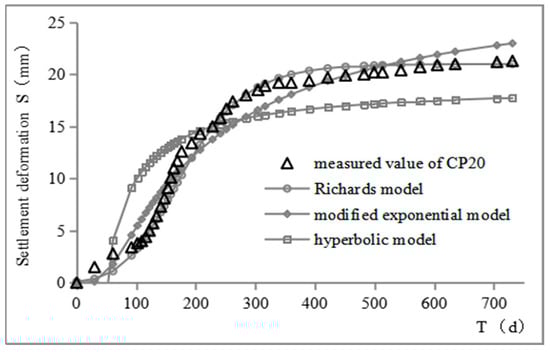
Figure 11.
Comparison chart of forecast results of different models.
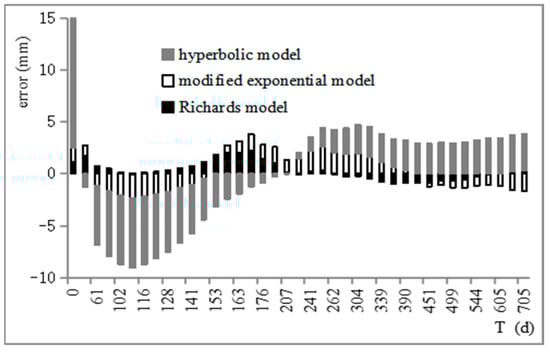
Figure 12.
Stacked histogram of prediction errors of different models.
It can be seen from Table 5 and Figure 11 and Figure 12 that, compared with the modified exponential model and hyperbolic model, the predicted values of the Richards model were more consistent with the measured results, and the standard error was only 0.87. Its curve was S-shaped, which is very consistent with the measured settlement time history curve, and it can reflect the development law of settlement deformation of a fill foundation well.
7. Discussion
Based on the deformation monitoring results, this paper discussed the settlement deformation characteristics of a loess-filled foundation. It was considered that the vertical deformation of a loess-filled foundation was settlement deformation without rebound deformation. Its settlement deformation had the basic characteristics of slow growth in the early stage, rapid growth in the middle stage, and basically being stable at a fixed value in the later stage. The cumulative deformation time history curve was a smooth S-shaped curve, and the cumulative settlement increased over time and tended to converge. The deformation rate increased over time in the early stage and decreased over time after reaching the extreme value, eventually converging to zero.
The Richards model was introduced into the settlement deformation prediction of a loess-filled foundation, and it was considered that the time history curve of accumulated settlement, the settlement deformation rate, and the acceleration of loess foundation filling had a high degree of agreement with the Richards model. Compared with the commonly used modified exponential model and hyperbolic model, the Richards model had higher prediction accuracy and stronger applicability. The research in this paper is not comprehensive enough, and we can focus on the following aspects in future research:
- (1)
- This paper studied the settlement deformation characteristics of a loess-filled foundation and the application of the Richards model in its settlement prediction. The study did not involve other types of unsaturated soil fill foundation. In future research, we can carry out a comparative study on related issues.
- (2)
- There are many factors that affect the settlement characteristics of an unsaturated soil fill foundation, such as the thickness of the fill, the original terrain of the site, the mechanical properties of the fill, the load, and the role of water. This paper did not launch an in-depth discussion on this. The influence of these factors on the settlement of a fill foundation is worthy of further study.
- (3)
- Research shows that the effects caused by the water level may modify the vertical pressures on the soil layers and change the physical and mechanical properties of the soil, as observed and discussed in [28,29,30,31]. The authors of [32] showed that the shear mechanisms and the consequent permanent deformations inside the soil are driven by the presence of water. This article did not discuss the relevant mechanism, which is worth further study.
8. Conclusions
In this paper, taking a loess high-fill site in the loess gully area of northern Shaanxi as an example, continuous and long-term settlement monitoring of its foundation was carried out. According to the monitoring results, the settlement characteristics of the loess-filled foundation were studied, and the Richards growth model was introduced into its settlement prediction, aiming to find a suitable method for prediction and control of the settlement of the loess-filled foundation. The results show that the cumulative settlement time history curve of the loess-filled foundation was a smooth S-shaped curve which had the characteristics of slow growth in the early stage, rapid growth in the middle stage, and basically being stable at a fixed value in the later stage. This feature can be described well by the Richards equation. The calculation and comparative analysis show that the Richards model has strong advantages in the settlement prediction of loess-filled foundations. In future research, we should focus on the application of this model in the settlement prediction of other types of foundation soil and discuss the factors affecting foundation settlement, especially the role of water.
Author Contributions
Conceptualization, W.F.; Data curation, L.L.; Formal analysis, Z.Z.; Project administration, H.Z.; Resources, Z.X.; Writing – original draft, Y.Y. All authors have read and agreed to the published version of the manuscript.
Funding
This research received no external funding.
Conflicts of Interest
The authors declare no conflict of interest.
References
- Xu, M.; Song, E.-X. Review of long-term settling of high fills. J. Tsinghua Univ. (Sci. Technol.) 2009, 49, 770–773. (In Chinese) [Google Scholar]
- Yang, G. New computation method for soil foundation settlements. Chin. J. Rock Mech. Eng. 2008, 27, 679–686. (In Chinese) [Google Scholar]
- Yang, G. On the Development of Geotechnical Mechanics and Engineering. Guangdong Water Resour. Hydropower 2000, 6, 15–17. [Google Scholar]
- Tan, S.-A.; Chew, S.-H. Comparison of the hyperbolic and Asaoka observational method of monitoring consolidation with vertical drains. Soils Found. 1996, 36, 31–42. [Google Scholar] [CrossRef]
- Asaoka, A. Observational procedure of settlement prediction. Soils Found. 1978, 18, 87–101. [Google Scholar] [CrossRef]
- Yu, C.; Liu, S. A study on prediction of embankment settlement with the gompertz model. Rock Soil Mech. 2005, 26, 82–86. [Google Scholar]
- Song, Y.-H.; Nie, D.-X. Verhulst mode for predicting foundation settlement. Rock Soil Mech. 2003, 24, 123–126. [Google Scholar]
- Zheng, J.; Wang, T.; Zhang, J. Study of settlement prediction methods of loess subgrade. Rock Soil Mech. 2010, 1, 321–326. [Google Scholar]
- Zheng, Y.; Wang, S.; Zhang, T. Study on multi-layer recursive time series model for settlement prediction. J. Zhejiang Univ. (Eng. Sci.) 2005, 39, 983–986. [Google Scholar]
- Wei, Y.; Liu, Y. Grey System Theoretical Method for Settlement of High Embankment. Technol. Highw. Transp. 2004, 4, 5–7+12. [Google Scholar]
- Tu, X.; Wang, Z.; Liang, Z.; Li, Y. Study on application of modified Weibull model to settlement prediction of foundation. Rock Soil Mech. 2005, 26, 621–623+628. [Google Scholar]
- Wei, K.; Gong, Q.; Zhou, S. Ant Colony Algorithms of Long-term Uneven Settlement Prediction in Tunnel. J. TongJi Univ. (Nat. Sci.) 2009, 37, 993–999. [Google Scholar]
- Yin, L.; Wang, X.; Zhang, L. Settlement prediction of embankment on soft clay ground by using Verhulst curve. J. Changan Univ. (Nat. Sci. Ed.) 2009, 2, 19–24. [Google Scholar]
- Zhu, Z.; Zhou, L. Application of Logistic model in settlement prediction during complete process of embankment construction. Chin. J. Geotech. Eng. 2009, 31, 965–970. [Google Scholar]
- Jiang, J.; Gao, G. Forecasting Tunnel Vault-Growth Settlement with a Ynshi Four Parameter Model. J. China Univ. Min. Technol. 2009, 5, 670–675. [Google Scholar]
- Qiao, J.; Zhang, Y.; Xie, X. Genetic programming Approach to Predicting the Maximum Surface Settlement by Shield Tunneling. J. Tianjin Univ. 2009, 9, 790–796. [Google Scholar]
- Richards, F.J. A Flexible Growth Function for Empirical Use. J. Exp. Bot. 1959, 10, 290–300. [Google Scholar] [CrossRef]
- Xing, L.; Sun, M.; Wang, Y. Richards Growth Model of Living-Organism. J. Biomath. 1998, 13, 348–353. [Google Scholar]
- Zhao, X. Application of Richards Model to Fundation Settlement Prediction. J. Guizhou Univ. (Nat. Sci.) 2011, 3, 103–106. [Google Scholar]
- Xiao, Z.; Chen, C. Settlement prediction of soft clay roadbed based on Richards model. J. Highw. Transp. Res. Dev. 2008, 11, 29–32. [Google Scholar]
- Wang, Z.; Deng, K. Richards model of surface dynamic subsidence prediction in mining area. Rock Soil Mech. 2011, 32, 1664–1668. [Google Scholar]
- Wang, J. Richards Model for Surrounding Rock Deformation Prediction and Deformation Development Trend Analysis. Highw. Eng. 2014, 3, 145–148. [Google Scholar]
- Yang, Y.; Fan, W.; Xu, Z.; Zhang, H.; Zhao, Z. Study on Post-construction Deformation Characteristics of Thick Compacted Loess Site. China Civ. Eng. J. 2022. [Google Scholar] [CrossRef]
- Zhu, C.; Li, N. Ranking of influence factors and control technologies for the post-construction settlement of loess high-filling embankments. Comput. Geotech. 2019, 118, 3320. [Google Scholar] [CrossRef]
- Zhang, H.; Zeng, R.; Yang, Y. Subsidence monitoring and influencing factor analysis of mountain excavation and valley infilling on the Chinese Loess Plateau: A case study of Yan’an New District. Eng. Geol. 2021, 297, 6482. [Google Scholar] [CrossRef]
- Pienaar, L.V.; Turnbull, K.J. The Chapman—Richards Generalization of Von BertalanffyS Growth Model for Basal Area Growth and Yield in Even—Aged Stands. For. Sci. 1973, 19, 2–22. [Google Scholar]
- Liu, Z.; Li, F. The Generalized Chapman—Richards Function and Applications to Tree and Stand Growth. J. For. Res. 2003, 14, 19–26. [Google Scholar]
- Wang, C.Y.; Dreger, D.S.; Wang, C.H.; Mayeri, D.; Berryman, J.G. Field relations among coseismic ground motion, water level change and liquefaction for the 1999 Chi-Chi (Mw 7.5) earthquake, Taiwan. Geophys. Res. Lett. 2003, 30. [Google Scholar] [CrossRef]
- Charlie, W.A.; Doehring, D.O. Groundwater table mounding, pore pressure, and liquefaction induced by explosions: Energy-distance relations. Rev. Geophys. 2007, 45. [Google Scholar] [CrossRef]
- Nishiwaki, K.; Yasuhara, K.; Komine, H.; Murakami, S. Displacement and countermeasures for existing structure with rising groundwater levels. In Proceedings of the 8th Japan National Symposium on Environmental Geotechnology, Shanghai, China, 2–5 June 2009; pp. 381–384. [Google Scholar]
- Yasuda, S.; Ishikawa, K. Effect of lowering the ground water table as the countermeasure against liquefaction-induced damage to houses. J. Jpn. Assoc. Earthq. Eng. 2015, 15, 205–219. [Google Scholar]
- Forcellini, D. The role of the water level in the assessment of Seismic Vulnerability for the 23 November 1980 Irpinia Basilicata Earthquake. Geosciences 2020, 10, 229. [Google Scholar] [CrossRef]
Publisher’s Note: MDPI stays neutral with regard to jurisdictional claims in published maps and institutional affiliations. |
© 2022 by the authors. Licensee MDPI, Basel, Switzerland. This article is an open access article distributed under the terms and conditions of the Creative Commons Attribution (CC BY) license (https://creativecommons.org/licenses/by/4.0/).