Article

A Joint Dispatch Operation Method of Hydropower and Photovoltaic: Based on the Two-Stage Hedging Model

1
State Key Laboratory of Operation and Control of Renewable Energy & Storage Systems, China Electric Power Research Institute, Beijing 100089, China
2
School of Electrical Engineering, Xi’an University of Technology, Xi’an 710054, China
*
Author to whom correspondence should be addressed.
Appl. Sci. 2022, 12(22), 11348; https://doi.org/10.3390/app122211348
Submission received: 8 October 2022 / Revised: 28 October 2022 / Accepted: 3 November 2022 / Published: 8 November 2022

Abstract

:
The randomness and volatility of large-scale clean energy output represented by wind power and photovoltaic lead to difficulties in grid connection. The problems of abandoned wind, light, and water become increasingly prominent. The adjustment capacity of traditional thermal power is limited and it is difficult to ensure the consumption of high proportion clean energy. On this basis, the marginal benefit hedging rule in economics is introduced into the hydropower and photovoltaic joint operation system in this paper. A two-stage spatio-temporal hedging strategy is designed to solve the spatio-temporal conflict problem in the hydropower and photovoltaic joint system. The multi-objective joint dispatching model of hydropower and photovoltaic system considering system benefits, risks, and stability is established, which can be solved by a MOEA/D-GABS algorithm with selection strategy. The joint system scheduling schemes under different schemes are analyzed by case. The results demonstrate that, compared with the traditional multi-objective decision-making scheme, the flood control risk in each period of the reservoir in the proposed method is controlled to be no more than 1.63 × 10⁻³ (the flood control standard corresponding to the 50-year flood control risk is 0.006); the flood limit water level of the reservoir is increased from 583.00 m to 583.70 m, which improves the benefit of the reservoir; and the water utilization rate is effectively improved. On the other hand, compared with the traditional scheme, the proposed method reduces the peak valley difference of the combined system by 50.67% and 59.68% in typical sunny and cloudy scenarios, respectively, which greatly reduces the uncertainty of photovoltaic output, and the stability of the combined system is improved. It is shown that the proposed method can be used to guide the economic dispatch of a complementary system with hydropower as the regulating energy.

1. Introduction

Limited by light resources’ features and natural conditions, photovoltaic power generation has strong volatility and randomness, and the problem of large-scale photovoltaic consumption remains to be solved. Hydropower has the advantages of rapid adjustment and storage of hydropower. Promoting hydropower and new energy jointly to improve the absorption capacity of new energy is one of the more feasible methods at present [1].
With the grid connection of large-scale centralized and distributed photovoltaic power sources, the joint dispatch of hydropower and photovoltaic power becomes particularly important. Power prediction and optimal dispatch in the process of joint operation are hot research directions of current scholars [2]. The combined operation system controls the photovoltaic active power through the regulation and storage function of the reservoir and the rapid regulation ability of the hydraulic unit, so as to achieve the smooth output curve of the combined system, increase the power quality of the photovoltaic power generation, and finally improve the absorption capacity so as to achieve the purpose of increasing the energy utilization ratio of the combined system [3]. Many well-known universities in the world, such as Colorado State University and the University of Massachusetts, have long conducted research in the field of “wind power–photovoltaic” complementary power generation system. G Migoni et al. studied a multi-energy complementary system using the genetic algorithm and obtained the global optimal solution [4]. Getnet et al. used HOMER software to study the off-grid hybrid power supply system in a village in Ethiopia [5]. Alexandre et al. studied the theoretical performance limit of water light complementary power plants by calculating the time complementarity index of hydropower generation and photovoltaic power generation [6]. In China, although the joint development of hydropower and photovoltaic began relatively late, it has developed rapidly in recent years under the promotion of China’s energy policy. In 2011, a water-light complementary power station in Yushu City, Qinghai Province, was completed and put into operation, raising the PV capacity of China’s Water Optic Complementary Power Station from the initial small capacity distributed PV to MW level centralized power station [7]. Subsequently, the Longyang Gorge Hydro PV Complementary Power Station achieved an installed capacity of 850 MW, which is actually the largest hydro photovoltaic complementary system. The operation of the Longyang Gorge Hydro PV Complementary Power Station has led Chinese scholars to study hydro PV complementation. At present, China has built several “multi-energy complementary demonstration projects” and achieved good results.
The joint operation process of hydropower and photovoltaic is a typical multi-variable, multi-objective, and complex scheduling problem, which involves a conflict of interest between hydropower and photovoltaic, among others. Most of the traditional hydropower and photovoltaic power joint operation models aim at minimizing the photovoltaic abandon volume or maximizing the benefit of the joint operation, ignoring the uncertainty of photovoltaic power prediction, resulting in a large deviation between the operation results and the actual situation. So far, researchers have made great progress in photovoltaic power randomness, including photovoltaic power prediction [8,9,10], random description [11,12], and so on. On this basis, cascade hydropower units are introduced into photovoltaic power and hydropower joint dispatch to provide standby peak shaving for photovoltaic turbines [13,14,15] and a stochastic optimization model considering risk constraints is established [16,17], which can improve the influence of photovoltaic power randomness on the stable operation of the power system. The existing hydropower and photovoltaic power dispatching models mainly focus on how to improve the utilization capacity of photovoltaic power, but rarely pay attention to the conflict between interests and risks in the combined hydropower system, resulting in poor performance of the dispatching scheme.
Hedging in economics refers to deliberately reducing the risk of another investment. It is a means of making profits in investment while reducing business risk. Generally, hedging refers to carrying out two kinds of transactions with relevance, different optimization directions, equal quantity, and equal increase and decrease at the same time. In the late 1940s, Masse [18] first applied the hedging rule to the reservoir scheduling problem based on the time preference of reservoir storage and economic principles. He studied the reservoir scheduling problem based on the economic concept of marginal value of storage, and constructed the hedging theory of reservoirs. That is, the idea of storing some water in a reservoir in case of a significant loss of water scarcity in the future, by losing some of its current benefits. The key point of the reservoir hedging rule is to determine when to carry out the scheme of water supply and quantity limitation. Most of the current research is carried out from two aspects: numerical simulation and theoretical analysis. Most of the initial studies used numerical optimization methods [19] to integrate hedging rules into complex reservoir scheduling and took the minimum water shortage index as the goal, and used optimization algorithms to find the optimal rules. In recent years, according to the principle of marginal benefit in economics, many scholars theoretically studied the starting point, ending point, and hedging component of hedging, and obtained the quantitative analytical expression of hedging rules. You [20] and Cai [21] et al. substituted the uncertainty of reservoir inflow into the analysis of future marginal benefits and formulated the reservoir operation scheme from two dimensions of numerical quantification and theoretical derivation. Zhao [22] applied the concept of hedging to reservoir flood control operation. The key of hedging for flood control operation is to adjust the final storage capacity of the period based on the forecast information and uncertainty in the future to balance the present and future risks, so as to minimize the risk of flood control. The interest hedging between flood control and power generation of reservoirs [23], the interest hedging between flood control and water supply [24], the interest hedging between multiple reservoirs, the interest hedging between multiple objectives of reservoir operation, the interest hedging considering historical decisions, and the optimization of hedging rules [25] are the focus of current scholars, which has built a theoretical basis for the research on multi-objective and multi interest conflicts of cascade reservoirs.
The above related studies show that most of the initial studies on hydropower and photovoltaic joint scheduling focus on the establishment and solution of the scheduling model. With the deepening of the research, the multi-objective optimization algorithm is gradually maturing. However, the optimal scheduling problem of joint systems is a very complex scheduling problem. Firstly, the “dimensionality disaster” problem has not been effectively solved at present and there is no general solution method for joint scheduling [26]. Secondly, with the continuous improvement in the installed scale of new energy such as photovoltaic, the requirements for comprehensive benefits of hydropower stations in reservoirs are increasing and the conflicts of interests of various stakeholders are becoming more and more obvious. Therefore, it is necessary to introduce new theories and methods to study the multi-objective joint regulation of hydropower and photovoltaic from the practical point of view, so as to provide an effective decision-making scheme for the optimal dispatching of the power system and reduce the gap between theoretical research and actual dispatching.
Therefore, hedging theory is applied to the hydropower and photovoltaic joint scheduling problem in this paper. Considering the reservoir profit benefit, flood control risk, and output stability of the combined hydropower and photovoltaic system as the objectives, the daily optimal dispatching model of hydropower and photovoltaic is constructed, in order to allow better multi-objective decision-making in the combined hydropower and photovoltaic dispatching. The structure of this paper is as follows. The second section briefly introduces the theoretical methods, including the application of hedging rules in the joint scheduling and the analysis of the two-stage decision-making process, and establishes the hydropower and photovoltaic power joint scheduling model and solution method based on the hedging theory. Section 3 establishes the improved solution. method, Section 4 verifies the model with application examples, and Section 5 presents the conclusion.

2. Methods

2.1. Application of Hedging in Energy Utilization

Hedging refers to specially reducing the risks that may be brought about by other investments. It is a way to reduce risks and achieve the most benefit possible. In the 1940s, Masse first combined the hedge theory with the reservoir dispatching problem, and put forward a method to preserve some water in the reservoir in order to alleviate the shortage of water in the reservoir in the future [18]. Hedging rules are mainly divided into two categories: regional and continuous hedging rules [27]. Regional hedging divides the available resources into several regions and selects a certain limit proportion for each region [28,29]. The meaning of continuous hedging is that the decision variable limit proportion changes continuously with the available amount [30,31]. Figure 1 shows the application of hedging regulation in reservoir operation.
In the above figure, SOP is the standard operation rule for the reservoir; this rule is to give priority to water supply on demand in the current period. When the existing water is insufficient, all water supply in this period is given priority. During the dry season, the SOP rules meet the current water demand, but greatly increase the risk of water shortage in future periods. In this context, the hedging rule (HR) is introduced into the scheduling during the dry season. When the reservoir is in the dry period, the water supply to the reservoir in the current period is reduced, part of the water is stored, and the shortage of water in the next period is alleviated. In the figure, the area surrounded by the HR line and the X-axis of available water is the feasible dispatch interval. Therefore, the most critical issue of hedging regulation is the determination of the HR dispatch curve. Firstly, the form of hedging should be determined, generally including two-point hedging and three-point hedging, among others. Secondly, the objective function should be selected. In general, the current water supply and the maximum benefit of water supply in the remaining period (two-stage water supply, time-scale model) can be taken as the objective, and multiple constraints can be considered to establish the objective function, or multiple objectives can be considered at the same time, and a multi-objective algorithm can be used to solve the problem, so as to obtain the final hedging regulation for actual scheduling.

2.2. Analysis of Hedging Relationship in Hydropower and Photovoltaic Combined Operation

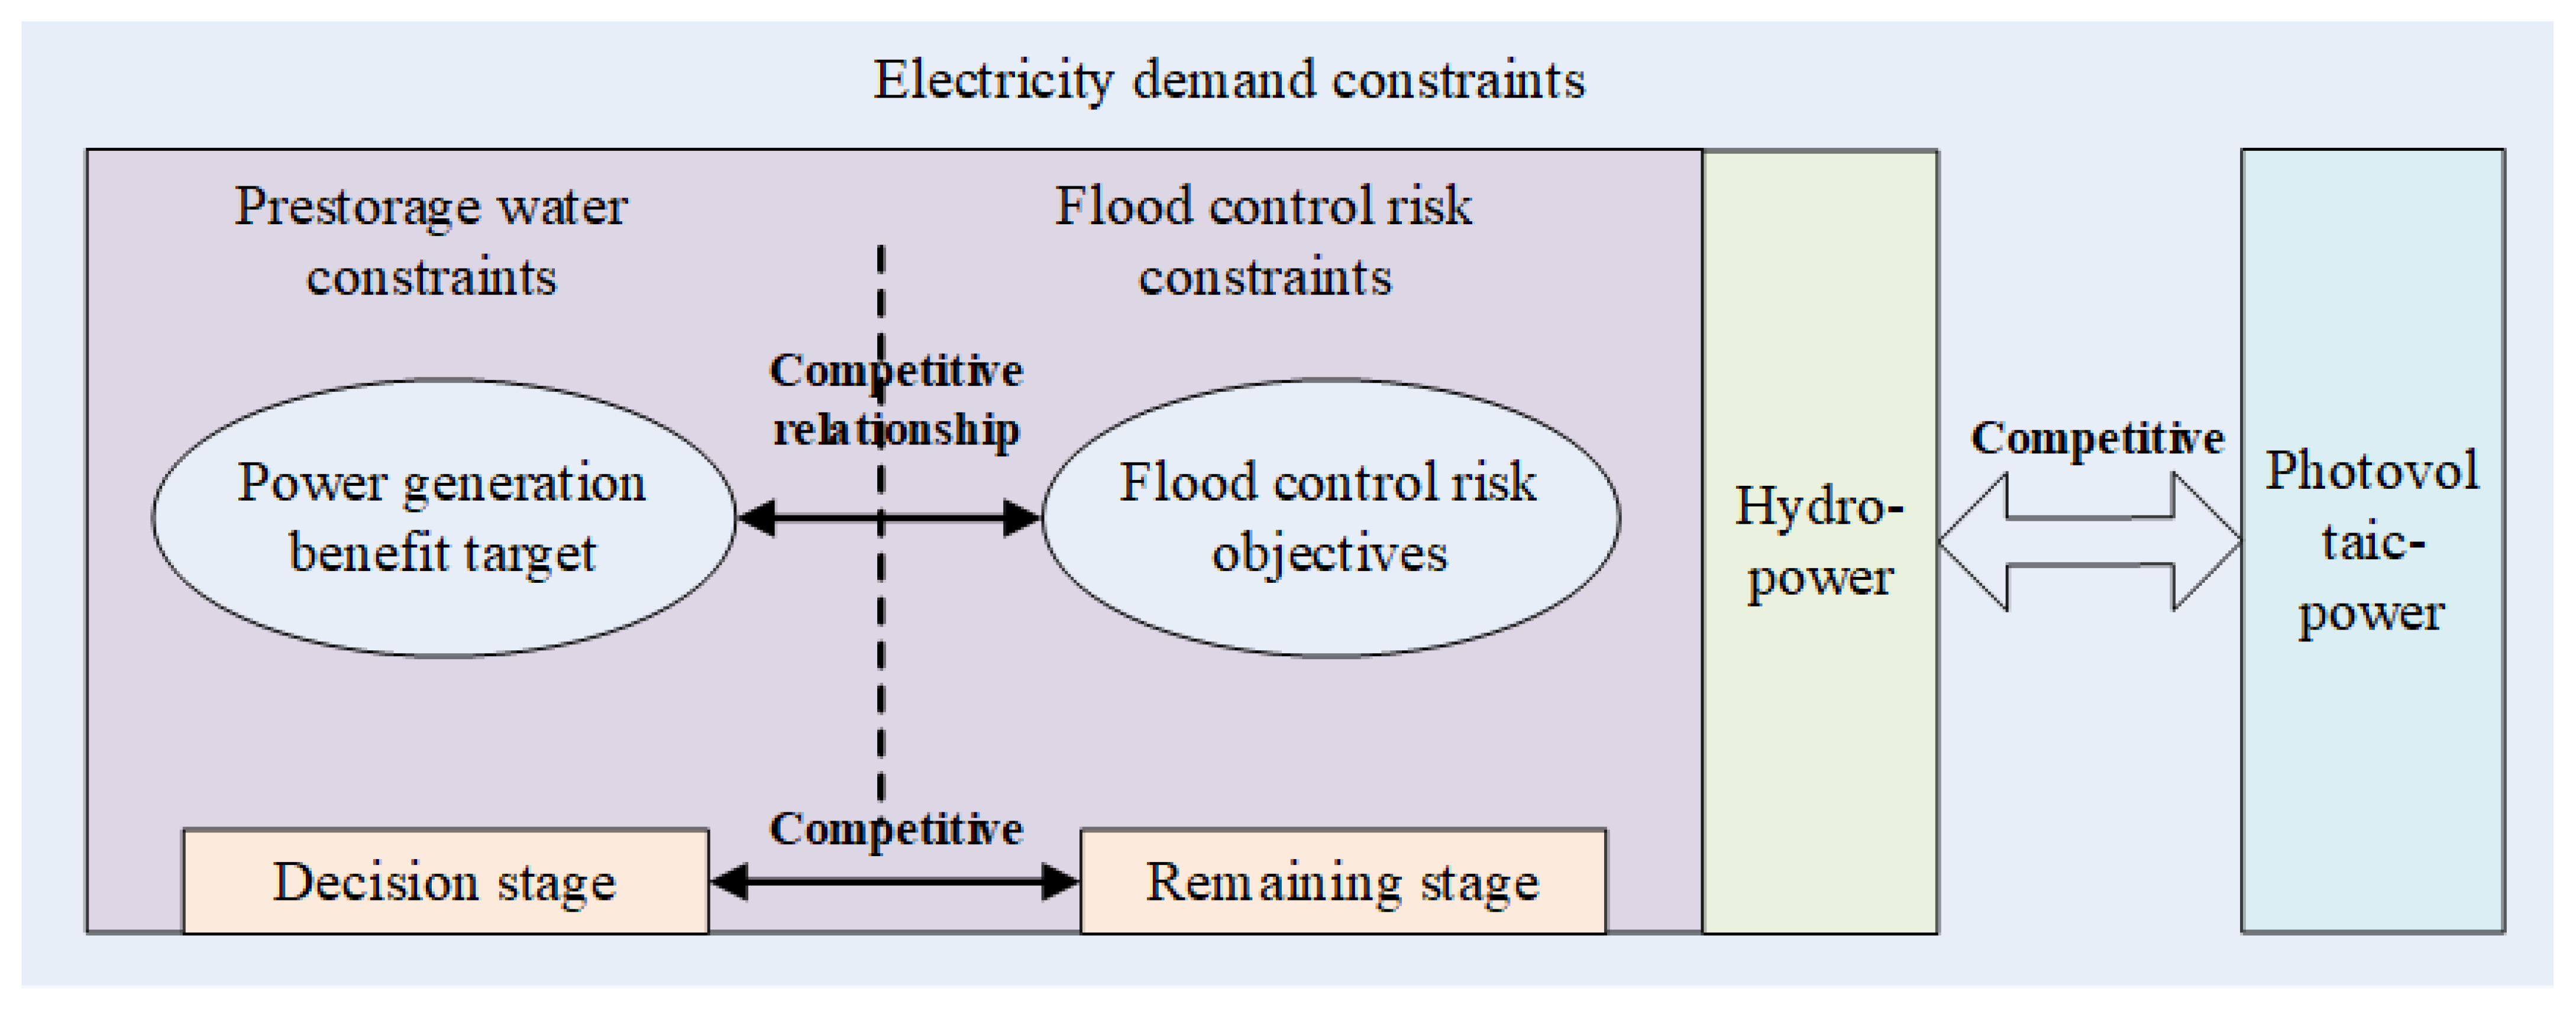
The hydropower photovoltaic joint scheduling problem can be described as follows: in the reservoir of water balance and the premise of flood safety, the power system in the short term (within days or more) of electricity power balance, hydropower and photovoltaic of online distribution, water and electricity for photovoltaic power compensation ability, hydro and photovoltaic joint power load ability, and so on needs to be studied and solved. Considering the water storage period, the hydropower and photovoltaic joint operation should not only ensure the peak regulation and power generation demand of the combined system, but also consider the flood control risk of the reservoir and its upstream and downstream. This is a typical multi-objective conflict problem, such as the conflict between hydropower and photovoltaic power station power generation benefits, the conflict between hydropower ownership departments and water use departments, and the conflict between upstream and downstream hydropower goals. From the perspective of time, there is a conflict between the current storage efficiency goal and the flood control risk goal in the future. Figure 2 shows the multi-objective conflict relation diagram in the joint dispatching of hydropower and photovoltaic.
The hydropower and photovoltaic joint scheduling problem is a complex multi-objective conflict problem, which is analyzed using the hedging mechanism. According to the inflow runoff data, combined with the PV output forecast data, the rapid regulation ability of a hydropower station is used to maximize the profit benefit of the reservoir on the basis of ensuring the safety of flood control. If the inflow runoff in the future period is relatively small, the power generation efficiency of the combined system can also be increased. On the contrary, if there is a large incoming flow forecast in the future, the reservoir capacity can be adjusted by pre-discharge dispatching in the effective forecast period under the condition of guaranteeing the basic planned electricity. If the inflow runoff in the future period is relatively small, the power generation efficiency of the combined system can also be increased. On the contrary, if there is a large incoming flow forecast in the future, the reservoir capacity can be adjusted by pre-discharge dispatching in the effective forecast period under the condition of guaranteeing the basic planned electricity. If the pre-storage is less, the corresponding flood control risk is reduced. However, the hydropower station may not be able to meet the power generation plan issued by the power department because of its low power generation, which brings the risk of power shortage to the power system. Therefore, for the combined hydropower and photovoltaic system, in the decision-making stage, the reservoir should not only reserve enough water storage space to meet the flood control risk demand, but also take into account the maximization of resource utilization and power generation benefits.

2.3. Dynamic Decision-Making Process of Hydropower and Photovoltaic Joint Operation Based on Hedge Theory

In actual dispatching, it is necessary to coordinate multi-objective demands such as reservoir pre-storage benefit, flood control risk, and photovoltaic consumption, according to the inflow runoff, photovoltaic output, and load predicted in the face of the time period, and formulate the dispatching plan for the current period and, in the next period, formulate the decision value for this period again according to the latest forecast data. The actual scheduling is the process of combining the forecast information of the current period and the future period to carry out the rolling forecast and decision in turn.
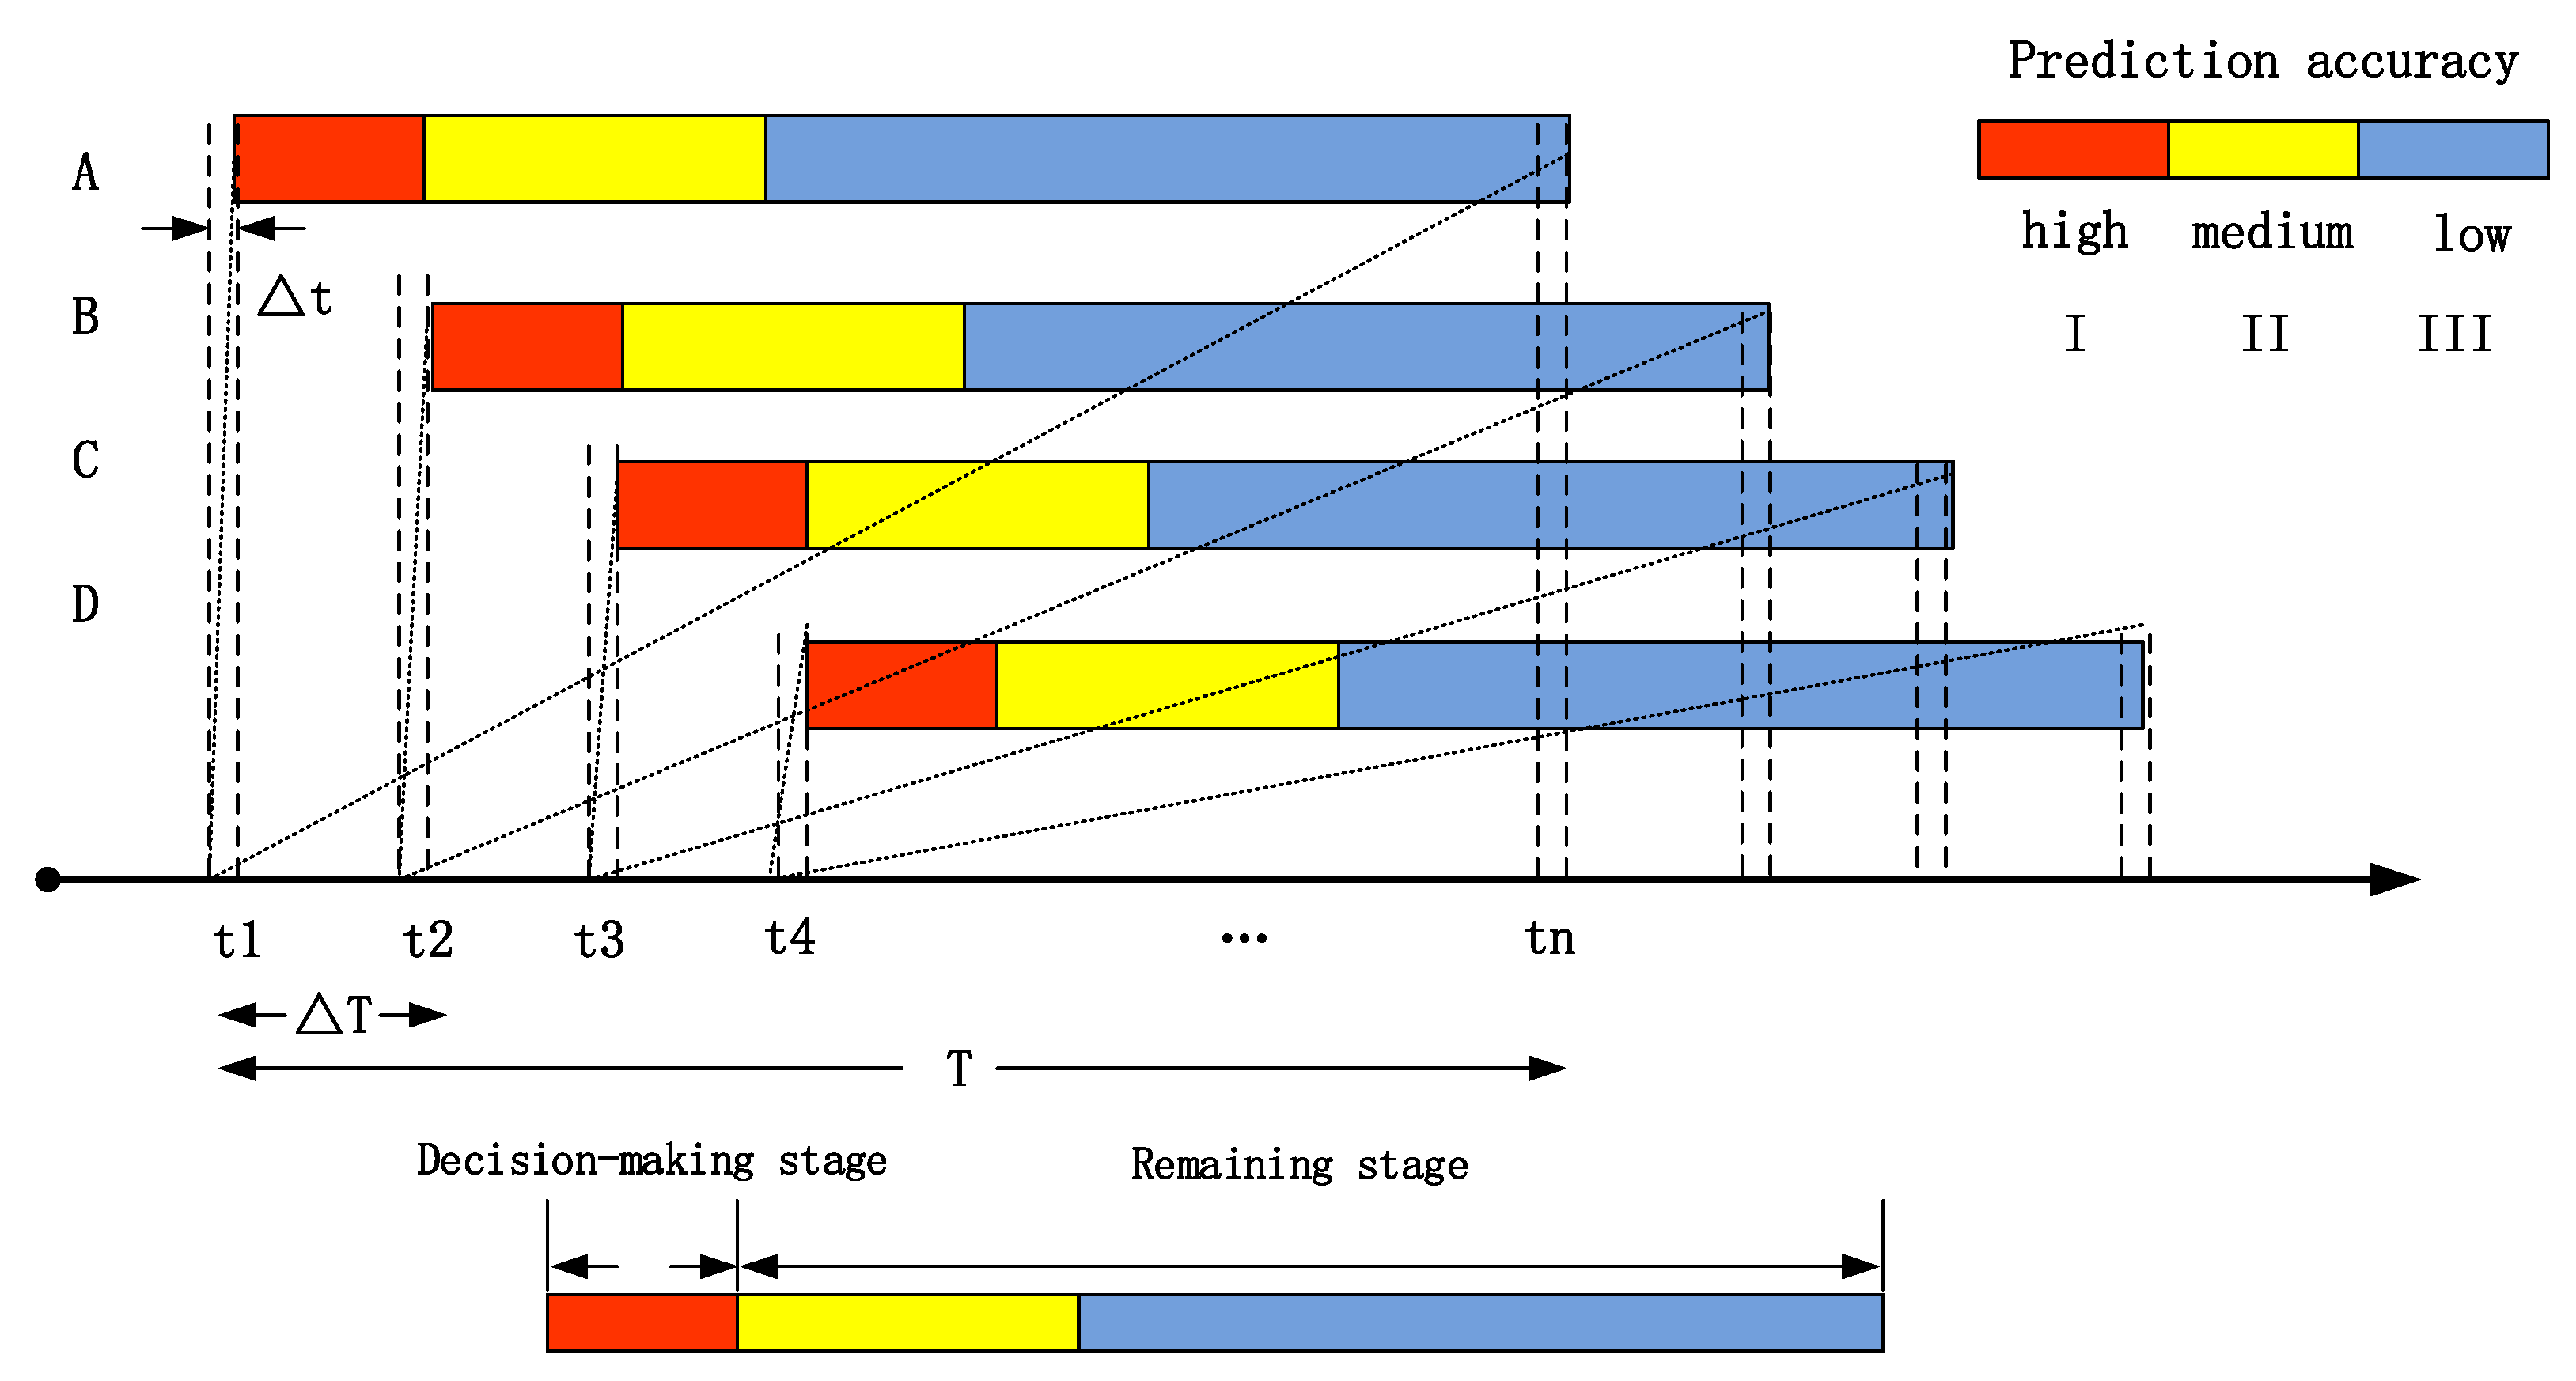
The prediction errors of warehouse incoming flow and photovoltaic power increase with the increase in forecast lead time. Combined with the scheduling rolling period, the scheduling spacing is divided into three segments, which are represented by red, yellow, and blue, respectively. The red section I is the nearest interval between prediction points. At this stage, the error of hydropower and photovoltaic predicted output is the smallest and the dispatching plan needs more accurate results. The interval prediction point of blue section III is the farthest and the prediction error is the largest. Certain errors are allowed in the scheduling scheme. Yellow section II is required to be in between. Figure 3 shows the rolling update mechanism of the hydropower and photovoltaic joint power generation scheduling model, in which the plan is made within Δ t time before the plan is executed, the scheduling plan with T time scale is made each time, and the rolling period of the scheduling plan is Δ T . In time period, the PV output data of runoff information with time scale T is obtained and the dispatching plan of time period t 1 t n is drawn up. At the same time, the plan will be issued, starting from time t 1 and ending at time. In this process, the data information is updated at time period t 2 Δ t to run the scheduling plan again.
Therefore, in each timescale T, segment I is the time period that will eventually be implemented, and segments II and III can provide useful information in the development of the program. At the same time in the actual scheduling, the long-term scale scheduling pressure is relieved and the difficulty of scheduling is reduced. Therefore, section I is the decision horizon, which contains one scheduling rolling period Δ T (usually 30 min, 1 h, 3 h, and so on), and section II and III are the forecast horizon, which contains n−1 scheduling rolling period Δ T .

2.4. Two-Stage Risk–Benefit Hedging Calculation Considering Forecast Uncertainty

In the normal operation of the reservoir, as long as the initial water level of the reservoir does not exceed the flood limit water level, the flood control safety of the reservoir itself and the upstream and downstream protected objects in the planning and design can be guaranteed without increasing the flood control risk. Therefore, the two-stage risk–benefit calculation method caused by forecast uncertainty should be considered in the joint operation of hydropower and photovoltaic.
The hedging mechanism of hydropower and photovoltaic joint power generation is mainly reflected in the hedging variables, that is, the complex multi-objective conflict is processed and processed and the hedging relationship is generalized to form a mathematical expression, which provides a basis for the establishment of the hedging model. Taking a two-stage hydropower station and a photovoltaic electric field as an illustration, we illustrate the two-stage hedging dispatching mechanism of the multi-objective of hydropower and photovoltaic. The decision-making process and relevant conventions are shown in Figure 4 and Table 1 for the decision-making variable conventions of combined hydropower and photovoltaic power generation.

2.5. Combination Forecasting Model Based on VMD-ARMA-DBN Hedging Mechanism Design for Hydropower and Photovoltaic Joint Dispatch

2.5.1. Initial Determination of VMD Mode Calculation of Profit and Benefit of Reservoir Pre-Storage Operation

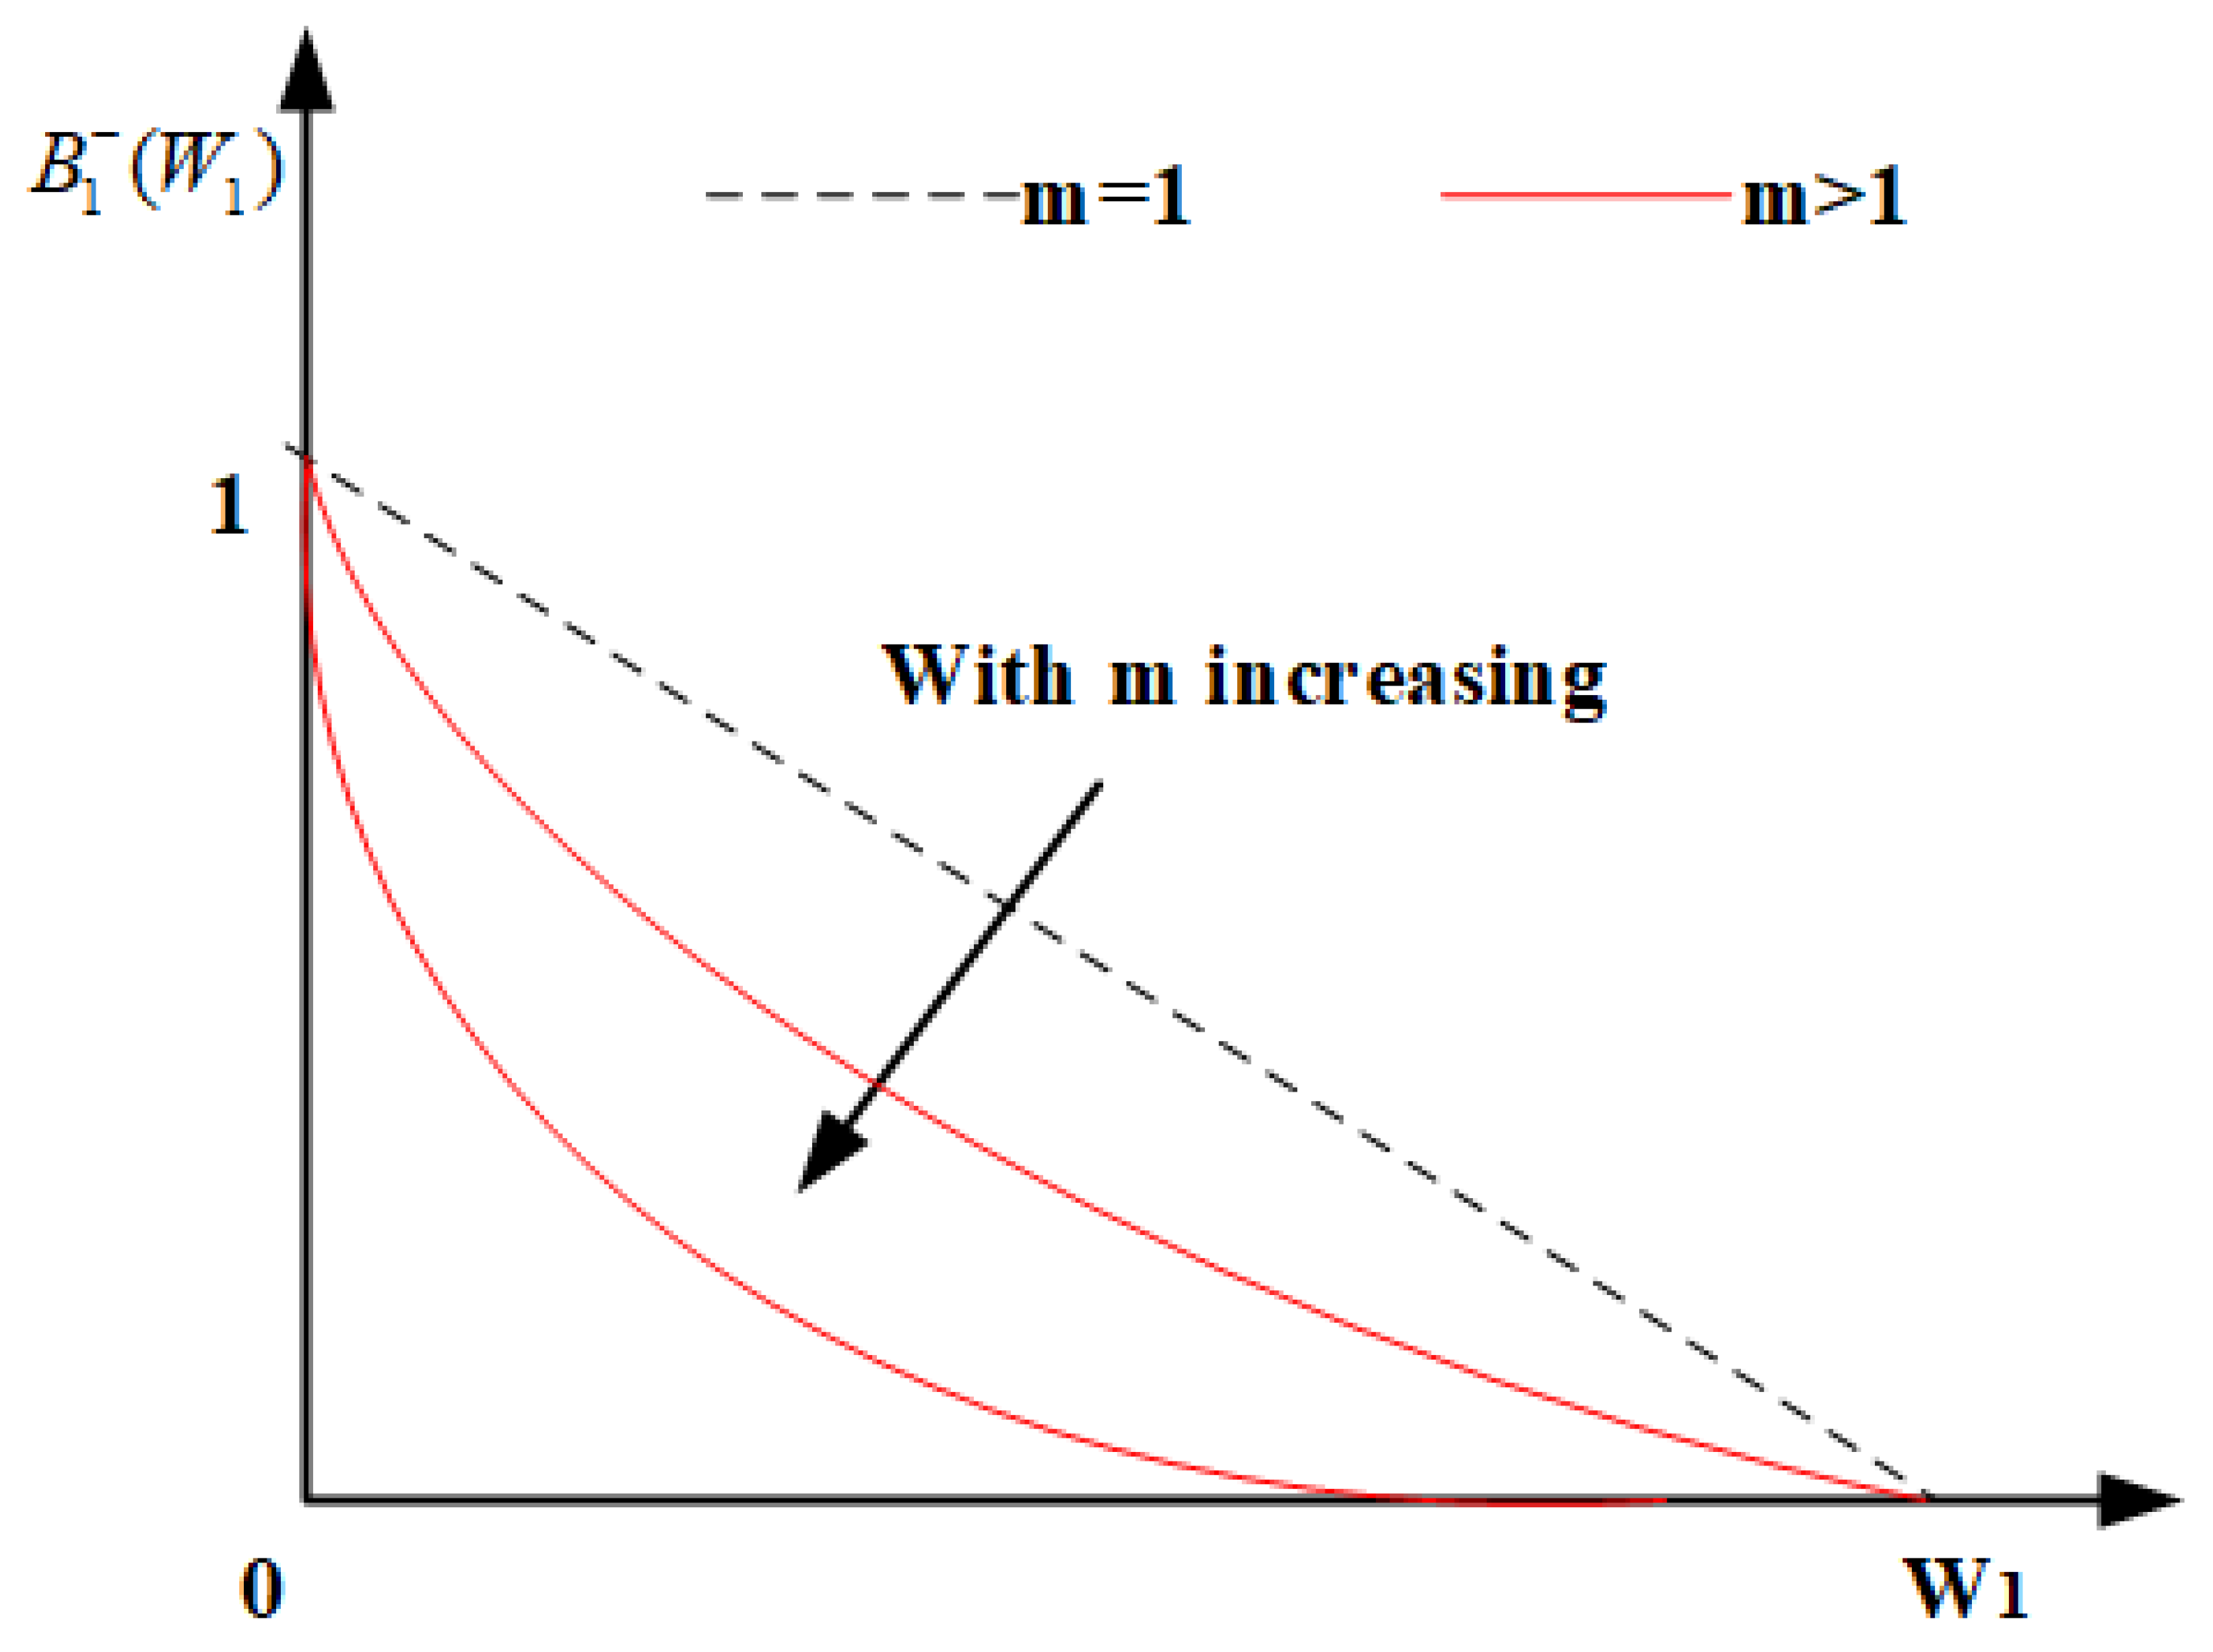
The advantages and disadvantages of the reservoir’s profit goal are expressed by the benefit added value B = 0 ; the larger the value, the better the profit and benefit. The benefit added value B + is determined by the size of the pre-storage water W and there is a direct proportional relationship between them. In order to facilitate the solution of the model, it is transformed into the benefit difference B ; the smaller the value, the better the benefit. At the same time, it is negatively correlated with the pre-storage water W. The normalized calculation formula of the benefit difference B is as follows:
B = 1 W W N m
where m is the shape coefficient of the curve of the benefit difference B changing with pre-storage water W. The difference in benefits between the first and second stages is as follows:
B 1 = 1 W 1 W N m
B 2 = 1 W 2 W N m
The change in pre-storage volume W in the adjustment process is analyzed. If the pre-storage water of the first stage W 1 > 0 , the process changes as follows in this case:
(1) In the future period T , the forecast data do not show a large influx of water.
(2) In the second stage, the excess water storage in the first stage can be completely discharged to ensure that the flood risk rate is within a safe range. In this case, W 2 = 0 is B 2 = 0 .
(3) According to (2), W 2 = 0 means that flood control safety can be guaranteed even if design flood breaks out after T in the future.
Therefore, the benefit difference B is only related to the pre-storage water W 1 in the first stage and the two are inversely proportional. That is, the greater the value of pre-storage, the greater the value of profit and benefit. When the pre-storage reaches its maximum value, B = 0 , the relationship between the value of pre-storage and the value of benefit added in stage 1 is shown in Figure 5.

2.5.2. Calculation of Downstream Flood Risk Rate Considering Forecast Information

The input runoff information plays a decisive role in the reservoir regulation decision in the facing stage, and its prediction accuracy is high compared with the residual stage prediction error, which is small, so it can be regarded as a deterministic forecast. Therefore, in order to ensure that there is no flood control risk, the amount of water discharged from the reservoir must be smaller than the downstream safe amount of water.
R 1 b = P ( Q 1 b Q 1 , m a x b ) = 0
In the residual stage, the forecast information of inflow runoff within the future rolling period ΔT should be considered and the impact of its prediction error on the downstream flood control risk should not be ignored. The water level must be controlled at the lower limit of the control domain of flood limit water level at the end of the prediction period:
V 2 = V ( Z d ) = V 1 + ( Q 2 a + θ 2 a ) D 2 = V 0 + Q 1 a D 1 + ( Q 2 a + θ 2 a ) D 2
Therefore, the uncertainty of reservoir discharge decision D 2 is caused by the error of the inflow runoff forecast. The expected discharge D 2 in stage 2 is expressed as follows:
D 2 = D ¯ 2 + θ 2 a = ( W 1 + Q ¯ 2 a ) + θ 2 a
where W 1 is the pre-storage water of stage 1 and W 1 = V 1 V ( Z d ) . Therefore, when θ 2 a > 0 , that is, the predicted inflow is less than the actual inflow, and the actual discharge of the reservoir is greater than the expected discharge D 2 > D 2 , the downstream needs to bear certain flood control risks. In θ 2 a < 0 , the predicted inflow is relatively large and the actual discharge of the reservoir is smaller than the expected discharge, that is, D 2 < D 2 . In this case, the downstream flood control safety can be guaranteed.
The probability of the combined inflow (including the expected discharge and interval forecast inflow) exceeding the safe flow in stage 2 is used to define the downstream flood control risk rate, as shown in Equation (7):
R 2 b = P ( Q 2 b > Q 2 , m a x b ) = Q 2 , m a x b + h ( Q 2 b ) d Q 2 b
According to the evolution equation of river flood (excluding the propagation time of river flood), the combined discharge volume of downstream control stations is the sum of the reservoir discharge volume and forecast error, assuming that the forecast error follows the standard normal distribution, and the downstream flood control risk rate with forecast error as the independent variable is calculated as follows:
R 2 b = P ( θ 2 b > Q 2 , m a x b Q 2 b ) = Q 2 , m a x b Q 2 b + h ( θ 2 b ) d θ 2 b =   P ( θ 2 b > σ ) = σ + h ( θ 2 b ) d θ 2 b
where h ( Q 2 b ) represents the probability density function of combined incoming water Q 2 b of the downstream control station in the second stage; h ( θ 2 b ) represents the probability density function of the incoming water forecast error θ 2 b of the downstream control station in the second stage; and Q 2 , max b Q 2 b is the flood control safety value, that is, the difference between the safe overflow water and the expected inflow of the downstream reservoir, denoted by σ :
σ = Q 2 , m a x b Q ¯ 2 b
The flood control safety value σ is the safety range set aside in advance for the forecast uncertainty. The larger the value, the larger the forecast error that can be accepted by the downstream. For example, when the safe flow volume of the control station is 50 × 106 m 3 and the expected combined inflow is 30 × 106 m 3 , the downstream flood control safety value is 20 × 106 m 3 ; so long as the prediction error does not exceed B, the downstream flood control safety can be guaranteed.
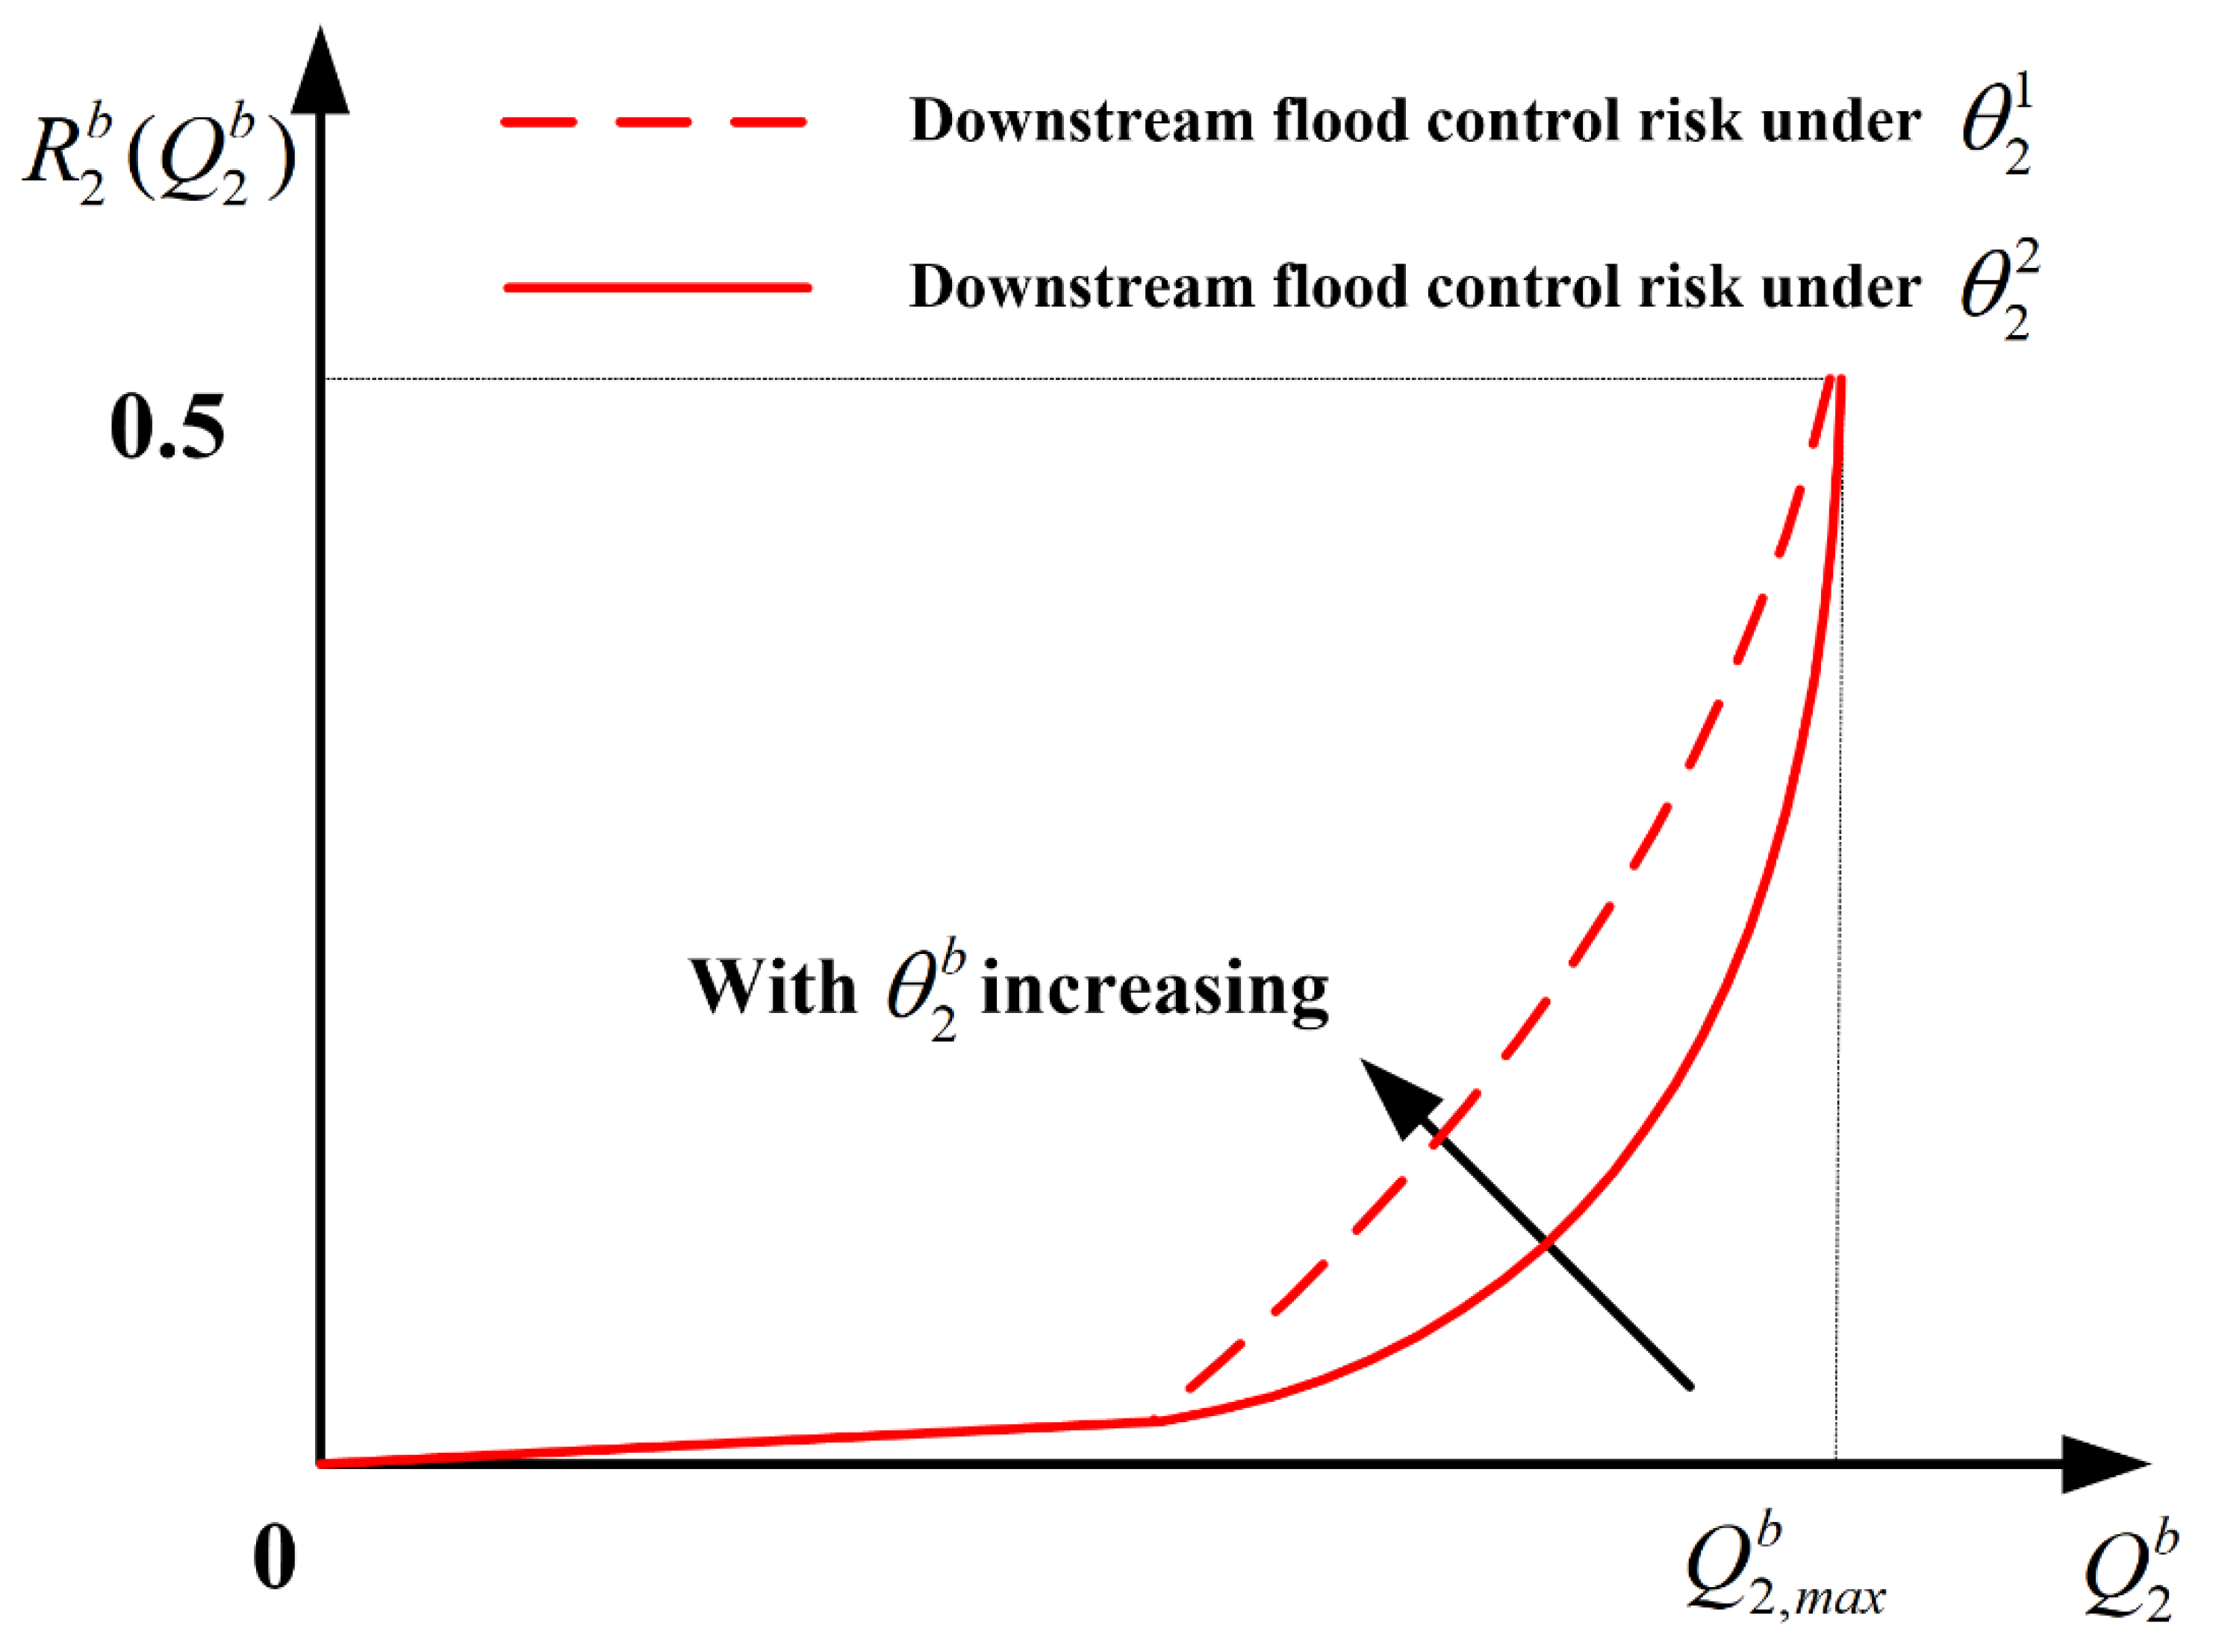
In conclusion, the flood control risk R 2 b at the downstream of the reservoir is the probability that the combined incoming water Q 2 b exceeds the downstream safe flow volume Q 2 , max b . If the prediction accuracy is high, in order to ensure the flood control safety of the reservoir design, the sum of the reservoir discharge and the interval inflow must not exceed the downstream safe flow ( Q 2 b Q 2 , max b ). However, if the forecast error is large, it is necessary to analyze the effect of the forecast error on flood control risk. When the combined inflow Q 2 b increases, the downstream flood control risk R 2 b increases; meanwhile, when the foresight period increases, the response risk also increases, as shown in Figure 6.
Within a dispatch period, it is necessary to ensure that the residual stage (stage 2) can discharge all of the pre-storage water in the decision stage (stage 1), then the downstream flood control safety value is as follows:
σ = Q 2 , m a x b Q ¯ 2 a Q ¯ 2 a b W 1
According to the above equation, in order to increase the profit and benefit of the reservoir, the water storage W 1 in the decision-making stage (stage 1) will increase and the flood control safety value δ in the second stage will decrease, which will cause the flood control risk rate to increase. On the contrary, W 1 decreases and δ increases at the same time. It can be seen that the reservoir profit benefit and flood control risk are contradictory and competitive with each other, and meet the following relationship:
W 1 + δ = Q 2 , max b Q ¯ 2 a Q ¯ 2 ab = Q 2 , max b Q ¯ 2
where Q 2 represents the sum of the predicted downstream interval and the incoming water from the reservoir and Q 2 , max b Q 2 a Q 2 a b is the difference between the predicted incoming water and the downstream safe flow and is called residual flood control capacity (RF):
R F = W 1 + δ = Q 2 , max b Q ¯ 2
It can be seen from Equation (12) that the meaning of RF is the maximum amount of water discharged from the reservoir in the second stage when the prediction error is 0. When RF > 0, the reservoir in the first stage can realize more water storage, so as to increase the benefit, or to ensure the flood control safety in the second stage, so as to reduce water storage. In other words, when the forecast is too large or too small, the tradeoff between the two objectives of reservoir flood control and benefit is the division of the remaining flood control capacity RF between the first stage pre storage water W 1 and the second stage flood control safety value δ . In a word, the risk benefit value of the reservoir in the reserving stage and decision-making stage is as follows:
G 1 ( W 1 ) = R 1 b + B 1 = ( 1 W 1 W N ) m G 2 ( δ ) = R 2 b + B 2 = σ + h ( θ 2 b ) d θ 2 b  
Equation (14) calculates the first-order partial derivatives G 1 ( W 1 ) and G 2 ( δ ) . From the perspective of economics, it means the marginal contribution value of the pre-storage water W 1 in the first stage and the flood control safety value σ in the second stage to the two-stage loss, whose value is as follows:
G 1 ( W 1 ) = G 1 ( W 1 ) W 1 = f 1 ( W 1 ) G 2 ( δ ) = G 2 ( δ ) δ = f 2 ( δ )
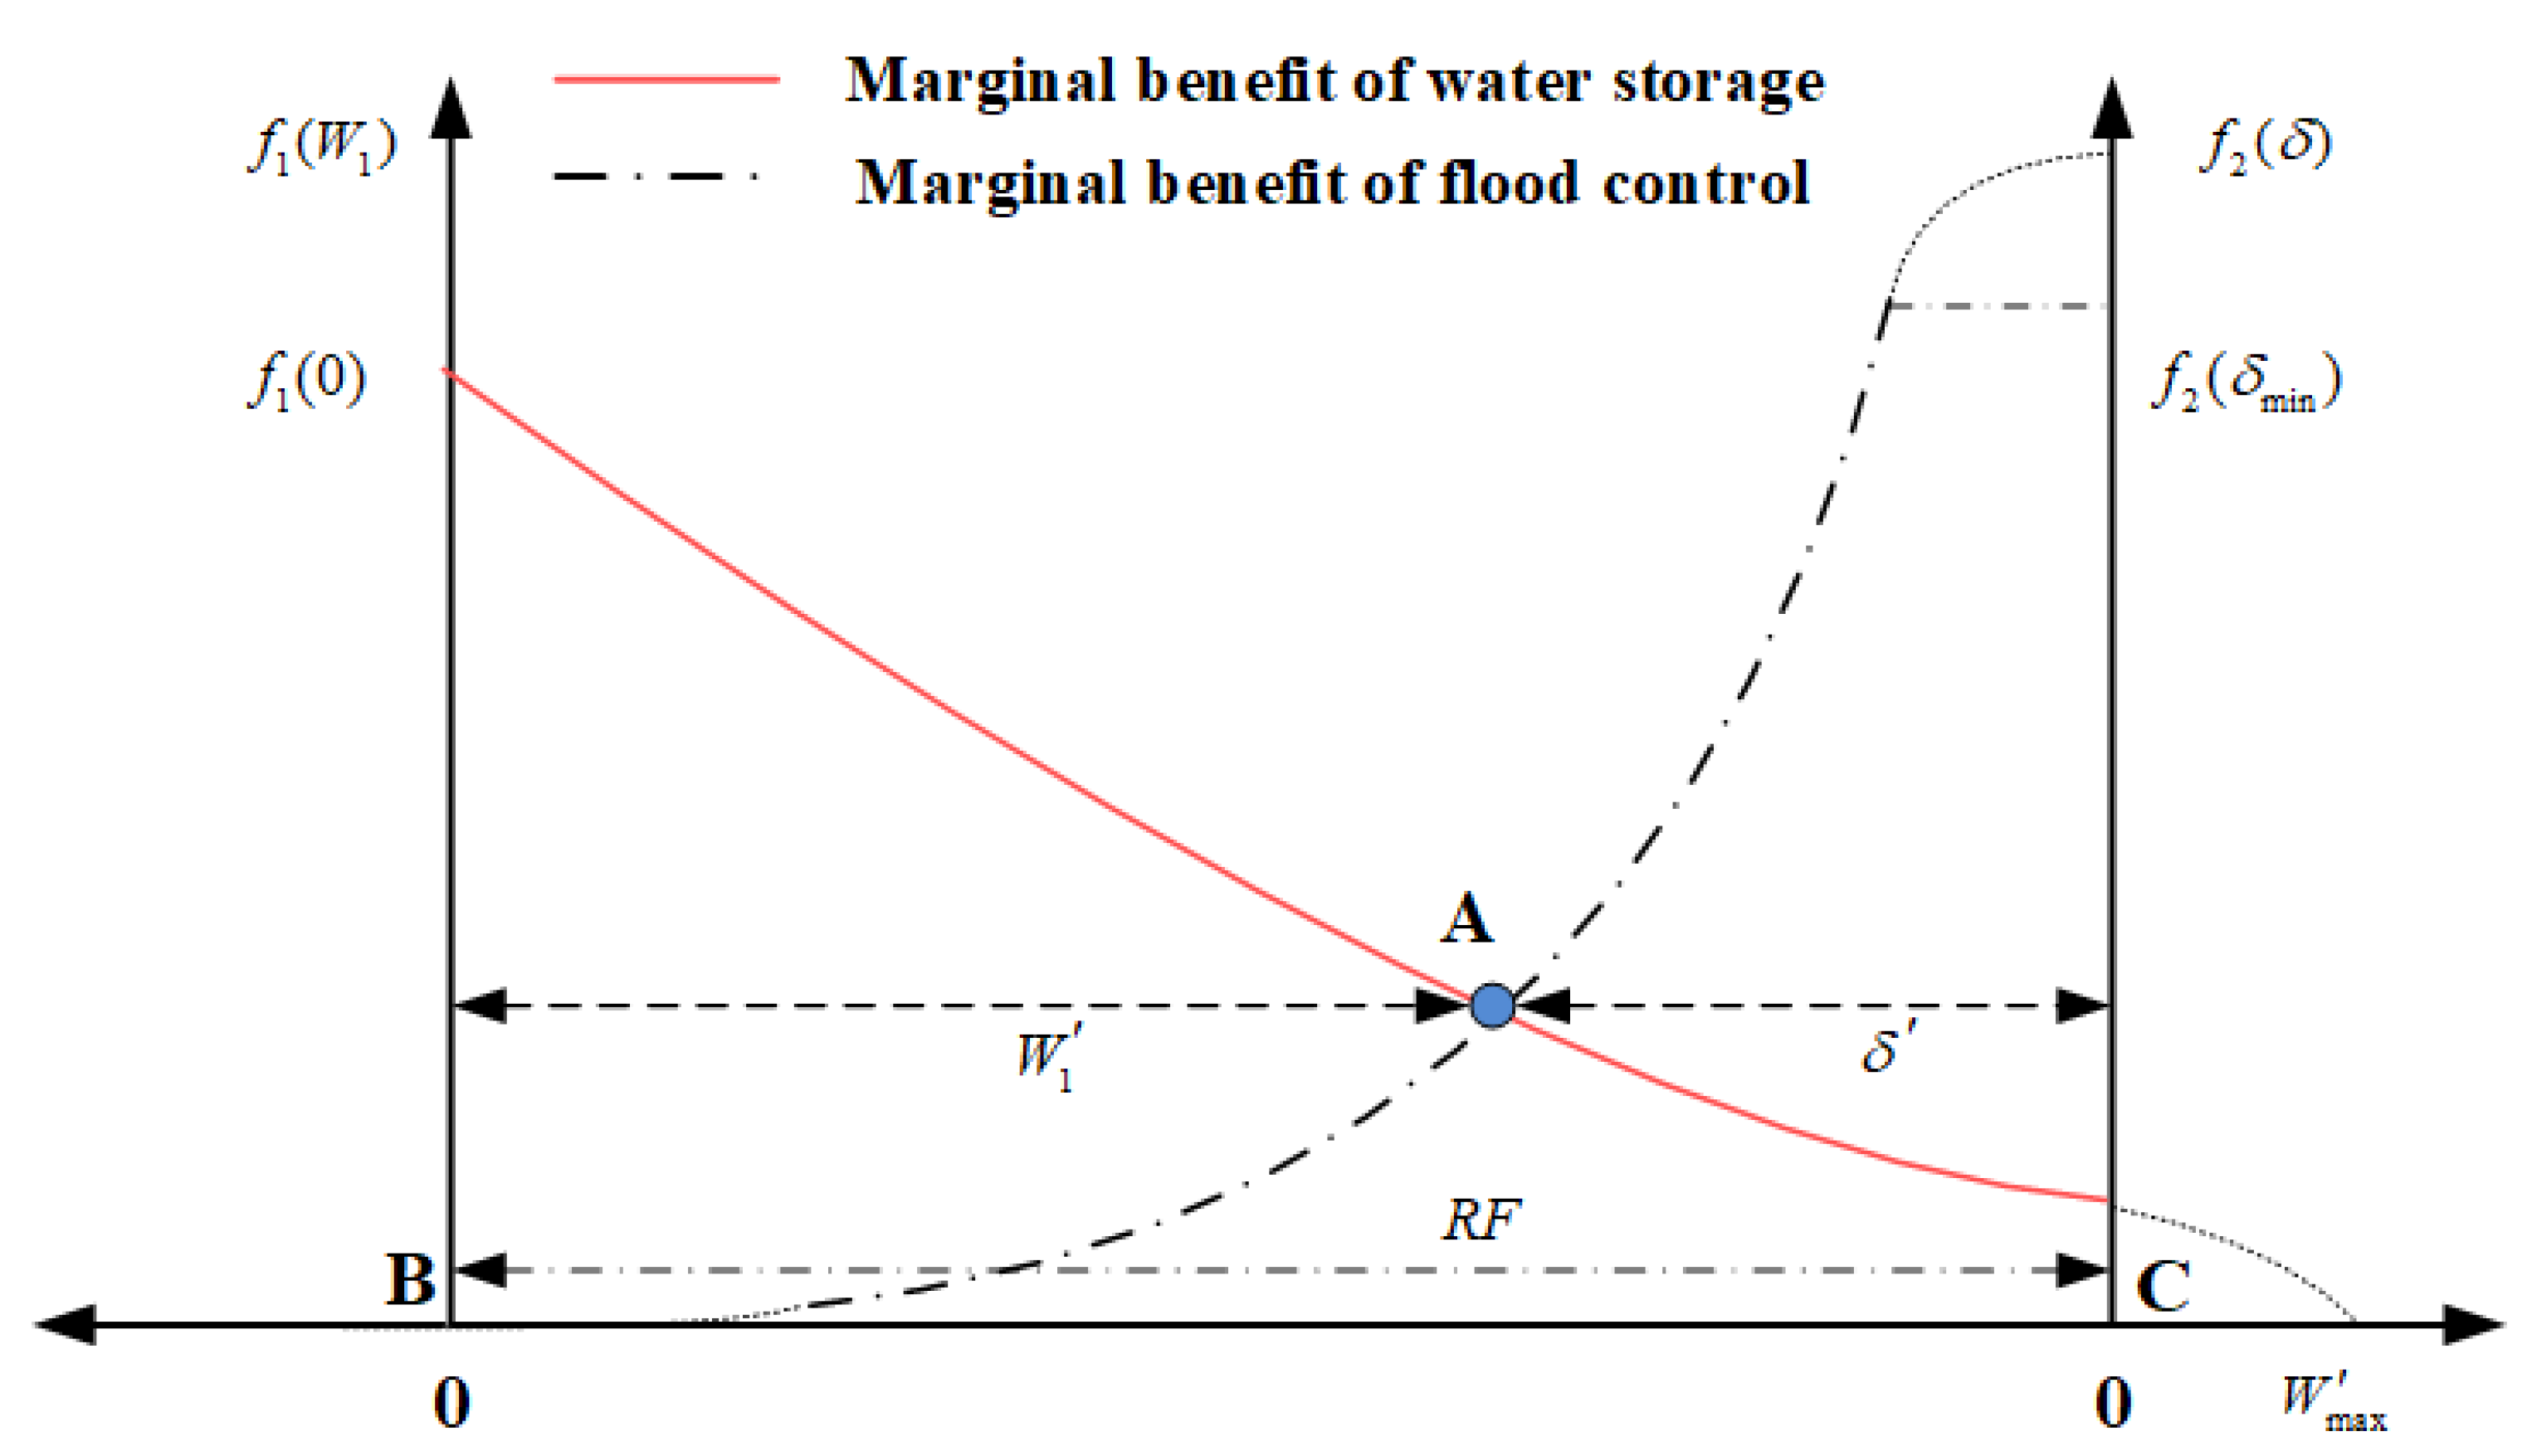
where f 1 ( W 1 ) is the marginal benefit of reservoir water storage and represents the added value of water storage benefit brought by increasing unit water storage W 1 . f 1 ( W 1 ) and f 2 ( δ   ) are the decreasing functions of W 1 and δ , respectively. When the water storage volume W 1 increases, the increased water storage benefit will decrease owing to the increase in the total pre-storage volume (the reduced flood control risk rate when the unit flood control safety value δ is increased). Therefore, both f 1 ( W 1 ) and f 2 ( δ   ) experience the law of diminishing marginal benefits. According to the sufficient and necessary conditions of KKT condition, when the marginal benefit of water storage f 1 ( W 1 * ) is equal to the marginal benefit of flood control f 2 ( δ * ) , the loss of the two stages is the least, that is, as follows:
f 1 ( W 1 ) = f 2 ( δ )
where the optimal value of pre-storage water in the decision stage (stage 1) is W 1 * , the optimal value of flood control safety in the residual stage (stage 2) is δ * , and R F = W 1 * + δ * . The optimal solution when the marginal benefits are equal is shown in Figure 7.
The solid red line in the figure represents the marginal benefit curve f 1 ( W 1 ) of water storage at range [ 0 , W max ] of pre-storage water W 1 , and the coordinate origin is point B. The black dashed line represents the flood control marginal benefit curve f 2 ( δ   ) of the flood control safety value δ within the feasible range δ δ min , and the coordinate origin is point C. The remaining flood control capacity RF is the distance between the two vertical axes, then point A is the optimal solution of two-stage loss–benefit.
(3) Calculation of marginal benefit value of hydropower and photovoltaic power generation.
As the next day’s electricity demand issued by the grid is determined, single hydropower, photovoltaic power stations, cascade hydropower, multi-level photovoltaic power stations, and other entities hope to generate more electricity to generate greater economic benefits, and there must be a competition between their grid-connected electricity. Therefore, the electricity demand W z meets the following condition:
W z = W s + W g
where W s represents the on-grid electricity of the hydropower station and W g represents the on-grid power of photovoltaic power stations. In the actual joint dispatch process, W s and W g are both predicted values, so it is necessary to consider the compensation penalty brought by prediction errors, that is, the power generation benefits of hydropower and photovoltaic are expressed respectively as follows:
F ( W s ) = f ( W s ) λ f ( W q ) F ( W g ) = f ( W g ) γ f ( W q )
where F ( W s ) and F ( W g ) are the final power generation benefit values of the hydropower station and photovoltaic power station, respectively; F ( W s ) and F ( W g ) are the actual on-grid electricity benefit values of the hydropower station and photovoltaic power station, respectively; F ( W q ) is the power loss benefit of the combined system; and λ and γ are the power loss compensation coefficients of the transmission station and photovoltaic power station, respectively. It can be seen that, if the system suffers power loss due to forecast uncertainty, all parties need to compensate for the generation gap. The coordination of the hydropower power generation benefit and photovoltaic power generation benefit is actually the distribution of hydropower on-grid electricity and photovoltaic on-grid electricity in demand electricity.
According to the significance of hedging mechanism in economics, F ( W s ) and F ( W g ) are the marginal contribution of the hydropower on-grid electricity and photovoltaic on-grid electricity, respectively, to the electricity demand of the combined system, that is, as follows:
f 1 = F ( W s ) W s f 2 = F ( W g ) W g
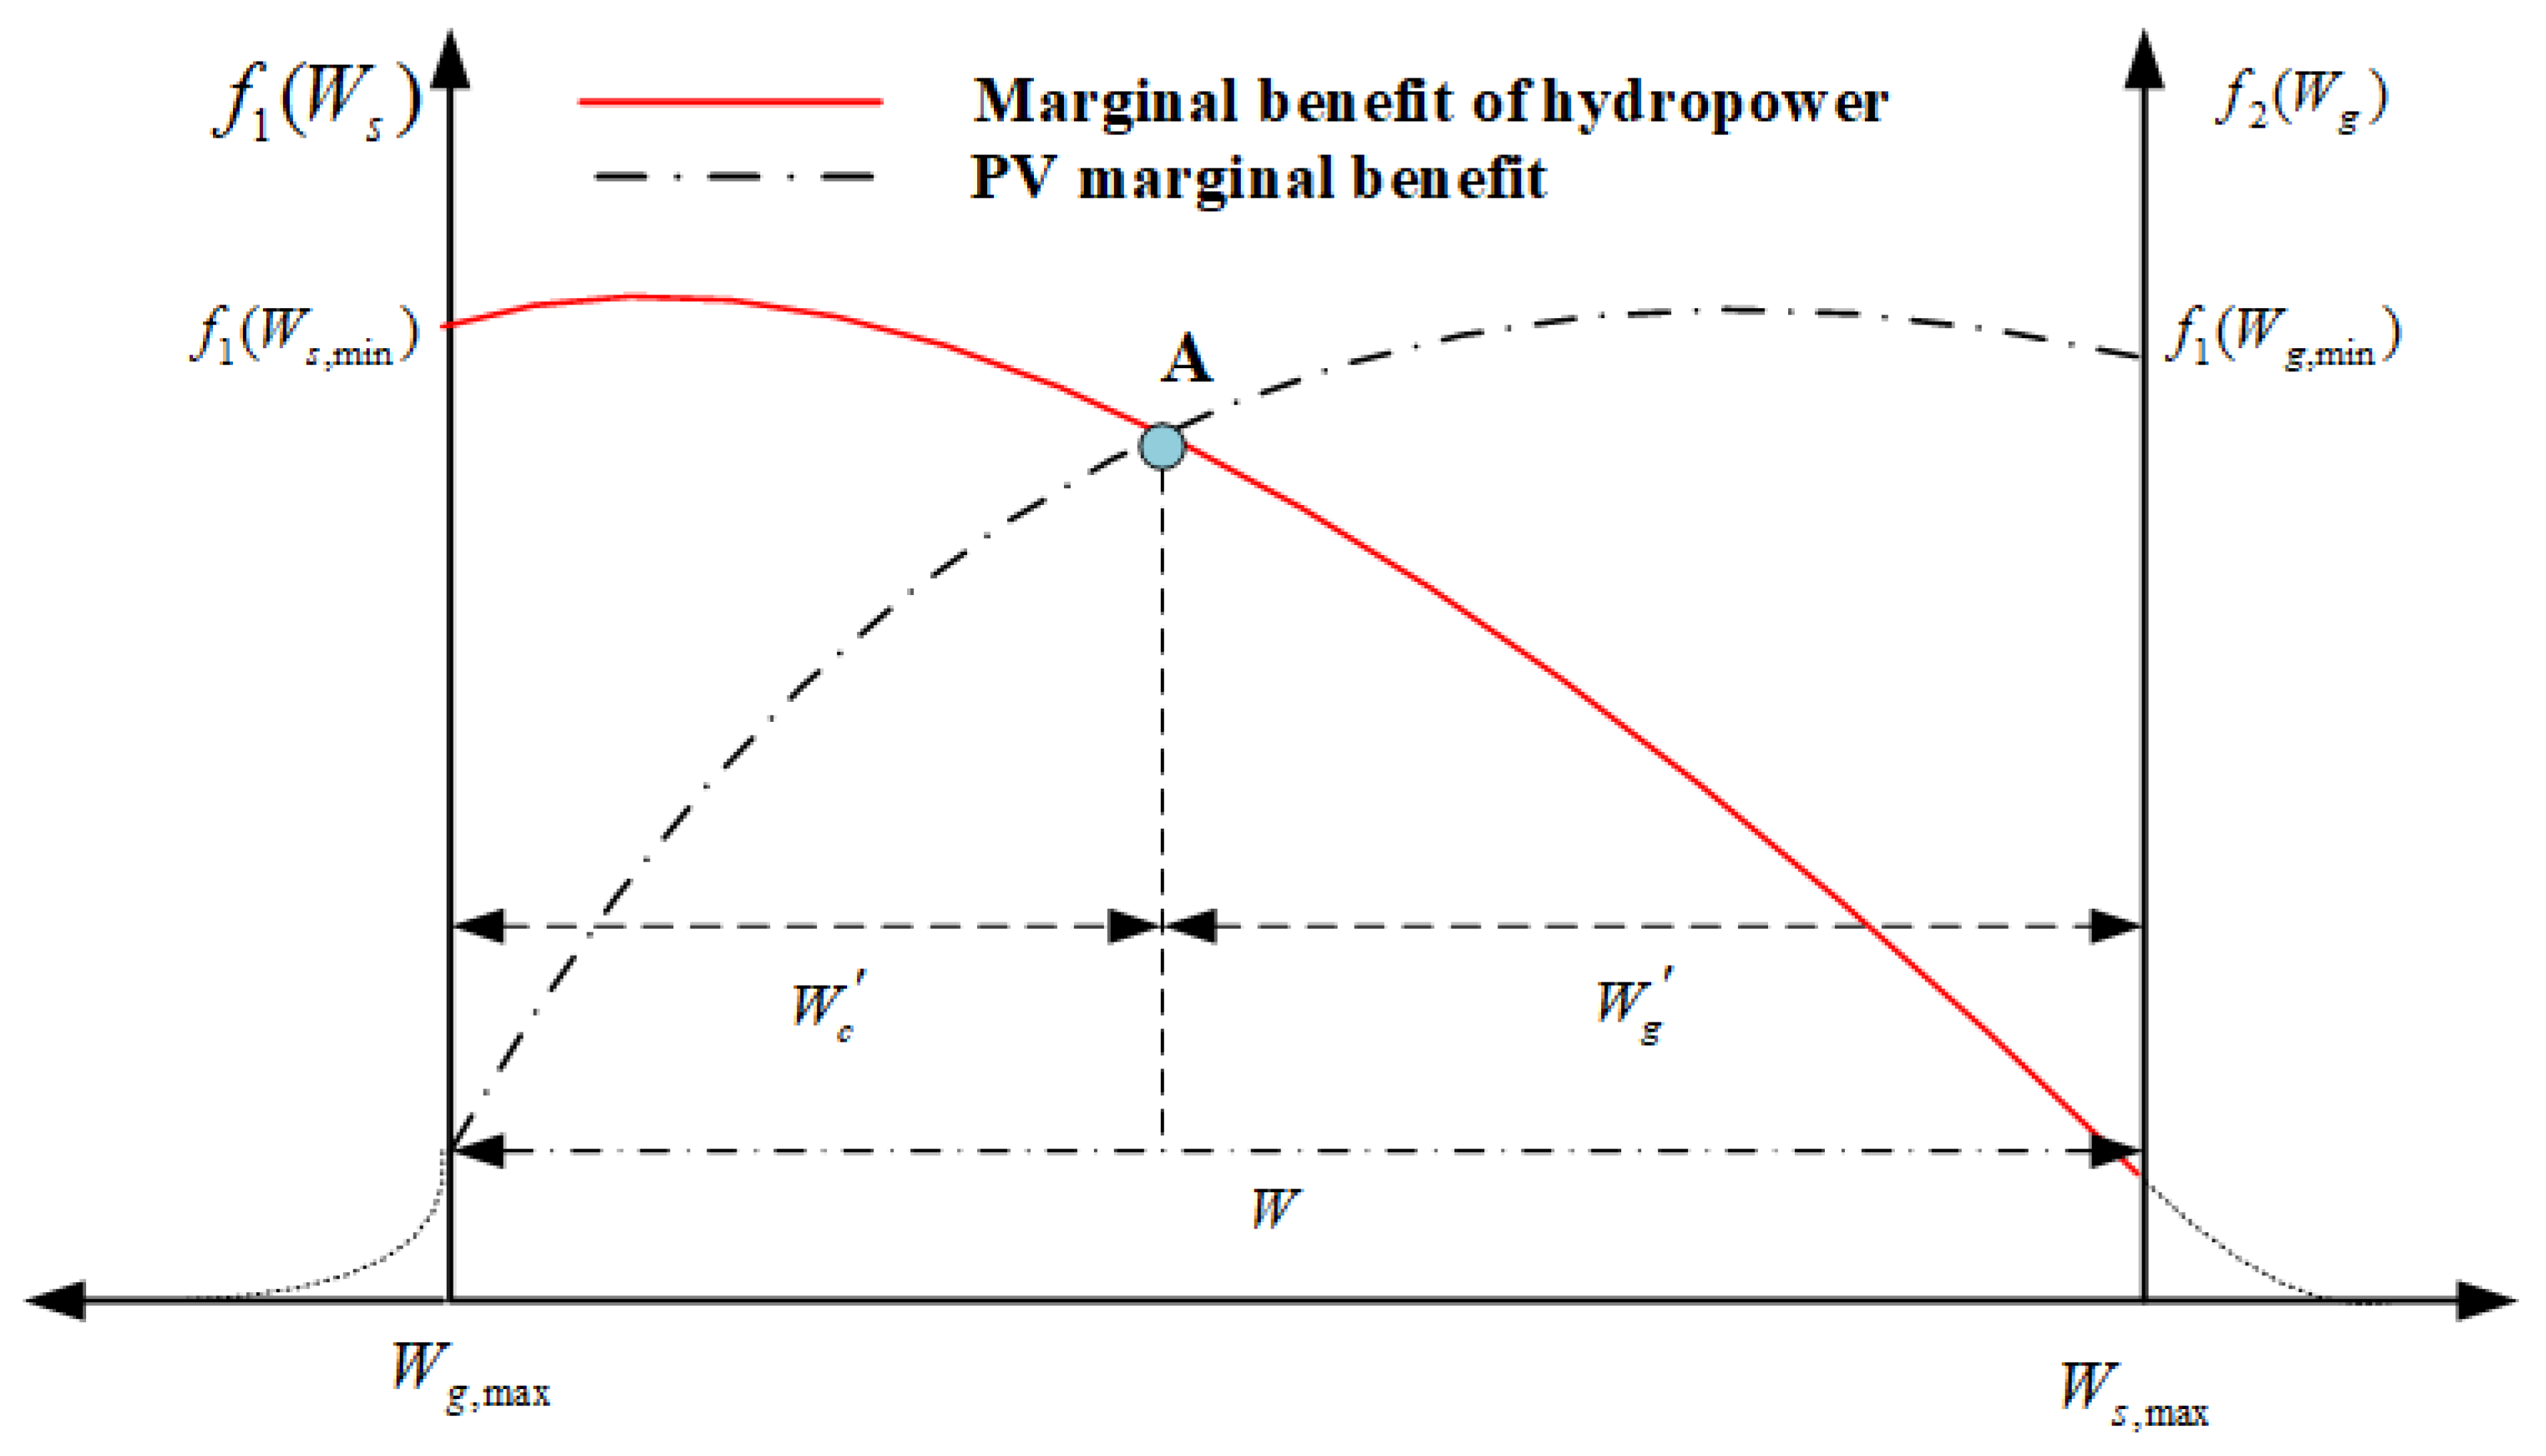
where f 1 and f 2 represent the marginal benefit of power generation of the hydropower station and photovoltaic power station, respectively, namely, the change in power generation benefit brought by a unit change in power generation. From the above analysis, F ( W s ) and F ( W g ) are the reduction functions of W s and W g , namely, the power generation benefit increased by unit power generation W decreases with the increase in total power generation, showing the law of a decreasing marginal benefit. The curve of the marginal benefit of power generation changing with power generation is shown in Figure 8.
According to the KKT optimal conditions of the nonlinear programming problem, the optimal solution of the model is that the marginal benefit of hydropower station and photovoltaic power station are as close as possible, namely point A ( f 1 = f 2 ) in Figure 8.

2.6. Model Construction

According to the above, the model is established as follows:
(1)
Objective function
Objective 1: Minimum risk of flood control downstream of the two-stage reservoir.
f ( 1 ) = m i n t = 1 T ( R t 1 b + R t 2 b ) = m i n t = 1 T ( σ + h ( θ 2 b ) d θ 2 b )
where T is the total scheduling period and R t 1 b is the flood control risk rate in the decision-making stage. According to the analysis, R t 1 b = 0 , R t 2 b is the flood control risk rate in the residual stage.
Objective 2: The difference between the two stages of reservoir profits and benefits is at a minimum.
f ( 2 ) = m i n t = 1 T ( B t 1 + B t 2 ) = m i n t = 1 T ( 1 W 1 W N ) m
where T is the total scheduling period; B t 1 is the benefit difference of pre-storage water in the decision-making stage; B t 2 is the increment of water storage efficiency in the residual stage; and the analysis shows that B t 2 = 0.
Objective 3: Minimum volatility of combined output.
f ( 3 ) = m i n m a x ( P Z ) m i n ( P Z )
where P z is the combined total electricity generation of hydropower and photovoltaic (kW/h), that is, P z ( i ) = P w d ( i ) + P s d ( i ) . Here, P w d ( i ) is hydropower generation in the i period (kW/h) and P s d ( i ) is the photovoltaic power generation in the i period, (kW/h).
(2)
Constraints
The mathematical model considering the fluctuation of joint output involves many constraints, mainly including power balance, reservoir water balance, upper limit of pre-storage water, hydropower station output, photovoltaic power station output, and so on.
(1) Hydropower output constraint
N W d min N W d t = k Q t H t N W d max
where N W d t is the output of hydropower station during t period (kW); N W d max and N W d min are guaranteed output and installed capacity, respectively, of the hydropower station within this period (kW); Q t is the flow rate of hydropower station during the period ( m 3 / s ); H t is the average head of power generation in time period t of the hydropower station (m); and k is the comprehensive output coefficient of the hydropower station. The output of the hydropower station shall not exceed the maximum generating capacity of the hydropower station.
(2) Photovoltaic output constraint
N S d min N S d t N S d max
where N S d t is the output of photovoltaic power station within the time period (kW); N S d min is the lower limit of photovoltaic output within this period (kW); and N S d max is the upper limit of PV output (kW), that is, the PV output cannot exceed the maximum generating capacity of the PV power station.
(3) Constraints on the power generation of the combined system
t = 1 T N Z , t Δ t = t = 1 T N W , t Δ t + t = 1 T N S , t Δ t
where N Z , t is the joint output of hydropower and photovoltaic at time period t (kW) and Δ t is the interval length.
(4) Reservoir capacity constraint
V min V t V max
where V min is the minimum reservoir capacity ( m 3 ) and V max is the maximum reservoir capacity ( m 3 ).
(5) Water balance constraint
W 0 t + Q 1 t a D 1 t = W 1 t W 1 t + Q ¯ 2 t a D ¯ 2 t = W 2 t = 0
where W 0 t is the initial water storage of the reservoir at stage 1 in time period t ( m 3 ); W 1 t is the water storage capacity of the reservoir at the end of stage 1 (at the beginning of stage 2) in time period t ( m 3 ); W 2 t is the water storage capacity of the reservoir at the end of stage 2 in time period t ( m 3 ); Q 1 t a is the actual inflow of the reservoir at stage 1 in time period t ( m 3 ); Q ¯ 2 t a is the predicted inflow of the reservoir at stage 2 in time period t ( m 3 ); D 1 t is the water discharge of the reservoir at stage 1 in time period t ( m 3 ); and D ¯ 2 t is the expected water discharge of the reservoir at stage 2 in time period t ( m 3 ).
(6) Constraints on discharge under the reservoir
D t m i n D t D t m a x
where D t is the lower discharge of reservoir in time period t ( m 3 / s ); D t m i n is the minimum lower discharge rate ( m 3 / s ); and D t m a x is the downstream safe discharge volume ( m 3 / s ).
(7) Water level constraint
Z min Z t Z max
where Z min is the dead water level of the reservoir (m); Z t is the reservoir water level during the period (m); and Z max is the flood control level of the reservoir (m).
(8) Slope climbing constraint of hydropower output
N t N t 1 Δ N t ¯
where Δ N t ¯ is the upper limit of output amplitude variation in adjacent periods of the hydropower station.
(9) Electric quantity balance constraint
P W d ( t ) + P S d 1 ( t ) = P L d ( t )
where P W d ( t ) is the power generation force of the hydropower station in period t (kW/h); P S d 1 ( t ) is the actual photovoltaic power generation in period t (kW/h); and P L d ( t ) is the load value in period t (kW/h).

3. Optimization Methods

The objective problem refers to obtaining the optimal solution of objective function through certain optimization algorithm and mathematical models [32]. The objective function of the single-objective problem (SOP) is unique. For example, in the traditional power system dispatching, the total amount of coal consumed is minimized by controlling the output and start–stop of the generator set. When there are multiple objective functions for optimization, it is called a multi-objective problem (MOP). The focus of each goal in a multi-objective problem is often inconsistent, that is, when optimizing one objective, it is often at the expense of another or other objectives. Therefore, the multi-objective problem is to maximize the optimization of each sub-objective under the limitation of several conflicting or interacting sub-objectives [33]. For hydropower photovoltaic joint dispatching, it is a very complex decision-making system to consider the benefit and risk allocation of multi-agent and multi-time scale in the joint dispatching process. To ensure the basic benefits of all parties involved in dispatching on the basis of controllable risk, it is necessary to introduce a “hedging mechanism” to balance the risk and benefit in the dispatching decision-making process. On the basis of ensuring that the risk is controllable, it is necessary to introduce a “hedging mechanism” to balance the risks and benefits in the scheduling decision-making process to ensure the basic benefits of all parties involved in the scheduling.
In hydropower photovoltaic joint dispatching, there is not only the problem of time-type two-stage conflict, but also the problem of multi-subject conflict in space. The traditional multi-objective optimization algorithm can only find a set of non-inferior optimization schemes and cannot comprehensively consider the hedging problem in hydropower photovoltaic joint scheduling. Therefore, it is necessary to change the solution process of the traditional optimal scheduling model and find a hydropower photovoltaic joint scheduling model and solution method suitable for the multi-objective hedging mechanism. It is necessary to ensure the reliability of the decision-making scheme, but also to ensure the optimality of the scheme, so as to solve the conflict problem in the joint scheduling to the greatest extent and obtain the balance point of the interests of each subject.
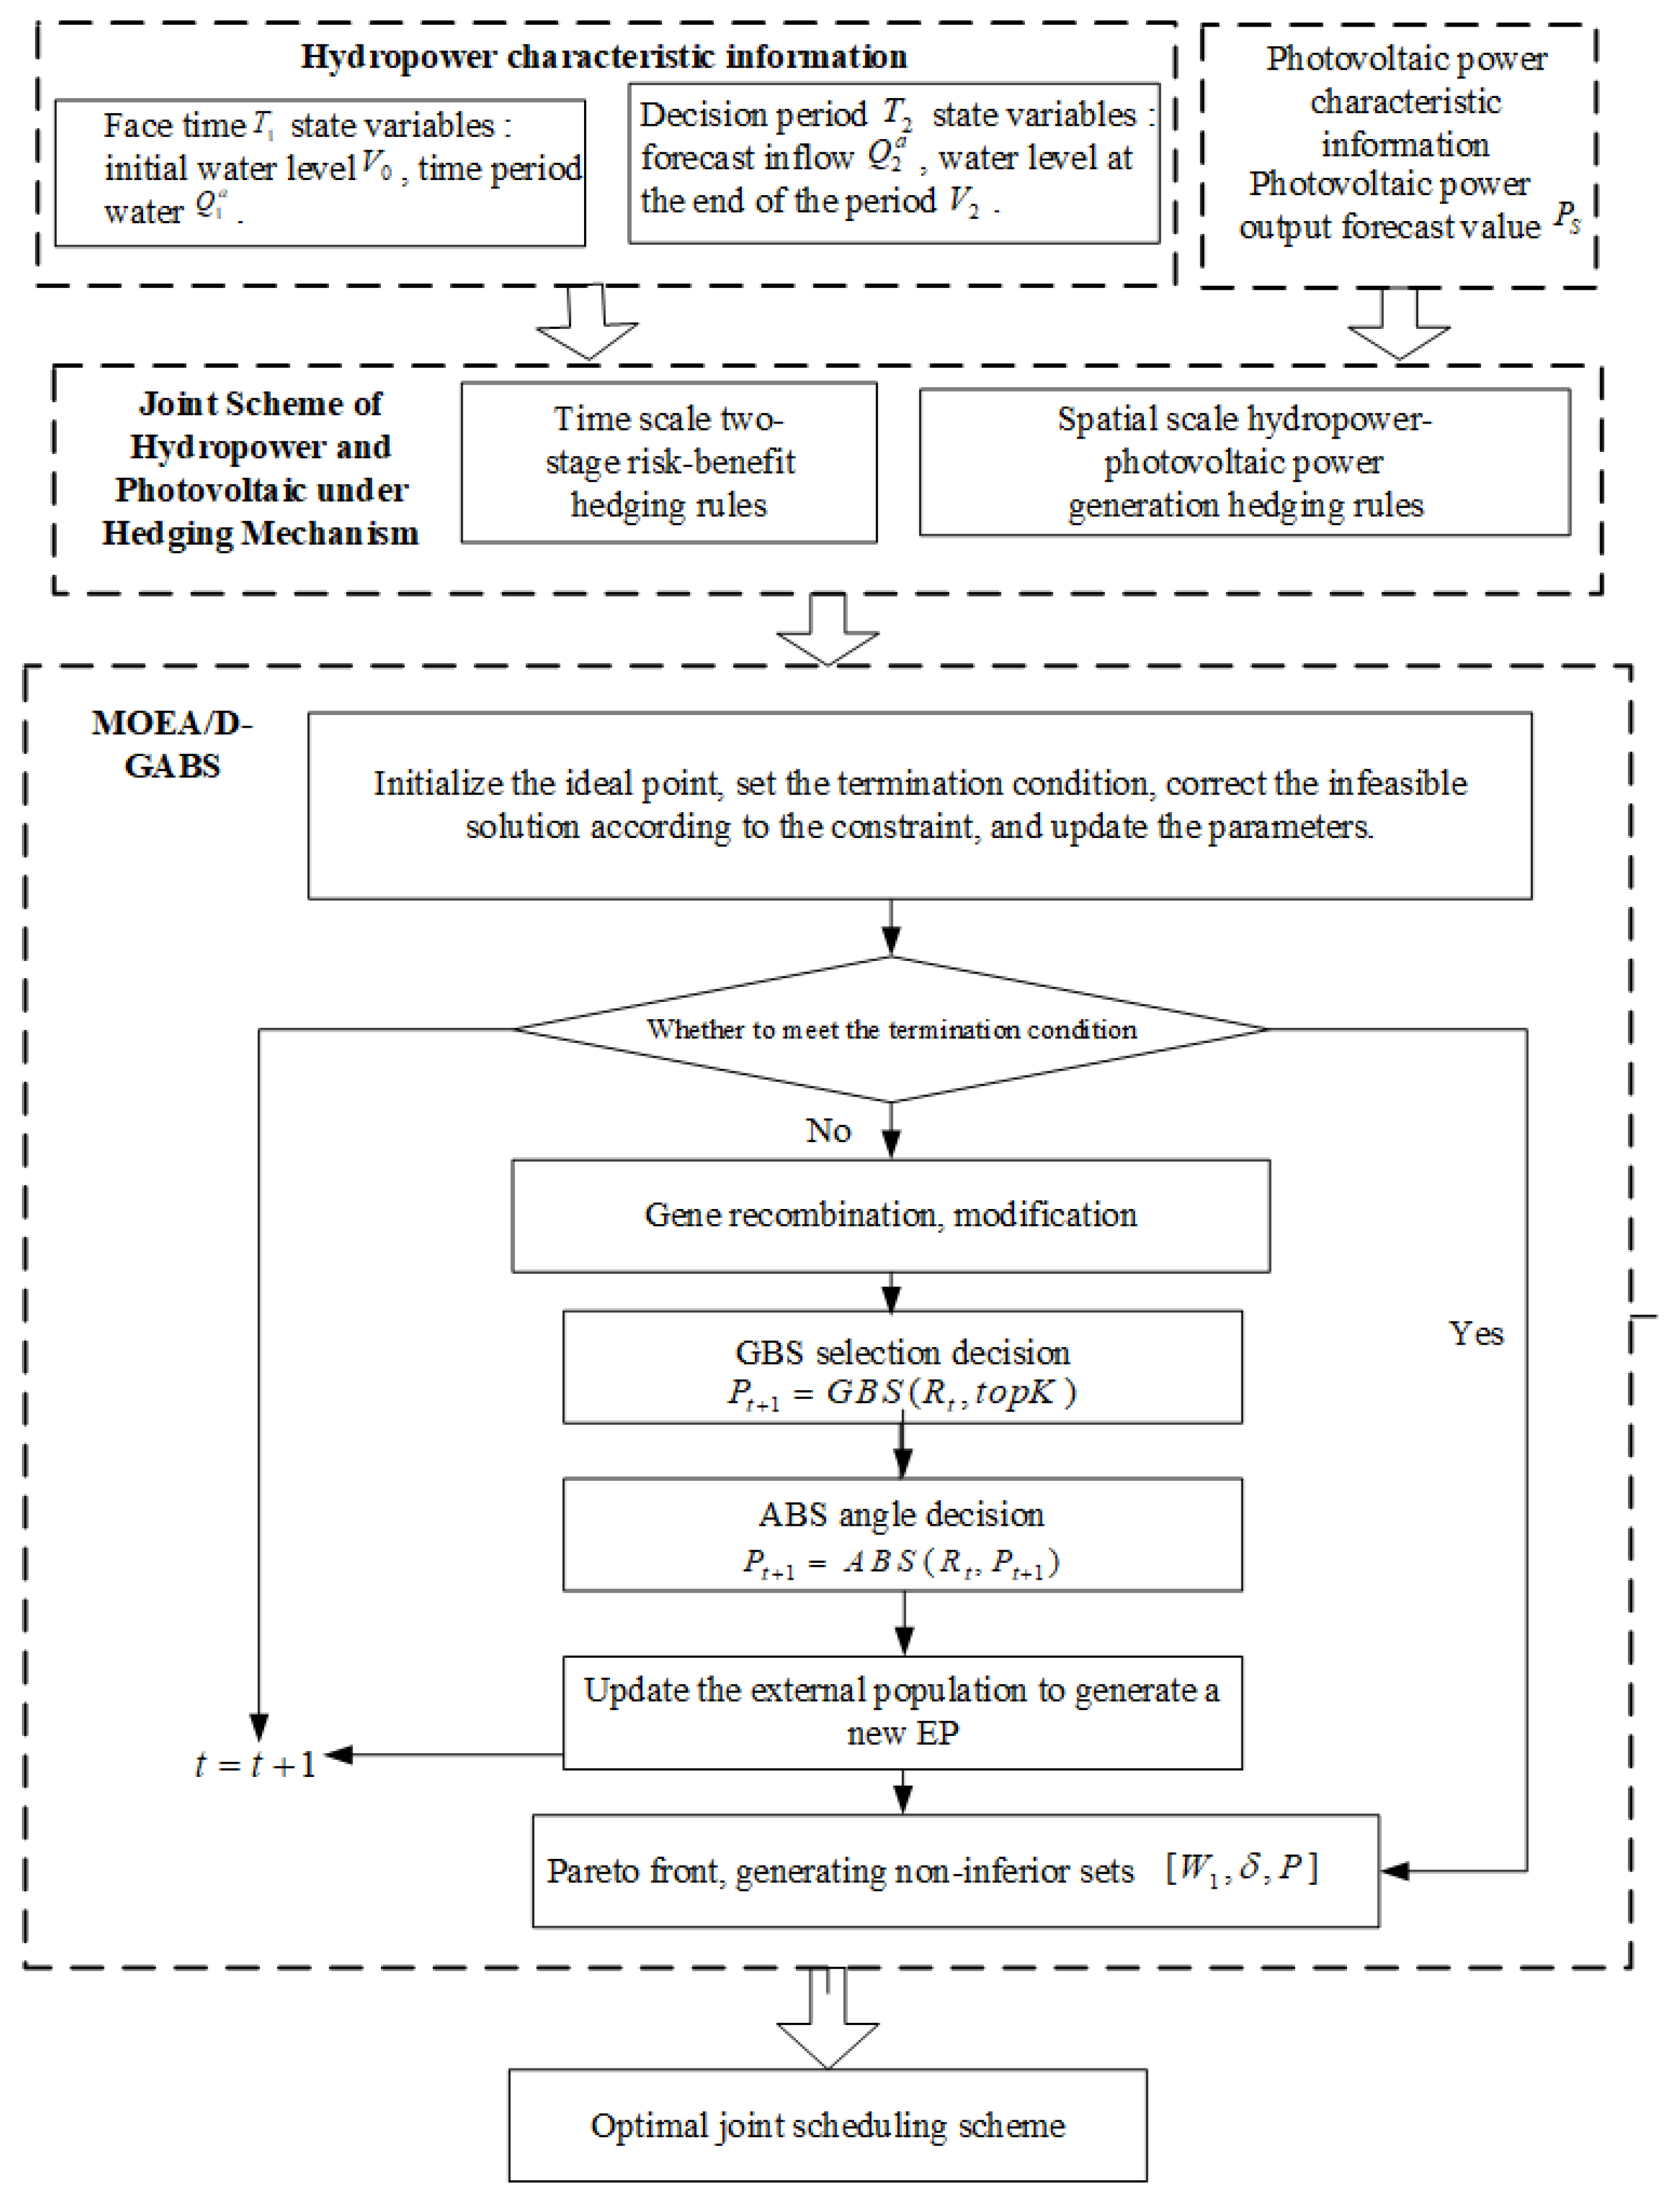
According to the above description, the solution process of the hydropower photovoltaic joint dispatching model under the hedging mechanism established in this paper is divided into two parts. In the first part, the non-inferior set scheme of hydropower photovoltaic multi-objective joint dispatching is obtained through the high-dimensional MOEA/D optimization algorithm of the greedy strategy. This scheme is a series of feasible results and optimization decisions need to be made. The second part is to calculate the marginal benefit value of hydropower and photovoltaic according to the decision variables corresponding to non-inferior sets under the hydropower photovoltaic joint dispatching hedging mechanism, so as to obtain the optimal dispatching scheme under the hedging mechanism.

3.1. Improved Decomposition Optimization Algorithm

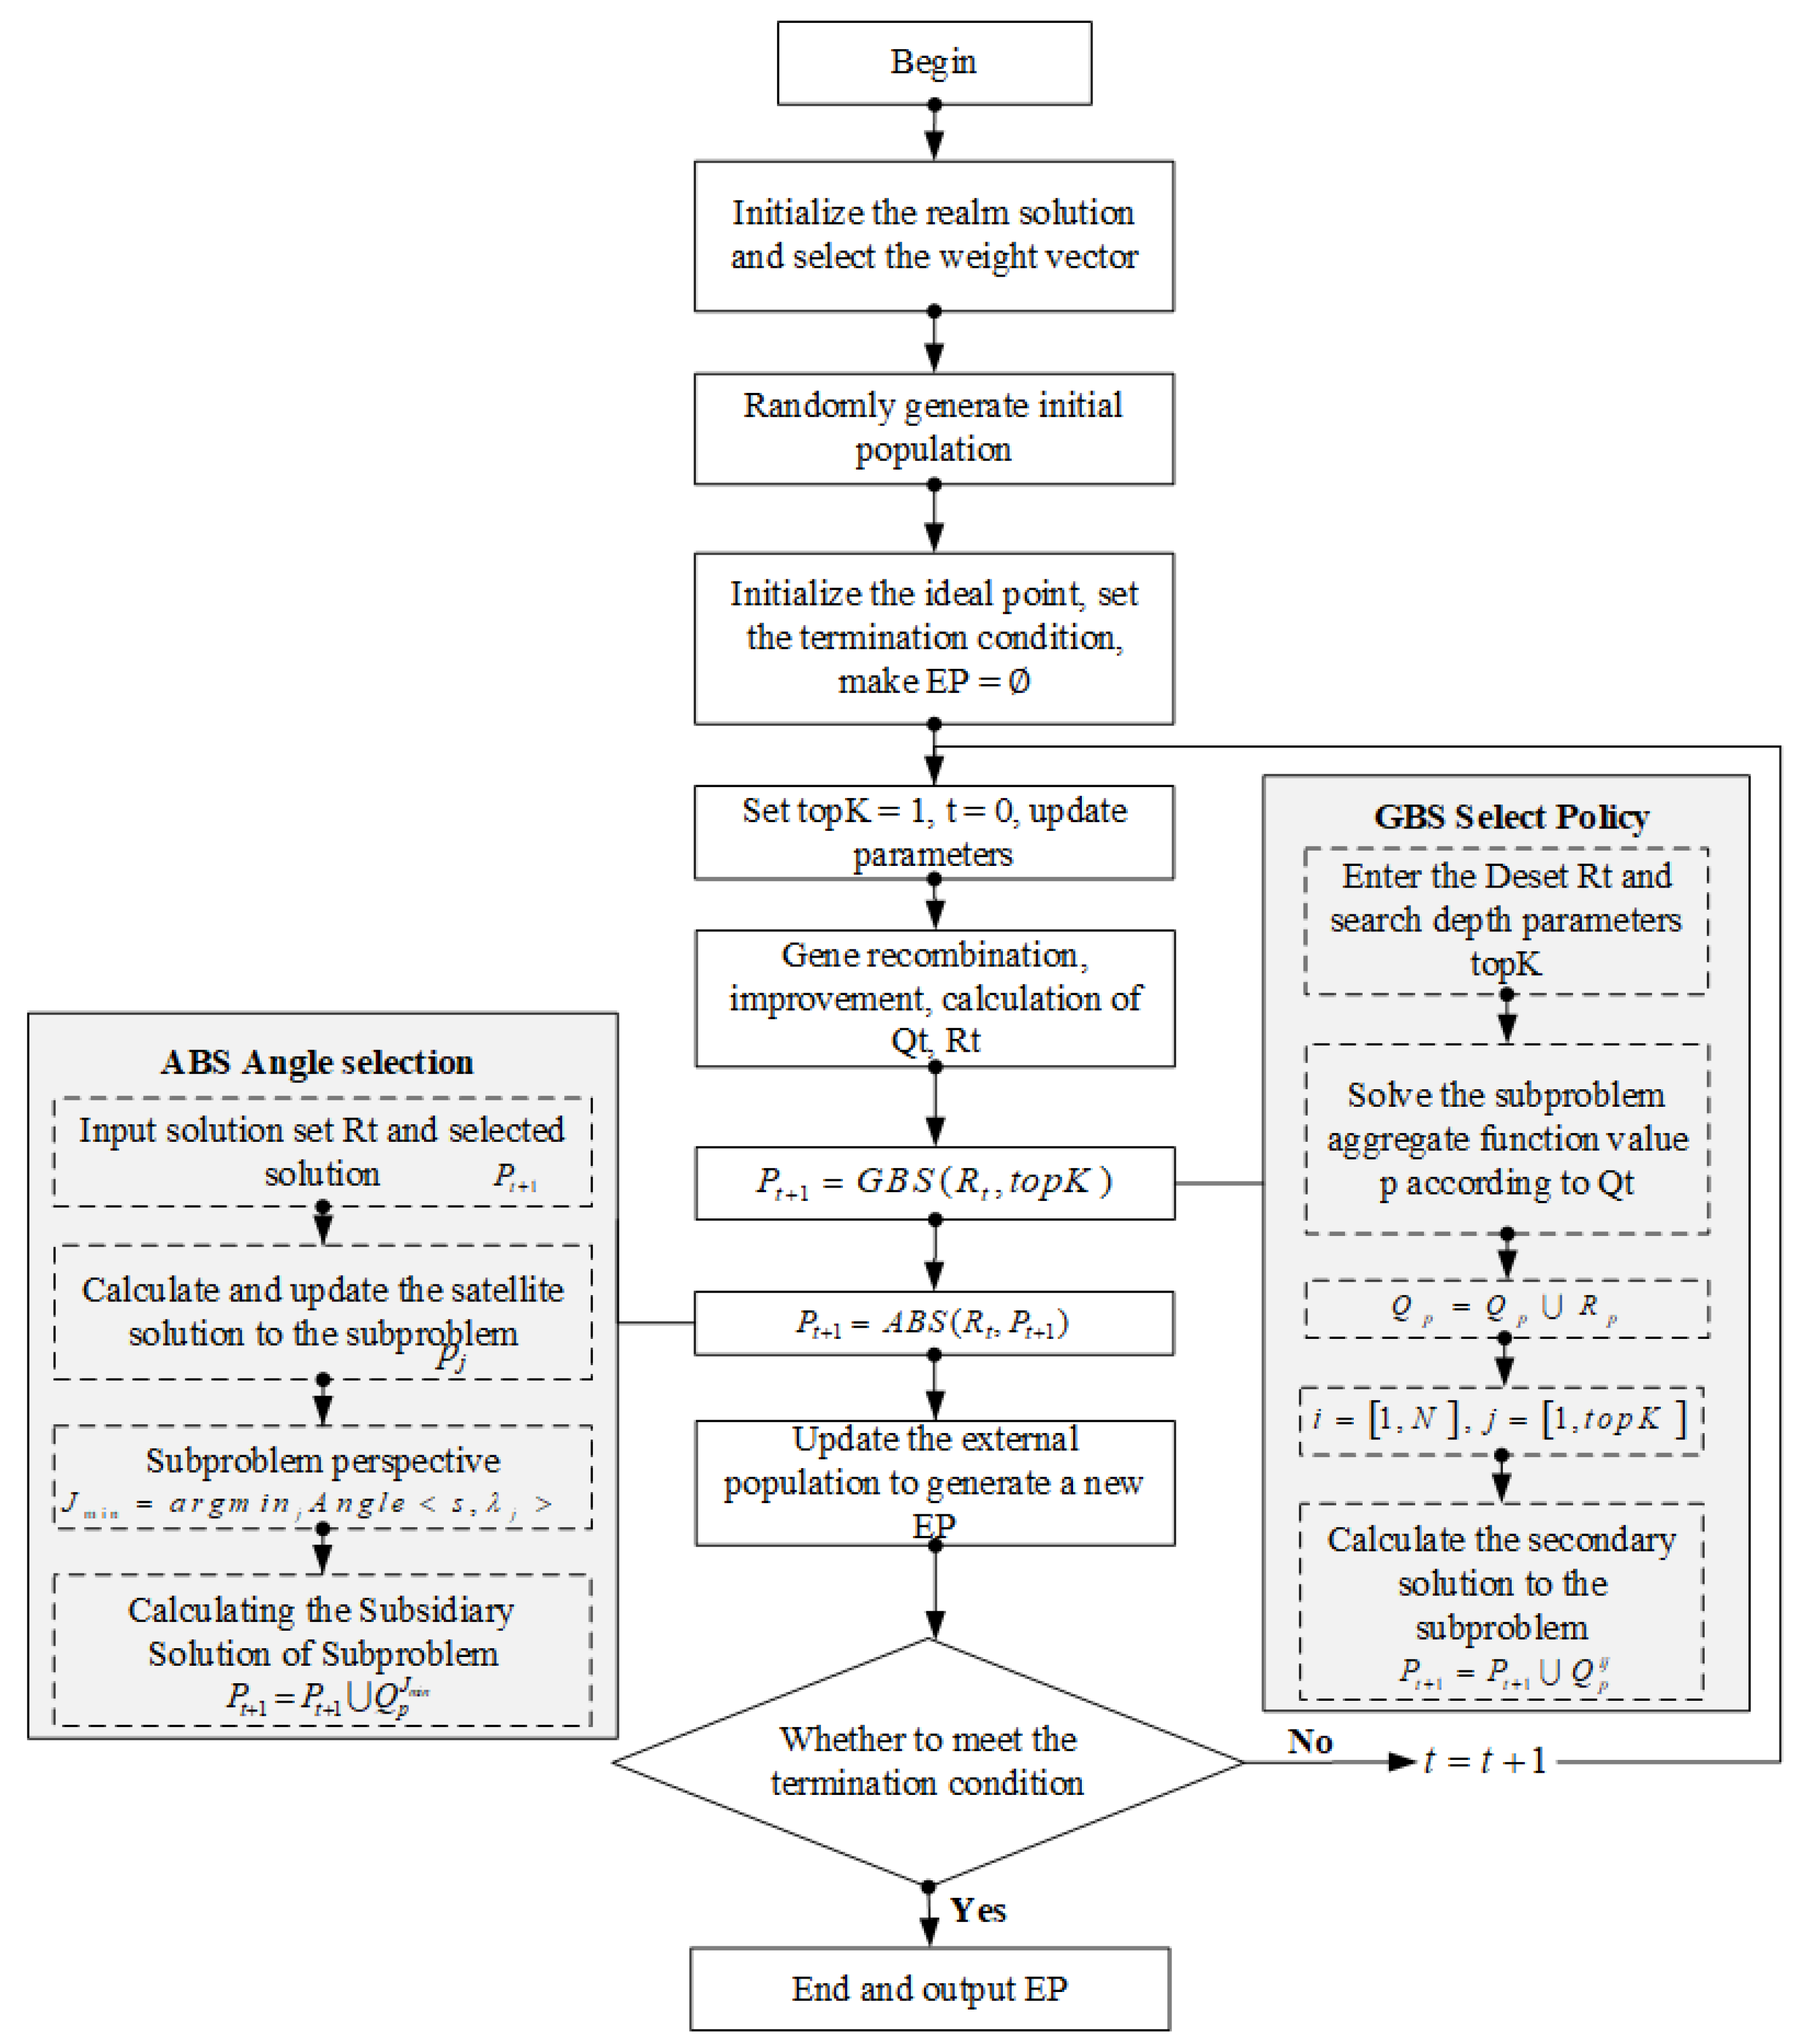
The classic MOEA/D works well for general MOP problems [34], but for complex multi-objective problems such as hydropower-photovoltaic joint scheduling, its replacement strategy may lose some characteristic solutions in the feasible region. Aiming at this problem, this paper adopts MOEA/D-GABS [35], a multi-objective evolutionary algorithm based on the greedy strategy. Different from the previous optimization methods, the framework of this algorithm adopts MOEA/D, including greedy-based selection (GBS) and angle-based selection (ABS). The greedy-based selection aims mainly to minimize the fitness function value of each sub-problem. In order to prevent over-optimization problems, a parameter is used to control the search depth of each sub-problem. The angle-based selection aims mainly to select a relatively sparse regional solution to maintain the distribution of the population when the maximum population number is not reached. The MOEA/D-GABS Algorithm 1 framework is as follows:
Algorithm 1 MOEA/D-GABS algorithm framework
Input: MOP, population size N;
Output: pareto non-dominated solution;
step 1: initialize. Weight vector T = λ 1 , λ 2 , , λ N , set of domains B ( i ) = ( i 1 , i 2 , , i T ) , initial population P 0 , ideal point Z * , ream E P = Φ ;
Step 2: update;
  2.1: t o p K = 1 , t = 0 , while t < M a x I t e r a t i o n , do;
  2.2: Q t = Re c o m b i n a t i o n + M u t a t i o n ( P t ) ;//Crossover, variation generate individual;
  2.3: R t = P t Q t ;
  2.4: P t + 1 = G B S ( R t , t o p K ) ;
  2.5: P t + 1 = A B S ( R t , P t + 1 ) ;
  2.6: t = t + 1 ;
Step 3: judging termination conditions; if the termination condition is satisfied, output EP, otherwise continue to execute Step 2.
In fact, for some confusing POF regions, general MOEA/D is difficult to obtain, but because MOEA/D-GABS solves the sub-problems in the whole process, the diversity distribution of POF will be better. The process of the MOEA/D-GABS algorithm is shown in Figure 9.
Obviously, the MOEA/D-GABS algorithm completely abandons the concept of non-dominant ordering and is an approximation to solving according to the decomposition method. At the same time, the idea of region division is also involved in each sub-problem. The solution is matched with its nearest sub-problem by ABS. The GBS algorithm guarantees the convergence of the solution as much as possible by sorting the aggregation function values of each sub-problem. In fact, in the early stage of evolution, the number of solutions selected by GBS is often lower than the population size N because of the extremely induced POF in some regions. Therefore, the ABS algorithm is used to enhance the distribution of the solution, which is also in line with the original intention of the algorithm design.

3.2. Solving the Process of Combined Hydropower–Photovoltaic Operation Based on an Improved Optimization Algorithm

In this paper, according to the possible inflow and photovoltaic output conditions, the high-dimensional MOEA/D-GABS optimization algorithm is used to obtain the non-inferior solution set. On this basis, the hedging mechanism decision is made for each feasible solution in the non-inferior solution set, and the hedging marginal benefit corresponding to each non-inferior solution is obtained. According to the optimal conditions of the hedging mechanism, all feasible states and schemes under constraints are decided, and finally the hydropower-photovoltaic joint scheduling scheme is formed. The solution process of hydropower–photovoltaic joint scheduling considering hedging rules is shown in Figure 10.

4. Results and Analysis

This paper takes a hydropower station in the upper reaches of the Yellow River in China and a photovoltaic station in Gansu Province as examples for example analysis. Among them, the hydropower station is located in the upper reaches of the basin and is a comprehensive reservoir with annual regulation capacity. The total reservoir capacity of the reservoir is 521 million cubic meters, the control basin area is 26,000 square kilometers, and the average annual flow rate is 275 cubic meters per second. The total installed capacity of the hydropower station is 300 MW and the maximum reference power generation flow is 1000 cubic meters per second. The reservoir is mainly power generation, with comprehensive utilization benefits such as flood control and industrial irrigation. The total installed capacity of photovoltaic is 100 MW. The photovoltaic field involved in the terrain is high, the annual air volume is sufficient, with a plateau continental climate. The first phase of the power station was connected to the grid in November 2013 with a capacity of 50 MW, the second phase was connected to the grid in June 2014 with a capacity of 50 MW, and the total installed capacity of the two phases was 100 MW. Table 2 shows the main technical indexes of reservoir hydropower station.
According to the actual operation of the reservoir for many years, the water level-storage capacity relationship of the reservoir is shown in Figure 11.
The example is mainly aimed at the joint dispatching process of regulation and storage and photovoltaic power generation in the water withdrawal stage of reservoir flood season, and the dispatching process in other periods (such as flood dispatching or profit dispatching) is executed according to the designed dispatching rules. It can be seen from the previous analysis that there is a contradictory relationship between the flood control risk value and the water storage benefit difference. When the pre-storage capacity increases, the water storage benefit difference will decrease and the flood control risk value will increase. At the same time, with the decrease in the pre-storage water, the power generation flow of the hydropower station increases. In order to ensure that the water is not abandoned or to reduce the water abandoned by the hydropower station in the flood season, and maximize the utilization of flood resources, the regulation ability of the hydropower station will also be affected, which will affect the volatility of the hydropower and photovoltaic joint dispatch. When the forecast uncertainty level increases or the acceptable risk decreases, the upper limit of the flood control level will decrease.
In this paper, under the existing forecast level, the runoff forecast error is set to follow the normal distribution ε N ( 2.2 , 19.71 2 ) and the downstream flood control acceptable risk is 0.075; the upper limit of flood limit water level control can be obtained as 695.12 m, where the simulated polynomial mutation (PM) and the binary crossover operator (SBX) of the MOEA/D-GABS algorithm are used to generate offspring individuals [36].
The implementation of the algorithm is completed on a ThinkPad T440p (4-core i5-4210M CPU 2.60 GHz frequency, 8 G running memory) notebook. The TCH aggregation method is used for decomposition [37]. The total population size N is set to 500; the number of decision variables is n; and the crossover probability ρ c and mutation probability ρ m are set to 1.0 and 1 / n , respectively. For the SBX operation, the distribution index η c is 30, the mutation distribution index η m is 20, the control parameter t o p K is 3, and the algorithm termination condition Fmax is 1000. In addition, the optimization algorithm obtains a set of non-inferior sets. When determining the optimal scheduling scheme, the hedging mechanism in time space established in this paper is needed to determine the optimal point in the Pareto front.
It can be seen from Figure 12 that, with the increase in pre-storage capacity, the target value of benefit difference decreases, the target value of downstream flood control risk increases, the hydropower generation decreases in the current period, and the ability of hydropower to regulate photovoltaic power generation decreases, which indirectly leads to the increase in system volatility. Therefore, there is an inverse proportional relationship between the reservoir benefit difference target and the flood control risk target, as well as between the benefit difference target and the joint output fluctuation target, while there is a positive proportional relationship between the flood control risk target and the joint output fluctuation target. According to the hedging mechanism decision strategy of the above joint scheduling, the intersection of the marginal benefit curves of the hydropower station and the photovoltaic power station is obtained through the hydropower–photovoltaic joint scheduling system as the optimal decision scheme under the hedging mechanism. Table 3 shows the target values of the optimal decision schemes under the optimal water storage benefit, optimal flood control risk, optimal joint output fluctuation, and optimal hedging mechanism.
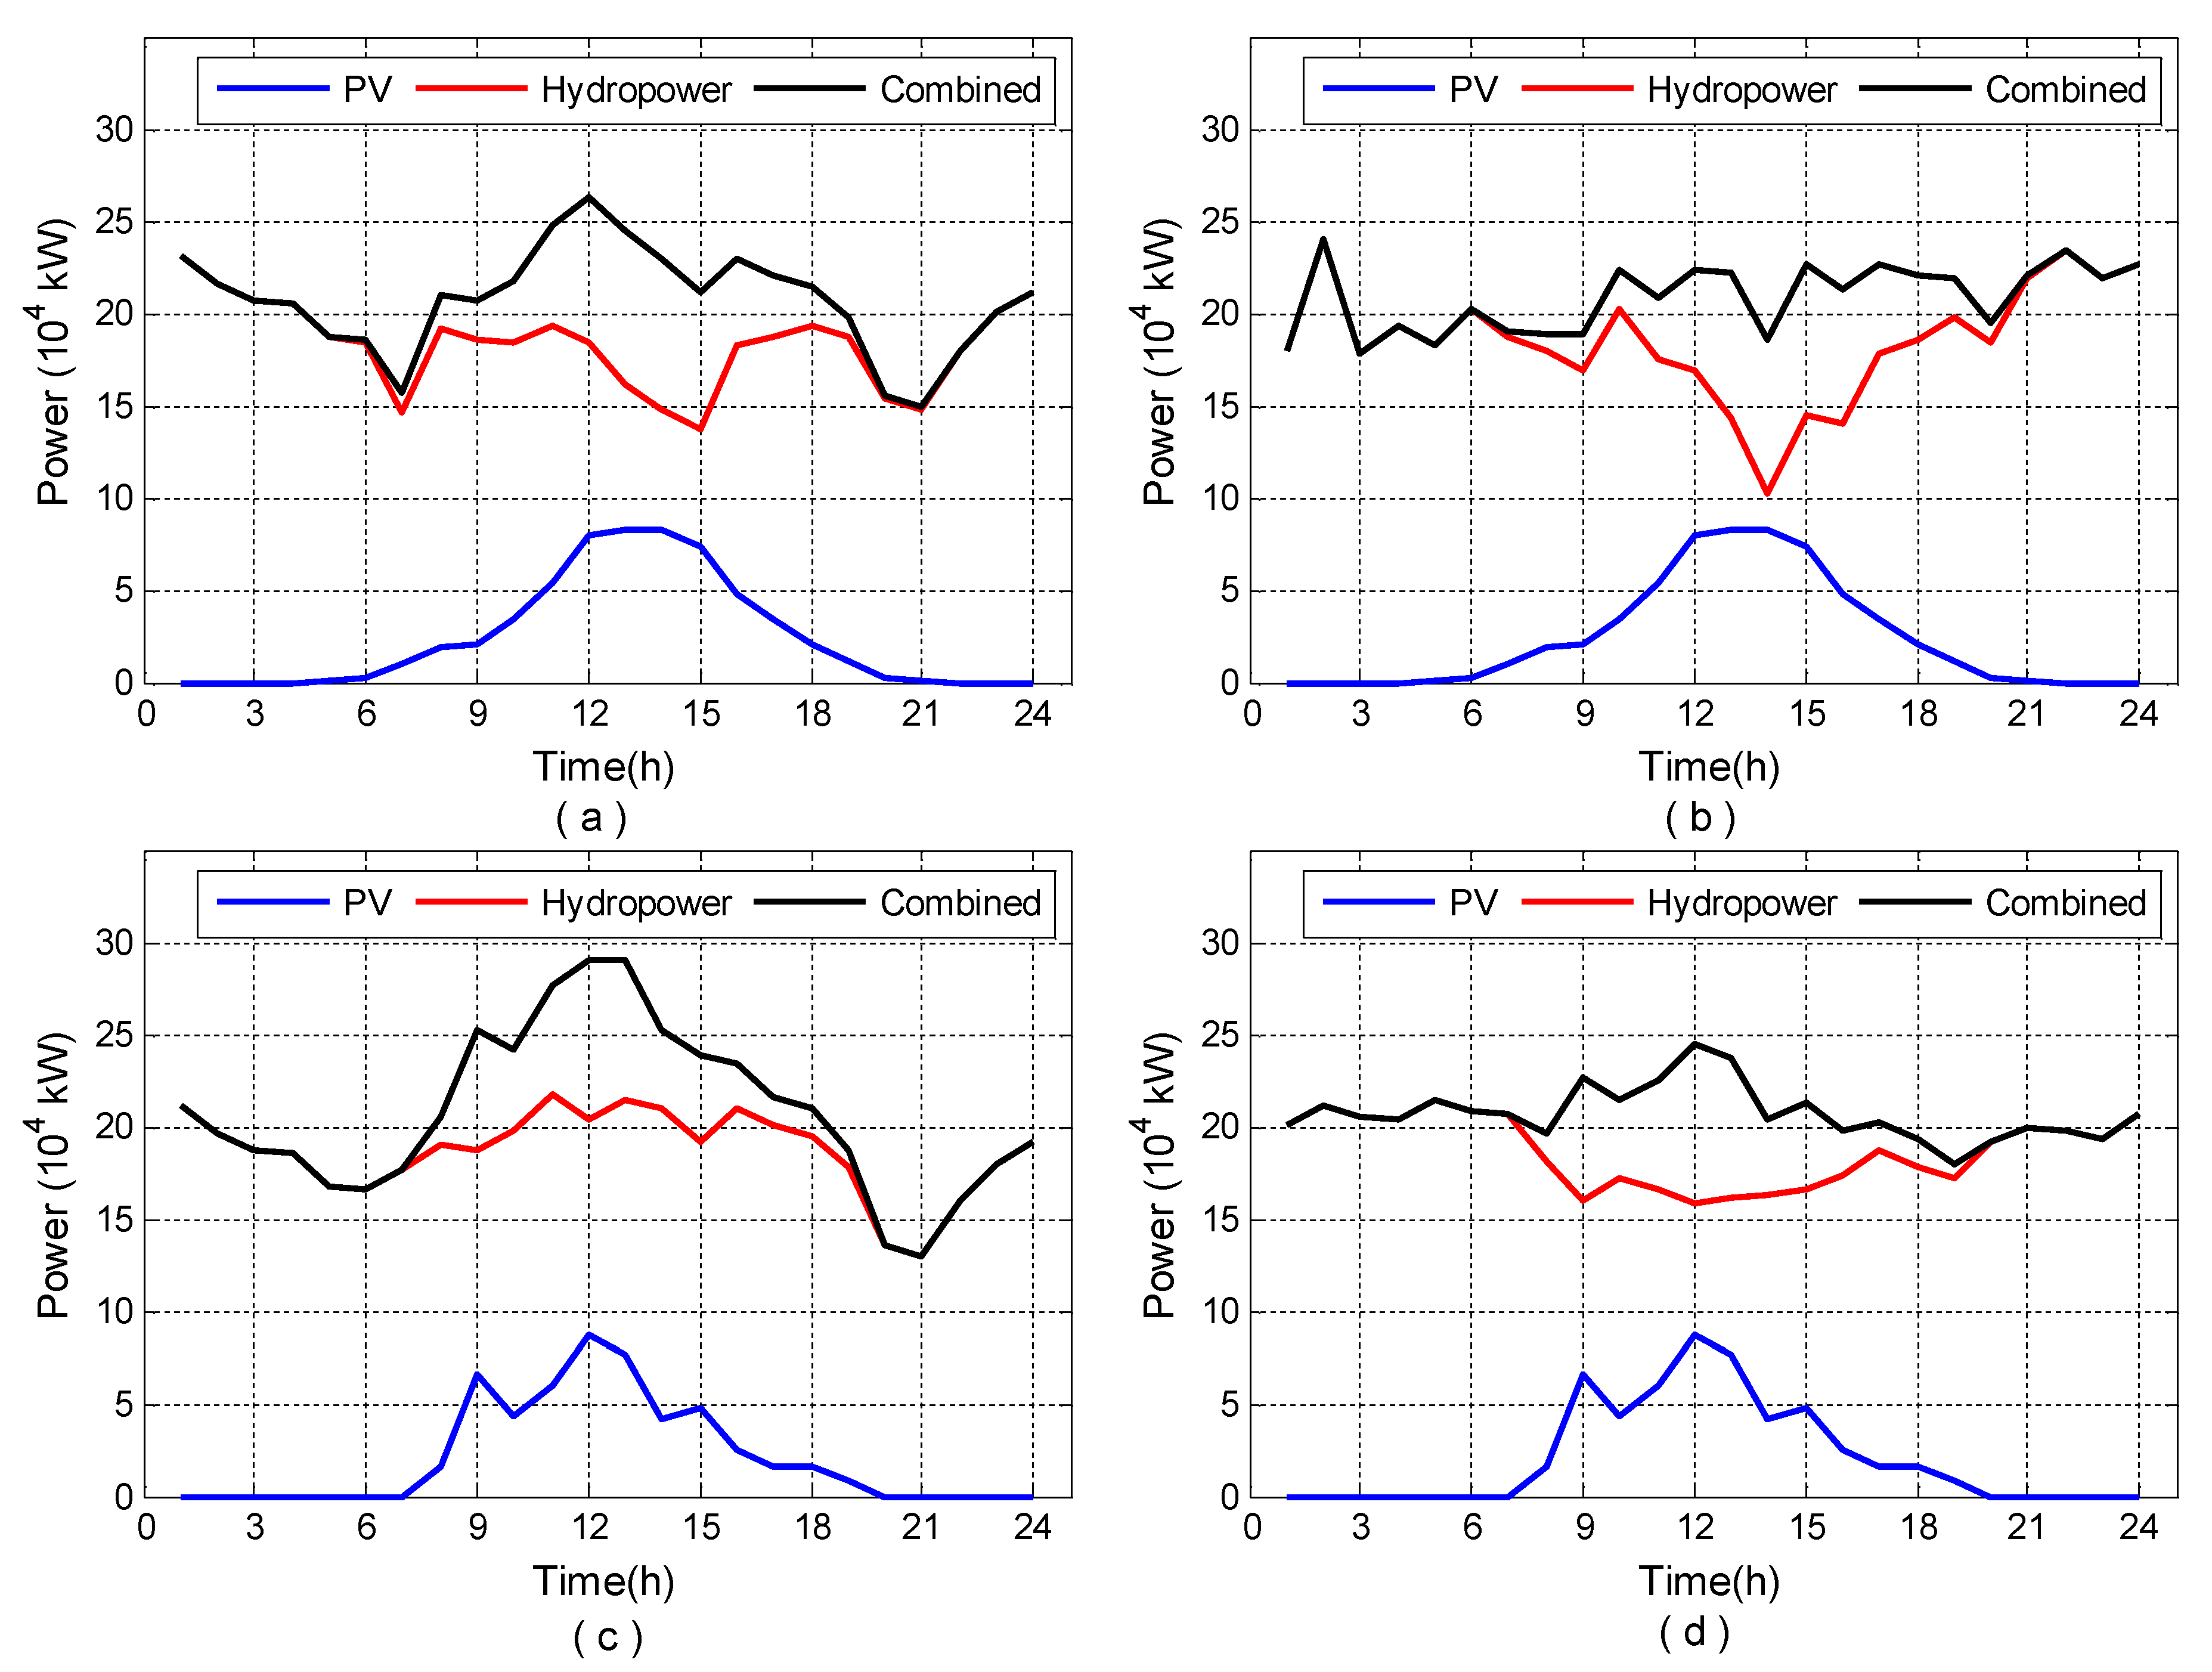
In order to verify the effectiveness of the hedging mechanism, a compromise optimization strategy is used to compare the effects. The compromise optimization strategy is solved by selecting the fuzzy membership function of the optimal solution on the Pareto front, and the solution with the highest satisfaction will be analyzed as a compromise solution. Figure 13 shows the comparison chart of the output process of the joint system corresponding to the traditional mode and hedging strategy under the typical scenarios of sunny and cloudy days.
As can be seen from Figure 13a,c, the traditional compromise optimization scheme under the typical sunny and cloudy scenarios is a compromise optimization in the Pareto solution set and the conflict problem is not optimized. Under the condition of full PV processing, the peak valley difference under the typical sunny scenario is 114,440 kW and the peak valley difference under the typical cloudy scenario is 161,010 kW. The main reason for the increase in the peak valley difference between cloudy and sunny days is the instability of photovoltaic output, which requires more regulation ability of other power generation types in the grid. The multi-objective hedging dispatching scheme proposed in this paper ensures the stability of water-light bundling power generation by making full use of the regulation capacity of the reservoir on the premise that downstream flood control is acceptable, storing water in the common storage capacity, and increasing hydropower output during 0–7 h and 20–24 h PV low-output periods. When photovoltaic output increases in 8 to 19 h, photovoltaic power generation is mainly consumed and hydropower output is reduced by water storage in the reservoir, so that the peak–valley difference of the combined system is low. The results are consistent under sunny and cloudy weather scenarios, as shown in Figure 13b,d. In order to further analyze the advantages of the hedging model proposed in this paper, the output extremum and peak valley difference of the hydropower photovoltaic joint system under typical scenarios of sunny and cloudy days are compared, as shown in Figure 14.
Figure 14a,b shows the peak valley difference of the output of the joint system corresponding to the traditional multi-objective compromise decision-making scheme and the decision-making scheme under the hedging mechanism in the typical scenarios of sunny and cloudy days, respectively. It can be seen that the optimal dispatching model considering multi-objective hedging makes full use of the regulation and storage function of the reservoir and effectively reduces the peak valley difference of the output of the combined system, and the joint output curve of hydropower and photovoltaic power is more stable, which is of positive significance for the traditional uncertain photovoltaic grid connection consumption. Table 4 shows the results of the peak valley difference of output of the combined system under the two schemes.
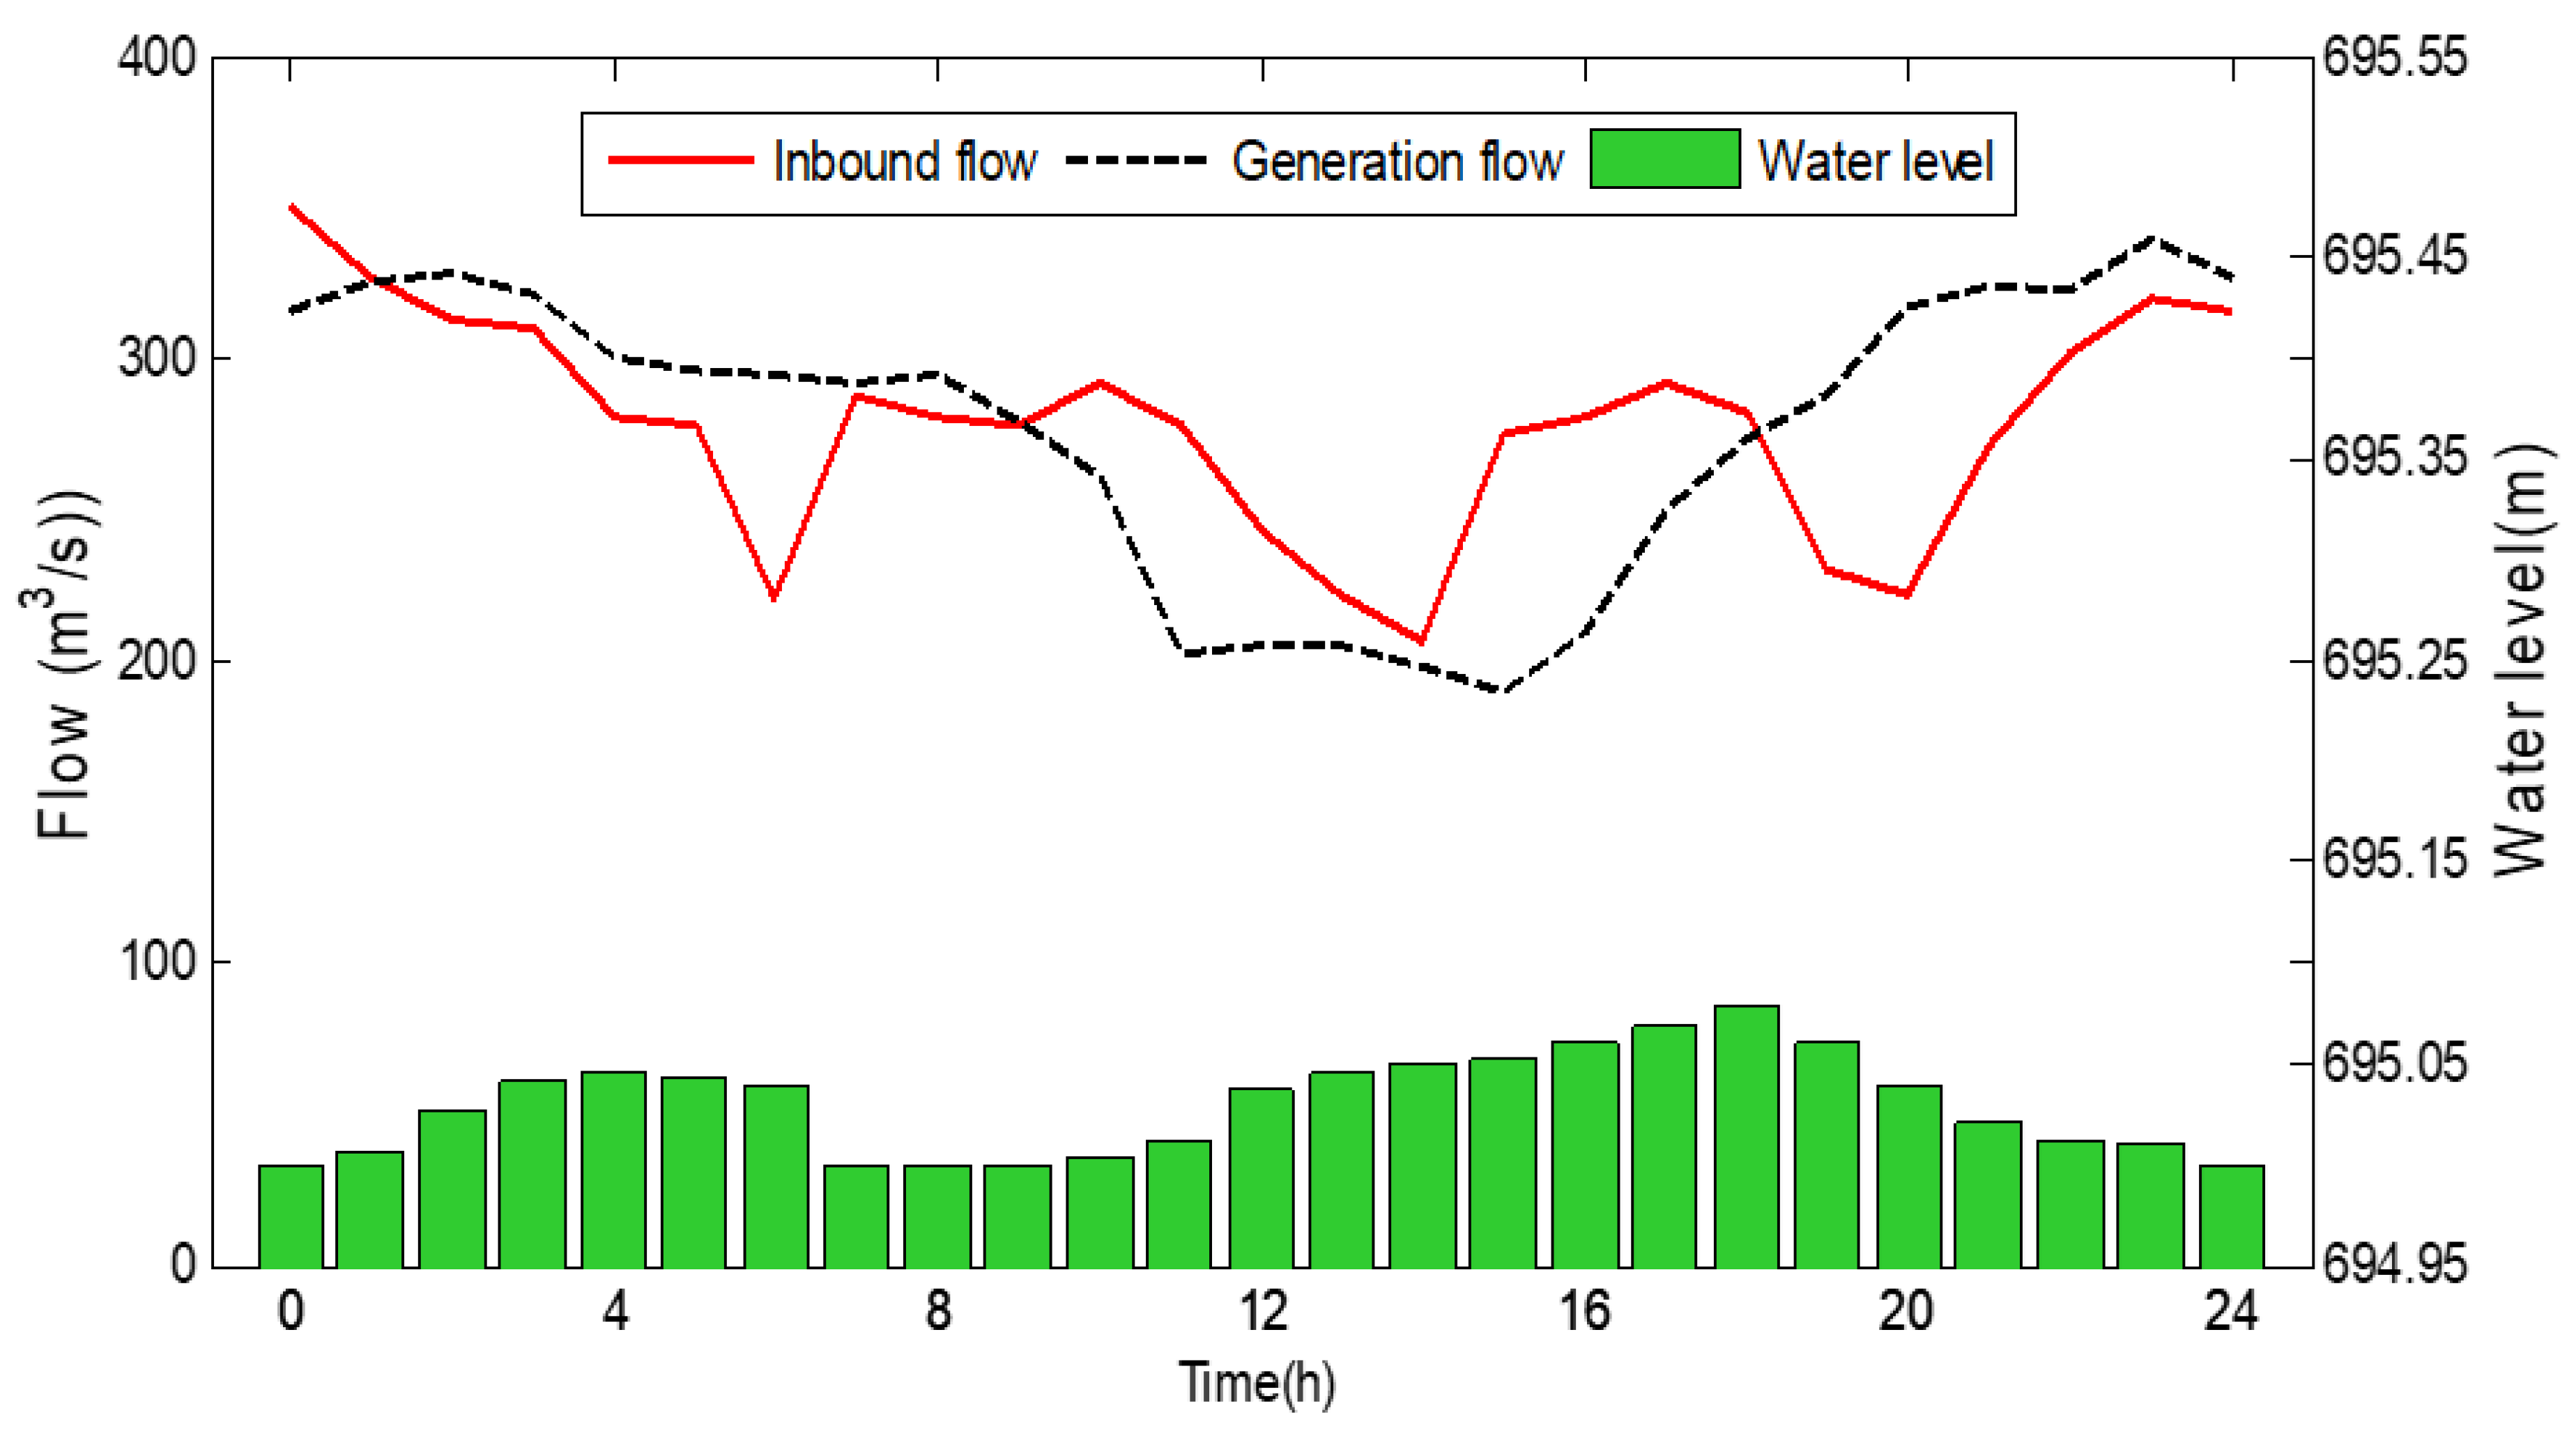
It can be seen from the above table that the output of the hydropower photovoltaic combined system in the traditional scheme under the typical sunny day scenario is 5,004,670 kW and the output of the hydropower photovoltaic combined system with hedging is 4,979,970 kW. However, the peak valley difference of the system under the hedging scheme is 50.67% lower than that under the traditional scheme. In the typical scenario of a cloudy day, the output of the hydro-photovoltaic combined system of the traditional scheme is 4.97955 million kW and the output of the hydro-photovoltaic combined system with hedging is 4.97166 million kW. However, the peak–valley difference of the system under the hedging scheme is 59.68% lower than that under the traditional scheme, which effectively improves the stability of the combined system and makes the grid-connected system more friendly. In order to analyze the process of reservoir water level change by the hedging mechanism scheduling scheme established in this paper, Figure 15 shows the change process of reservoir water level, inflow, and power generation flow based on the hedging scheme in typical sunny scenarios.
As can be seen from Figure 15, when the water level of the reservoir is lower than the flood limit water level of 695.00 m, the power generation will be operated according to the power generation needs and the excess water will be filled into the reservoir until the water level of the reservoir reaches the limit water level of 695.00 m in the flood season. When the water level of the reservoir has reached the flood season limit water level of 695.00 m, after the power generation is operated according to the power generation needs, in order to ensure the safety of flood prevention, all of the excess water is discharged, resulting in a waste of water resources. It can be seen that, in a scheduling cycle, the reservoir uses the shared storage to raise the water level from the designed flood control level of 695 m to the controllable upper limit of the flood control level of 695.12 m and reduces the water level to the designed flood control level during the effective forecast period, so as to always maintain the flood control risk under control and increase the benefit.

5. Conclusions

In this paper, the marginal benefit hedging rule in economics is introduced to solve multi-objective conflict problems such as reservoir water storage benefit, downstream flood control risk, and photovoltaic power generation benefit in the hydropower photo-voltaic joint operation system. Based on the hedging theory, a hydropower photovoltaic joint optimization model is established with the goal of minimizing flood control risk, optimizing water storage benefit, and minimizing photovoltaic power generation fluctuation, taking into account the uncertainty of forecast. An improved MOEA/D-GABS algorithm with selection strategy is proposed to solve the multi-objective optimization problem of the model. Through case analysis, the scheduling results of the proposed scheme and the traditional scheme under typical scenarios of sunny and cloudy days are compared:
(1) Compared with the traditional multi-objective decision-making scheme, the method proposed in this paper controls the flood control risk of the reservoir in each period at not higher than 1.63 × 10⁻³ (the flood control standard corresponding to the 50 year flood control risk is 0.006), increases the flood limit level of the reservoir from 583.00 m to 583.70 m, improves the benefit of the reservoir, and effectively improves the utilization rate of water resources.
(2) The proposed method reduces the peak–valley difference of the combined system by 50.67% and 59.68% compared with the traditional scheme under the typical scenarios of sunny and cloudy days, respectively, which greatly reduces the uncertainty of photovoltaic output and improves the stability of the combined system.
The results show that the proposed method can improve the water storage efficiency of the reservoir and the output stability of the hydropower photovoltaic joint system on the basis of ensuring the flood control safety of the reservoir and provide a decision-making basis for the hydropower and photovoltaic joint dispatching scheme.

Author Contributions

T.X. and G.Z. conceived and designed the experiments; T.X. and H.L. performed the experiments and wrote the paper; G.Z. and P.L. analyzed the data; H.L. and K.Z. contributed reagents/materials/analysis tools. All authors have read and agreed to the published version of the manuscript.

Funding

This research was Supported by Open Fund of State Key Laboratory of Operation and Control of Renewable Energy and Storage Systems (China Electric Power Research Institute) (No.NYB51202101991).

Institutional Review Board Statement

Not applicable.

Informed Consent Statement

Not applicable.

Data Availability Statement

Not applicable.

Conflicts of Interest

The authors declare no conflict of interest.

References

  1. Sun, C.; Wang, Y.; Li, X. study on combined operation of hydro and wind power generation system. Acta Energ. Sol. Sin. 2009, 30, 232–236. [Google Scholar]
  2. Angarita, J.M.; Usaola, J.G. Combining hydro-generation and wind energy: Biddings and operation on electricity spot markets. Eletr. Power Syst. Res. 2007, 77, 393–400. [Google Scholar] [CrossRef] [Green Version]
  3. Yu, Z.; Wan, S.; Ming, Z.; Zhang, Y.; Deng, M. Optimal Operation of Complementary Microgrid with Hybrid Wind-Solar-Hydro Power. Electr. Equip. 2014, 35, 50–55. [Google Scholar]
  4. Migoni, G.; Rullo, P.; Bergero, F.; Kofman, E. Efficient simulation of Hybrid Renewable Energy Systems. Int. J. Hydrogen Energy 2016, 41, 13934–13949. [Google Scholar] [CrossRef] [Green Version]
  5. Bekele, G.; Tadesse, G. Feasibility study of small Hydro/PV/Wind hybrid system for off-grid rural electrification in Ethiopia. Appl. Energy 2012, 97, 5–15. [Google Scholar] [CrossRef]
  6. Beluco, A.; Souza, P.K.D.; Krenzinger, A. A method to evaluate the effect of complementarity in time between hydro and solar energy on the performance of hybrid hydro PV generating plants. Renew. Energy 2012, 45, 24–30. [Google Scholar] [CrossRef]
  7. Zuo, T.; Yang, J.; Shao, B. Multi-objective Optimal Design of Hybrid Wind-Hydro-Solar Power Generation System. J. Agric. Mech. Res. 2009, 31, 25–28. [Google Scholar]
  8. Kang, C.; Yao, L. Key Scientific Issues and Theoretical Research Framework for Power Systems with High Proportion of Renewable Energy. Autom. Electr. Power Syst. 2017, 41, 2–11. [Google Scholar]
  9. Zhang, Z.; Du, Y.; Cui, H.; Wang, Y.; He, Z.; Lai, X. Intelligent mid-long electricity load forecast method considering associated factors. Power Syst. Prot. Control 2019, 47, 24–30. [Google Scholar]
  10. Li, J.; Wang, C.; Lin, S.; Du, P. Load forecasting of point load in the near and medium term and the analysis of industry load growth characteristics based on big data platform. Power Syst. Big Data 2020, 23, 17–25. [Google Scholar]
  11. Liu, P.-h.; Yuan, T.-j.; Mei, S.-w.; Tuerxun, Y.; Zhao, L. Short-term Power Prediction of PV Based on Combined BP GA Neural Network. Water Resour. Power 2016, 34, 211–214. [Google Scholar]
  12. Cui, Y.; Chen, Z.; Xu, P. Short-Term Power Prediction for Wind Farm and Solar Plant Clusters Based on Machine Learning Method. Electr. Power 2020, 53, 1–7. [Google Scholar]
  13. Ren, L.; Fu, Y.; Wang, B.; Song, T.; Zhao, F. Optimal Power Prediction of Wind Power Storage Combined Power Generation System Considering Economic Benefits. J. Northeast Dianli Univ. 2020, 40, 16–25. [Google Scholar]
  14. Li, L.L.; Wen, S.Y.; Tseng, M.L.; Wang, C.S. Renewable energy prediction: A novel short-term prediction model of photovoltaic output power. J. Clean. Prod. 2019, 359–375. [Google Scholar] [CrossRef]
  15. Martin, L.; Zarzalejo, L.F.; Polo, J.; Navarro, A.; Marchante, R.; Cony, M. Prediction of global solar irradiance based on time series analysis: Application to solar thermal power plants energy production planning. Sol. Energy. 2010, 84, 1772–1781. [Google Scholar] [CrossRef]
  16. Guo, F. Probabilistic Prediction Analysis and Research of Wind Power Based on Bayesian Method. Master’s Thesis, North China Electric Power University, Beijing, China, 2019. [Google Scholar]
  17. Li, R.-r.; Dai, Y. Short-Term Wind Speed Prediction Based on Short and LongTime Memory Network and Time Series Analysis Method. Comput. Simul. 2020, 37, 393–398. [Google Scholar]
  18. Massé, P. Les Reserves et la Regulation de l’Avenir Dans la vie Economique; Avenir Determine, Hermann and Cie: Paris, France, 1946; Volume 1. (In French) [Google Scholar]
  19. Srinivasan, K.; Philipose, M.C. Evaluation and selection of hedging policies using reservoir simulation. Water Resour. Manag. 1996, 10, 163–188. [Google Scholar] [CrossRef]
  20. You, J.; Cai, X. Hedging rule for reservoir operations: 2. A numerical model. Water Resour. Res. 2008, 44, W1416. [Google Scholar] [CrossRef]
  21. You, J.; Cai, X. Hedging rule for reservoir operations: 1. A theoretical analysis. Water Resour. Res. 2008, 44, W1415. [Google Scholar] [CrossRef]
  22. Zhao, T.; Zhao, J.; Lund, J.R.; Yang, D. Optimal Hedging Rules for Reservoir Flood Operation from Forecast Uncertainties. J. Water Resour. Plan. Manag. 2014, 140, 4014041. [Google Scholar] [CrossRef]
  23. Ahmadianfar, I.; Adib, A. Optimization of Fuzzified Hedging Rules for Multipurpose and Multireservoir Systems. Hydrol. Eng. 2016, 21, 55–69. [Google Scholar] [CrossRef]
  24. Tan, Q.-f.; Wang, X. Derivation of optimal joint operating rules for multi-purpose multi-reservoir water-supply system. J. Hydrol. 2017, 551, 253–264. [Google Scholar] [CrossRef]
  25. Huang, C.; Zhao, J. Optimal Hedging Rules for Two-Objective Reservoir Operation: Balancing Water Supply and Environmental Flow. Water Resour. Plan. Manag. 2016, 142, 16053. [Google Scholar] [CrossRef]
  26. Dosi, C.; CapacityMoretto, M. Inter-BasinTransfers Under Uncertainty: Storageand Optimal Guaranteed Deliveries. Environ. Resour. Econ. 1994, 4, 331–352. [Google Scholar] [CrossRef]
  27. Hashimoto, T.; Stedinger, J.R.; Loucks, D.P. Reliability, Resiliency, and Vulnerability Criteria for Water Resource System Performance Evaluation. Water Resour. Res. 1982, 18, 14–20. [Google Scholar] [CrossRef] [Green Version]
  28. Shiau, J. Optimization of Reservoir Hedging Rules Using Multiobjective Genetic Algorithm. J. Water Resour. Plan. Manag. 2009, 135, 355–363. [Google Scholar] [CrossRef]
  29. Shiau, J.T.; Lee, H.C. Derivation of Optimal Hedging Rules for a Water-supply Reservoir through Compromise Programming. Water Resour. Manag. 2005, 19, 111–132. [Google Scholar] [CrossRef]
  30. Tu, M.Y.; Hsu, N.S.; Yeh, W.W.G. Optimization of Reservoir Management and Operation with Hedging Rules. J. Water Resour. Plan. Manag. 2003, 129, 86–97. [Google Scholar] [CrossRef]
  31. Tu, M.Y.; Hsu, N.S.; Tsai, F.T.C.; Yeh, W.W.G. Optimization of Hedging Rules for Reservoir Operations. J. Water Resour. Plan. Manang. 2008, 134, 3–13. [Google Scholar] [CrossRef]
  32. Tian, S.; Zhao, Z.; Du, S. Energy-saving optimal scheduling based on improved multiobjective differential evolution algorithm. Eng. J. Wuhan Univ. 2019, 52, 1091–1096+1105. [Google Scholar]
  33. Das, I.; Dennis, J.E. Normal-Boundary Intersection: A New Method for Generating the Pareto Surface in Nonlinear Multicriteria Optimization Problems. Siam J. Optim. 1998, 8, 631–657. [Google Scholar] [CrossRef]
  34. Wang, Y.; Liu, H.; Wei, F.; Zong, T.; Li, X. Cooperative Co-evolution with Formula-based VariableGrouping for Large-Scale Global Optimization. Evol. Comput. 2017, 26, 569–596. [Google Scholar] [CrossRef] [PubMed]
  35. Zhang, Q. Research on Multi-Objective Evolutionary Algorithm Based on Decomposition Thought. Master’s Thesis, Hunan University, Changsha, China, 2018. [Google Scholar]
  36. Gong, D.-W.; Liu, Y.-P.; Sun, X.-Y.; Han, Y.-Y. Parallel Many-objective Evolutionary Optimization Using Objectives Decomposition. IEEE CAA J. Autom. Sin. 2015, 41, 1438–1451. [Google Scholar]
  37. Li, K.; Deb, K.; Zhang, Q.; Kwong, S. An Evolutionary Many-Objective Optimization Algorithm Based on Dominance and Decomposition. IEEE Trans. Evol. Comput. 2015, 19, 694–716. [Google Scholar] [CrossRef]
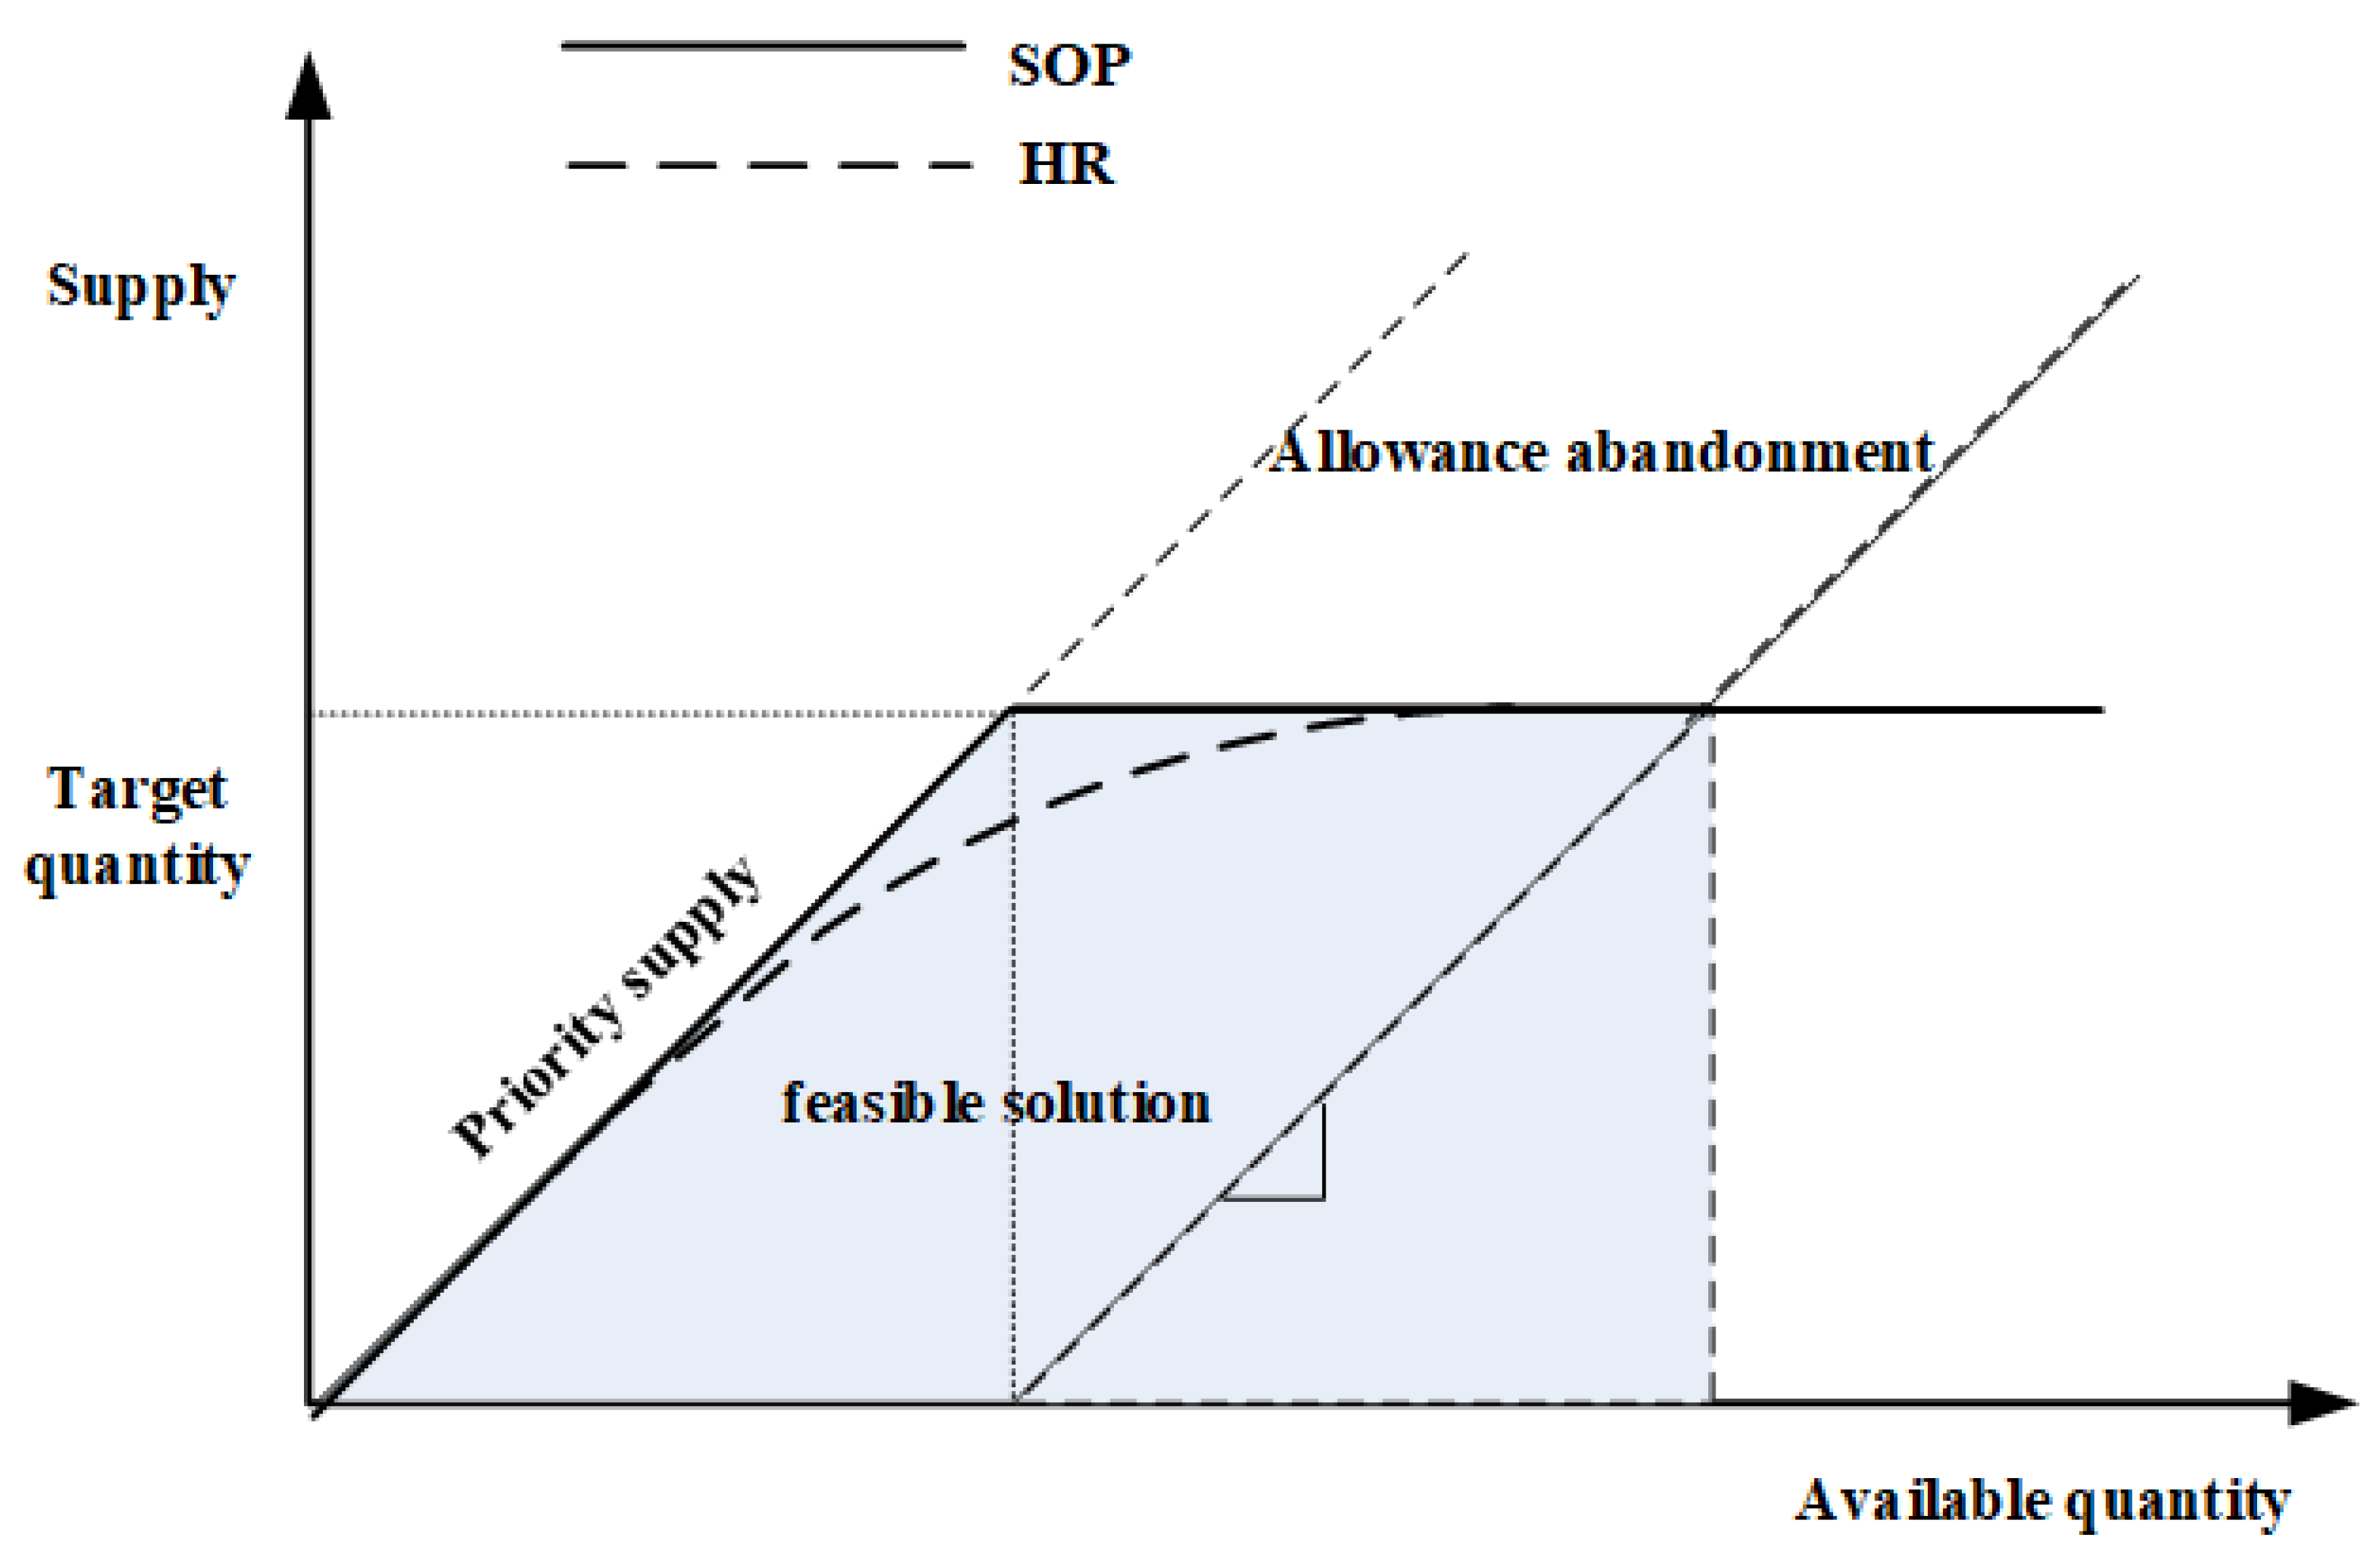
Figure 1. Standard operating policy (SOP) and hedging regulation (HR).
Applsci 12 11348 g001
Figure 2. Multi-objective conflict of hydropower and photovoltaic joint dispatching.
Applsci 12 11348 g002
Figure 3. Rolling updating mechanism of the hydropower and photovoltaic combined generation scheduling model.
Applsci 12 11348 g003
Figure 4. Schematic diagram of multi-objective decision-making in the two-stage for hydropower and photovoltaic joint power generation.
Applsci 12 11348 g004
Figure 5. Diagram of the relationship between water volume storage in advance and added value of benefit in stage 1.
Applsci 12 11348 g005
Figure 6. Diagram of the relationship between combined inflow and downstream flood control risk rate in stage 2.
Applsci 12 11348 g006
Figure 7. The best solution for reservoir impoundment and benefit when when f 1 = f 2 .
Applsci 12 11348 g007
Figure 8. The best solution for hydropower photovoltaic power generation when f 1 = f 2 .
Applsci 12 11348 g008
Figure 9. The flow chart of the MOEA/D-GABS algorithm.
Applsci 12 11348 g009
Figure 10. Hydropower photovoltaic joint dispatch in a flow chart based on the MOEA/D-GABS algorithm.
Applsci 12 11348 g010
Figure 11. Characteristic curve of the hydropower station: (a) reservoir water level—storage capacity and (b) downstream water level—discharge flow.
Applsci 12 11348 g011
Figure 12. Pareto frontier of the scheduling scheme considering system output volatility. (a) Pareto frontier under three objectives. (b) Pareto frontier under two objectives.
Applsci 12 11348 g012
Figure 13. The output of the hydropower, photovoltaic, and joint system under a compromise solution. (a) Traditional solution for typical sunny day scenarios. (b) Hedging solution for typical sunny day scenarios. (c) Traditional solution for typical cloudy day scenarios. (d) Hedging solution for typical cloudy day scenarios.
Applsci 12 11348 g013
Figure 14. The comparison of hydropower and photovoltaic joint output’s volatility under the two schemes. (a) Comparison of peak valley difference between the traditional methods and hedging strategies in typical sunny day scenarios (b) Comparison of peak valley difference between the traditional methods and hedging strategies in typical cloudy day scenarios.
Applsci 12 11348 g014
Figure 15. Diagram of reservoir water level and flow change process under the optimization operation plan.
Applsci 12 11348 g015
Table 1. Decision variables of combined hydropower and photovoltaic power generation.
Stage kStage 1: Decision Stage Δ T Stage 2: Remaining Stage Δ T
Forecast water inflow Q Q 1 a , Q 1 a b , Q 1 b Q 2 a , Q 2 a b , Q 2 b
Regulatory decisions D, NReservoir discharge D1
PV power generation N1
Reservoir discharge D2,
PV power generation N2
Pre-storage capacity WInitial W0, end W1Initial W1, end W2
Storage of reservoir VInitial V0, end V1Initial V1, end V2
Flood control objectives R R 1 b R 2 b
Profitable target BBB
Combined output target GG1G2
Table 2. The parameter table of the hydropower station.
Catchment area
(104 km2)
Aggregate storage capacity (108 m3)Regulating storage (108 m3)Read storage
(108 m3)
Flood storage
(108 m3)
2.65.212.212.291.91
Firm output
(MW)
Maximum reference traffic (m3/s)Installed capacity (MW)Mean annual energy production (108 kWh)Annual runoff
(108 m3)
7.8100030014.6386.72
Check flood level
(m)
Design flood level
(m)
Normal water level (m)Flood limited water level (m)Dead water level
(m)
708.8703.3704695685
Table 3. The comparison of the optimization goal in the Pareto frontier.
TargetOptimal Water
Storage Benefit
Decision Scheme
Optimal Flood Risk Decision SchemeOptimal Volatility Decision SchemeUnder Hedging
Mechanism Decision Scheme
Water storage benefit
difference
1.24 × 10−31.16 × 10−22.57 × 10−31.92 × 10−3
Flood risk value9.07 × 10−33.04 × 10−36.47 × 10−34.11 × 10⁻³
Joint output fluctuation value6.67 × 10−09.59 × 1002.38 × 1005.64 × 100
Table 4. Hydropower and photovoltaic joint output fluctuation value under the two schemes (104 kW).
TypeTypical Scenes in Sunny DaysTypical Scenes in Cloudy Days
Traditional SchemeHedging SchemeTraditional SchemeHedging Scheme
Photovoltaic output57.5549.96
Hydropower output442.917440.447447.997447.207
joint output500.4670497.997497.955497.166
Maximum joint output26.34123.46228.99824.513
Minimum joint output14.89717.81712.89718.021
Peak valley difference11.4445.64516.1016.492
Publisher’s Note: MDPI stays neutral with regard to jurisdictional claims in published maps and institutional affiliations.