
Advanced Strategies for Mitigating Particulate Matter Generations in Poultry Houses


Abstract
1. Introduction
2. Dust Composition and Mixture

| Sources | PM Type | PM Constitute | References |
|---|---|---|---|
| Broilers | TSP | Feathers, skin, bacteria, fungus, fecal matter, spilled feed, mold spores, and bedding fragments | [16] |
| Broilers | PM2.5 PM10 | 72.1% manure, 21.3% feathers, 5.8% wood shaving, and 0.7% ambient PM 95.6% manure and 4.4% feathers | |
| Layers | PM2.5 PM10 | 63.7% manure and 36.3% feathers 69.6% manure, 30.0% feathers, and 0.4% ambient PM | [17] |
| Layers | PM2.5 PM10 | 54.2% manure, 23.2% feed, 17.0% feathers, and 5.5% ambient PM 85.5% manure and 14.5% feathers | |
| Turkey | PM2.5 PM10 | 39.1% feathers, 34.8% manure, 26.1% wood shavings, and 0.1% ambient PM 51.9% manure, 25.1% feathers, and 22.9% wood shavings | |
| Broilers | TSP | 50% excreta, 30% litter, 15% feed, and 5% feathers | [18] |
| Poultry | TSP | 90% organic composition like a feather, feeds, urine mineral crystal, manure, and bedding materials | [25] |
| Poultry | TSP | Organic and inorganic particles: excreta, feathers, mites, dander, bacteria, fungi, fungal spores, and endotoxins | [33] |
| Poultry | TSP | Bedding materials and floor | [34] |
| Poultry | TSP | Feed, excreta, hair, and dander | [35] |
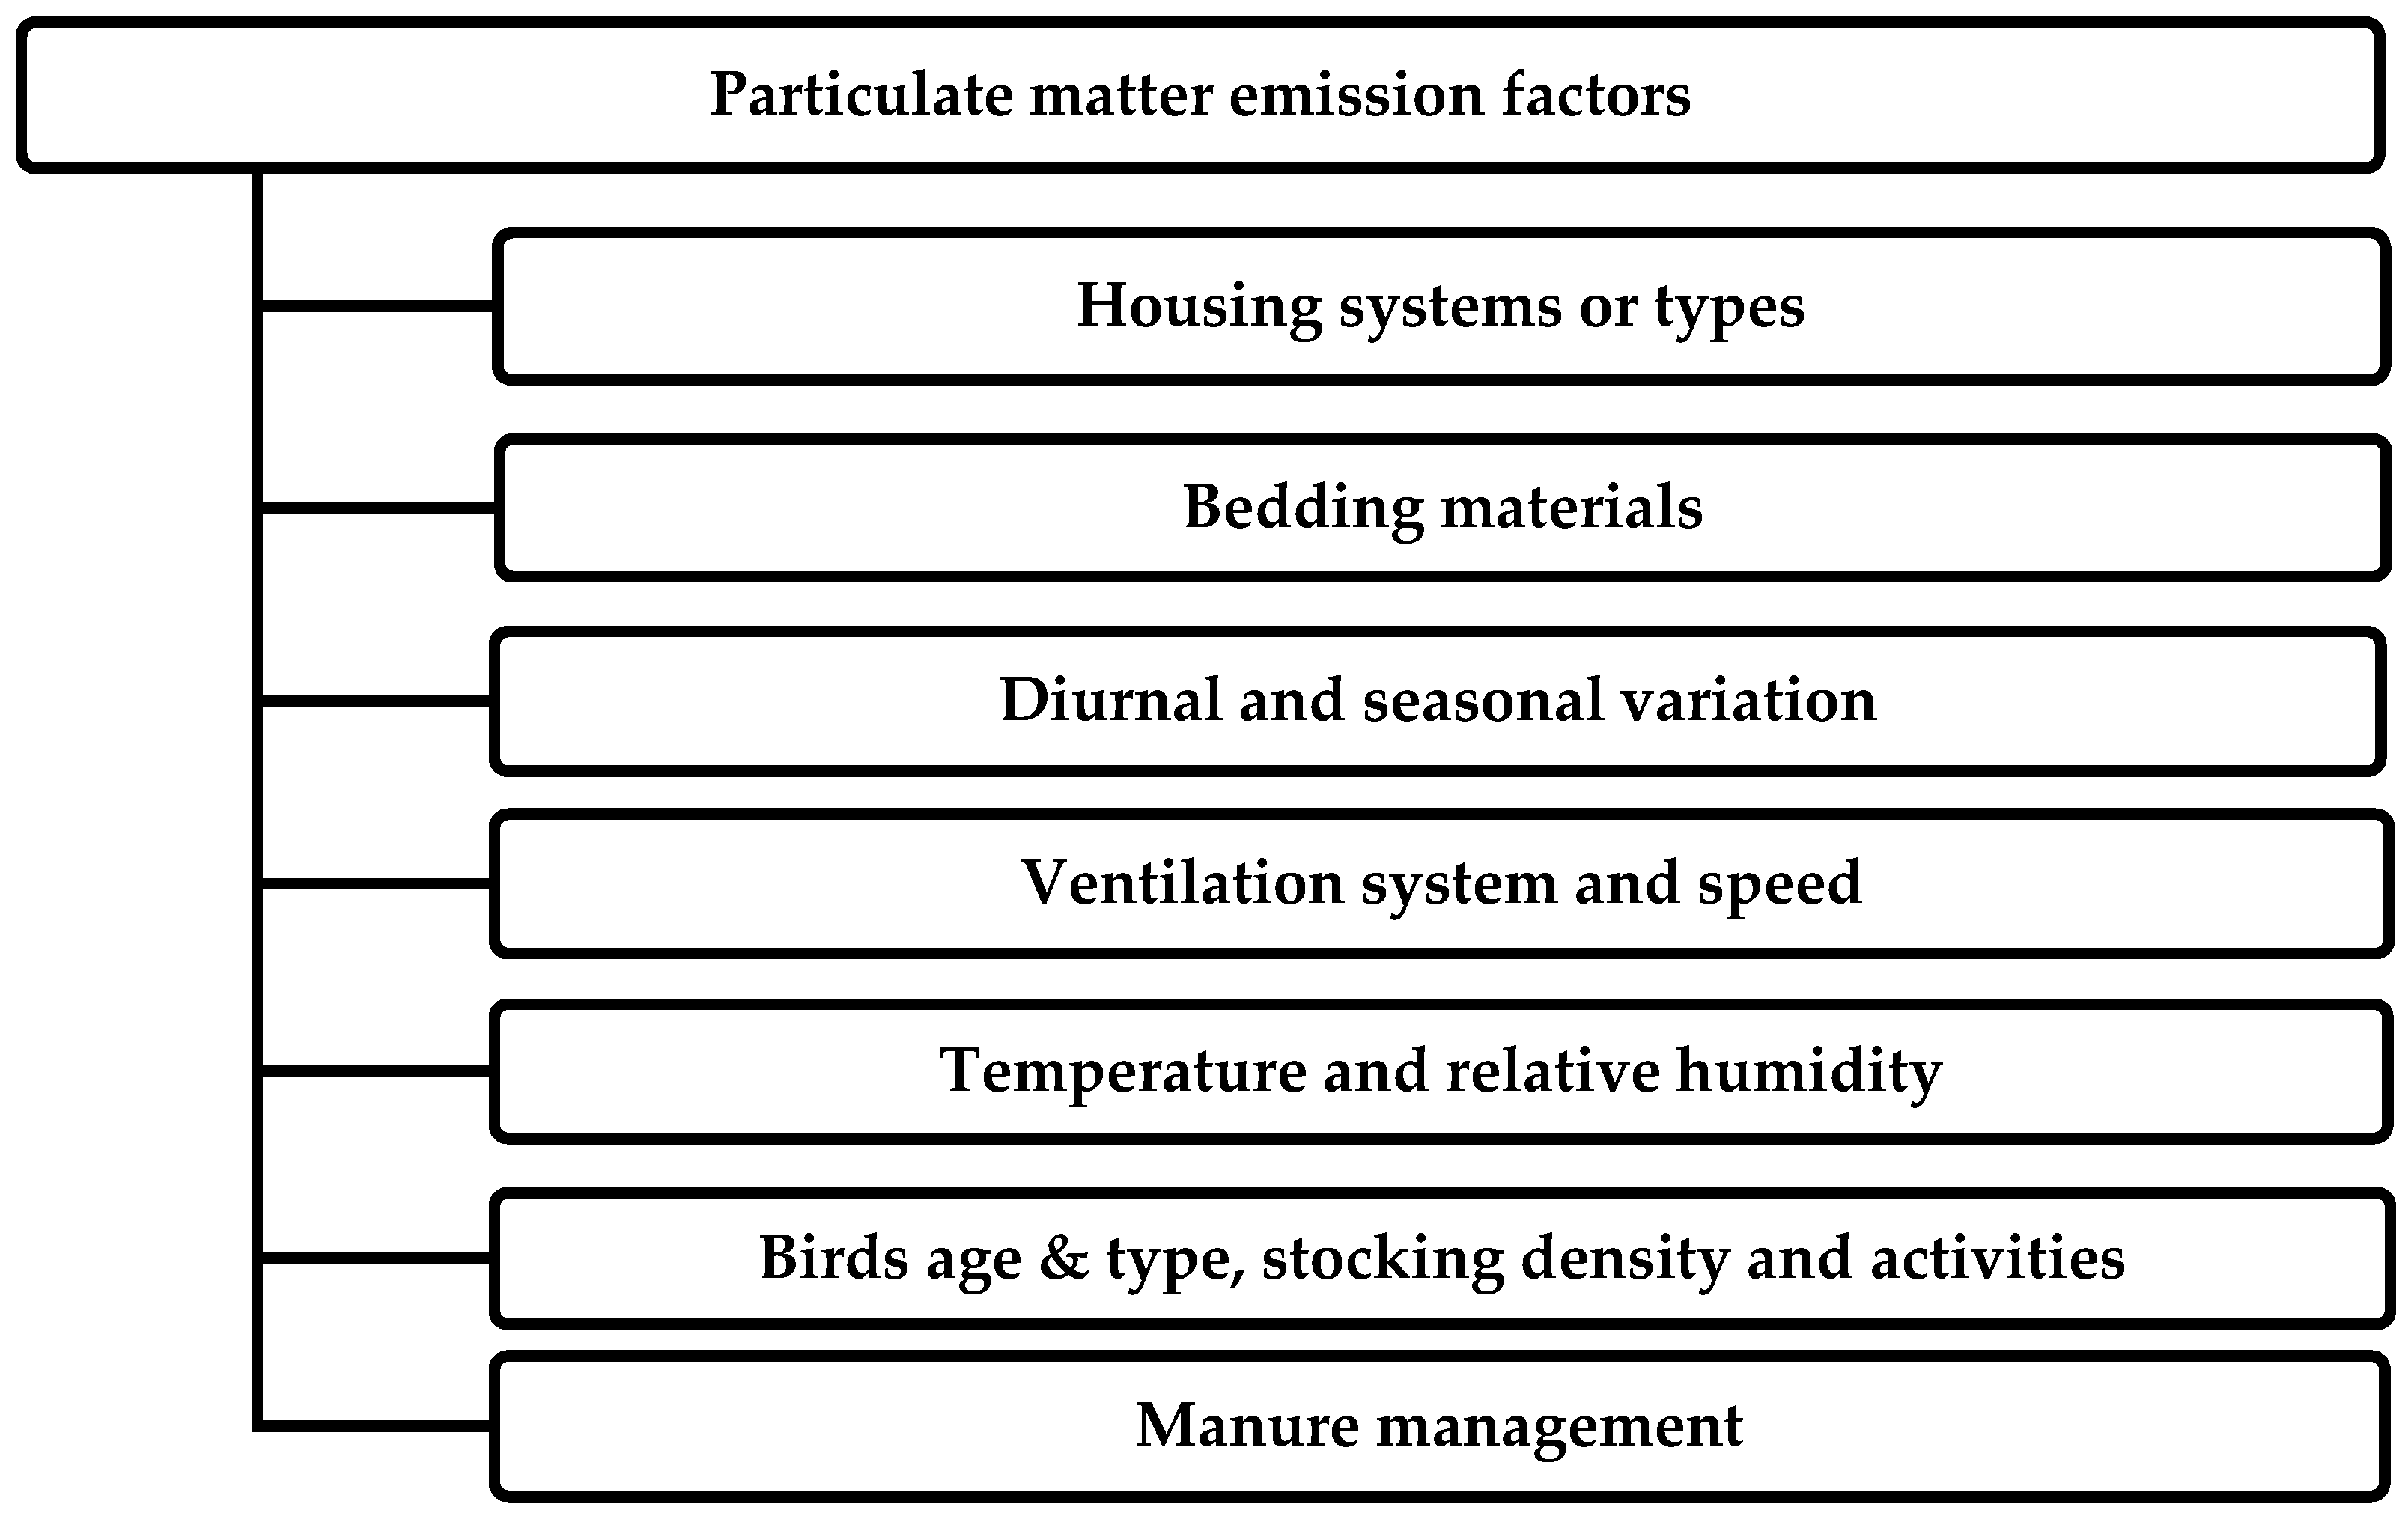
3. Factors Affecting Dust Generations
3.1. Effect of Housing Systems on PM
3.2. Effect of Bedding Materials on PM Levels
3.3. Effect of Lighting and Seasonal Variations on PM Levels
3.4. Effect of Ventilation System
3.5. Effect of Indoor Temperature and Relative Humidity
3.6. Other Factors
3.6.1. Manure Cleaning Methods
3.6.2. Bird Age, Stocking Density, and Behaviors
4. Impacts of PM on the Health and Welfare of Chickens and Farm Workers
4.1. Impacts on Birds’ Health, Behaviors, and Welfare
4.2. Human Health, Behaviors, and Welfare
4.3. Poultry Production
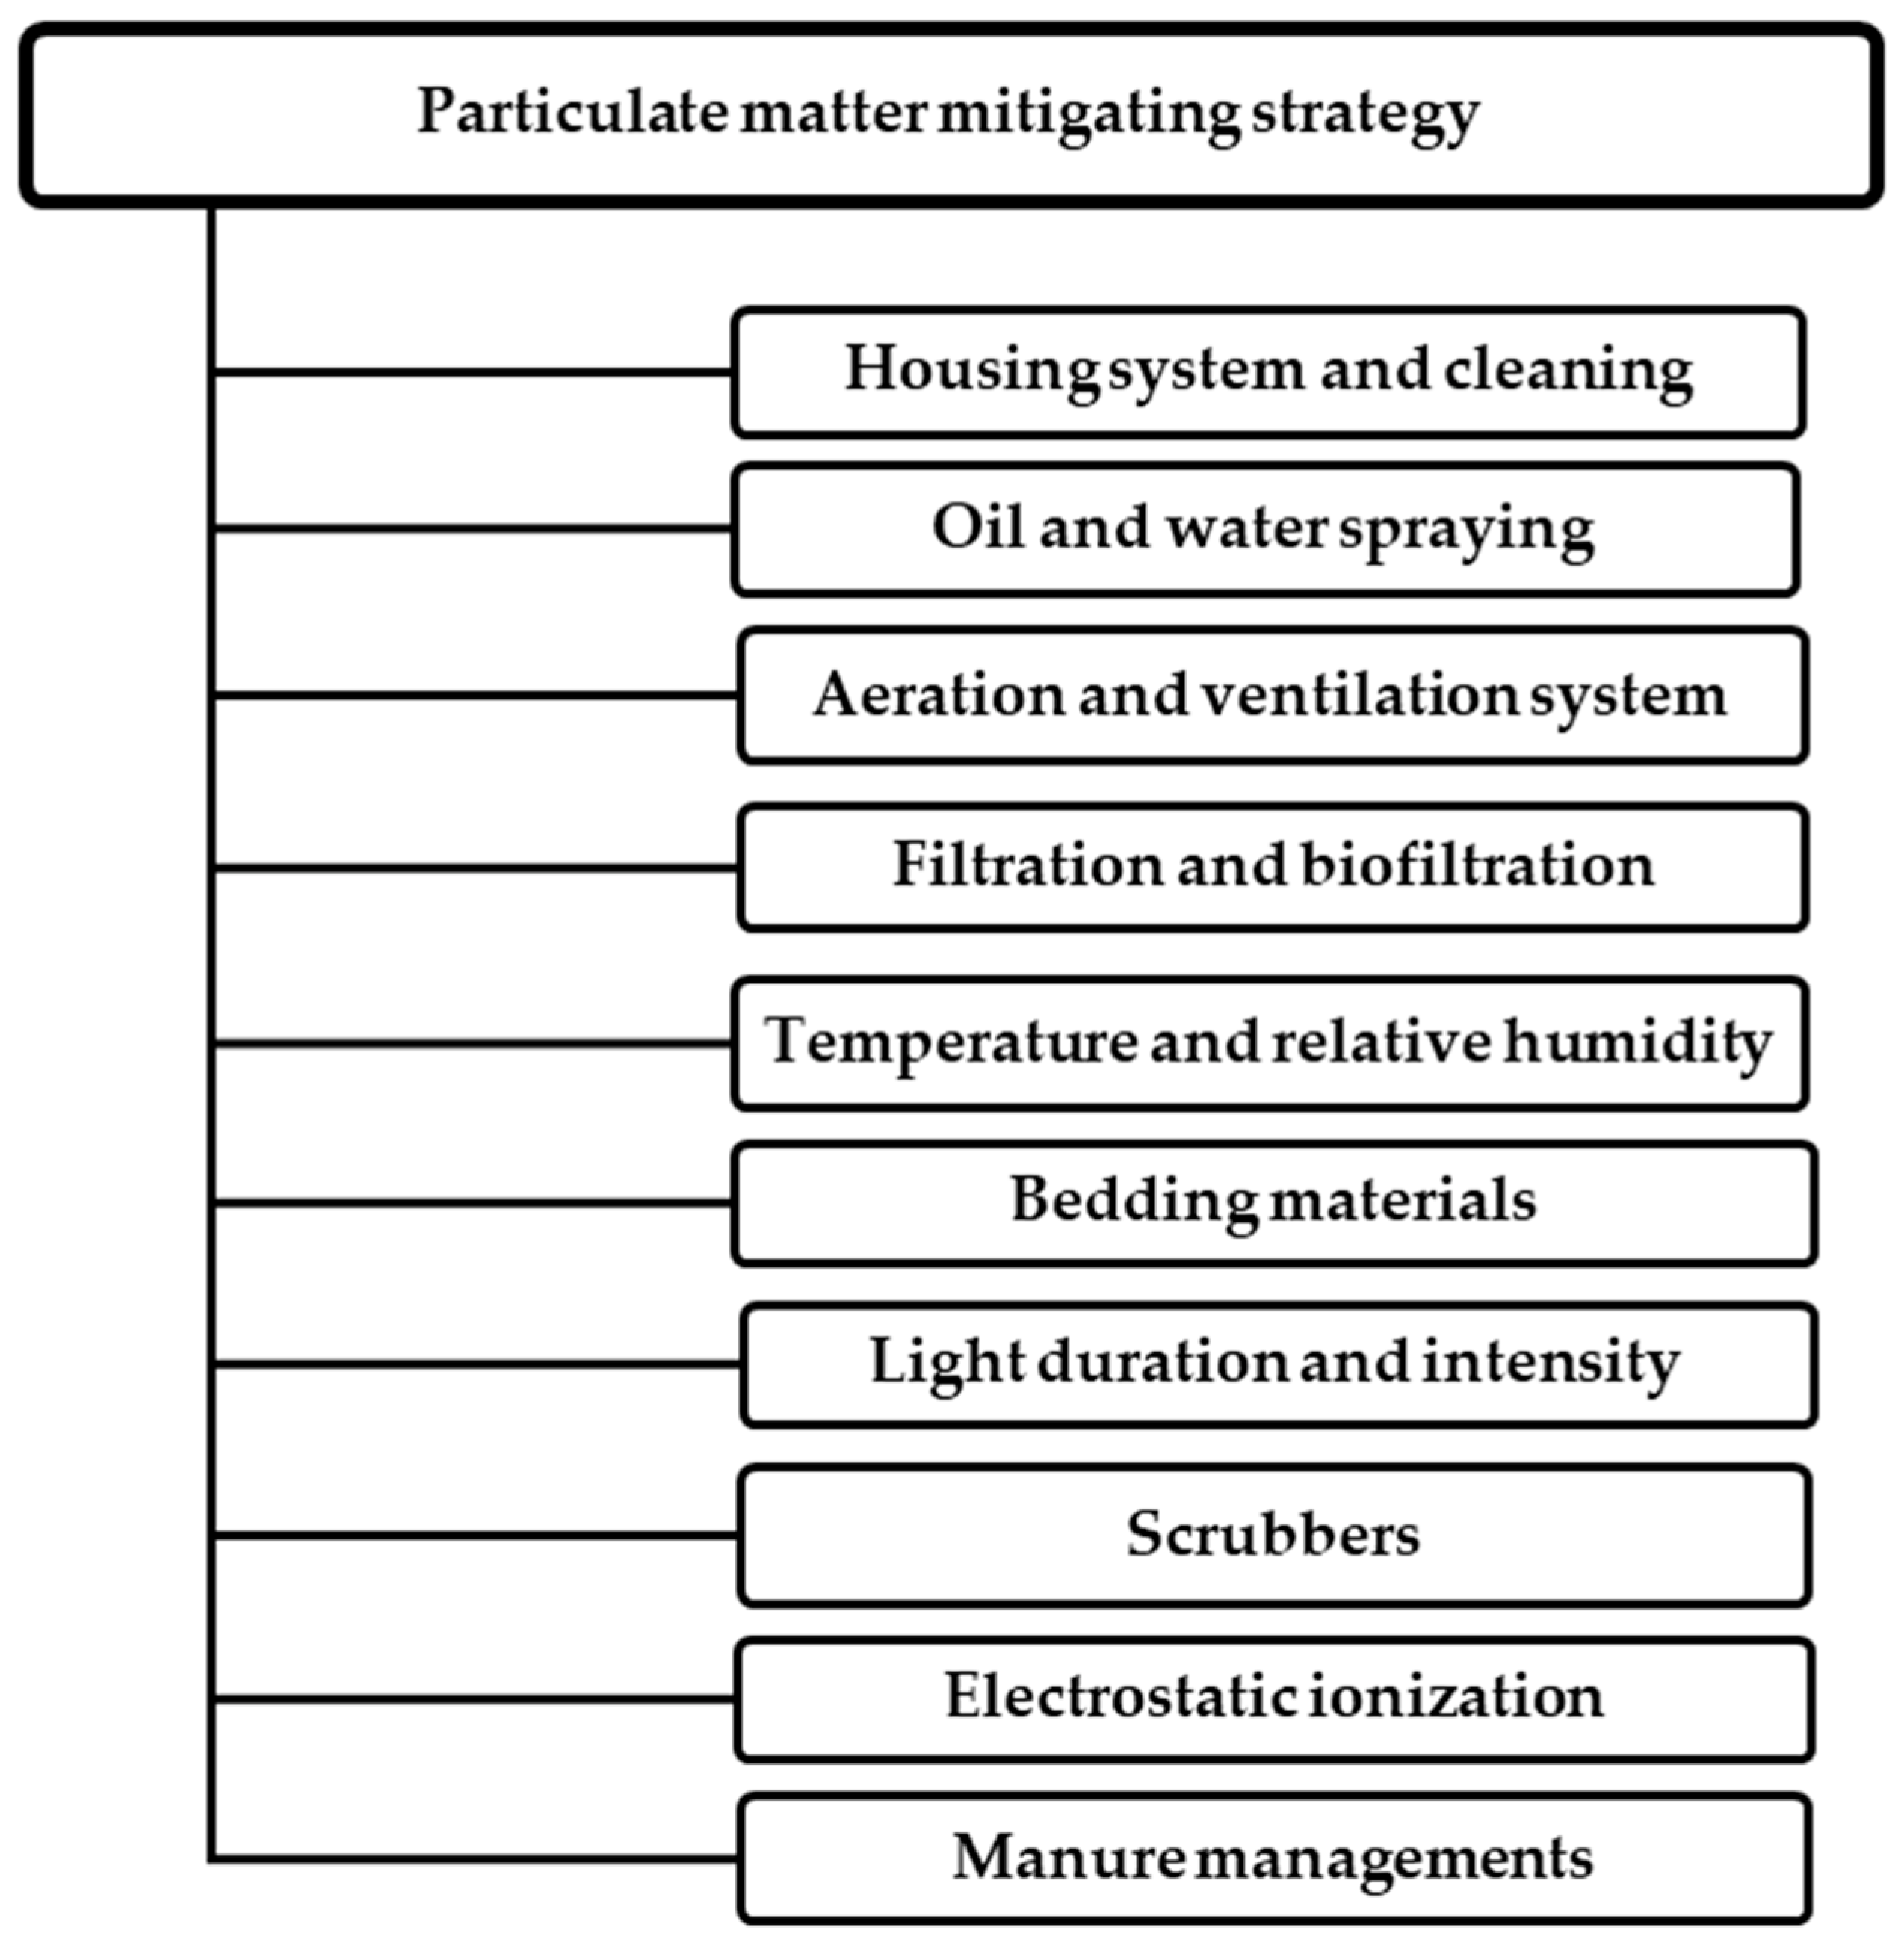
5. Mitigation Strategies Suppressing PM Levels in Poultry Houses
6. Particulate Matter Emission Mitigating Strategies
6.1. Housing Systems and Cleaning
6.2. Oil and Water Spraying
6.3. Filtration and Biofiltration
| Filter/Biofilter | PM Size | PM Reduction (%) | References |
|---|---|---|---|
| Wood-chip Bio-filter 127 mm 254 mm | PM10 TSP | 62 and 89.7 62.9 and 96.3 | [9] |
| Stuffnix dry filter U-bend baffle filter | PM2.5 and PM10 | 41 and 64 19 and 22 | [44] |
| Dry filter | PM concentrations PM emissions | 55 72 | [62] |
| Dry filter | PM2.5 PM10 | 7.1 40.7 | [66] |
| Biotrickling filter and denitrification EBRT * = 3 s EBRT = 0.71 s EBRT = 3.6 s | PM10 | 38 60 69 | [124] |
| Stuffnix dry filter | Fine dust | 20–60 | [125] |
| Trickling biofilter using acidified water | PM10 | >80 | [126] |
| Bio-filter | TSP | 79–96 | [127] |
6.4. Bedding Materials
6.5. Scrubbers
6.6. Electrostatic Ionization
6.7. Other Management Practices
6.7.1. Aeration and Ventilation System
6.7.2. Lighting Management
6.7.3. Precision Control of Indoor Temperature and Relative Humidity
7. Summary
Author Contributions
Funding
Acknowledgments
Conflicts of Interest
References
- Chai, L.; Kröbel, R.; Janzen, H.H.; Beauchemin, K.A.; McGinn, S.M.; Bittman, S.; Atia, A.; Edeogu, I.; MacDonald, D.; Dong, R. A Regional Mass Balance Model Based on Total Ammoniacal Nitrogen for Estimating Ammonia Emissions from Beef Cattle in Alberta Canada. Atmos. Environ. 2014, 92, 292–302. [Google Scholar] [CrossRef]
- Chai, L.; Kröbel, R.; MacDonald, D.; Bittman, S.; Beauchemin, K.A.; Janzen, H.H.; McGinn, S.M.; Vanderzaag, A. An Ecoregion-Specific Ammonia Emissions Inventory of Ontario Dairy Farming: Mitigation Potential of Diet and Manure Management Practices. Atmos. Environ. 2016, 126, 1–14. [Google Scholar] [CrossRef]
- Zhao, Y.; Shepherd, T.A.; Li, H.; Xin, H. Environmental Assessment of Three Egg Production Systems—Part I: Monitoring System and Indoor Air Quality. Poult. Sci. 2015, 94, 518–533. [Google Scholar] [CrossRef] [PubMed]
- Ni, J.-Q.; Diehl, C.A.; Chai, L.; Chen, Y.; Heber, A.J.; Lim, T.-T.; Bogan, B.W. Factors and Characteristics of Ammonia, Hydrogen Sulfide, Carbon Dioxide, and Particulate Matter Emissions from Two Manure-Belt Layer Hen Houses. Atmos. Environ. 2017, 156, 113–124. [Google Scholar] [CrossRef]
- Ni, J.-Q.; Liu, S.; Diehl, C.A.; Lim, T.-T.; Bogan, B.W.; Chen, L.; Chai, L.; Wang, K.; Heber, A.J. Emission Factors and Characteristics of Ammonia, Hydrogen Sulfide, Carbon Dioxide, and Particulate Matter at Two High-Rise Layer Hen Houses. Atmos. Environ. 2017, 154, 260–273. [Google Scholar] [CrossRef]
- NRC (National Research Council). Air Emissions from Animal Feeding Operations: Current Knowledge, Future Needs; National Academies Press: Washington, DC, USA, 2003. [Google Scholar]
- EPA National Emission Inventory. Ammonia Emissions from Animal Husbandry Operations; EPA National Emission Inventory: Washington, DC, USA, 2004; Volume 131. Available online: https://www3.epa.gov/ttnchie1/ap42/ch09/related/nh3inventorydraft_jan2004.pdf (accessed on 30 September 2022).
- Ritz, C.; Mitchell, B.; Fairchild, B.; Czarick III, M.; Worley, J. Improving In-House Air Quality in Broiler Production Facilities Using an Electrostatic Space Charge System. J. Appl. Poult. Res. 2006, 15, 333–340. [Google Scholar] [CrossRef]
- Chai, L.; Ni, J.-Q.; Diehl, C.A.; Kilic, I.; Heber, A.; Chen, Y.; Cortus, E.; Bogan, B.; Lim, T.; Ramirez-Dorronsoro, J.-C. Ventilation Rates in Large Commercial Layer Hen Houses with Two-Year Continuous Monitoring. Br. Poult. Sci. 2012, 53, 19–31. [Google Scholar] [CrossRef]
- Wang, K.; Li, Q.; Wang-Li, L.; Cortus, E.; Bogan, B.W.; Kilic, I.; Liang, W.-Z.; Xiao, C.-H.; Chai, L.-L.; Ni, J.-Q. The National Air Emissions Monitoring Study′s Southeast Layer Site: Part V. Hydrogen Sulfide and Volatile Organic Compounds. Trans. ASABE 2016, 59, 681–693. [Google Scholar]
- WHO (World Health Organization). Ambient (Outdoor) Air Pollution. Available online: https://www.who.int/news-room/fact-sheets/detail/ambient-(outdoor)-air-quality-and-health (accessed on 30 September 2022).
- US EPA. Health and Environmental Effects of Particulate Matter (PM). Available online: https://www.epa.gov/pm-pollution/health-and-environmental-effects-particulate-matter-pm (accessed on 30 September 2022).
- US EPA. NAAQS Table. Available online: https://www.epa.gov/criteria-air-pollutants/naaqs-table (accessed on 30 September 2022).
- US EPA. Particulate Matter (PM) Basics. Available online: https://www.epa.gov/pm-pollution/particulate-matter-pm-basics (accessed on 30 September 2022).
- EEA Group 10: Agriculture—European Environment Agency. Available online: https://www.eea.europa.eu/publications/EMEPCORINAIR5/page019.html (accessed on 30 September 2022).
- Wicklin, G.; Czarick, M. Particulate Emissions from Poultry Housing. In Proceedings of the ASAE Annual International Meeting, Minneapolis Convention Center, Minneapolis, MN, USA, 10–14 August 1997; pp. 10–14. [Google Scholar]
- Cambra-López, M.; Hermosilla, T.; Lai, H.T.; Aarnink, A.J.A.; Ogink, N. Particulate Matter Emitted from Poultry and Pig Houses: Source Identification and Quantification. Trans. ASABE 2011, 54, 629–642. [Google Scholar] [CrossRef]
- Ahaduzzaman, M.; Milan, L.; Morton, C.L.; Gerber, P.F.; Walkden-Brown, S.W. Characterization of Poultry House Dust Using Chemometrics and Scanning Electron Microscopy Imaging. Poult. Sci. 2021, 100, 101188. [Google Scholar] [CrossRef]
- Donham, K. Occupational Health Hazards and Recommended Exposure Limits for Workers in Poultry Buildings. In Proceedings of the National Poultry Waste Management Symposium Committee, Birmingham, AL, USA, 28–30 October 2000; pp. 92–109. [Google Scholar]
- Radon, K.; Weber, C.; Iversen, M.; Danuser, B.; Pedersen, S.; Nowak, D. Exposure Assessment and Lung Function in Pig and Poultry Farmers. Occup. Environ. Med. 2001, 58, 405–410. [Google Scholar] [CrossRef] [PubMed]
- Cambra-López, M.; Aarnink, A.J.; Zhao, Y.; Calvet, S.; Torres, A.G. Airborne Particulate Matter from Livestock Production Systems: A Review of an Air Pollution Problem. Environ. Pollut. 2010, 158, 1–17. [Google Scholar] [CrossRef] [PubMed]
- Michiels, A.; Piepers, S.; Ulens, T.; Van Ransbeeck, N.; Sacristán, R.D.P.; Sierens, A.; Haesebrouck, F.; Demeyer, P.; Maes, D. Impact of Particulate Matter and Ammonia on Average Daily Weight Gain, Mortality and Lung Lesions in Pigs. Prev. Vet. Med. 2015, 121, 99–107. [Google Scholar] [CrossRef] [PubMed]
- Viegas, S.; Faísca, V.M.; Dias, H.; Clérigo, A.; Carolino, E.; Viegas, C. Occupational Exposure to Poultry Dust and Effects on the Respiratory System in Workers. J. Toxicol. Environ. Health Part A 2013, 76, 230–239. [Google Scholar] [CrossRef] [PubMed]
- Chai, L.; Zhao, Y.; Xin, H.; Wang, T.; Atilgan, A.; Soupir, M.; Liu, K. Reduction of Particulate Matter and Ammonia by Spraying Acidic Electrolyzed Water onto Litter of Aviary Hen Houses: A Lab-Scale Study. Trans. ASABE 2017, 60, 497–506. [Google Scholar]
- Qi, R.; Manbeck, H.; Maghirang, R. Dust Net Generation Rate in a Poultry Layer House. Trans. ASAE 1992, 35, 1639–1645. [Google Scholar] [CrossRef]
- Roumeliotis, T.S.; Dixon, B.J.; Van Heyst, B.J. Characterization of Gaseous Pollutant and Particulate Matter Emission Rates from a Commercial Broiler Operation Part I: Observed Trends in Emissions. Atmos. Environ. 2010, 44, 3770–3777. [Google Scholar] [CrossRef]
- Donham, K.J.; Scallon, L.J.; Popendorf, W.; Treuhaft, M.W.; Roberts, R.C. Characterization of Dusts Collected from Swine Confinement Buildings. Am. Ind. Hyg. Assoc. J. 1986, 47, 404–410. [Google Scholar] [CrossRef]
- Bonifacio, H.F.; Maghirang, R.G.; Trabue, S.L.; McConnell, L.L.; Prueger, J.H.; Bonifacio, E.R. TSP, PM10, and PM2. 5 Emissions from a Beef Cattle Feedlot Using the Flux-Gradient Technique. Atmos. Environ. 2015, 101, 49–57. [Google Scholar] [CrossRef]
- Chai, L.; Xin, H.; Wang, Y.; Oliveira, J.; Wang, K.; Zhao, Y. Mitigating Particulate Matter Generation in a Commercial Cage-Free Hen House. Trans. ASABE 2019, 62, 877–886. [Google Scholar] [CrossRef]
- Lin, X.-J.; Cortus, E.; Zhang, R.; Jiang, S.; Heber, A. Ammonia, Hydrogen Sulfide, Carbon Dioxide and Particulate Matter Emissions from California High-Rise Layer Houses. Atmos. Environ. 2012, 46, 81–91. [Google Scholar] [CrossRef]
- Anderson, N.; Strader, R.; Davidson, C. Airborne Reduced Nitrogen: Ammonia Emissions from Agriculture and Other Sources. Environ. Int. 2003, 29, 277–286. [Google Scholar] [CrossRef]
- Ten Brink, H.; Even, A. Secondary Aerosol in the Netherlands. In Proceedings of the Annual Report of Subproject AEROSOL of Eurotrac-2, Munich, Germany, 1999. [Google Scholar]
- Sethi, P.; Muduli, S.; Aman Mishra, D.; Roul, A.K.; Mishra, A. Poultry Dust and Risks Associated with Public Health. Pharma Innov. 2019, 8, 7725. [Google Scholar]
- Harry, E. Air Pollution in Farm Buildings and Methods of Control: A Review. Avian Pathol. 1978, 7, 441–454. [Google Scholar] [CrossRef] [PubMed]
- Donham, K.J.; Cumro, D.; Reynolds, S. Synergistic Effects of Dust and Ammonia on the Occupational Health Effects of Poultry Production Workers. J. Agromed. 2002, 8, 57–76. [Google Scholar] [CrossRef] [PubMed]
- Viegas, C.; Carolino, E.; Malta-Vacas, J.; Sabino, R.; Viegas, S.; Veríssimo, C. Fungal Contamination of Poultry Litter: A Public Health Problem. J. Toxicol. Environ. Health A 2012, 75, 1341–1350. [Google Scholar] [CrossRef]
- Morgan, R.J.; Wood, D.J.; Van Heyst, B.J. The Development of Seasonal Emission Factors from a Canadian Commercial Laying Hen Facility. Atmos. Environ. 2014, 86, 1–8. [Google Scholar] [CrossRef]
- Knight, R.M.; Tong, X.; Liu, Z.; Hong, S.; Zhao, L. Spatial and Seasonal Variations of PM Concentration and Size Distribution in Manure-Belt Poultry Layer Houses. Trans. ASABE 2019, 62, 415–427. [Google Scholar] [CrossRef]
- Liu, Q.; Cheng, W.; Liu, L.; Hua, Y.; Guo, L.; Nie, W. Research on the Control Law of Dust in the Main Ventilation System in Excavated Tunnels for Cleaner Production. Build. Environ. 2021, 205, 108282. [Google Scholar] [CrossRef]
- Shepherd, T.A.; Zhao, Y.; Li, H.; Stinn, J.P.; Hayes, M.D.; Xin, H. Environmental Assessment of Three Egg Production Systems—Part II. Ammonia, Greenhouse Gas, and Particulate Matter Emissions. Poult. Sci. 2015, 94, 534–543. [Google Scholar] [CrossRef]
- Le Bouquin, S.; Huneau-Salaün, A.; Huonnic, D.; Balaine, L.; Martin, S.; Michel, V. Aerial Dust Concentration in Cage-Housed, Floor-Housed, and Aviary Facilities for Laying Hens. Poult. Sci. 2013, 92, 2827–2833. [Google Scholar] [CrossRef] [PubMed]
- Saleh, M.; Seedorf, J.; Hartung, J. Inhalable and Respirable Dust, Bacteria and Endotoxins in the Air of Poultry Houses. In Proceedings of the 16th International Conference on Engineering Design, Paris, France, 28–31 July 2007. [Google Scholar]
- Kim, K.Y.; Ko, H.J. Field Survey on Concentration and Emission of Dust in Different Types of Poultry Houses of South Korea. Atmosphere 2020, 11, 530. [Google Scholar] [CrossRef]
- Demmers, T.; Saponja, A.; Thomas, R.; Phillips, G.; McDonald, A.; Stagg, S.; Bowry, A.; Nemitz, E. Dust and Ammonia Emissions from UK Poultry Houses. In Proceedings of the 17th World Congress of the International Commission of Agricultural and Biosystems Engineering (CIGR), Québec City, QC, Canada, 13–17 June 2010. [Google Scholar]
- Nimmermark, S.; Lund, V.; Gustafsson, G.; Eduard, W. Ammonia, Dust and Bacteria in Welfare-Oriented Systems for Laying Hens. Ann. Agric. Environ. Med. 2009, 16, 103–113. [Google Scholar] [PubMed]
- Adell, E.; Calvet, S.; Pérez-Bonilla, A.; Jiménez-Belenguer, A.; García, J.; Herrera, J.; Cambra-Lopez, M. Air Disinfection in Laying Hen Houses: Effect on Airborne Microorganisms with Focus on Mycoplasma Gallisepticum. Biosyst. Eng. 2015, 129, 315–323. [Google Scholar] [CrossRef]
- Li, Z.; Wang, C.; Li, B.; Shi, Z.; Zheng, W.; Teng, G. Concentration and Size Distribution of Particulate Matter in a New Aviary System for Laying Hens in China. J. Air Waste Manag. Assoc. 2020, 70, 379–392. [Google Scholar] [CrossRef] [PubMed]
- Hayes, M.; Xin, H.; Li, H.; Shepherd, T.; Zhao, Y.; Stinn, J. Ammonia, Greenhouse Gas, and Particulate Matter Emissions of Aviary Layer Houses in the Midwestern US. Trans. ASABE 2013, 56, 1921–1932. [Google Scholar]
- Li, Q.-F.; Wang-Li, L.; Wang, K.; Chai, L.; Cortus, E.L.; Kilic, I.; Bogan, B.W.; Ni, J.-Q.; Heber, A.J. The National Air Emissions Monitoring Study′s Southeast Layer Site: Part II. Particulate Matter. Trans. ASABE 2013, 56, 1173–1184. [Google Scholar]
- Li, H.; Xin, H.; Burns, R.T.; Jacobson, L.D.; Noll, S.; Hoff, S.; Harmon, J.; Koziel, J.A.; Hetchler, B. Air Emissions from Tom and Hen Turkey Houses in the US Midwest. Trans. ASABE 2011, 54, 305–314. [Google Scholar] [CrossRef]
- EU Council Directive 1999/74/EC of 19 July 1999 Laying down Minimum Standards for the Protection of Laying Hens. Available online: https://www.legislation.gov.uk/eudr/1999/74/contents (accessed on 30 September 2022).
- Aarnink, A.; Ellen, H. Processes and Factors Affecting Dust Emissions from Livestock Production. How to Improve Air Quality. 2007. Available online: https://www.researchgate.net/profile/Andre-Aarnink/publication/40098613_Processes_and_factors_affecting_dust_emissions_from_livestock_production/links/55adff7508aed9b7dcdb09b3/Processes-and-factors-affecting-dust-emissions-from-livestock-production.pdf (accessed on 10 September 2022).
- Munir, M.; Belloncle, C.; Irle, M.; Federighi, M. Wood-Based Litter in Poultry Production: A Review. World’s Poult. Sci. J. 2019, 75, 5–16. [Google Scholar] [CrossRef]
- Gustafsson, G.; Von Wachenfelt, E. Reducing Airborne Dust in a Loose-Housing System for Laying Hens. J. Agric. Sci. Technol. A 2012, 2, 350. [Google Scholar]
- Van Harn, J.; Aarnink, A.; Mosquera, J.; Van Riel, J.; Ogink, N. Effect of Bedding Material on Dust and Ammonia Emission from Broiler Houses. Trans. ASABE 2012, 55, 219–226. [Google Scholar] [CrossRef]
- Gustafsson, G.; Von Wachenfelt, E. Airborne Dust Control Measures for Floor Housing System for Laying Hens. CIGR J. 2006, VII, 1–13. [Google Scholar]
- Takai, H.; Pedersen, S.; Johnsen, J.O.; Metz, J.; Koerkamp, P.G.; Uenk, G.; Phillips, V.; Holden, M.; Sneath, R.; Short, J. Concentrations and Emissions of Airborne Dust in Livestock Buildings in Northern Europe. J. Agric. Eng. Res. 1998, 70, 59–77. [Google Scholar] [CrossRef]
- Farghly, M.; Mahrose, K.M.; Cooper, R.; Metwally, K.A.; Abougabal, M.S.; El-Ratel, I. Use of Available Crop By-Products as Alternative Bedding Materials to Wheat Straw for Rearing Broilers. Animal 2021, 15, 100260. [Google Scholar] [CrossRef] [PubMed]
- Samadi, S.; Van Eerdenburg, F.J.; Jamshidifard, A.-R.; Otten, G.P.; Droppert, M.; Heederik, D.J.; Wouters, I.M. The Influence of Bedding Materials on Bio-Aerosol Exposure in Dairy Barns. J. Expo. Sci. Environ. Epidemiol. 2012, 22, 361–368. [Google Scholar] [CrossRef] [PubMed]
- Lim, T.-T.; Heber, A.J.; Ni, J.-Q.; Gallien, J.; Xin, H. Air Quality Measurements at a Laying Hen House: Particulate Matter Concentrations and Emissions; American Society of Agricultural and Biological Engineers: St. Joseph, MI, USA, 2003; p. 249. [Google Scholar]
- Shang, B.; Liu, Y.; Dong, H.; Tao, X.; Yao, H. Particulate Matter Concentrations and Emissions of a Fattening Pig Facility in Northern China. Atmos. Pollut. Res. 2020, 11, 1902–1911. [Google Scholar] [CrossRef]
- Mostafa, E.; Buescher, W. Indoor Air Quality Improvement from Particle Matters for Laying Hen Poultry Houses. Biosyst. Eng. 2011, 109, 22–36. [Google Scholar] [CrossRef]
- Zhou, Z.; Huo, L.; Yang, D.; Zhao, J.; Meng, L.; Bai, Z. Monitoring Particulate Matter Levels and Climate Conditions in Commercial Cage Laying Duck Houses; American Society of Agricultural and Biological Engineers: St. Joseph, MI, USA, 2022; p. 1. [Google Scholar]
- Tang, Q.; Huang, K.; Liu, J.; Shen, D.; Dai, P.; Li, Y.; Li, C. Seasonal Variations of Microbial Assemblage in Fine Particulate Matter from a Nursery Pig House. Sci. Total Environ. 2020, 708, 134921. [Google Scholar] [CrossRef]
- Roumeliotis, T.S.; Van Heyst, B.J. Size Fractionated Particulate Matter Emissions from a Broiler House in Southern Ontario, Canada. Sci. Total Environ. 2007, 383, 174–182. [Google Scholar] [CrossRef]
- Winkel, A.; Mosquera, J.; Koerkamp, P.W.G.; Ogink, N.W.; Aarnink, A.J. Emissions of Particulate Matter from Animal Houses in the Netherlands. Atmos. Environ. 2015, 111, 202–212. [Google Scholar] [CrossRef]
- Li, Z.; Zheng, W.; Wei, Y.; Li, B.; Wang, Y.; Zheng, H. Prevention of Particulate Matter and Airborne Culturable Bacteria Transmission between Double-Tunnel Ventilation Layer Hen Houses. Poult. Sci. 2019, 98, 2392–2398. [Google Scholar] [CrossRef] [PubMed]
- Zhao, Y.; Chai, L.; Richardson, B.; Xin, H. Field Evaluation of an Electrostatic Air Filtration System for Reducing Incoming Particulate Matter of a Hen House. Trans. ASABE 2018, 61, 295–304. [Google Scholar] [CrossRef]
- Almuhanna, E. Characteristics of Air Contaminants in Naturally and Mechanically Ventilated Poultry Houses in Al-Ahsa, Saudi Arabia. Trans. ASABE 2011, 54, 1433–1443. [Google Scholar] [CrossRef]
- Pedersen, S.; Nonnenmann, M.; Rautiainen, R.; Demmers, T.; Banhazi, T.; Lyngbye, M. Dust in Pig Buildings. J. Agric. Saf. Health 2000, 6, 261. [Google Scholar] [CrossRef] [PubMed]
- Lin, X.; Zhang, R.; Jiang, S.; El-Mashad, H.; Xin, H. Emissions of Ammonia, Carbon Dioxide and Particulate Matter from Cage-Free Layer Houses in California. Atmos. Environ. 2017, 152, 246–255. [Google Scholar] [CrossRef]
- Chai, L.; Xin, H.; Zhao, Y.; Wang, T.; Soupir, M.; Liu, K. Mitigating Ammonia Emissions from Liquid-Sprayed Litter of Cage-Free Hen House with a Solid Litter Additive; American Society of Agricultural and Biological Engineers: St. Joseph, MI, USA, 2017; p. 1. [Google Scholar]
- Winkel, A.; Mosquera, J.; Aarnink, A.J.; Koerkamp, P.W.G.; Ogink, N.W. Evaluation of Oil Spraying Systems and Air Ionisation Systems for Abatement of Particulate Matter Emission in Commercial Poultry Houses. Biosyst. Eng. 2016, 150, 104–122. [Google Scholar] [CrossRef]
- Winkel, A.; Cambra-López, M.; Koerkamp, P.W.G.; Ogink, N.W.; Aarnink, A.J. Abatement of Particulate Matter Emission from Experimental Broiler Housings Using an Optimized Oil Spraying Method. Trans. ASABE 2014, 57, 1853–1864. [Google Scholar]
- Aarnink, A.; van Harn, J.; Van Hattum, T.; Zhao, Y.; Ogink, N. Dust Reduction in Broiler Houses by Spraying Rapeseed Oil. Trans. ASABE 2011, 54, 1479–1489. [Google Scholar] [CrossRef]
- Ogink, N.; van Harn, J.; van Emous, R.; Ellen, H. Top Layer Humidification of Bedding Material of Laying Hen Houses to Mitigate Dust Emissions: Effects of Water Spraying on Dust, Ammonia and Odor Emissions; American Society of Agricultural and Biological Engineers: St. Joseph, MI, USA, 2012; p. 3. [Google Scholar]
- Yang, X.; Chai, L.; Bist, R.B.; Subedi, S.; Guo, Y. Variation of Litter Quality in Cage-Free Houses during Pullet Production; American Society of Agricultural and Biological Engineers: St. Joseph, MI, USA, 2022; p. 1. [Google Scholar]
- Bist, R.B.; Chai, L.; Yang, X.; Subedi, S.; Guo, Y. Air Quality in Cage-Free Houses during Pullets Production; American Society of Agricultural and Biological Engineers: St. Joseph, MI, USA, 2022; p. 1. [Google Scholar]
- Vucemilo, M.; Matković, K.; Vinković, B.; Jakšić, S.; Granić, K.; Mas, N. The Effect of Animal Age on Air Pollutant Concentration in a Broiler House. Czech J. Anim. Sci 2007, 52, 170–174. [Google Scholar] [CrossRef]
- Shen, D.; Li, C. Distribution of Particulate Matter and Ammonia in a Mechanically Ventilated Layer House. In Proceedings of the International Symposium Animal Environment and Welfare, Chongqing, China, 23–25 October 2017. [Google Scholar]
- Zhao, Y.; Zhao, D.; Ma, H.; Liu, K.; Atilgan, A.; Xin, H. Environmental Assessment of Three Egg Production Systems—Part III: Airborne Bacteria Concentrations and Emissions. Poult. Sci. 2016, 95, 1473–1481. [Google Scholar] [CrossRef]
- Koren, H.; Bisesi, M. Handbook of Environmental Health, Fourth Edition, Volume II: Pollutant Interactions in Air, Water and Soil; CRC Press: Boca Raton, FL, USA, 2003; Volume 2. [Google Scholar]
- Schwarze, P.; Øvrevik, J.; Låg, M.; Refsnes, M.; Nafstad, P.; Hetland, R.; Dybing, E. Particulate Matter Properties and Health Effects: Consistency of Epidemiological and Toxicological Studies. Hum. Exp. Toxicol. 2006, 25, 559–579. [Google Scholar] [CrossRef] [PubMed]
- Guarino, M.; Caroli, A.; Navarotto, P. Dust Concentration and Mortality Distribution in an Enclosed Laying House. Trans. ASAE 1999, 42, 1127. [Google Scholar] [CrossRef]
- Green, A.R.; Wesley, I.; Trampel, D.W.; Xin, H. Air Quality and Bird Health Status in Three Types of Commercial Egg Layer Houses. J. Appl. Poult. Res. 2009, 18, 605–621. [Google Scholar] [CrossRef]
- Dai, P.; Shen, D.; Tang, Q.; Huang, K.; Li, C. PM2. 5 from a Broiler Breeding Production System: The Characteristics and Microbial Community Analysis. Environ. Pollut. 2020, 256, 113368. [Google Scholar] [CrossRef] [PubMed]
- Roque, K.; Shin, K.-M.; Jo, J.-H.; Kim, H.-A.; Heo, Y. Relationship between Chicken Cellular Immunity and Endotoxin Levels in Dust from Chicken Housing Environments. J. Vet. Sci. 2015, 16, 173–177. [Google Scholar] [CrossRef] [PubMed]
- Madelin, T.M.; Wathes, C. Air Hygiene in a Broiler House: Comparison of Deep Litter with Raised Netting Floors. Br. Poult. Sci. 1989, 30, 23–37. [Google Scholar] [CrossRef] [PubMed]
- Jiang, Q.; Zhang, C.; Chen, S.; Shi, L.; Li, D.C.; Lv, N.; Cui, L.; Chen, Y.; Zheng, Y. Particulate Matter 2.5 Induced Developmental Cardiotoxicity in Chicken Embryo and Hatchling. Front. Pharmacol. 2020, 11, 841. [Google Scholar] [CrossRef]
- Shen, D.; Guo, Z.; Huang, K.; Dai, P.; Jin, X.; Li, Y.; Li, C. Inflammation-Associated Pulmonary Microbiome and Metabolome Changes in Broilers Exposed to Particulate Matter in Broiler Houses. J. Hazard. Mater. 2022, 421, 126710. [Google Scholar] [CrossRef]
- Zuskin, E.; Mustajbegovic, J.; Schachter, E.N.; Kern, J.; Rienzi, N.; Goswami, S.; Marom, Z.; Maayani, S. Respiratory Function in Poultry Workers and Pharmacologic Characterization of Poultry Dust Extract. Environ. Res. 1995, 70, 11–19. [Google Scholar] [CrossRef]
- Miller, K.A.; Siscovick, D.S.; Sheppard, L.; Shepherd, K.; Sullivan, J.H.; Anderson, G.L.; Kaufman, J.D. Long-Term Exposure to Air Pollution and Incidence of Cardiovascular Events in Women. N. Engl. J. Med. 2007, 356, 447–458. [Google Scholar] [CrossRef]
- Schikowski, T.; Sugiri, D.; Ranft, U.; Gehring, U.; Heinrich, J.; Wichmann, H.; Krämer, U. Long-Term Air Pollution Exposure and Living Close to Busy Roads Are Associated with COPD in Women. Respir. Res. 2005, 6, 152. [Google Scholar] [CrossRef] [PubMed]
- WHO (World Health Organization). Health Effects of Particulate Matter: Policy Implications for Countries in Eastern Europe, Caucasus and Central Asia; World Health Organization: Geneva, Swizterland, 2013. [Google Scholar]
- Dai, P.; Shen, D.; Li, Y.; Li, C. Analysis of PM2. 5 Distribution in Chicken House and Its Damage on Human Alveolar Epithelial Cells. Anim. Environ. Welf. 2017, 21, e46. [Google Scholar]
- Hagmar, L.; Schütz, A.; Hallberg, T.; Sjöholm, A. Health Effects of Exposure to Endotoxins and Organic Dust in Poultry Slaughter-House Workers. Int. Arch. Occup. Environ. Health 1990, 62, 159–164. [Google Scholar] [CrossRef] [PubMed]
- Guillam, M.-T.; Pédrono, G.; Le Bouquin, S.; Huneau, A.; Gaudon, J.; Leborgne, R.; Dewitte, J.-D.; Ségala, C. Chronic Respiratory Symptoms of Poultry Farmers and Model-Based Estimates of Long-Term Dust Exposure. Ann. Agric. Environ. Med. 2013, 20, 307–311. [Google Scholar]
- Rylander, R. Lung Diseases Caused by Organic Dusts in the Farm Environment. Am. J. Ind. Med. 1986, 10, 221–227. [Google Scholar] [CrossRef]
- Willis, W.L.; Ouart, M.; Quarles, C. Effect of an Evaporative Cooling and Dust Control System on Rearing Environment and Performance of Male Broiler Chickens. Poult. Sci. 1987, 66, 1590–1593. [Google Scholar] [CrossRef]
- Lai, H.T.; Nieuwland, M.G.; Kemp, B.; Aarnink, A.J.; Parmentier, H.K. Effects of Dust and Airborne Dust Components on Antibody Responses, Body Weight Gain, and Heart Morphology of Broilers. Poult. Sci. 2009, 88, 1838–1849. [Google Scholar] [CrossRef]
- Homidan, A.A.; Robertson, J.; Petchey, A. Review of the Effect of Ammonia and Dust Concentrations on Broiler Performance. World′s Poult. Sci. J. 2003, 59, 340–349. [Google Scholar] [CrossRef]
- Banhazi, T.; Seedorf, J.; Laffrique, M.; Rutley, D. Identification of the Risk Factors for High Airborne Particle Concentrations in Broiler Buildings Using Statistical Modelling. Biosyst. Eng. 2008, 101, 100–110. [Google Scholar] [CrossRef]
- US EPA. National Ambient Air Quality Standards (NAAQS) for PM. Available online: https://www.epa.gov/pm-pollution/national-ambient-air-quality-standards-naaqs-pm (accessed on 30 September 2022).
- DES Smoke and Dust Health Action Levels—Environment, Land and Water. Available online: https://apps.des.qld.gov.au/air-quality/health/ (accessed on 30 September 2022).
- OSHA Permissible Exposure Limits—OSHA Annotated Table Z-1—Occupational Safety and Health Administration. Available online: https://www.osha.gov/annotated-pels/table-z-1 (accessed on 30 September 2022).
- WHO (World Health Organization). Air Quality Guidelines: Global Update 2005: Particulate Matter, Ozone, Nitrogen Dioxide, and Sulfur Dioxide; World Health Organization: Geneva, Switzerland, 2006; ISBN 92-890-2192-6. [Google Scholar]
- IOM. Occupational Exposure Limits for Dusts; IOM: Edinburgh, UK, 1984; Volume 23, Available online: http://winnipegsafetycompanies.com/wp-content/uploads/2016/09/dust-overview-john-cherrie.pdf#:~:text=1984%20HSE%20publish%20Guidance%20Note%20EH40%2C%20Occupational%20Exposure,or%205%20mg%2Fm3%20of%20respirable%20dust.%20COSHH%20Regulations (accessed on 3 April 2022).
- Wood, D. The Evaluation of Ammonia and Particulate Matter Control Strategies for Poultry Production Facilities. Ph.D. Thesis, University of Guelph, Guelph, ON, Canada, 2015. [Google Scholar]
- Almuhanna, E.A. Dust Control in Livestock Buildings with Electrostatically-Charged Water Spray; Kansas State University: Manhattan, KS, USA, 2007; ISBN 1-109-97127-3. [Google Scholar]
- Dawkins, M.S.; Donnelly, C.A.; Jones, T.A. Chicken Welfare Is Influenced More by Housing Conditions than by Stocking Density. Nature 2004, 427, 342–344. [Google Scholar] [CrossRef]
- Ellen, H.; Bottcher, R.; Von Wachenfelt, E.; Takai, H. Dust Levels and Control Methods in Poultry Houses. J. Agric. Saf. Health 2000, 6, 275. [Google Scholar] [CrossRef] [PubMed]
- Zheng, W.; Zhao, Y.; Xin, H.; Gates, R.S.; Li, B.; Zhang, Y.; Soupir, M.L. Airborne Particulate Matter and Culturable Bacteria Reduction from Spraying Slightly Acidic Electrolyzed Water in an Experimental Aviary Laying-Hen Housing Chamber. Trans. ASABE 2014, 57, 229–236. [Google Scholar]
- Kim, K.Y.; Ko, H.J.; Kim, H.T.; Kim, C.N. Effect of Spraying Biological Additives for Reduction of Dust and Bioaerosol in a Confinement Swine House. Ann. Agric. Environ. Med. 2006, 13, 133–138. [Google Scholar]
- Zhang, Y.; Tanaka, A.; Barber, E.; Feddes, J. Effects of Frequency and Quantity of Sprinkling Canola Oil on Dust Reduction in Swine Buildings. Trans. ASAE 1996, 39, 1077–1081. [Google Scholar] [CrossRef]
- Yang, Y.; Kirychuk, S.P.; Si, Y.; Martel, M.C.; Guo, H.; Predicala, B.Z.; Zhang, L. Reduction of Airborne Particulate Matter from Pig and Poultry Rearing Facilities Using Engineered Water Nanostructures. Biosyst. Eng. 2022, 218, 1–9. [Google Scholar] [CrossRef]
- Zheng, W.; Li, B.; Cao, W.; Zhang, G.; Yang, Z. Application of Neutral Electrolyzed Water Spray for Reducing Dust Levels in a Layer Breeding House. J. Air Waste Manag. Assoc. 2012, 62, 1329–1334. [Google Scholar] [CrossRef]
- Takai, H.; Pedersen, S. A Comparison Study of Different Dust Control Methods in Pig Buildings. Appl. Eng. Agric. 2000, 16, 269. [Google Scholar] [CrossRef]
- Wood, D.J.; Van Heyst, B.J. A Review of Ammonia and Particulate Matter Control Strategies for Poultry Housing. Trans. ASABE 2016, 59, 329–344. [Google Scholar]
- Patterson, P. Management Strategies to Reduce Air Emissions: Emphasis—Dust and Ammonia. J. Appl. Poult. Res. 2005, 14, 638–650. [Google Scholar] [CrossRef]
- Garlinski, E.M.; Mann, D.D. Design and Evaluation of a Horizontal Airflow Biofilter on a Swine Facility; American Society of Agricultural and Biological Engineers: St. Joseph, MI, USA, 2003; p. 1. [Google Scholar]
- Koerkamp, P.G. Review on Emissions of Ammonia from Housing Systems for Laying Hens in Relation to Sources, Processes, Building Design and Manure Handling. J. Agric. Eng. Res. 1994, 59, 73–87. [Google Scholar] [CrossRef]
- Sommer, S.; Hutchings, N. Techniques and Strategies for the Reduction of Ammonia Emission from Agriculture. Water Air Soil Pollut. 1995, 85, 237–248. [Google Scholar] [CrossRef]
- Ullman, J.; Mukhtar, S.; Lacey, R.; Carey, J. A Review of Literature Concerning Odors, Ammonia, and Dust from Broiler Production Facilities: Remedial Management Practices. J. Appl. Poult. Res. 2004, 13, 521–531. [Google Scholar] [CrossRef]
- Melse, R.W.; Mosquera, J. Nitrous Oxide (N2O) Emissions from Biotrickling Filters Used for Ammonia Removal at Livestock Facilities. Water Sci. Technol. 2014, 69, 994–1003. [Google Scholar] [CrossRef] [PubMed]
- Ogink, N.W.; Melse, R.W.; Mosquera, J. Multi-Pollutant and One-Stage Scrubbers for Removal of Ammonia, Odor, and Particulate Matter from Animal House Exhaust Air; American Society of Agricultural and Biological Engineers: St. Joseph, MI, USA, 2009; p. 37. [Google Scholar]
- Snell, H.; Schwarz, A. Development of an Efficient Bioscrubber System for the Reduction of Emissions; American Society of Agricultural and Biological Engineers: St. Joseph, MI, USA, 2003; p. 1. [Google Scholar]
- Seedorf, J.; Hartung, J. Reduction Efficiencies of a Biofilter and a Bio-Scrubber as Bio-Aerosols in Two Piggeries. Berl. Und Munch. Tierarztl. Wochenschr. 1999, 112, 444–447. [Google Scholar]
- Johnson, J.; Zwirzitz, B.; Oladeinde, A.; Milfort, M.; Looft, T.; Chai, L.; Zock, G.; Sommers, M.; Tunim, S.; Aggrey, S.E. Succession patterns of the bacterial community in poultry litter after bird removal and sodium bisulfate application. J. Environ. Qual. 2021, 50, 923–933. [Google Scholar] [CrossRef] [PubMed]
- Gentry, J.; McGlone, J.; Blanton, J., Jr.; Miller, M. Alternative Housing Systems for Pigs: Influences on Growth, Composition, and Pork Quality. J. Anim. Sci. 2002, 80, 1781–1790. [Google Scholar] [CrossRef]
- Asaniyan, E.; Agbede, J.; Laseinde, E. Impact Assessment of Different Litter Depths on the Performance of Broiler Chickens Raised on Sand and Wood Shaving Litters. World J. Zool. 2007, 2, 67–72. [Google Scholar]
- Jones, W.G.; Dennis, J.W.; May, J.J.; Whitmer, M.P.; Siegel, P.D.; Sorenson, W.; Schwegler-Berry, D.; Kullman, G.J. Dust Control during Bedding Chopping. Appl. Occup. Environ. Hyg. 1995, 10, 467–475. [Google Scholar] [CrossRef]
- Melse, R.; Ogink, N.; Bosma, A. Multi-Pollutant Scrubbers for Removal of Ammonia, Odor, and Particulate Matter from Animal House Exhaust Air. In Proceedings of the Exploring the Advantages, Limitations, and Economics of Mitigation Technologies, Des Moines, IW, USA, 19–21 May 2008. [Google Scholar]
- Zhao, Y.; Aarnink, A.; De Jong, M.; Ogink, N.; Koerkamp, P.G. Effectiveness of Multi-Stage Scrubbers in Reducing Emissions of Air Pollutants from Pig Houses. Trans. ASABE 2011, 54, 285–293. [Google Scholar] [CrossRef]
- Ru, Y.; Zhao, L.; Hadlocon, L.J.S.; Zhu, H.; Ramdon, S.K. Laboratory Evaluation of Electrostatic Spray Wet Scrubber to Control Particulate Matter Emissions from Poultry Facilities. Environ. Technol. 2017, 38, 23–33. [Google Scholar] [CrossRef]
- Mosquera, J.; Hol, J.; Melse, R.; Winkel, A.; Nijeboer, G.; Ploegaert, J.; Ogink, N.; Aarnink, A. Dust Emission from Animal Houses: Air Scrubbing Techniques; Wageningen Livestock Research: Wageningen, The Netherlands, 2011; ISSN 1570-8616. [Google Scholar]
- Aarnink, A.; Landman, W.; Melse, R.; Huynh, T. Systems for Eliminating Pathogens from Exhaust Air of Animal Houses; American Society of Agricultural and Biological Engineers: St. Joseph, MI, USA, 2005; p. 239. [Google Scholar]
- Mitchell, B.; Buhr, R.; Berrang, M.; Bailey, J.; Cox, N. Reducing Airborne Pathogens, Dust and Salmonella Transmission in Experimental Hatching Cabinets Using an Electrostatic Space Charge System. Poult. Sci. 2002, 81, 49–55. [Google Scholar] [CrossRef] [PubMed]
- Mitchell, B.; Waltman, W. Reducing Airborne Pathogens and Dust in Commercial Hatching Cabinets with an Electrostatic Space Charge System. Avian Dis. 2003, 47, 247–253. [Google Scholar] [CrossRef]
- Cambra-López, M.; Winkel, A.; Van Harn, J.; Ogink, N.; Aarnink, A. Ionization for Reducing Particulate Matter Emissions from Poultry Houses. Trans. ASABE 2009, 52, 1757–1771. [Google Scholar] [CrossRef]
- Winkel, A.; Mosquera, J.; Ogink, N. Removal Efficiency of a Wire-to-Plate Electrostatic Precipitator for Abatement of Particulate Matter Emission from Poultry Houses; American Society of Agricultural and Biological Engineers: St. Joseph, MI, USA, 2012; p. 3. [Google Scholar]
- Winkel, A.; Van Riel, J.; Van Emous, R.; Aarnink, A.; Koerkamp, P.G.; Ogink, N. Abatement of Particulate Matter Emission from Experimental Aviary Housings for Laying Hens by Spraying Rapeseed Oil. Poult. Sci. 2016, 95, 2836–2848. [Google Scholar] [CrossRef]
- Manuzon, R.; Zhao, L.; Gecik, C. An Optimized Electrostatic Precipitator for Air Cleaning of Particulate Emissions from Poultry Facilities. ASHRAE Trans. 2014, 120. [Google Scholar]
- Knight, R.M.; Zhao, L.; Zhu, H. Modelling and Optimisation of a Wire-Plate ESP for Mitigation of Poultry PM Emission Using COMSOL. Biosyst. Eng. 2021, 211, 35–49. [Google Scholar] [CrossRef]
- Lim, T.T.; Heber, A.J.; Ni, J.; Zhao, L.; Hanni, S.H. Effects of Electrostatic Space Charge System on Particulate Matter Emission from High-Rise Layer Barn; American Society of Agricultural and Biological Engineers: St. Joseph, MI, USA, 2008; p. 1. [Google Scholar]
- Mitchell, B.; Richardson, L.; Wilson, J.; Hofacre, C. Application of an Electrostatic Space Charge System for Dust, Ammonia, and Pathogen Reduction in a Broiler Breeder House. Appl. Eng. Agric. 2004, 20, 87. [Google Scholar] [CrossRef]
- Veenhuizen, M.; Bundy, D. Electrostatic Precipitation Dust Removal System for Swine Housing; American Society of Agricultural Engineers: St. Joseph, MI, USA, 1990; p. 1. [Google Scholar]
- Costa, N.; Accioly, J.; Cake, M. Determining Critical Atmospheric Ammonia Levels for Cattle, Sheep and Goats-a; Brisbane Meat & Livestock Australia Ltd.: Sydney, Australia, 2003; ISBN 1740362969. [Google Scholar]
- Van Buggenhout, S.; Van Brecht, A.; Özcan, S.E.; Vranken, E.; Van Malcot, W.; Berckmans, D. Influence of Sampling Positions on Accuracy of Tracer Gas Measurements in Ventilated Spaces. Biosyst. Eng. 2009, 104, 216–223. [Google Scholar] [CrossRef]
- Calvet, S.; Van den Weghe, H.; Kosch, R.; Estellés, F. The Influence of the Lighting Program on Broiler Activity and Dust Production. Poult. Sci. 2009, 88, 2504–2511. [Google Scholar] [CrossRef]
- Yoder, M.; Van Wicklen, G. Respirable Aerosol Generation by Broiler Chickens. Trans. ASAE 1988, 31, 1510–1517. [Google Scholar] [CrossRef]


| Housing System | Location | Bird Density | Monitoring Device | PM Size | PM Emission (g day−1AU−1) | PM Concentration (mg m−3) | References |
|---|---|---|---|---|---|---|---|
| CC | Midwest, US | 200,000 | TEOMs | PM2.5 PM10 | N/A | 0.04 0.59 | [3] |
| CC | Midwest, US | 200,000 | TEOMs | PM2.5 PM10 | 0.9 * 15.7 * | N/A | [40] |
| CC | France | 45,257 ± 18,800 | Stationary captor | PM2.5 | N/A | 0.11 | [41] |
| CC | Germany | 1350 | Glass fiber filter | TSP | N/A | 0.6 1.25 | [42] |
| Caged layer | South Korea | 5636 | Gravimetric method and air sampling pump | TSP | N/A | 3.66 1.99 | [43] |
| Caged hen | UK | N/A | TEOMs, Micro Orifice Uniform Deposit Impactors | PM2.5 PM10 | 6.9 * 16.9 * | N/A | [44] |
| Furnished cages | Sweden | 7500 | Battery powered pump | TSP | N/A | 2.3 | [45] |
| Battery caged | Toledo, Spain | 100,000 | TEOMs | PM2.5 PM10 | N/A | 0.55 ± 0.38 | [46] |
| EC | Midwest, US | 50,000 | TEOMs | PM2.5 PM10 | 1.7 * 15.6 * | N/A | [40] |
| EC | Midwest, US | 50,000 | TEOMs | PM2.5 PM10 | N/A | 0.41 3.95 | [3] |
| EC | Toledo, Spain | 100,000 | TEOMs | PM2.5 PM10 | N/A | 0.024 ± 0.025 | [46] |
| EC | Germany | 1500 | Glass fiber filter | PM2.5 PM10 | N/A | 0.5 1.95 | [42] |
| EC | France | 45,257 ± 18,800 | Stationary captor | PM2.5 | N/A | 0.15 | [41] |
| CF | Beijing, China | 1800 | Arduino Mega2560 microcontroller, DFRobot sensor shield | PM2.5 PM10 TSP | N/A | 0.04 ± 0.03 0.42 ± 0.10 1.92 ± 1.91 | [47] |
| CF | Midwest, US | 50,000 | TEOMs | PM2.5 PM10 | 8.8 * 100.3 * | N/A | [40] |
| CF | Midwest, US | 50,000 | TEOMs | PM2.5 PM10 | N/A | 0.14 3.95 | [3] |
| CF | France | 20,750 ± 10,250 | Stationary captor | PM2.5 | N/A | 1.19 | [41] |
| CF | IOWA, USA | 50,000 | TEOMs | PM10 PM2.5 | 29.5 ± 11 2.1 ± 1.7 | 2.30 ± 1.60 0.25 ± 0.26 | [48] |
| CF | Netherlands | 35,000 and 24,712 | Virtual cascade impactors, DustTrack aerosol monitor | PM10 | N/A | 3.06 ± 1.54 | [17] |
| CF | Germany | 2300 | Glass fiber filter | PM2.5 PM10 | N/A | 2.3 5.4 | [42] |
| FR | France | 40,780 ± 16,804 | Stationary captor | PM2.5 | N/A | 0.37 | [41] |
| FR broiler | UK | N/A | TEOMs, Micro Orifice Uniform Deposit Impactors | PM2.5 PM10 | N/A | 0.66 2.99 | [44] |
| FR | Sweden | 6900 | Battery powered pump | TSP | N/A | 12 | [45] |
| FR | Netherlands | 16,500 and 3850 | Virtual cascade impactors, DustTrack aerosol monitor | PM10 | N/A | 3.94 ± 0.69 | [17] |
| Broiler | Netherlands | 50,400 and 2675 | Virtual cascade impactors, DustTrack aerosol monitor | PM10 | N/A | 1.96 ± 0.55 | [17] |
| Broiler | South Korea | 5636 | Gravimetric method and air sampling pump | TSP | N/A | 5.08 2.75 | [43] |
| Broilers | UK | N/A | TEOMs, Micro Orifice Uniform Deposit Impactors | PM2.5 PM10 | 5.1 31.6 * | N/A | [44] |
| Free-range hen | UK | N/A | TEOMs, Micro Orifice Uniform Deposit Impactors | PM2.5 PM10 | 36.4 * 139 * | N/A | [44] |
| Turkey | Netherlands | 5000 and 4040 | Virtual cascade impactors, DustTrack aerosol monitor | PM10 | N/A | 2.32 ± 0.99 | [17] |
| Two Commercial laying hen | Ontario, CA | 65,000 70,000 | DustTrak aerosol analyzers | PM10 PM2.5 | 2.55 ± 2.10 1.10 ± 1.52 | 0.19 ± 0.17 0.03 ± 0.03 | [37] |
| MB layer | South Korea | 5636 | Gravimetric method and air sampling pump | TSP | N/A | 4.42 2.25 | [43] |
| MB 1 MB 2 | Indiana, USA | 200,000 180,000 | Tapered Element Oscillating Microbalances (TEOM) | PM10 | N/A | 0.42 ± 0.43 0.76 ± 0.66 | [9] |
| Two HR. | Midwest, USA | 250,000 per HR | TEOMs | Total | 20.6 ± 22.5 * | N/A | [5] |
| HR layer | North Carolina, USA | 103,000 | TEOMs | PM2.5 PM10 TSP | 0.12 ± 0.26 6.03 ± 2.63 14.2 ± 5.23 | N/A | [49] |
| HR 1 HR 2 | Indiana, USA | 200,000 180,000 | Tapered Element Oscillating Microbalances (TEOM) | PM10 | N/A | 0.54 ± 0.30 0.55 ± 0.34 | [9] |
| HR layers | California, USA | 32,500 | Tapered element oscillating microbalance (TEOM) | PM2.5 PM10 TSP | 5.9 ± 12.6 33.4 ± 27.4 78.0 ± 42.7 | N/A | [30] |
| HR layers | IOWA, USA | 250,000 | TEOMs | PM10 PM2.5 | 8.16 ± 4.94 1.13 ± 1.16 | 0.39 ± 0.26 0.044 ± 0.04 | [50] |
| Multilevel system | Sweden | 13,500 | Battery powered pump | TSP | 1.8 | [45] |
| Bedding Material | Source | PM Sizes | PM Emission (mg/m3) | References |
|---|---|---|---|---|
| Cornstalk chip | Broiler | TSP | 6.5 | [58] |
| Sugarcane top chips | Broiler | TSP | 6.8 | [58] |
| Wood shaving | Laying hens | TSP | 2.3 | [56] |
| Wood shaving | Broiler | PM2.5 * PM10 * | 1.05 20.3 | [55] |
| Sawdust | Dairy farm | TSP | 0.51 | [59] |
| Wheat straw | Broiler | TSP | 6.9 | [58] |
| Rapeseed straw | Broiler | PM2.5 * PM10 * | 0.98 20.6 | [55] |
| Rapeseed straw | Broiler | PM2.5 * PM10 * | 0.97 and 20.5 | [55] |
| Clover straw | Broiler | TSP | 6.7 | [58] |
| Chopped straw | Laying hens | TSP | 2.1 | [56] |
| Straw | Dairy farm | TSP | 0.53 | [59] |
| Chopped palm spines | Broiler | TSP | 6.5 | [58] |
| Corn ear husks | Broiler | TSP | 6.8 | [58] |
| Silage maize | Broiler | PM2.5 * PM10 * | 0.85 21.0 | [55] |
| Chopped paper | Laying hens | TSP | 2.6 | [56] |
| Peat | Laying hens | TSP | 1.7 | [56] |
| Compost | Dairy farm | TSP | 1.38 | [59] |
| Clay pellets | Laying hens | TSP | 1.8 | [56] |
| Gravel | Laying hens | TSP | 4.7 | [56] |
| PM Size | Fall | Winter | Spring | Summer | References |
|---|---|---|---|---|---|
| PM1 | 0.01 | 0.03 | N/A | 0.02 | [63] |
| PM1 | 75.6 ± 14.1 | 136.0 ± 12.8 | 53.5 ± 6.3 | 14.9 ± 1.2 | [64] |
| PM1 | N/A | 0.12 ± 0.00 * | 0.09 ± 0.00 * | N/A | [65] |
| PM2.5 | 81.6 ± 15.1 | 144.2 ± 14.5 | 58.1 ± 6.9 | 15.8 ± 1.1 | [64] |
| PM2.5 | 0.05 | 0.10 | N/A | 0.07 | [63] |
| PM2.5 | 0.09–0.11 a | 0.09–0.20 a | 0.07–0.12 a | 0.06–0.10 a | [61] |
| PM2.5 | 0.29 ± 0.22 | 0.43 ± 0.27 | N/A | 0.067 ± 0.055 | [38] |
| PM2.5 | 0.23 ± 0.15 # | 0.30 ± 0.19 # | 0.81 ± 0.87 # | 2.46 ± 2.04 # | [37] |
| PM2.5 | 0.04 ± 0.02 | 0.06 ± 0.03 | 0.04 ± 0.03 | 0.08 ± 0.04 | |
| PM2.5 | N/A | 0.16 ± 0.006 * | 0.10 ± 0.00 * | N/A | [65] |
| PM4 | 0.32 ± 0.23 | 0.48 ± 0.31 | N/A | 0.074 ± 0.060 | [38] |
| PM10 | 0.10 | 0.24 | N/A | 0.15 | [63] |
| PM10 | 0.51–0.69 a | 0.71–0.88 a | 0.24–1.01 a | 0.15–0.21 a | [61] |
| PM10 | 94.8 ± 15.6 | 385.2 ± 16.6 | 183.0 ± 18.5 | 30.1 ± 1.9 | [64] |
| PM10 | 0.53 ± 0.35 | 0.69 ± 0.4 | N/A | 0.119 ± 0.011 | [38] |
| PM10 | 2.73 ± 1.91 # | 2.82 ± 2.42 # | 2.23 ± 2.08 # | 2.51 ± 2.08 # | [37] |
| PM10 | 0.50 ± 0.31 | 0.49 ± 0.43 | 0.16 ± 0.09 | 0.14 ± 0.08 | |
| PM10 | N/A | 0.49 ± 0.02 * | 0.63 ± 0.02 * | 0.56 ± 0.02 * | [65] |
| TSP | N/A | 2.22–4.96 a | N/A | 0.34–0.48 a | [61] |
| TSP | 147.8 ± 18.3 | 983.2 ± 86.1 | 413.2 ± 39.8 | 49.6 ± 3.6 | [64] |
| TSP | 4.16 ± 2.19 | 4.98 ± 2.29 | 4.41 ± 2.14 | 4.00 ± 1.94 | [43] |
| TSP | 1.93 ± 0.82 | 3.29 ± 1.68 | 2.35 ± 1.15 | 1.76 ± 0.84 | [43] |
| Location | Ventilation Type | Sensors | PM Size | PM Emission (mg d−1 bird−1) | PM Concentration (mg m−3) | References |
|---|---|---|---|---|---|---|
| China | TBM equipment with the main ventilation system | TSI 9306 dust sampler | TSP | N/A | 18.65 (closed) 14.25 (open) | [39] |
| China | Double-tunnel ventilation with air inlet | Self-developed portable device | PM2.5 PM10 | N/A | 0.06 0.04 | [67] |
| Mississippi, USA | Negative pressure ventilation | TSI DustTrak 8533 | PM1 PM2.5 PM4 PM10 TSP | N/A | 0.148 0.149 0.151 0.160 0.169 | [68] |
| North Carolina, USA | Tunnel-ventilation with 34 exhaust fans | Tapered element oscillating microbalance (TEOMs) | PM2.5 PM10 TSP | 0.37 ± 3.06 17.8 ± 14.9 43.1 ± 35.5 | N/A | [49] |
| California, USA | Portable 122 cm exhaust fan | TEOMs | PM2.5 PM10 TSP | 0.006 ± 0.013 0.033 ± 0.027 0.078 ± 0.043 | N/A | [30] |
| Saudi Arabia | Naturally | Particle counter device | PM2.5 PM10 TSP | N/A | 0.18 ± 0.06 4.81 ± 1.63 12.47 ± 5.2 | [69] |
| Mechanically | Particle counter device | PM2.5 PM10 TSP | N/A | 0.09 ± 0.05 2.26 ± 1.27 4.61 ± 3.1 |
| PM Sizes/Types | Effects of PM on Health, Behavior, and Welfare | References |
|---|---|---|
| PM2.5 | Consists of a high level of microorganisms and endotoxin, which affects health | [86] |
| PM2.5 | Induces developmental cardiotoxicity in chicken embryos and hatchling chickens | [89] |
| PM2.5 | Impaired lung function | [83] |
| PM10 | Increased risk of mortality rates | |
| PM10 | Increased risk of chronic bronchitis, cardiovascular illness, pneumonia lesions, asthma-like symptoms, and lung cancer | [21,22] |
| TSP | Decreased daily weight gain, increased lung inflammatory factors level, and may cause lung injury | [90] |
| Endotoxin+ dust | Decrease in cell-mediated immunity B-cell percentages | [87] |
| PM Sizes/Types | Effects of PM on Health, Behavior, and Welfare | References |
|---|---|---|
| PM2.5 | Greater risk to human health | [12,14] |
| PM2.5 | Damage human alveolar epithelial cells (A549 cells) and cause an inflammatory response | [95] |
| PM2.5 (long-term exposure) | Increases the risk of cardiopulmonary mortality | [11,94] |
| PM2.5 (10,000 mg/m3) | 24% increase in cardiovascular events and a 76% increase in mortality | [92] |
| PM10 | Premature death in humans with heart or lung disease Nonfatal heart attacks, irregular heartbeats, aggravated asthma, decreased lung function, irritation of the airways, coughing or difficulty breathing | [12,13] |
| PM10 (With endotoxin) | Affects the respiratory system, liver, kidneys, and nervous system, and may even enter the bloodstream | [12,14,82] |
| PM10 | Respiratory problems Increased mortality and morbidity rates | [11,94] |
| PM10 (High concentration) | Chronic bronchitis, asthma-like symptoms, cardiovascular disease, lung cancer, COPD, and pneumonia lesions. | [21,22,23] |
| PM10 (every increase in 7000 mg/m3) | 33% increase in COPD incidence | [93] |
| TSP | Higher asthmatic (42.5%) and nasal (51.1%) symptoms | [23] |
| TSP | Over-shift increase in respiratory symptoms and a decrease in pulmonary function tests were found. Causes harmful effects on the bronchi | [96] |
| PM > 0.1 mg/m3 | Coughing, chronic phlegm, and bronchitis | [97] |
| Organic dust | Acute inflammation and chronic bronchitis | [98] |
| Country/Organization | Occupational Exposure Limit | References |
|---|---|---|
| World Health Organization | PM2.5: 5 µg/m3 annual mean & 15 µg/m3 24-h mean (2011 standard) | [11] |
| PM2.5: 10 µg/m3 annual mean & 25 µg/m3 24-h mean (2005 standard) | [106] | |
| PM10: 15 µg/m3 annual mean & 45 µg/m3 24-h mean (2011 standard) | [11] | |
| PM10: 20 µg/m3 annual mean & 50 µg/m3 24-h mean (2005 standard) | [106] | |
| USA (EPA) | PM2.5: 35 µg/m3 24-h mean | [13] |
| PM10: 150 µg/m3 24-h mean | [13] | |
| PM2.5: 12 µg/m3 annual mean (primary standard *) | [103] | |
| PM2.5: 15 µg/m3 annual mean (secondary standard *) | [103] | |
| USA (Occupational Safety and Health Administration) | Total dust 10 mg/m3 and respirable friction dust 5 mg/m3 (regulator limit of 8-h time-weighted average) | [105] |
| Australia | PM2.5: 50 µg/m3 (1 h average) & 25 µg/m3 (24-h average) | [104] |
| UK | Total and respirable dust limits are 10 and 5 mg/m3, respectively | [107] |
| Spray System | Working Principle | Oil or Water Type | Application Rate (mL m−2d−1) | PM Size | PM Reduction (%) | References |
|---|---|---|---|---|---|---|
| Electrospray | Engineered water nanostructures | Water | 1 × 10⁵ # | PM15 | 83 | [115] |
| BETE fog spray nozzle | Droplet confine particles in a litter | Acidic electrolyzed water (0.1% NaCl solution and addition of 85% phosphoric acid) | 125 250 375 | Total PM | 71 ± 3 81 ± 1 89 ± 1 | [24] |
| Fixed oil spraying system + Driving oil spraying vehicle | A fog of oil droplets + A spray of fine droplets | Rapeseed oil | 12 15 30 | PM10 and PM2.5 | 60 and 53 21 and31 32 and 38 | [73] |
| Hand-held spraying lance | A spray of fine droplets | Rapeseed oil | 15 30 45 | PM10 PM2.5 | 27, 62, 82 71, 83, 94 | [73] |
| Full cone nozzles | Spraying | Rapeseed oil with water | 10% | Total dust | 30–50 | [54] |
| Sprayers with electrolytic cell generator | Droplet confine particles in a litter | Neutral electrolyzed water (pH 8.2) | 216 * | Airborne dust | 34 | [116] |
| Battery backpack sprayer | Water fogged | Water | 150 * 300 * 600 * | PM10 PM2.5 | 18 and 44 48 and 59 64 and 64 | [76] |
| Fixed oil spraying system | A spray of fine droplets | Rapeseed oil | 6 24 | PM2.5 PM10 | 84 and 48 80 and 87 | [75] |
| Spray nozzle | Droplets confine particles in a litter | Rapeseed oil + Water | 5 a | Airborne dust | 80–85 | [117] |
| Full cone nozzles | Droplet confine particles in a litter | Rapeseed oil | 8 16 | PM10 PM2.5 | 59 and 64 81 and 74 | [74] |
| Backpack sprayer | Sprinkling | Canola oil | 10–30 * | Total | 37–89 | [114] |
| Backpack sprayer | Sprinkled | Canola oil | Six application rates | Respirable Inhalable | 71 76 | [114] |
| Bedding Material | PM Sizes | PM Reduction (%) | References |
|---|---|---|---|
| Silage maize Wood shaving Wheat straw Rapeseed straw | PM2.5 * | 19%, but No significant difference between wood shaving, wheat straw, and rapeseed straw | [55] |
| chopped straw gravel peat wood shaving chopped paper clay pellets | Total dust | 19–64% reduction by clay pellets and peat compared to other | [56] |
| Wheat straw Clover straw Cornstalk chip Sugarcane top chips Chopped palm spines Corn ear husks | Airborne dust | No significant difference between materials | [58] |
| Compost Straw Sawdust | Total dust | 61% (straw) and 63% (sawdust) than compost | [59] |
| Chopped hay Chopped straw | Total dust | Significant effects | [131] |
| Scrubbers | PM2.5 (%) | PM10 (%) | TSP (%) | Airborne Total Bacteria (%) | References |
|---|---|---|---|---|---|
| Electrostatic spray wet scrubber | 85–88 | 85–94 | N/A | N/A | [134] |
| Chemical (90% NH3 reduction) Air Scrubber | 28 | 33 | N/A | N/A | [135] |
| Chemical (70% NH3 reduction) Air Scrubber | 33 | 41 | N/A | N/A | [135] |
| Multiple pollutants scrubber | 42 | 43 | N/A | N/A | [132] |
| Disinfectant Scrubber media: water Peracetic acid Ozone | N/A | N/A | 88 78 48 | 70 | [136] |
| Multi-stage scrubber | 47–90 | 61–93 | N/A | 46–85 | [133] |
| Bio-scrubber | N/A | N/A | 22 | N/A | [127] |
| Control Technology | Charging Units | Source | PM2.5 (%) | PM10 (%) | Total Dust (%) | Airborne Bacteria (%) | References |
|---|---|---|---|---|---|---|---|
| Prototype ESP under hot, warm and cold weather | 0.545 kV mm−1 | Poultry | 86.9 94.4 97.8 | 90.8 97.1 99.0 | N/A | N/A | [143] |
| Electrostatic particle ionization | Electrode −30 kV with 2 mA current | HR hen house | 66 * 30 # | 68 * 36 # | 68 * 45 # | N/A | [68] |
| Negative ionization system Positive ionization system | Electrode −30 kV with 2 mA current Electrode +30 kV with 2 mA current | Broiler | 49 6 | 68 0 | N/A | N/A | [73] |
| ESP | Electrode +30 kV with 0.2–1.0 mA current | CF hen | 45.3 | 57.0 | N/A | N/A | [66] |
| Optimized ESP | 9.6 to 13.6 KV with air velocity 0.8 to 2.2 m/s | Laying hen | 86 | 84 | 82 | N/A | [142] |
| Prototype ESP | +30 kVdc and <1 mA | Laying hen | 45 | 57 | N/A | N/A | [140] |
| Air Ionization | −30 kVdc and 0.9 mA | Broiler | 10 | 36 | N/A | N/A | [139] |
| ESCS | 25K–30K Vdc and 2 mA | HR layer house | N/A | 36 | 48 | N/A | [144] |
| ESCS | −30 kVdc and 2 mA | Broiler | N/A | N/A | 43 | N/A | [8] |
| ESCS | −30 kVdc and <0.5 mA | Broiler breeder | N/A | N/A | 61 | 67 | [145] |
| ESCS | −30 kVdc and 0.2 mA | Hatching cabinets | N/A | N/A | 77–79 | 93–96% Enterobacteriaceae 33–83% Salmonella | [138] |
| ESCS | −20 kVdc and 0.5 mA | Hatching cabinets | N/A | N/A | 94 | 93% Enterobacteriaceae | [137] |
| ESCS | N/A | Swine | N/A | N/A | 57–66 | N/A | [146] |
Publisher’s Note: MDPI stays neutral with regard to jurisdictional claims in published maps and institutional affiliations. |
© 2022 by the authors. Licensee MDPI, Basel, Switzerland. This article is an open access article distributed under the terms and conditions of the Creative Commons Attribution (CC BY) license (https://creativecommons.org/licenses/by/4.0/).
Share and Cite
Bist, R.B.; Chai, L. Advanced Strategies for Mitigating Particulate Matter Generations in Poultry Houses. Appl. Sci. 2022, 12, 11323. https://doi.org/10.3390/app122211323
Bist RB, Chai L. Advanced Strategies for Mitigating Particulate Matter Generations in Poultry Houses. Applied Sciences. 2022; 12(22):11323. https://doi.org/10.3390/app122211323
Chicago/Turabian StyleBist, Ramesh Bahadur, and Lilong Chai. 2022. "Advanced Strategies for Mitigating Particulate Matter Generations in Poultry Houses" Applied Sciences 12, no. 22: 11323. https://doi.org/10.3390/app122211323
APA StyleBist, R. B., & Chai, L. (2022). Advanced Strategies for Mitigating Particulate Matter Generations in Poultry Houses. Applied Sciences, 12(22), 11323. https://doi.org/10.3390/app122211323