Abstract
Recently, the ‘drive-by’ or vehicle scanning technique has attracted increasing attention over the last decade for the purpose of bridge health monitoring. The feasibility of this technique has been demonstrated by many field tests. In comparison to conventional bridge SHM, the concept of the drive-by bridge technique shows many advantages in terms of efficiency, economy, convenience, and mobility. It has been verified that wavelet transforms can successfully identify bridge damage and its location using the responses of a moving vehicle. However, the validity of this method is challenged by road roughness. This paper proposes a wavelet-based approach to detect bridge defects using wavelet energy. In addition, a damage index based on component wavelet energy is developed to localize the damage. A numerical simulation is modeled to verify the feasibility of the proposed approach, and the result shows that the proposed approach performs well even when considering road roughness in the vehicle and bridge interaction. Moreover, the effects of road surface profile, vehicle velocity, vehicle mass, noise signal, and different damage severity on the proposed approach are investigated. The proposed approach shows a great potential application in bridge health monitoring using indirect measurements from a moving vehicle.
1. Introduction
As a unique structure, bridges play a vital role in road networks. With the rapid development of the world economy, bridge structures are increasingly built throughout the world and their condition is central to ensuring the required safety levels and effective operation of the traffic networks. Thus, it is essential to periodically implement bridge condition evaluations for maintaining the structural integrity of the bridges. ASCE [1] reports that there are more than 617,000 bridges in the U.S., of which over 250,000 bridges are at least 50 years old. In order to solve the huge labor-intensive problem of all bridge monitoring under visual/manual inspection, electronic monitoring of bridges has received increasing attention over the last decade, which is referred to as bridge structural health monitoring (SHM). In general, bridge SHM has four levels [2]: (1) identify the presence or absence of damage, (2) localize the damage, (3) determine the extent of the damage, and (4) assess the bridge’s remaining life.
For bridge SHM, many sensors are usually installed on the structure and the structural vibration responses are used as input signals for evaluating the bridge conditions [3]. In addition, this approach requires a continuous power supply, which is expensive to some extent [4]. As a result, the online SHM system is commonly applied to long-span bridges or some special/important bridge structures. It must be admitted that short-span and mid-span bridges make up a significant portion of the road network bridge inventory but have no corresponding SHM system. Therefore, it is necessary to develop more efficient and economical bridge SHM methods for short- and medium-span bridges.
The technique of ‘drive-by’ or vehicle scanning bridge SHM provides a promising method, namely by using the indirect measurements from a moving vehicle [2,5,6,7,8,9]. Yang, et al. [10] first demonstrated the effectiveness of extracting the bridge frequencies using vehicle accelerations and proposed the potential application for bridge SHM [11]. Later, field experiments verified the effectiveness of extracting the bridge’s fundamental frequency using indirect measurements [12,13]. In comparison to conventional bridge SHM, the concept of drive-by bridge SHM shows many advantages in terms of efficiency, economy, convenience, and mobility [14]. Therefore, recently, this technology has received extensive attention and achieved great development. Most related investigations focus on extracting the bridge dynamic parameters with indirect measurements, i.e., frequencies [6,14,15,16,17,18,19], damping [5,20,21,22], and mode shapes [8,23,24,25,26,27,28,29]. The change of those modal properties is frequently used for bridge damage detection.
In addition to modal properties, some damage indexes associated with the drive-by concept using signal processing methods are proposed, such as wavelet transform and Hilbert transforms [30,31,32,33]. Wavelet transform is often used in bridge SHM because it analyzes signals in both frequency and time domains. One of the most critical features of wavelet transform is that it is sensitive to discontinuity in the signal. Therefore, wavelet transform can be used to indicate the damage location. Khorram, et al. [34] applied the wavelet transform to localize the crack of an Euler–Bernoulli beam under a moving force. In this approach, both the fixed sensor (installed on the beam) and the moving sensor (installed on the moving force) are studied to detect the defect. The results show that the wavelet coefficients associated with wavelet Gaussian 4 have the highest magnitude at the exact location of the crack, and moving sensors are more efficient than fixed sensors. Later, Nguyen and Tran [35] numerically investigated to identify multi-cracks with wavelet analysis using indirect measurements from vehicle vibrations. Based on the Shannon entropy, Tan, Elhattab, and Uddin [9] developed a method to automatically select the optimal wavelet scale for identifying the damage location when wavelet transform is applied. In addition, the wavelet transform was used to apply to the identified mode shapes for detecting bridge damage and even the damage location [36,37,38]. Furthermore, a parameter study on localizing the bridge damage using the wavelet transform and vehicle responses was numerically and experimentally presented [39]. The effect of the bridge span, damage extent, vehicle velocity and mass, and road surface profile on the accuracy of the results are studied.
Hester and Gonzalez [40] and Hester and Gonzalez [41] demonstrated that road roughness has a significant, negative impact on detecting bridge damage using the wavelet transform. If the road surface profile is considered in the vehicle–bridge interaction (VBI) model, the wavelet transform fails to detect the bridge defect when the vehicle responses are applied to the wavelet transform directly. Wavelet-based energy is also used to detect the bridge defect [2,42]. The bridge frequency can be obtained using the wavelet pseudo frequency, and the change in pseudo frequency, therefore, can reflect the bridge’s healthy conditions. However, the pseudo frequency in wavelet analysis cannot provide any resource of information for times/locations. In other words, the wavelet pseudo frequency can only achieve the first level of bridge SHM, namely identifying the presence or absence of damage.
It is well known that it is sometimes challenging to extract the bridge frequency using the drive-by technique of bridge SHM [4]. This paper employs the wavelet analysis of vehicle accelerations to compute the wavelet energy. Instead of extracting the bridge frequency using the wavelet pseudo frequency, the change of the peak wavelet energy is used to estimate the bridge conditions. As already mentioned, this only realizes the first level of bridge SHM. To achieve the second level of bridge SHM, namely finding the damage location, a damage location index is proposed based on the component wavelet energy. The bridge span is divided evenly into 10 parts and each corresponding vehicle response is used to calculate the component wavelet energy. The validity of the proposed approach is verified by a numerical simulation and the effects of road roughness, vehicle mass, vehicle speed, and signal noise are investigated. The result shows that the proposed approach has a potential application in bridge health monitoring using indirect measurements.
2. Theory Background of Drive-by Bridge SHM
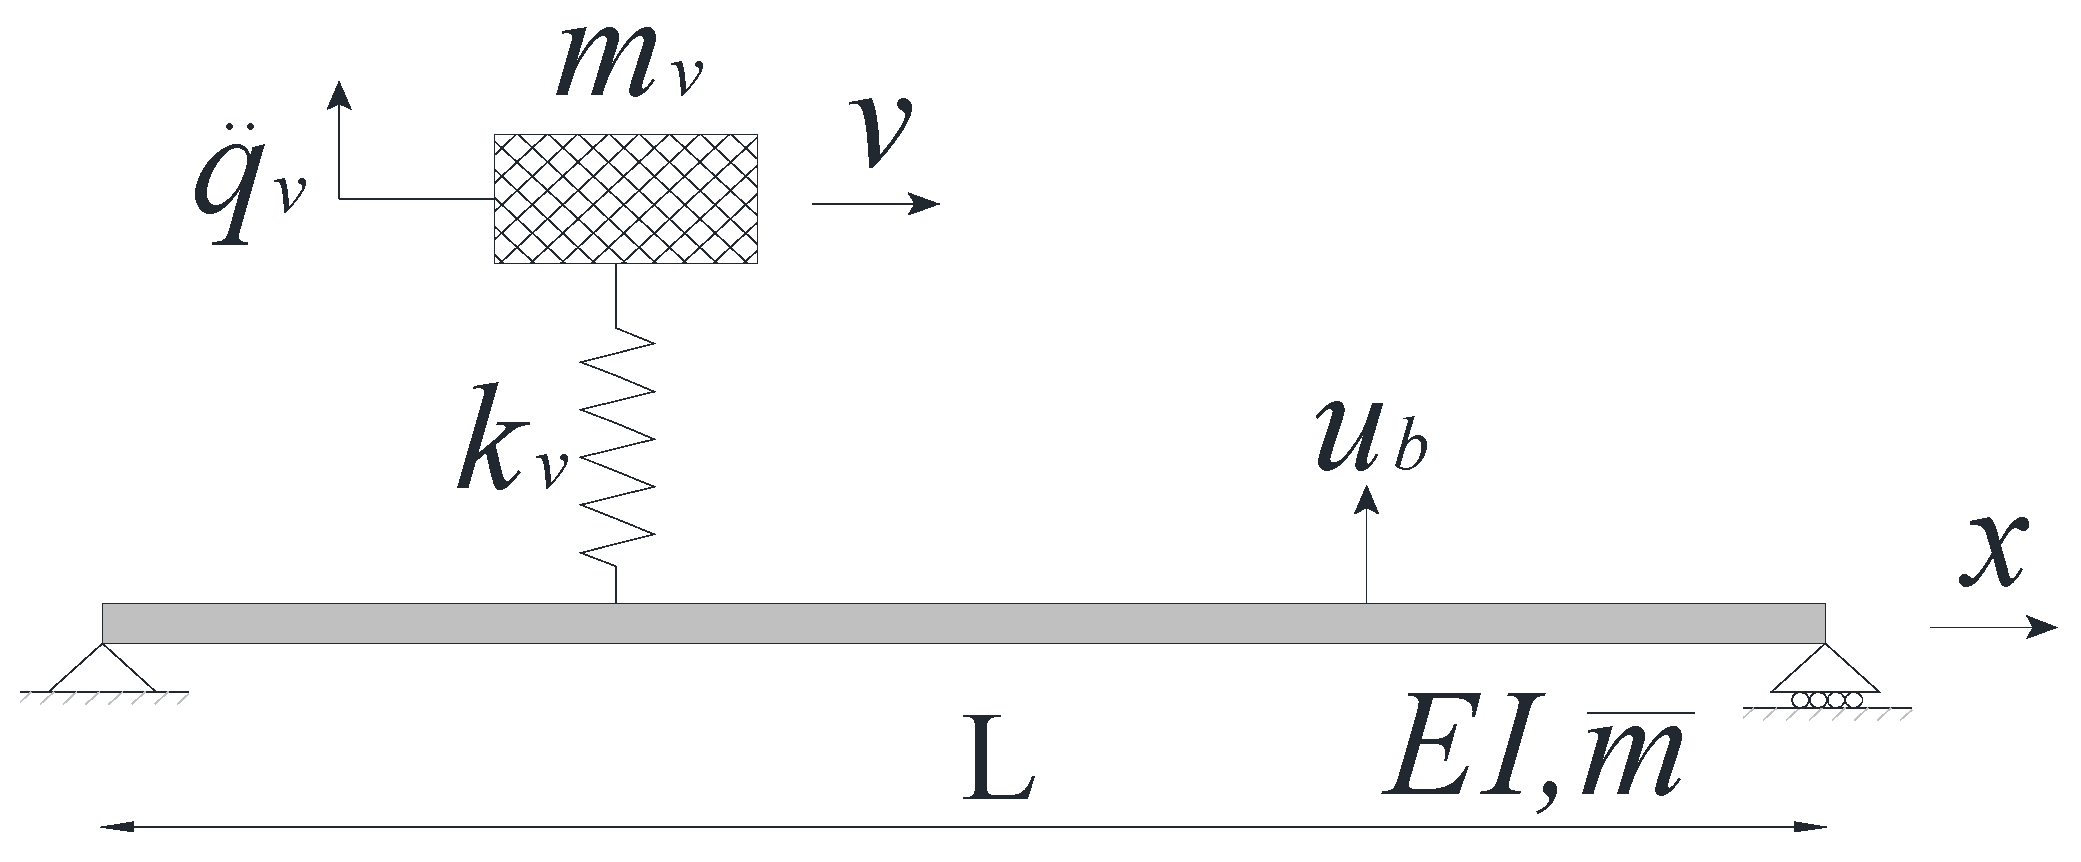
Without losing the generality of VBI, a simple model of the VBI system is introduced and illustrated in Figure 1, where the bridge is represented as an Euler–Bernoulli beam and the vehicle is represented as a sprung mass. The mass of the vehicle and the supported stiffness are represented as and , respectively. The Euler–Bernoulli beam is simply supported, with a length of . The bending rigidity of this beam is , and the density of this beam is per unit length. The vehicle travels across this bridge with a constant velocity, .
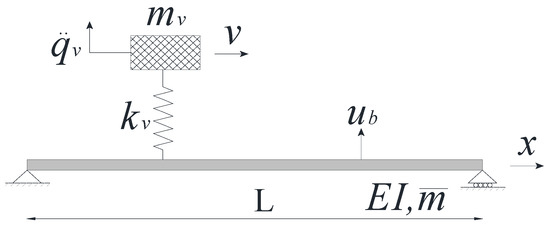
Figure 1.
A simple VBI model.
For the VBI system, the equations of motion are
where and represent the vertical displacements of the vehicle and the modeled beam, respectively, and a dot and a prime denote the derivatives with respect to time and with respect to the longitudinal distance coordinate , respectively. represents the Dirac delta function; represents the contact force between beam and vehicle, expressed as
where represents the acceleration due to gravity.
The modal superposition method is used to solve Equation (2) and the result is shown in Equation (4), where and are the mode shapes and modal coordinates of the bridge.
Assuming that the mass of the bridge is much greater than that of the vehicle, i.e., , the displacement responses of the bridge to the traveling vehicle can be approximately calculated as [10]
where
Once the displacement response of the bridge, , is solved, one can substitute it in Equation (1) and solve the displacement response of the vehicle by Duhamel’s integral [43]:
where the coefficients, are
in which
Therefore, the acceleration response of the vehicle can be obtained by taking two derivatives of the displacement response of the vehicle, expressed as
with the coefficients as
As shown, the acceleration response of the vehicle contains five frequencies, i.e., the vehicle frequency , shifted driving frequencies , and shifted bridge frequencies . In addition, which frequencies dominate this response depends on the coefficients , determined by the properties of the VBI. In sum, the bridge’s dynamic properties affect the vehicle responses when the vehicle travels over the bridge.
3. Method for Bridge Damage Detection
When bridge health conditions change, the dynamic parameters of the bridge will change to a certain extent. As shown above, the vehicle responses will change as well. However, due to the limited VBI effect time, FFT-based extracted bridge frequencies have a low resolution in the frequency domain that cannot reflect the change of the frequencies. This paper proposes to use wavelet energy for bridge damage detection using vehicle responses.
3.1. Wavelet Analysis
Like Fourier transform, wavelet transform uses a family of wavelet functions to express or approximate the target signal , defined as
where
is referred to as the daughter wavelet function derived from the mother wavelet function , which meets the properties of and . a represents the scale factor for wavelet transform, which is inversely related to wavelet pseudo frequency. b represents the shift factor related to the temporal translation of the mother wavelet function or its location in . In general, the high value of scale uses the stretched wavelet to represent the target signal, namely giving a low-frequency content. Conversely, a low-scale wavelet result implies giving a high-frequency content. Mathematically, the relationship between the wavelet pseudo frequency, , and scale, a, is expressed as
where denotes the central frequency of the mother wavelet in Hz and denotes the sampling period of the signal. Tan, Elhattab, and Uddin [2] pointed out that a dominated frequency in a signal can be detected with the wavelet pseudo frequency using the wavelet coefficient energy. A peak wavelet coefficient energy reflects a dominated frequency in a signal. Energy is a conventional measurement of a signal. Similarly, it can be used to measure the wavelet coefficients, , and the mathematical expression is
For a particular scale, the wavelet coefficient energy can be calculated as
3.2. Assessing Bridge Conditions with the Vehicle Response
An instrumented vehicle travels across the bridge at a constant velocity and the corresponding acceleration response of the vehicle is measured. Then, the signal is applied to the wavelet transform for calculating the wavelet coefficient energy and the wavelet pseudo frequency of the VBI system. A peak wavelet energy represents a dominant frequency in the vehicle’s acceleration and the change of this peak energy can be used to assess the bridge conditions.
3.3. Identifying Bridge Damage Location
Compared with a healthy bridge, the change in wavelet energy can be used as an indicator of the presence of bridge damage. However, it only implements the first level of bridge SHM. In order to achieve the second level of bridge SHM, i.e., to localize the bridge damage, the measured acceleration is evenly divided into portions (e.g., ten) as shown in Figure 2. In fact, each portion signal is the response when the vehicle moves on the corresponding beam segment. For the sake of clarity, the measured vehicle accelerations for the undamaged bridge and damaged bridge are labeled as and , respectively. Based on Equation (27), their wavelet energies are calculated as and , respectively. Both signals, and , are divided into ten portions, labeled as (I = 1~10) and (j = 1~10). Similarly, those component signals of and can also be used to obtain the corresponding wavelet energy, labeled as and , respectively. A damage location index is proposed and expressed as
where

Figure 2.
Divide the vehicle acceleration signal.
Theoretically, when a bridge is damaged, all component acceleration responses vary to some extent, as well as their corresponding wavelet energies. For the bridge damage at the beam segment No. i, it is found that the change in is great while this is not obvious in . Therefore, the bridge damage at beam segment No. i has the maximum value of . In this way, the index can be used to approximately indicate the bridge damage location.
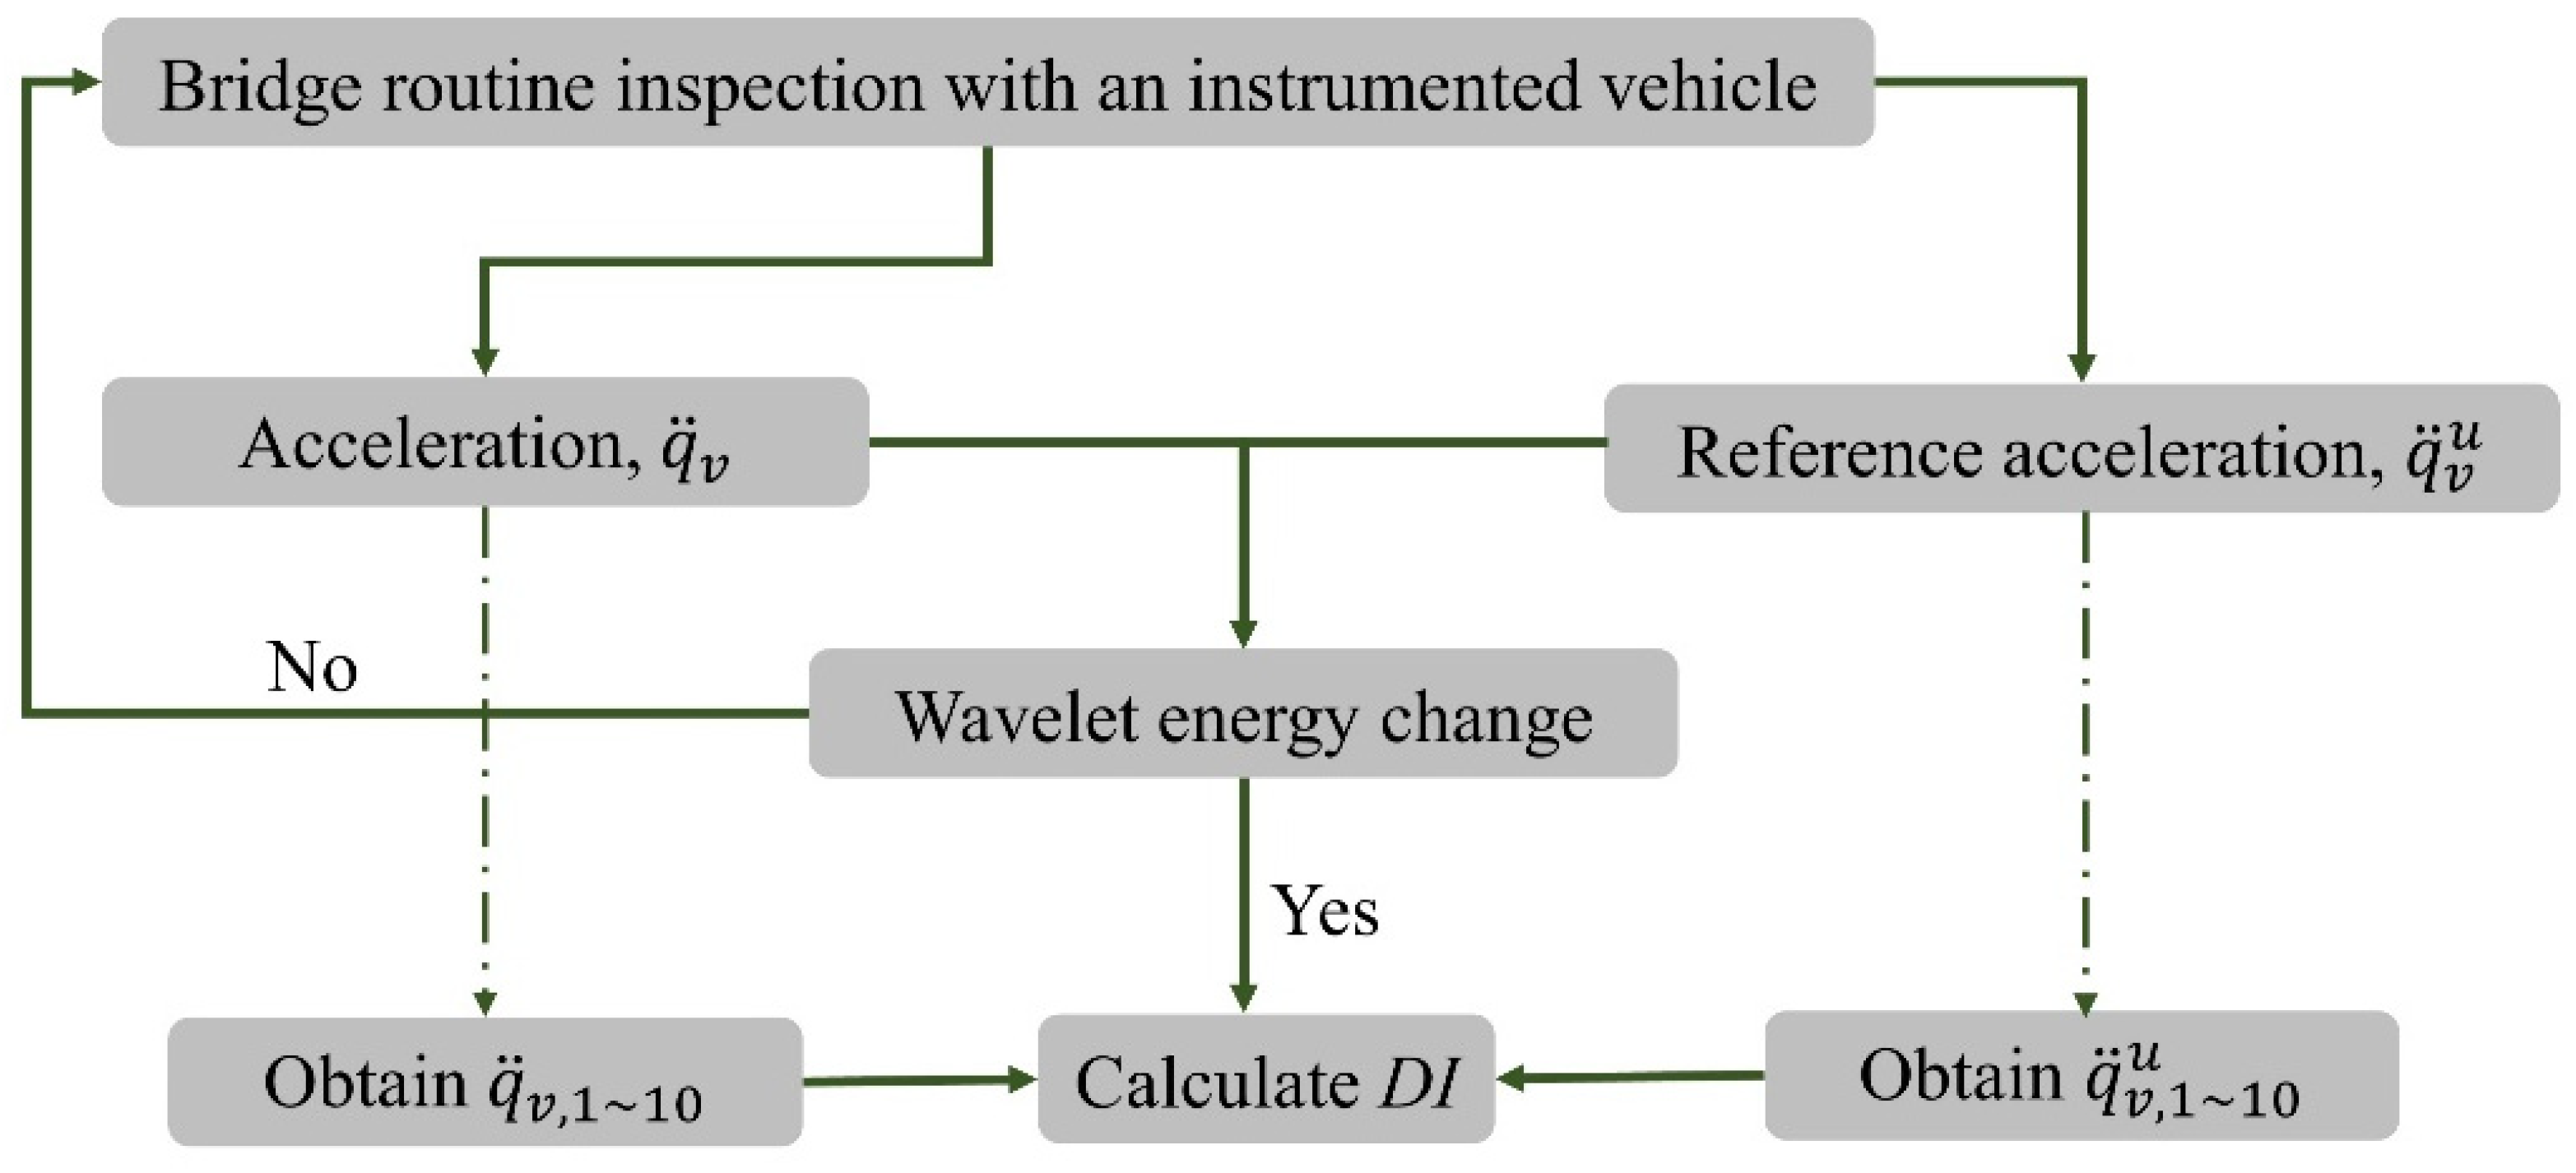
Figure 3 shows the process of the fast wavelet-based bridge damage detection method. In this method, a reference acceleration associated with the healthy bridge conditions is required for a baseline. Based on the description in Section 3.2, the change of wavelet energy can be used to indicate the bridge conditions. When bridge damage is determined, Equation (29) is then used to identify the damage location.
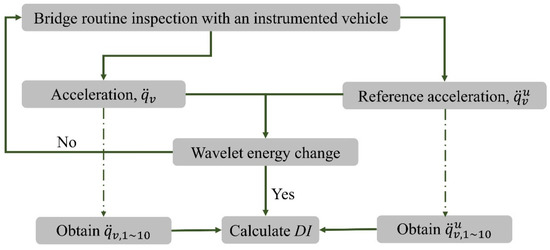
Figure 3.
A flowchart for bridge damage detection.
4. Numerically Verification
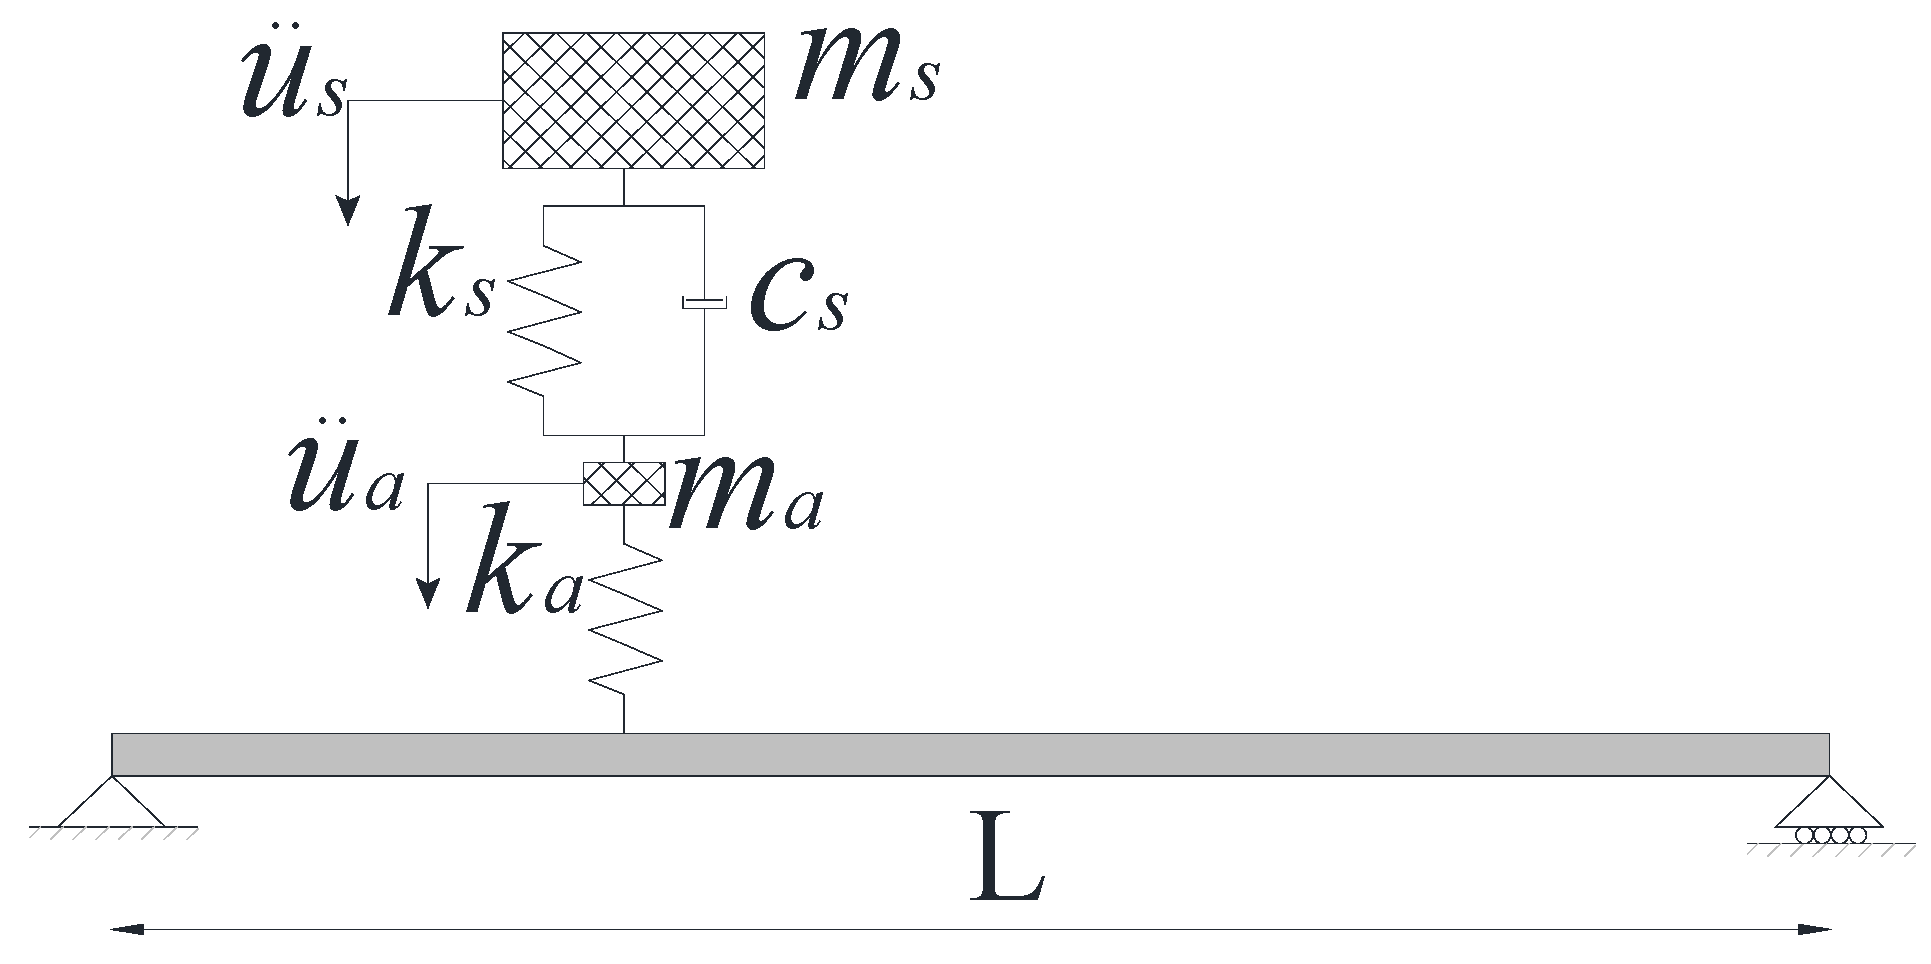
To verify the effectiveness of the proposed approach, a quarter-car VBI model is adopted as illustrated in Figure 4. The properties of the VBI system are listed in Table 1. An approach with 30 m is simulated in this model to ensure the balance of the dynamic behavior of the vehicle before entering the bridge. Rayleigh-type damping is considered for the bridge in this model, with a damping ratio of 2%. In this case, the 1st natural frequency of the bridge, , is 2.17 Hz. The vehicle’s frequencies, and , are 0.57 Hz and 9.89 Hz, respectively. The vehicle travels across the bridge at a constant velocity of 2.5 m/s. The scanning frequency of the VBI system is 1000 Hz. The damage model of Sinha, et al. [44] is used to simulate the bridge damage, assuming that the longitudinal length of the damage covers an area three times the beam depth. In this region, bridge element stiffness varies according to the degree of damage, which is defined as the ratio of damage/crack depth to intact beam depth. For example, a damage level of 0.4 or 40% means that for a beam with a depth of 0.8 m, the crack depth is 0.32 m.
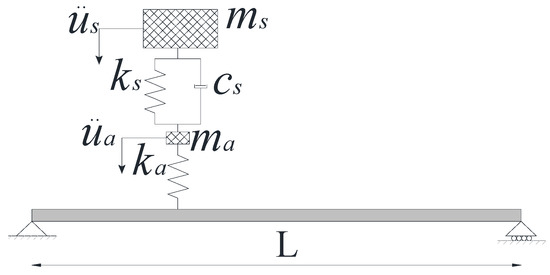
Figure 4.
The VBI model with a quarter car.

Table 1.
The properties of the VBI model.
4.1. The Effect of Road Roughness
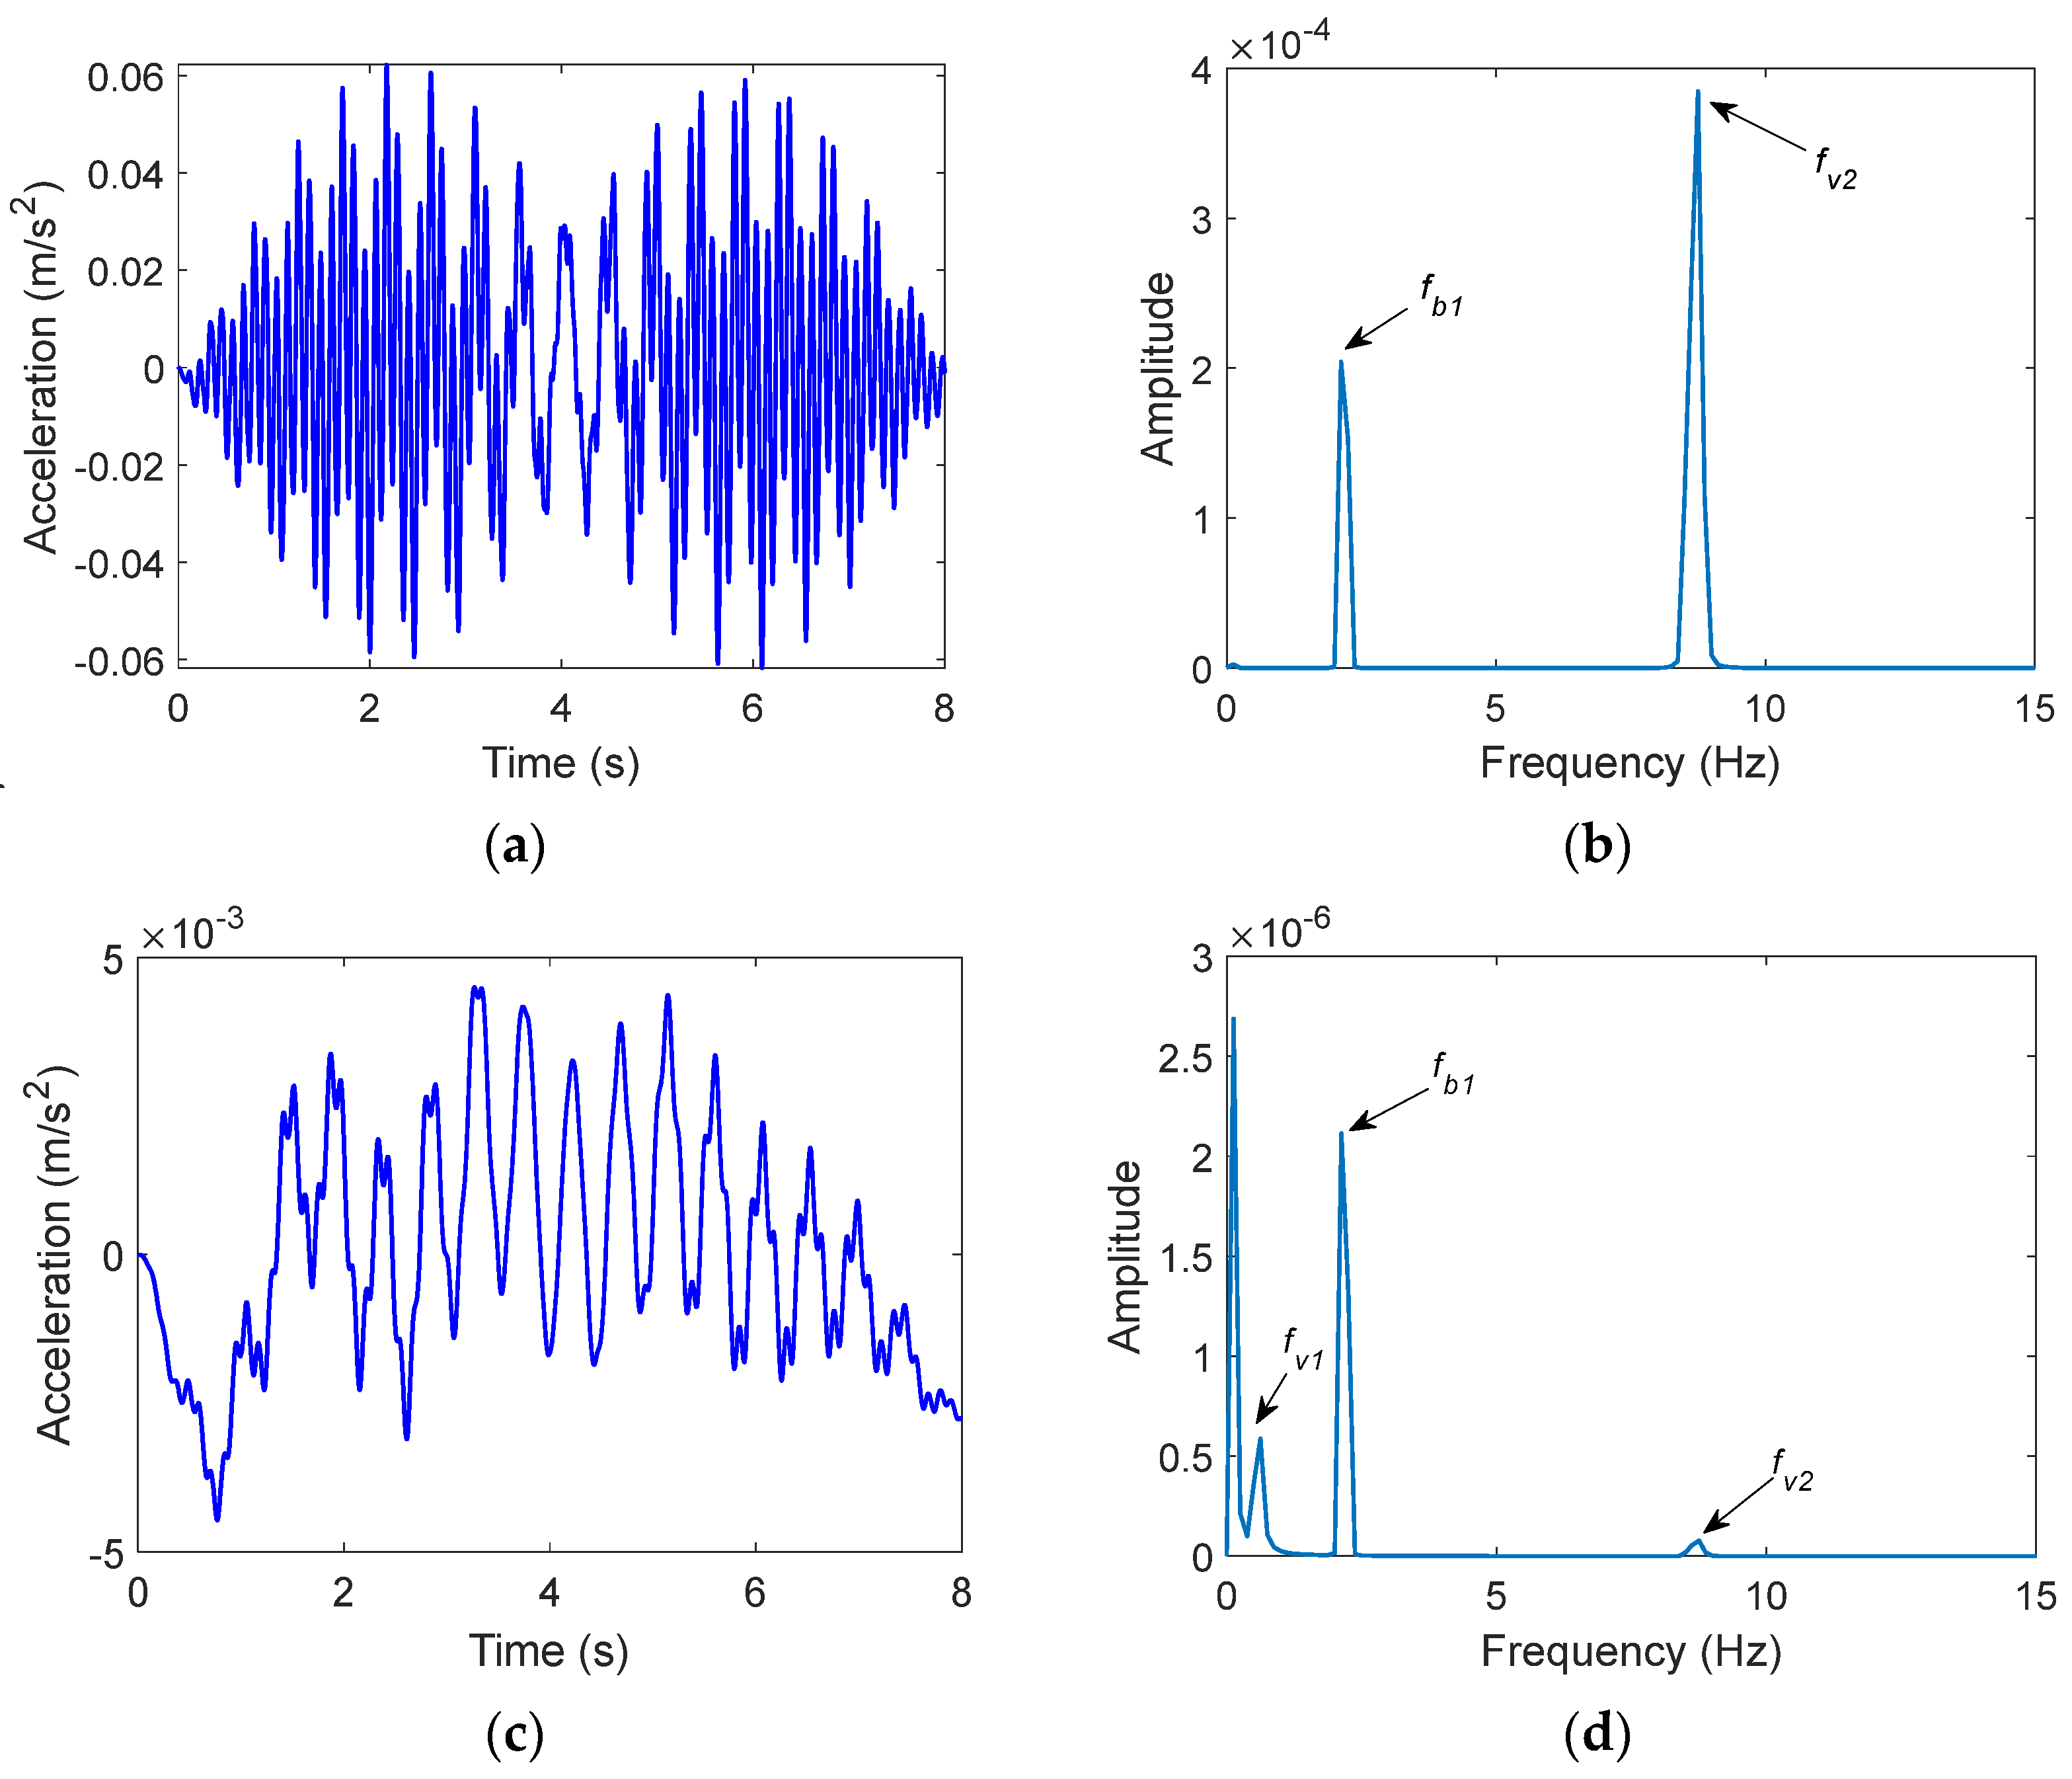
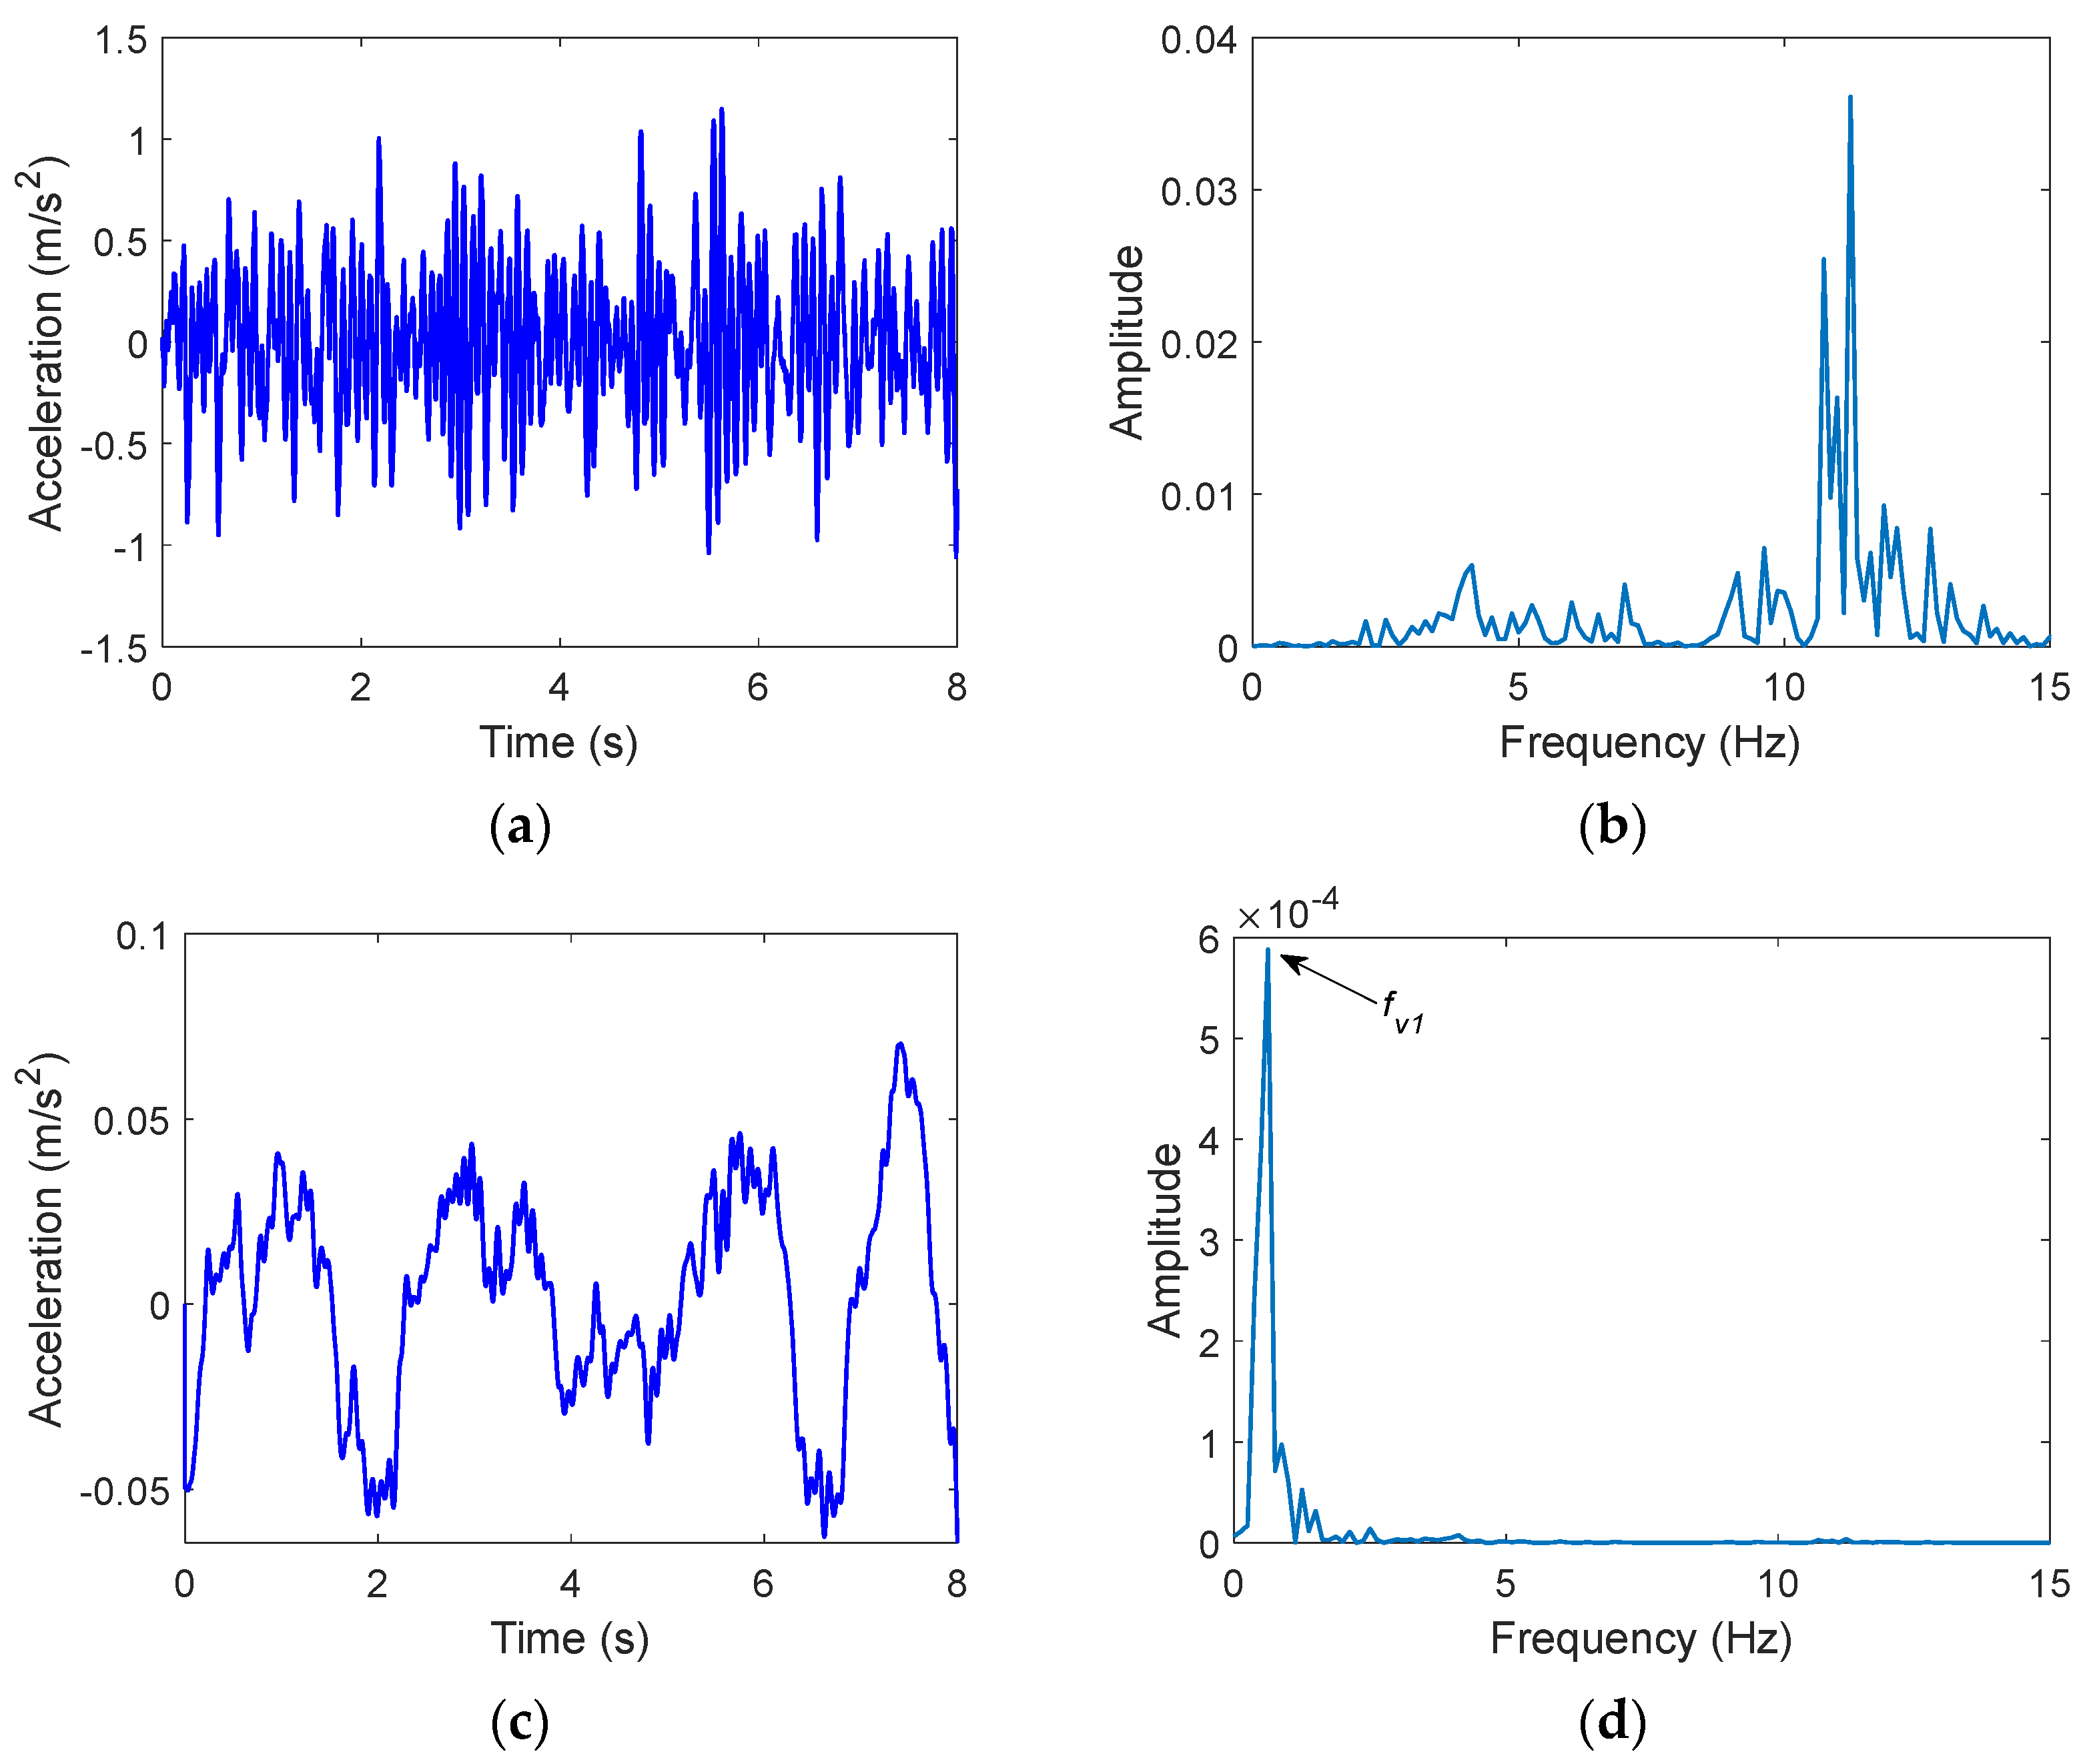
Road roughness is one of the main challenges in the application of the drive-by bridge SHM [4]. To investigate this effect, the road profile is first not considered in the VBI system. Figure 5 shows the accelerations of the axle and the vehicle body for the healthy bridge conditions, as well as their spectrums with FFT. As described in the theoretical background of drive-by bridge SHM, the vehicle responses contain the bridge’s modal information. Both accelerations are dominated by the 1st natural frequency of the bridge, as well as the vehicle’s vibration frequencies. Based on the power spectral density–curve, as shown in ISO 8608 [45], a road profile with a ‘class A’ is then randomly generated. The corresponding results are illustrated in Figure 6 when this road profile is considered in the VBI system. As shown, the axle acceleration is more sensitive to road roughness, where the undesirable frequencies caused by road roughness cover the frequencies of the VBI system. No useful information can be found from it directly. For the vehicle responses of the vehicle body, the road profile excites the vibration of the vehicle itself and the spectrum is dominated by the , but without a clue for the 1st natural frequency of the bridge, . It is demonstrated that road roughness has an intensively negative effect on the drive-by bridge SHM. The response of the vehicle body may be more suitable for implementing the drive-by bridge SHM than the axle response, as it is less negatively affected by road roughness.
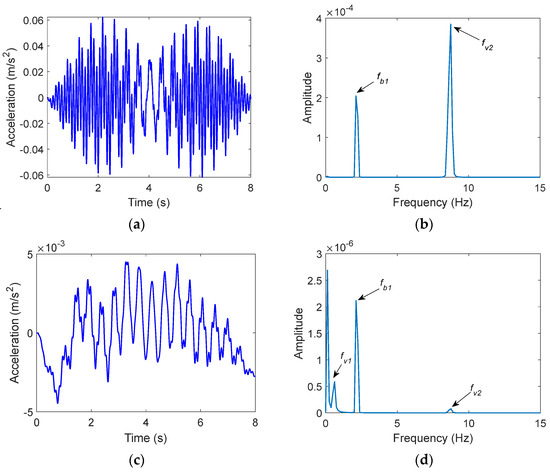
Figure 5.
Vehicle responses and its spectrums without road roughness. (a) the axle acceleration ; (b) spectrum for ; (c) the vehicle body acceleration ; (d) spectrum for .
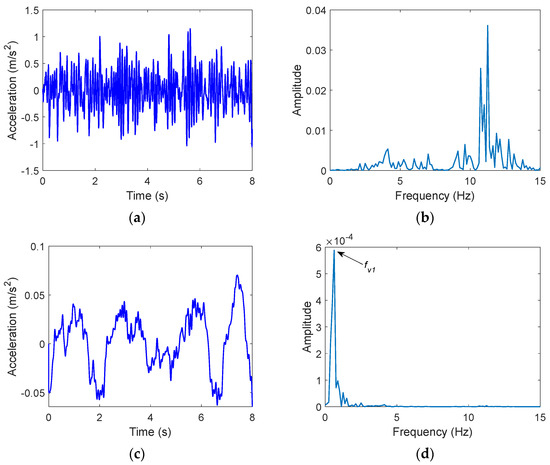
Figure 6.
Vehicle responses and its spectrums with road roughness. (a) the axle acceleration ; (b) spectrum for ; (c) the vehicle body acceleration ; (d) spectrum for .
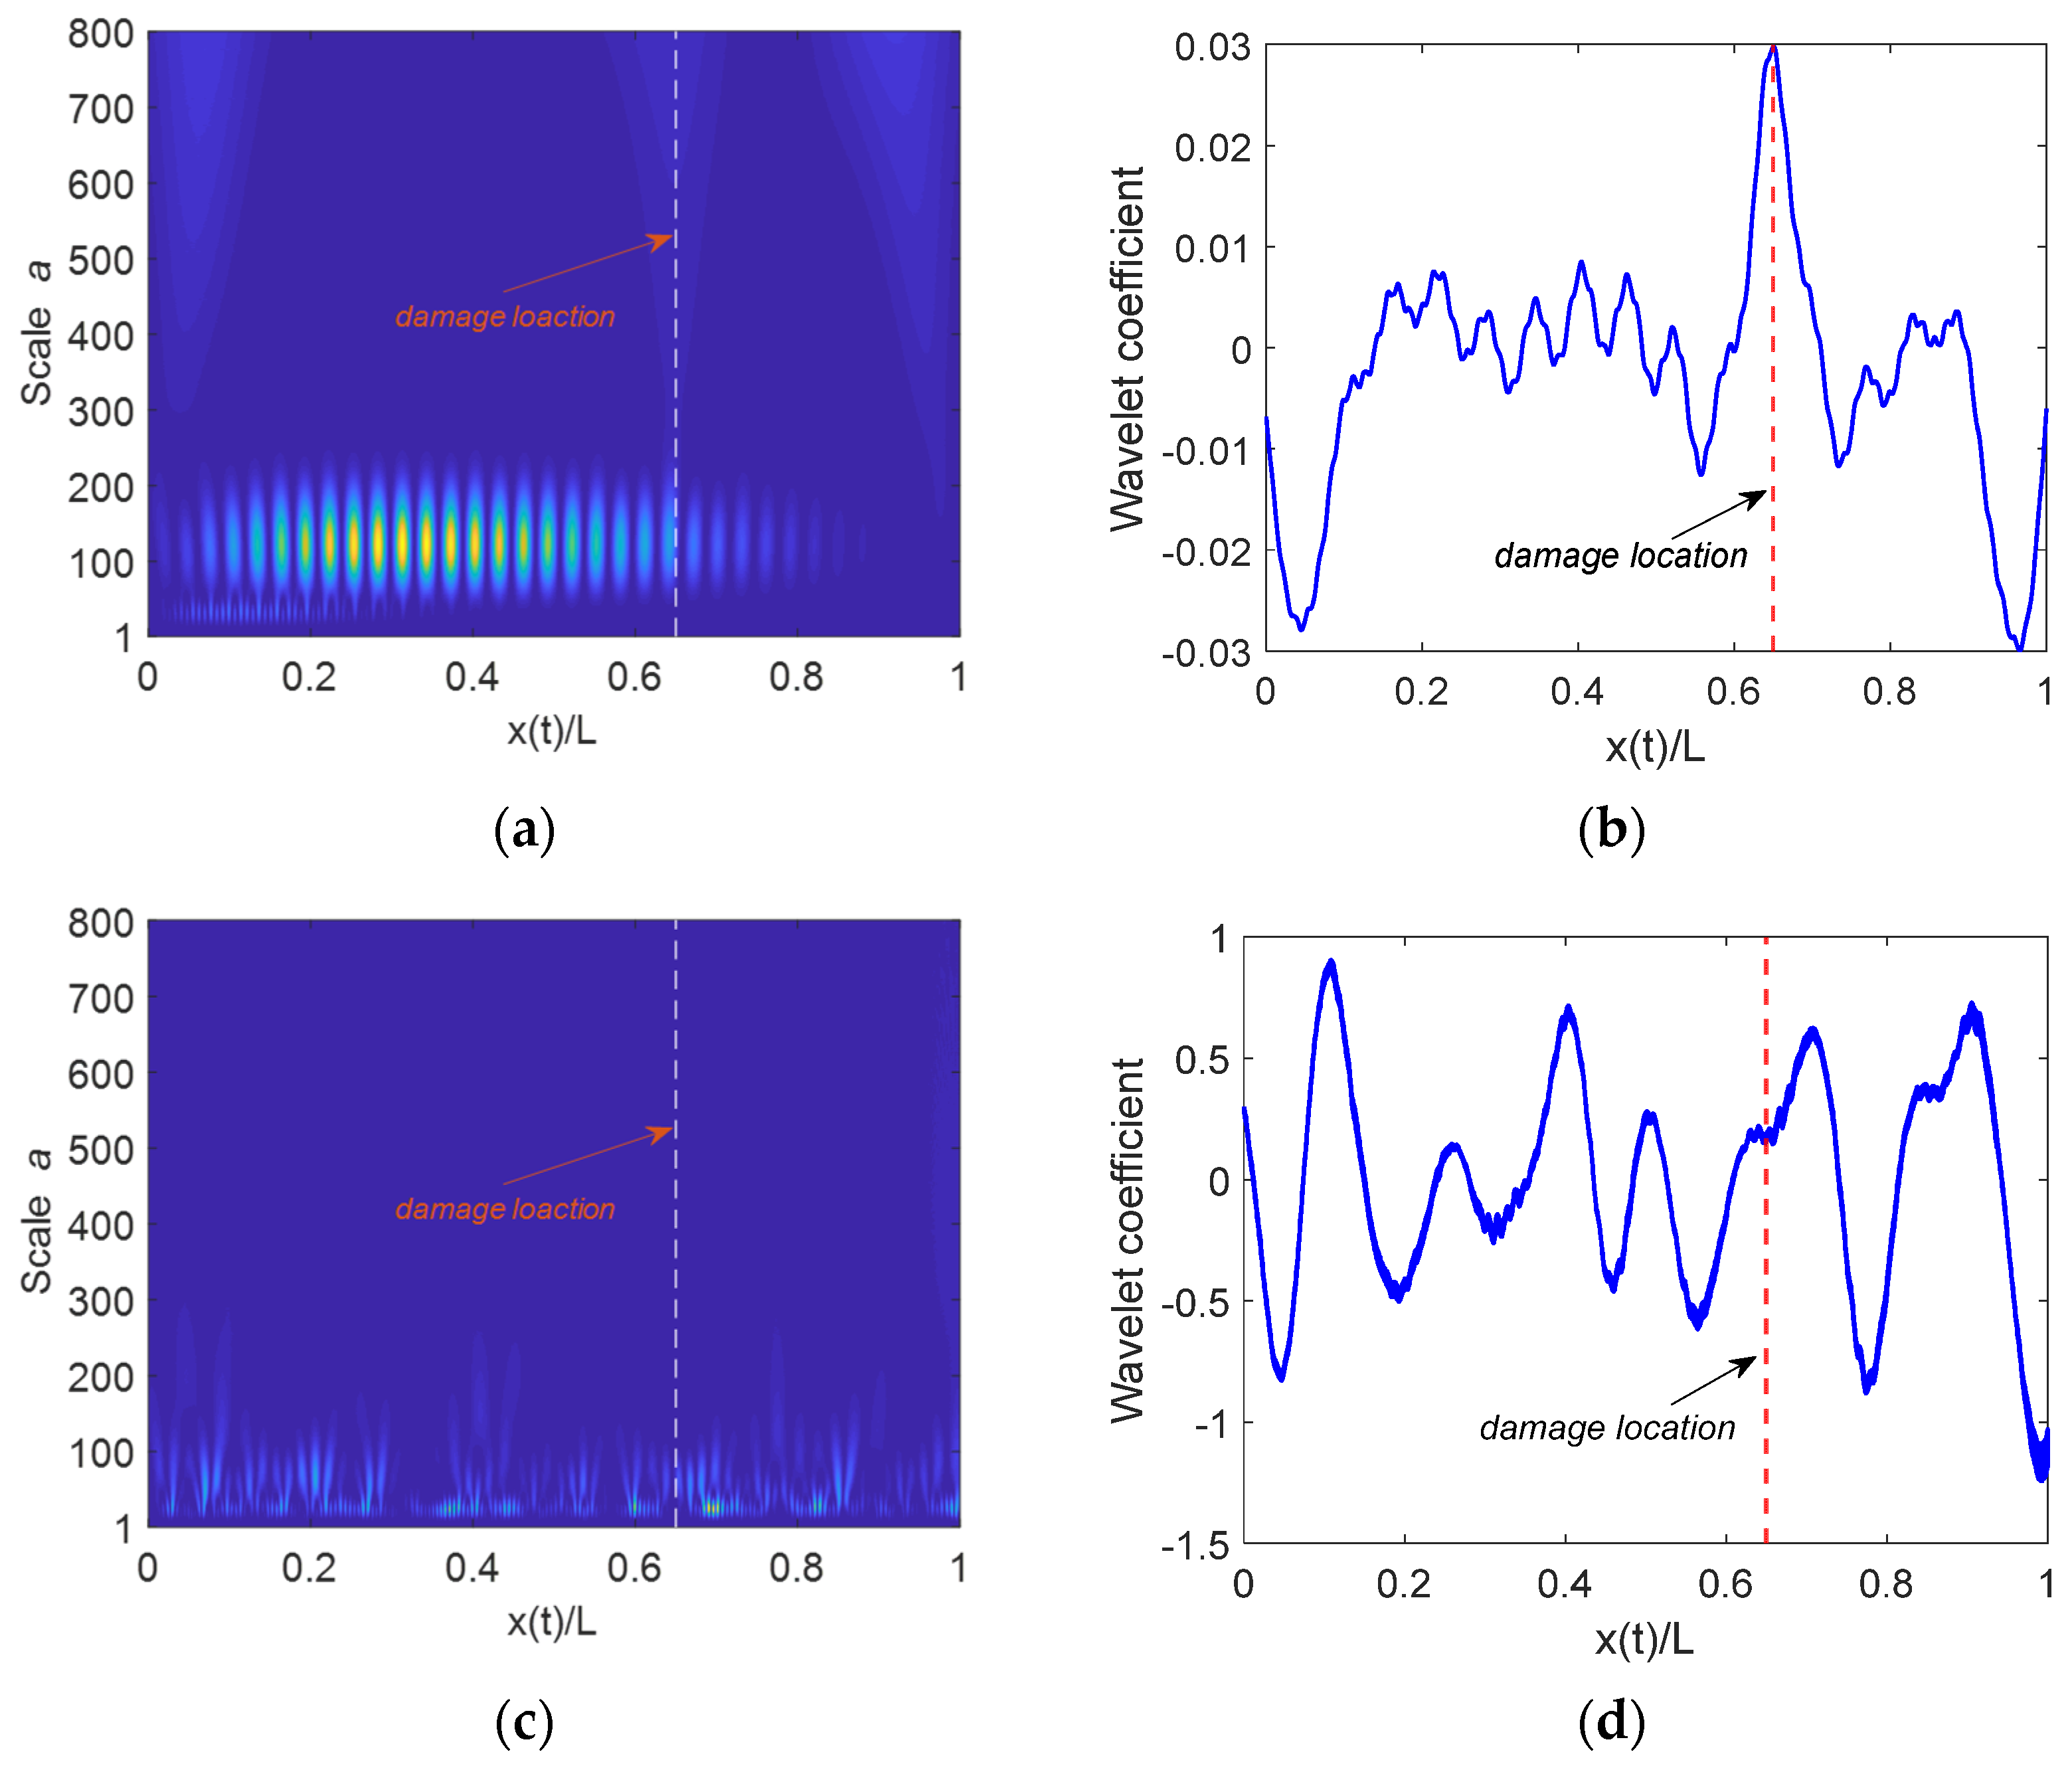
To further present the effect of road roughness in drive-by bridge SHM, another related study is introduced. Tan, Elhattab, and Uddin [9] proposed a wavelet-based approach to estimate the bridge damage and its location when the road profile is not considered. For example, the bridge damage is assumed at 13 m from the left end with a damage level of 40%. The acceleration of the axle is subjected to the wavelet transform with a wavelet function of ‘Mexican hat’, and the wavelet scalogram is shown in Figure 7a. The wavelet function of ‘Mexican hat’ is selected because it has been verified as one of the suitable functions to detect the bridge defect [40]. Besides the edge effect, there is an “anomaly” at the location of the bridge damage. In addition, the wavelet coefficient at a particular scale is illustrated in Figure 7b. As can be seen, a clear peak can be observed to indicate the damage location. However, when the previous road surface profile is considered in the VBI system, the corresponding results are shown in Figure 7c,d, where there is no way to identify the damage and the damage location. It is again demonstrated that road roughness has a negative effect on damage estimation using indirect measurements.
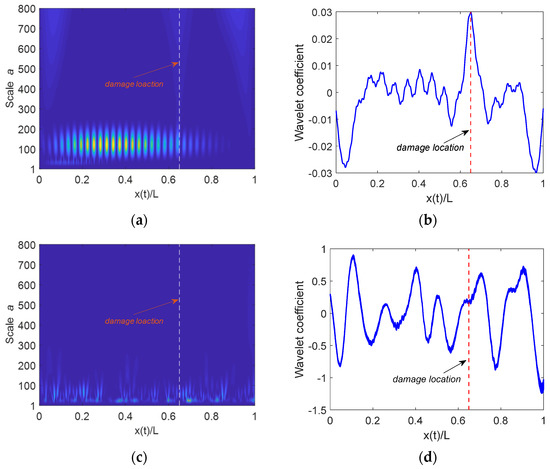
Figure 7.
Identifying the bridge damage. (a) scalogram without road roughness; (b) particular wavelet coefficient without road roughness; (c) scalogram with road roughness; (d) particular wavelet coefficient with road roughness.
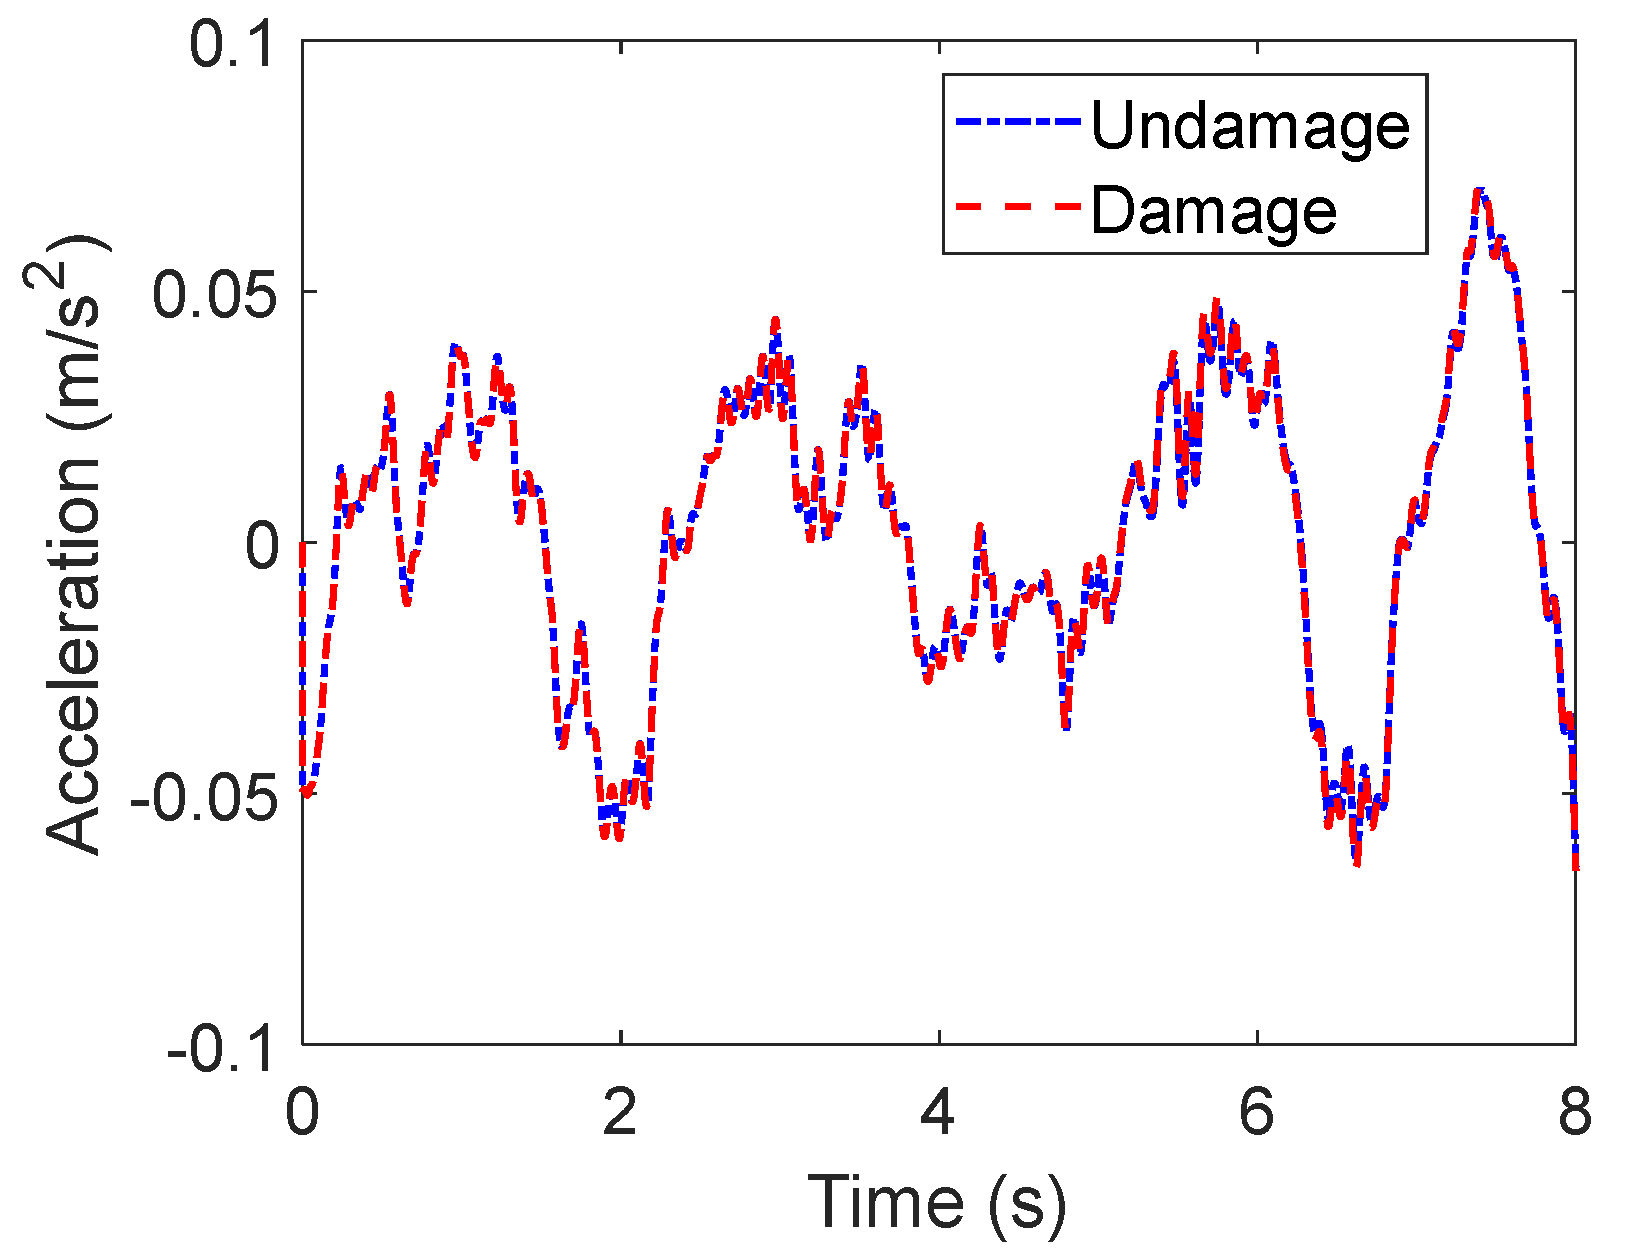
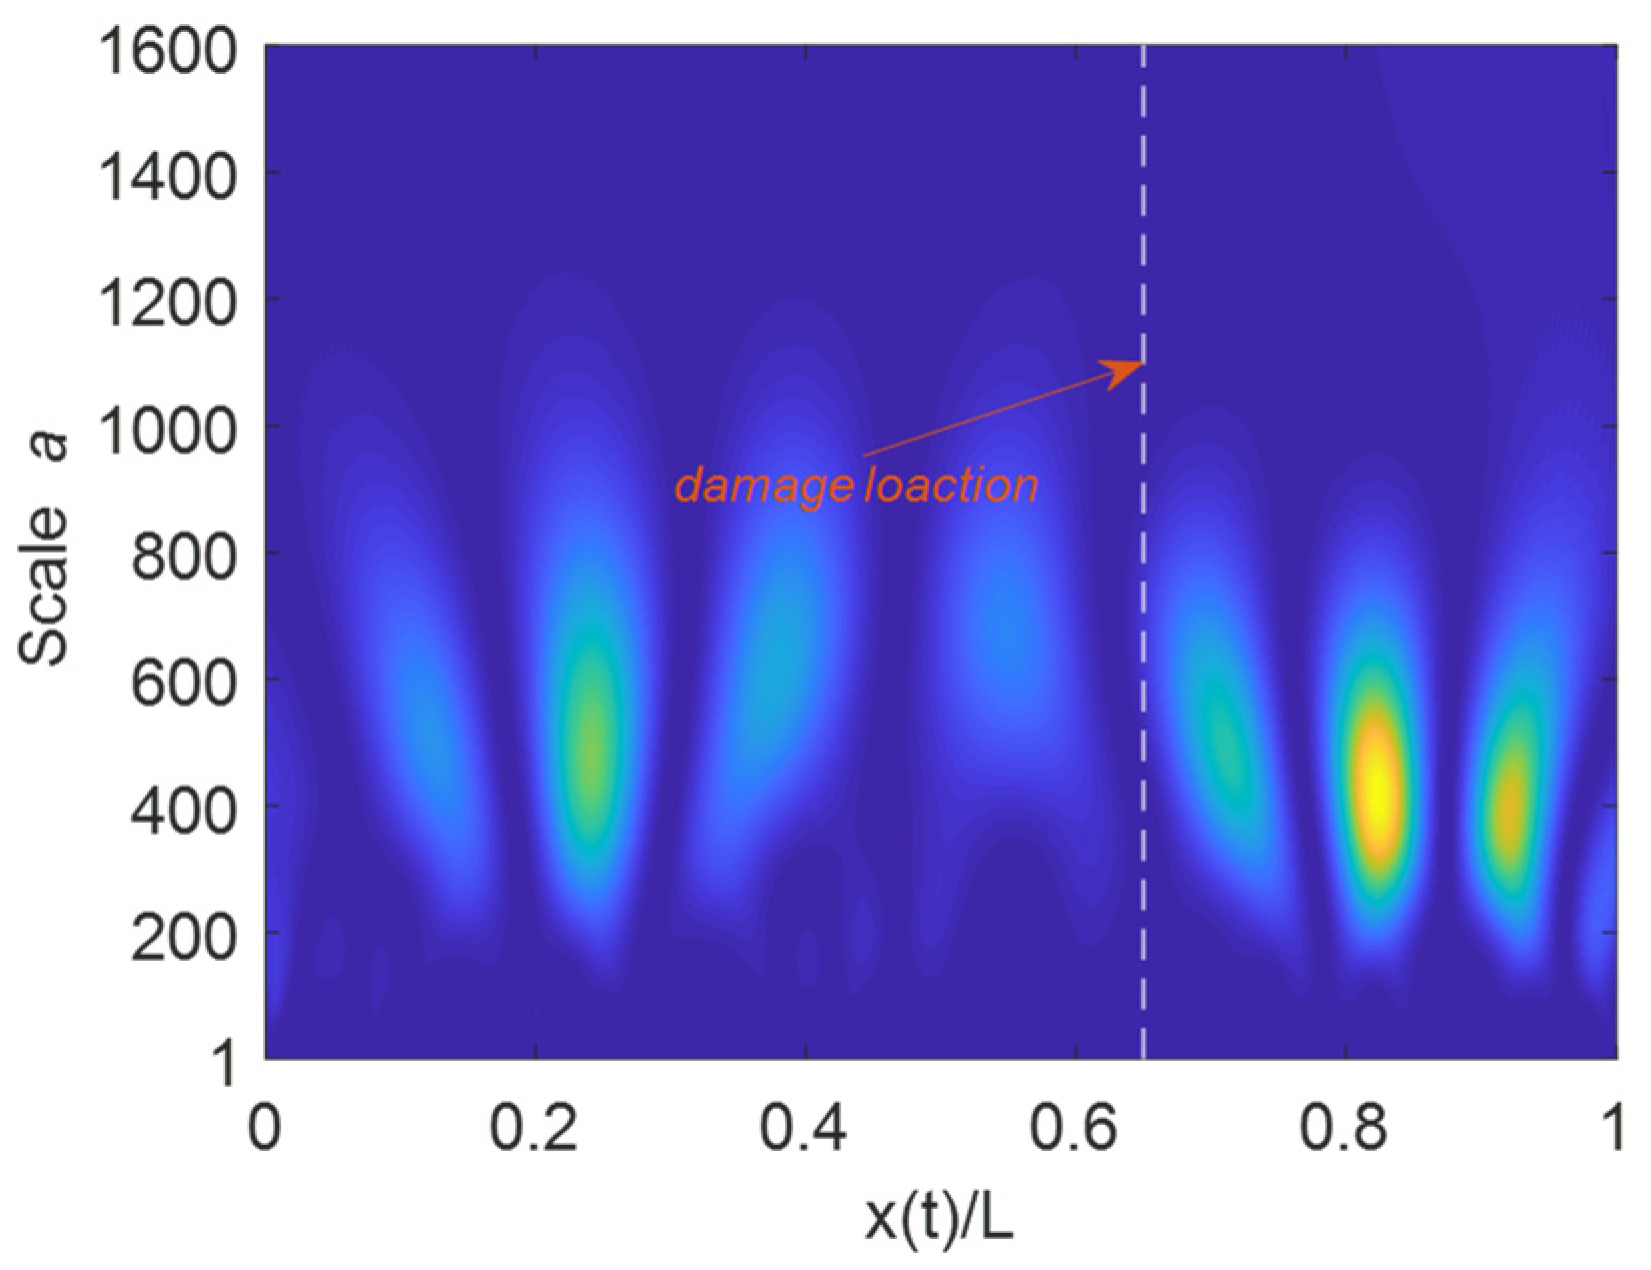
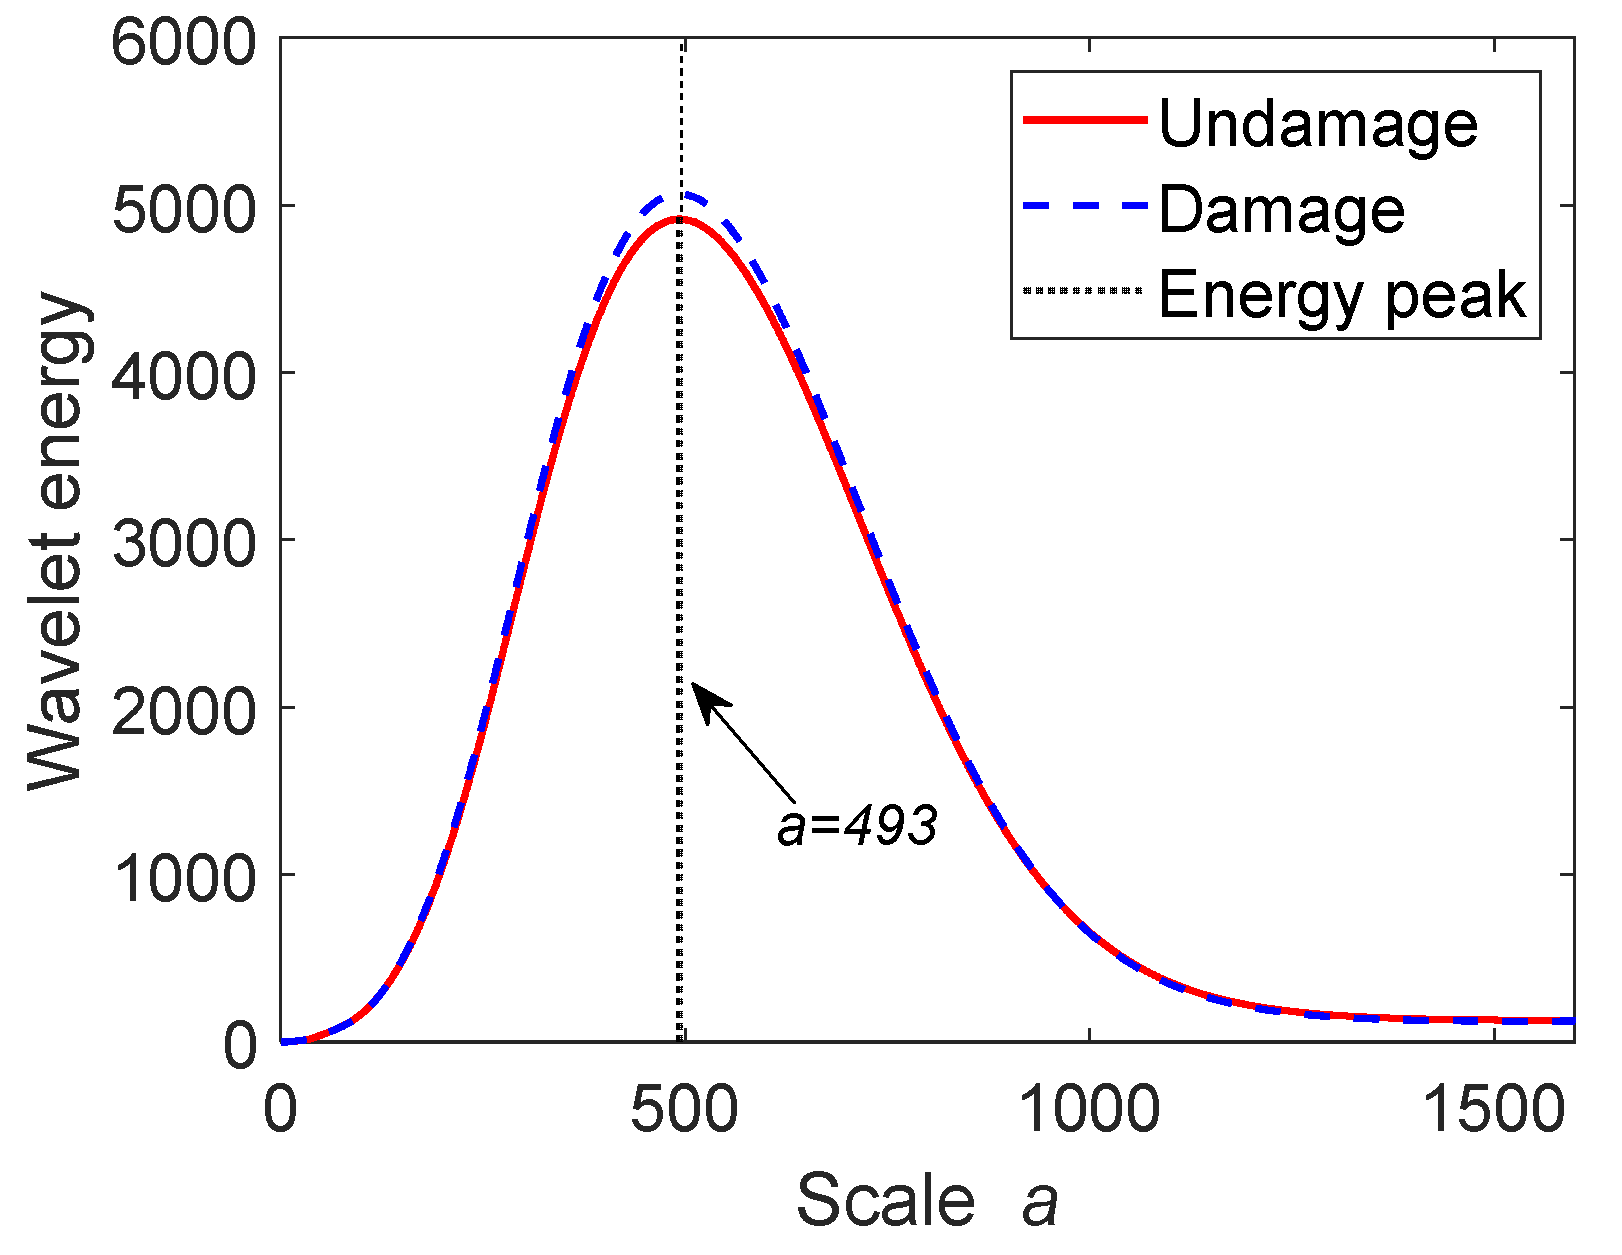
Because the vehicle body acceleration is more robust to the road roughness, this signal is used as input for the proposed approach instead of the axle acceleration of the vehicle. Regarding the previous cases, Figure 8 shows the accelerations of the vehicle axle at different bridge conditions. As shown, although the bridge has been damaged, there are no clear changes in the moving vehicle responses. Figure 9 plots the wavelet scalogram (with ‘Mexican hat’) on the acceleration of the vehicle under damaged bridge conditions. As shown, no resource of information can be obtained to indicate the bridge damage. The proposed approach is then used to detect the bridge damage and localize the identified damage. Both signals are applied to wavelet transform and the wavelet energies are calculated as shown in Figure 10. As shown, both of the energies have a peak around scale 493, which means that, based on Equation (25), the wavelet pseudo frequency is 0.51 Hz (the central frequency of ‘Mexican hat’ is 0.25 Hz). This pseudo frequency is close to the frequency of the vehicle , which is consistent with the findings in Figure 6d. It is worth noting that the bridge’s 1st natural frequency changes to 2.08 Hz from 2.17 Hz due to the damage, with a change ratio of 3.85%. This change may be hard to detect in the frequency domain using the indirect measurements because of the short data in the VBI system. As shown in Figure 10, there is also a clear drop in the peak of the wavelet energy due to the bridge damage. The change of the wavelet energy can be used to reflect the bridge conditions.
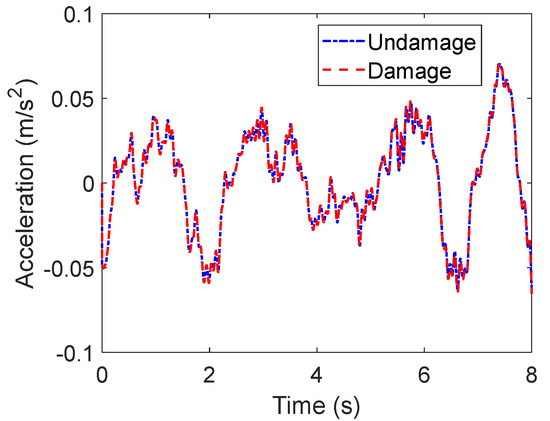
Figure 8.
Accelerations for different bridge conditions.
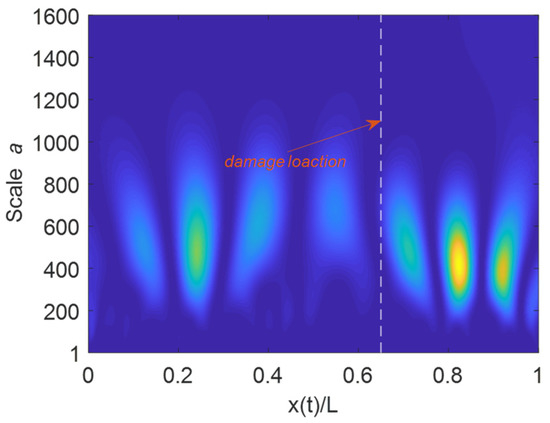
Figure 9.
Wavelet scalogram on the acceleration under damaged conditions.
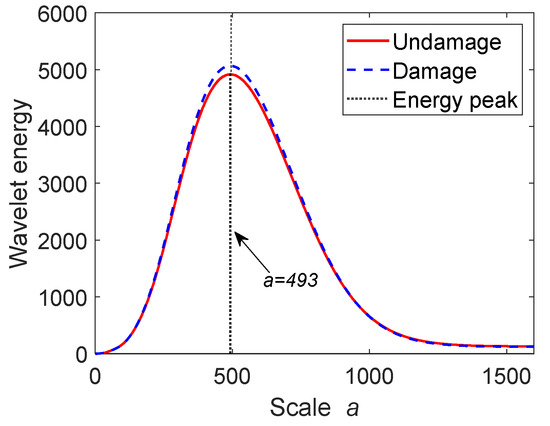
Figure 10.
Wavelet energy for different bridge conditions.
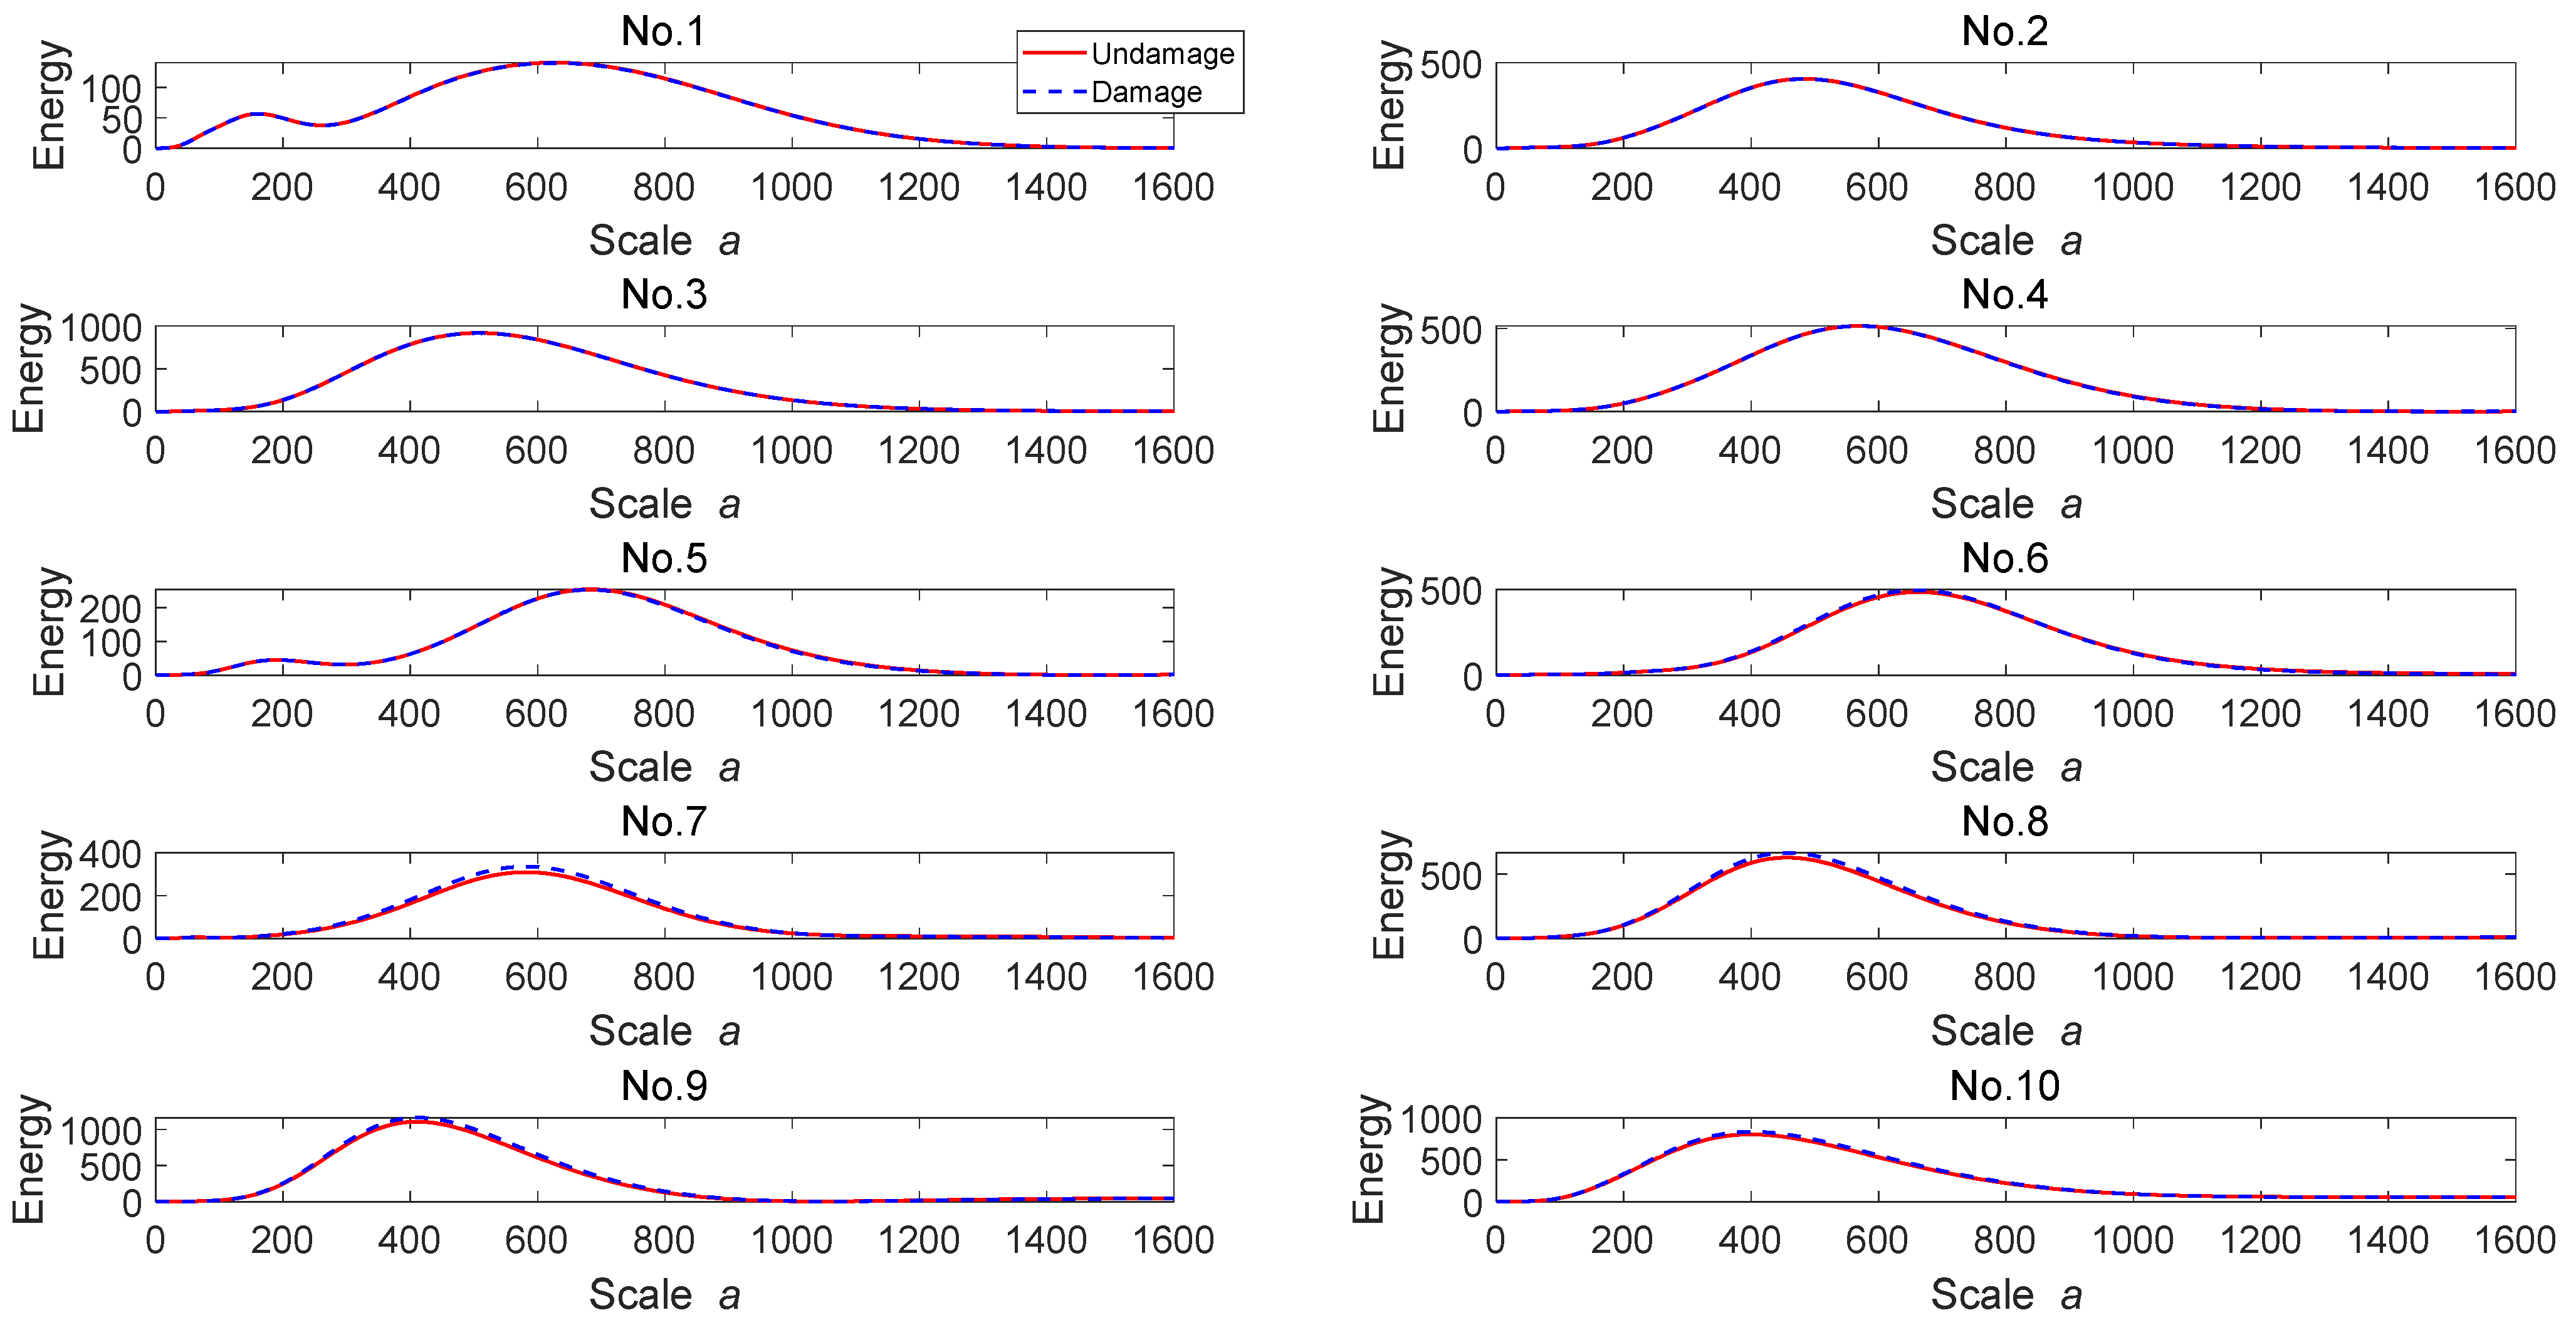
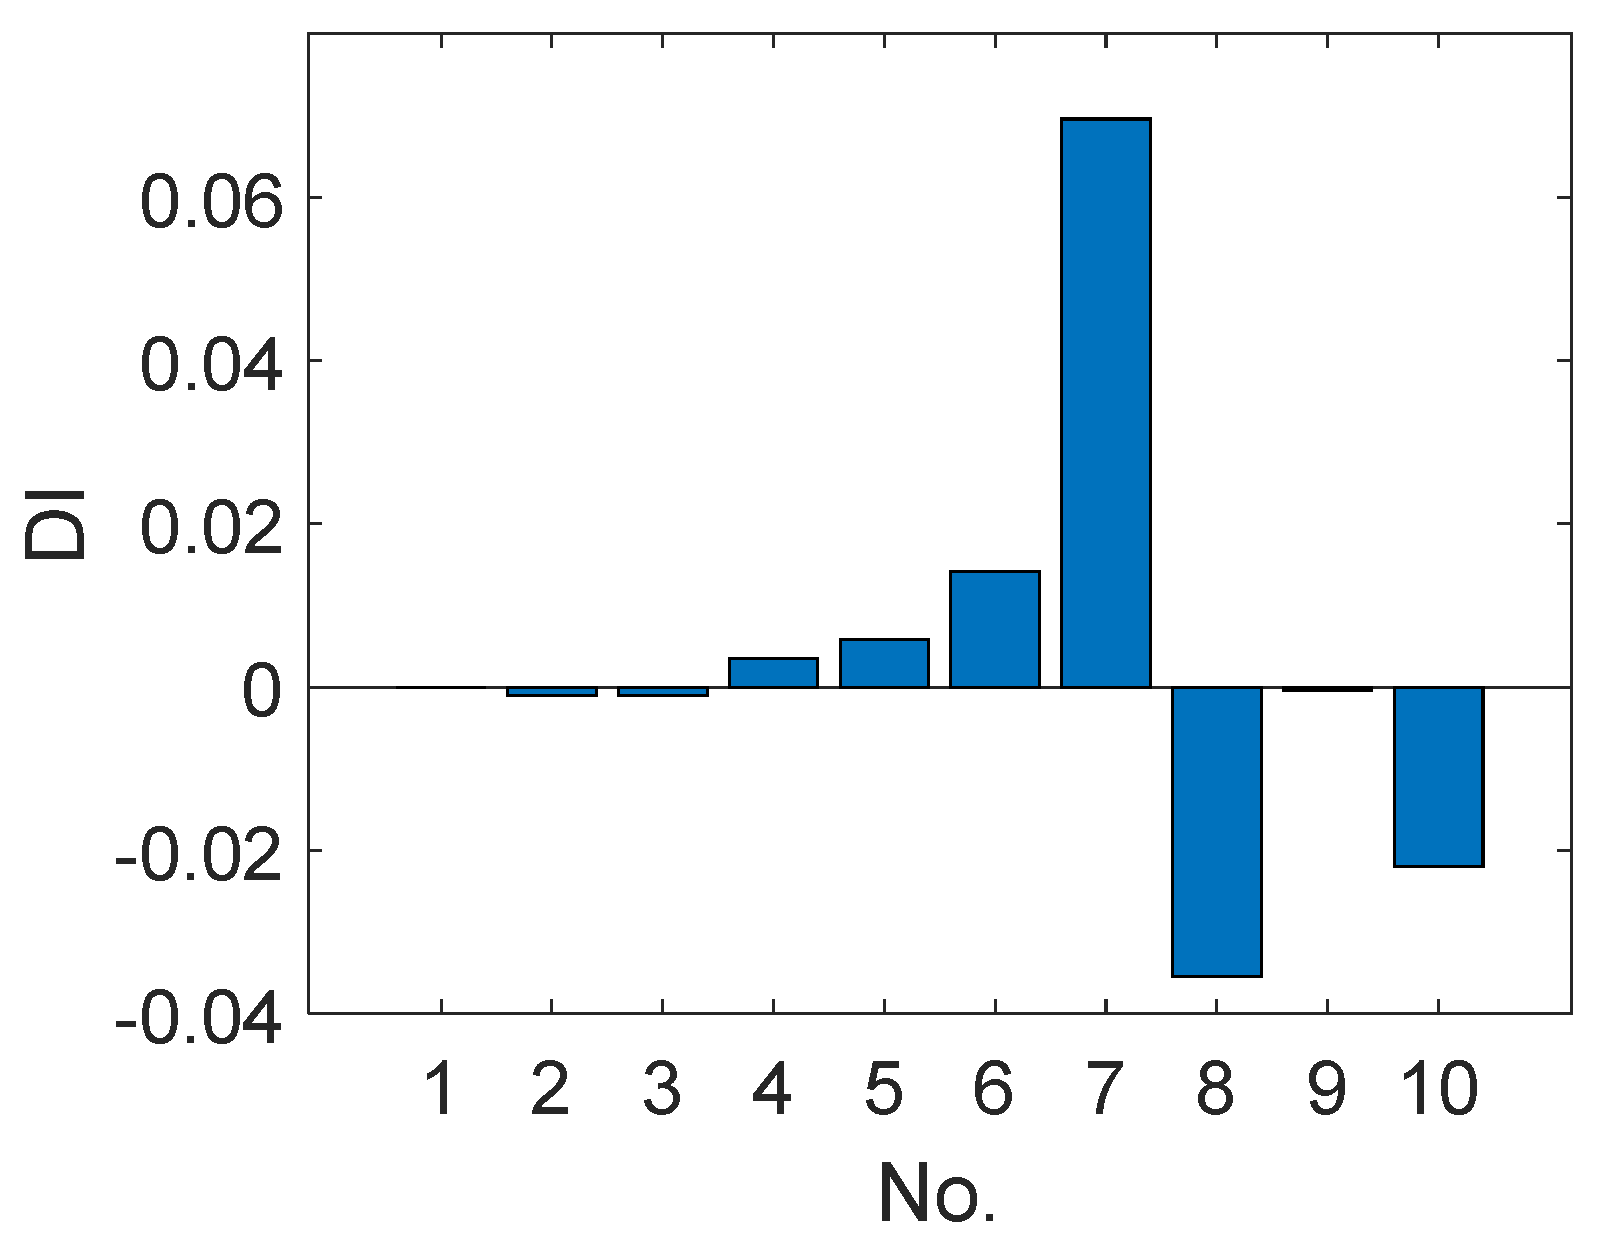
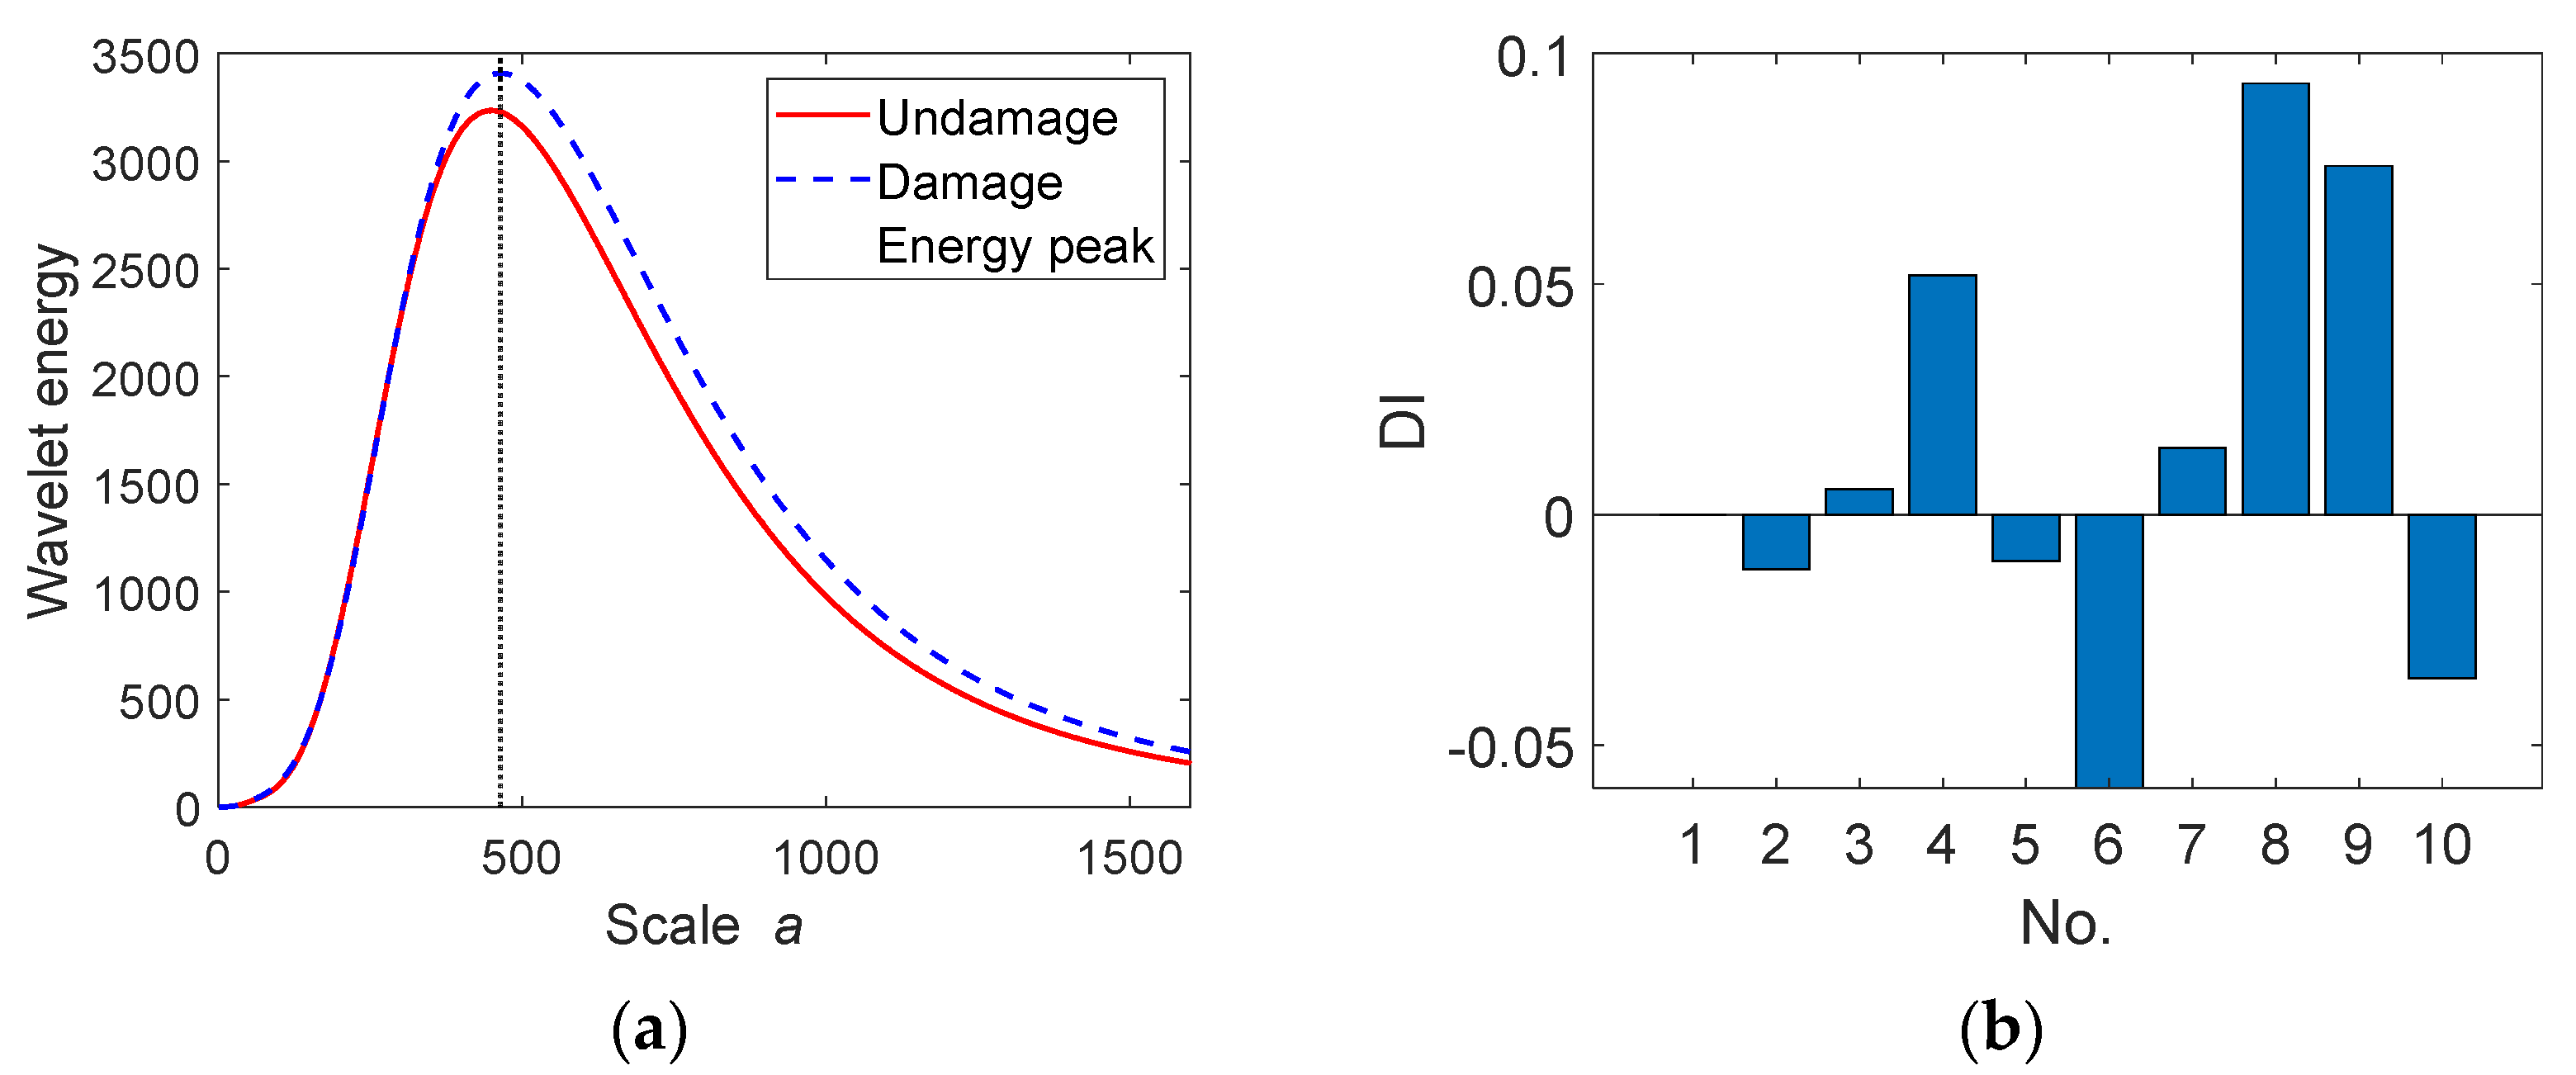
Once the bridge damage is detected, the proposed damage location index is then used to localize the damage. As mentioned above, the vehicle accelerations are evenly divided into ten parts and the corresponding component wavelet energies are plotted in Figure 11. It should be noted that the bridge damage is located at 13 m from the left end, namely located at the component signal of No. 7. As shown, there are no clear changes in the wavelet energies for the first few component signals until close to the damage location. The wavelet energy of No. 6 starts to vary slightly and that of No. 7 and No. 8 varies more. Based on Equation (28), the damage location index is calculated, and the results are shown in Figure 12. Obviously, the damage location index has a maximum value where the bridge is damaged. It is demonstrated that it is feasible to approximately identify the damaged location of the bridge using the proposed approach.
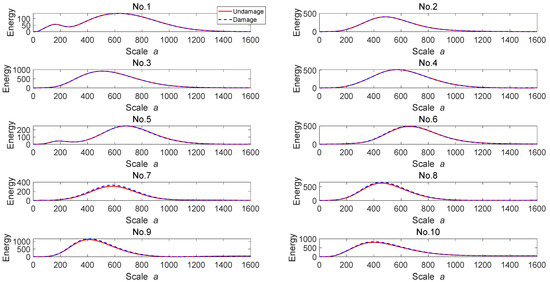
Figure 11.
Wavelet energy comparison of component signals.
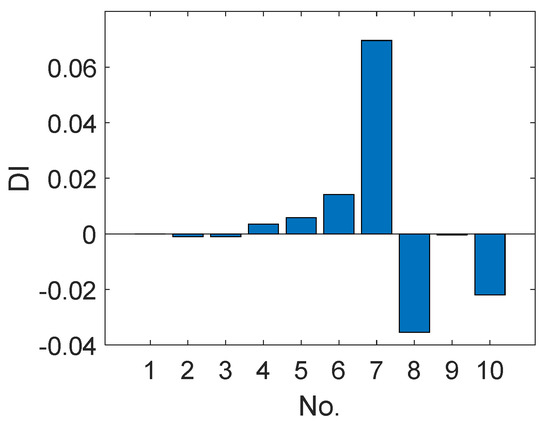
Figure 12.
Damage location index.
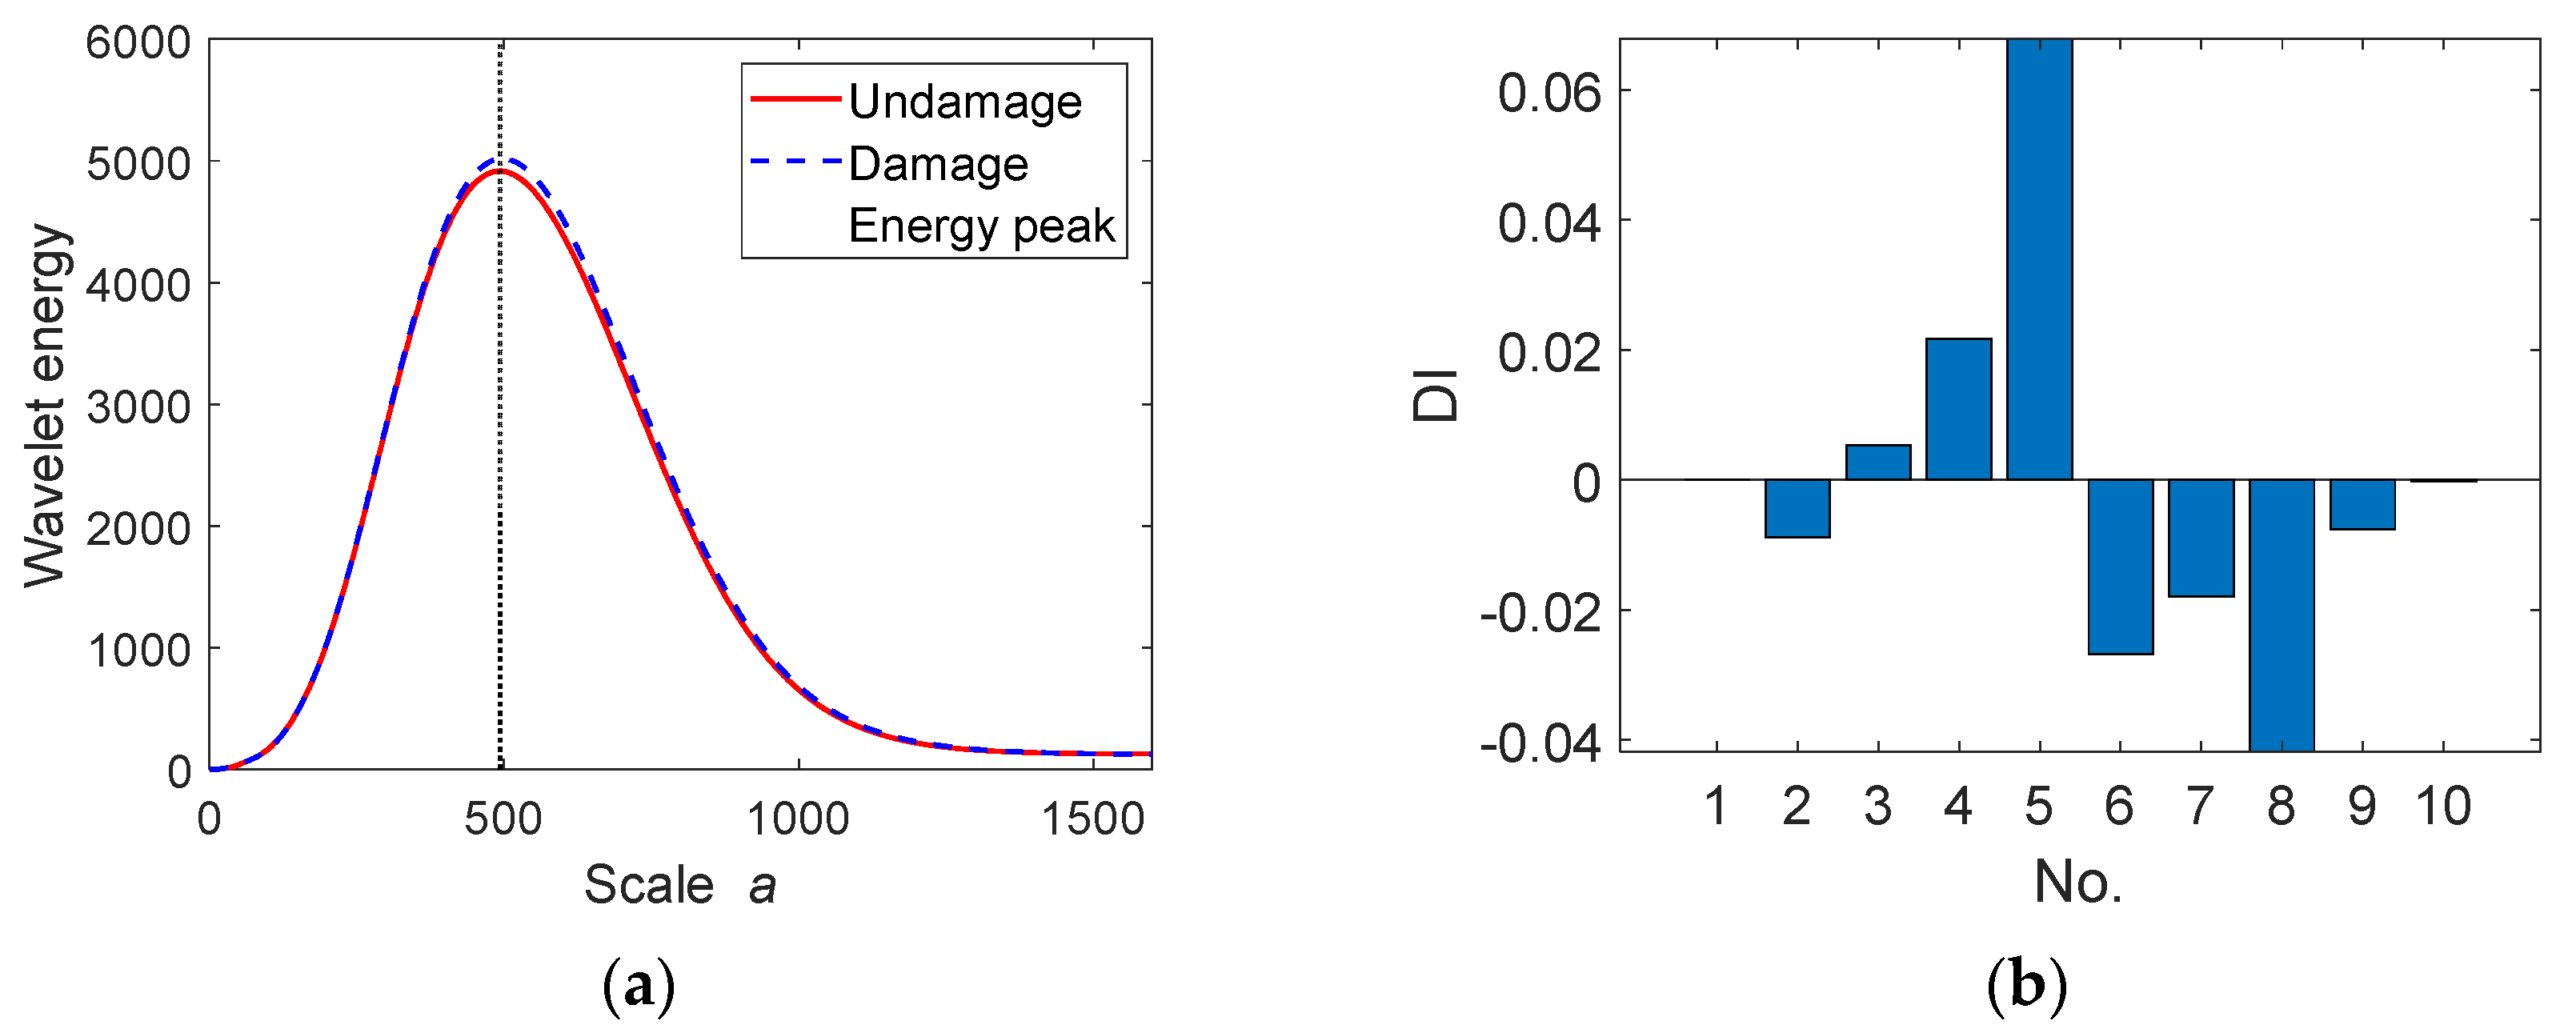
To further verify the effectiveness of the proposed approach, another case is simulated where the bridge damage is set at 8 m from the left end, namely located at the component signal of No. 5. Other properties of the VBI system are kept the same. The results are illustrated in Figure 13. Similarly, a drop in the peak of the wavelet energy can be clearly observed due to the change in the bridge’s health conditions. In addition, the proposed damage location index can accurately indicate the true damage location of the bridge.
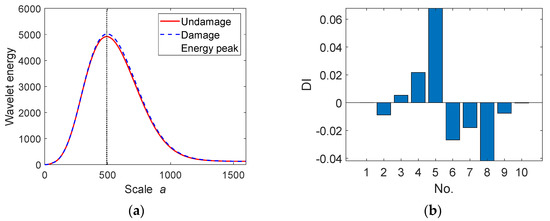
Figure 13.
Bridge damage identification. (a) wavelet energy; (b) damage index.
4.2. The Effect of Vehicle Velocity
A higher velocity of the vehicle is considered in this case, i.e., 10 m/s. The bridge damage remains set at 13 m from the left end with a damage level of 40%. The proposed approach is used to detect bridge damage and its location. The corresponding results are illustrated in Figure 14. As shown, the different wavelet energy between the damaged and undamaged bridge conditions is obvious and even greater than that of the lower vehicle velocity in Figure 10. In other words, the higher velocity of the vehicle can improve the feasibility of damage detection using the proposed approach. However, a higher vehicle means a shorter length of measured data. The proposed approach requires dividing the data into parts. Therefore, short data brings about less robustness for detecting the damage location. In this case, the proposed approach identifies the bridge damage location at No. 8 as shown in Figure 14b, i.e., at the location of 14~16 m from the left support. The damage location identification result is not very accurate.
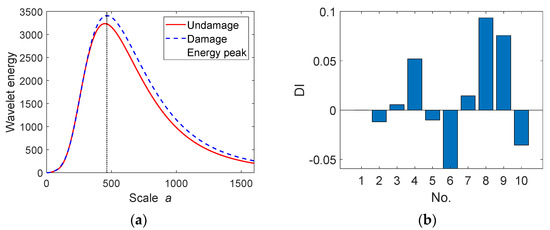
Figure 14.
Bridge damage identification at higher velocity. (a) wavelet energy; (b) damage index.
The results show that higher speeds can improve the likelihood of successful damage detection, but damage location identification may be less accurate. To address this issue, it is recommended to record vehicle responses for undamaged bridges with lower and higher vehicle speeds as references. For routine inspections, the bridge is scanned using a higher velocity and the corresponding damage index (change in wavelet energy) is calculated. If no significant changes were found, the bridge was assessed as “good”. Otherwise, one can inspect the bridge again using a lower speed and then calculate the corresponding damage index to localize the damage. In this way, the effectiveness of damage detection and the accuracy of damage location can be ensured at the same time.
4.3. The Effect of Vehicle Mass
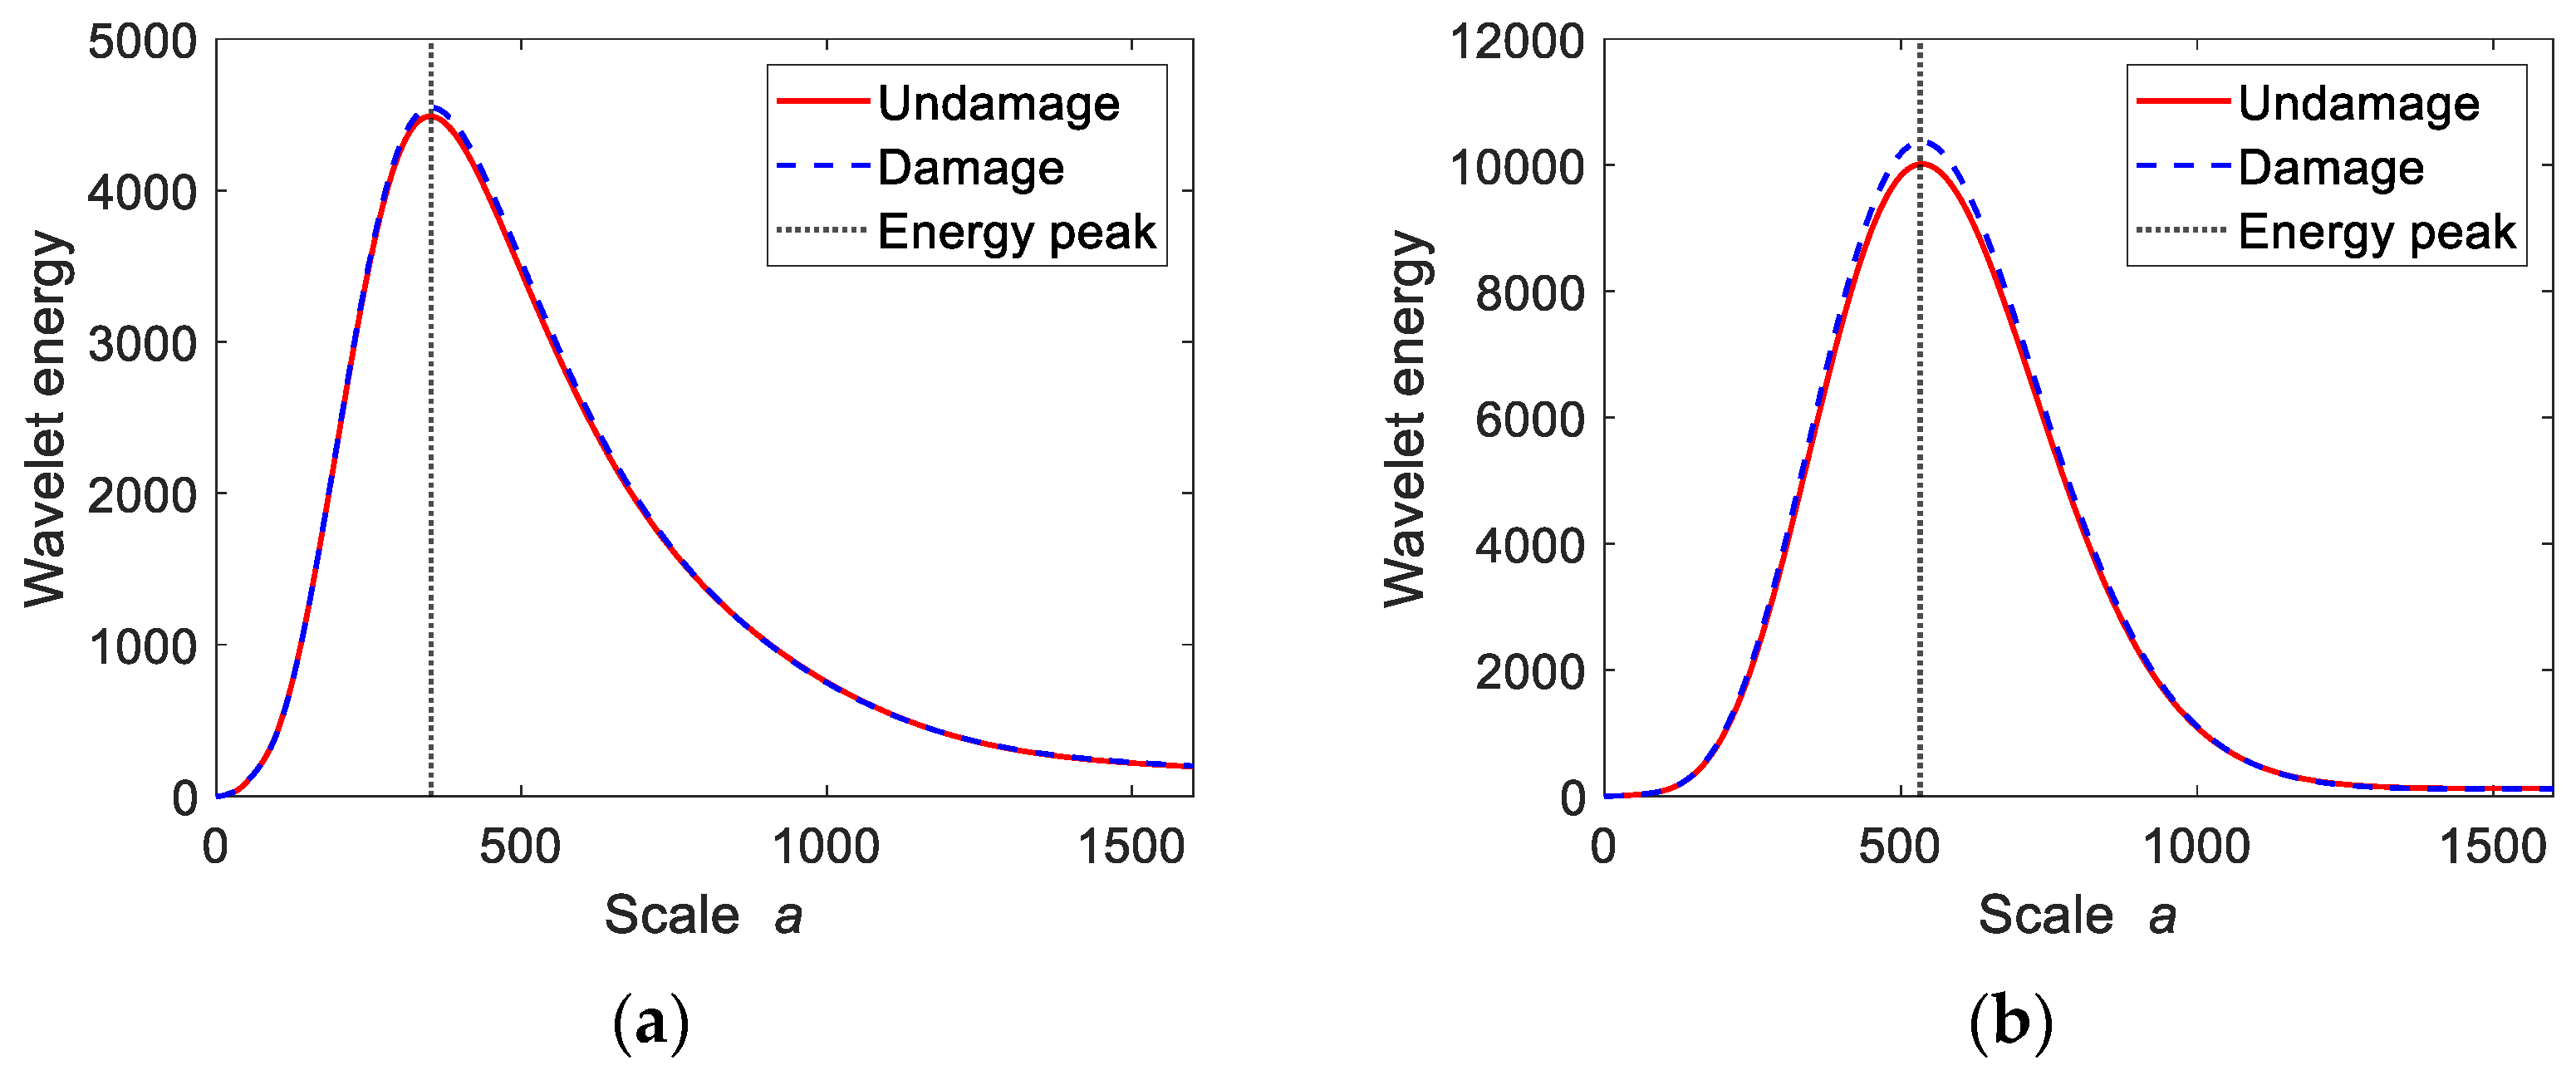
To study the effect of vehicle mass on the proposed approach, two more cases are considered, referring to a ‘lighter’ vehicle and a ‘heavier’ vehicle, respectively. For the lighter vehicle, , and for the heavier one, . Other properties of the vehicle are kept the same as in Table 1. For comparison, the vehicle in Table 1 (i.e., ) is labeled as the ‘regular’ vehicle. The lower vehicle velocity of 2.5 m/s is considered in the VBI system, and the bridge health condition is the same as in the previous case. The proposed approach is used to analyze these two cases and the changes in wavelet energy are shown in Figure 15. It should be noted that since the vehicle mass changes, the vehicle frequency changes as well. As a result, for different vehicle masses, the peak energy of the vehicle responses is at different scales. It was found that heavier vehicles can improve the feasibility of the proposed bridge damage detection method because of the greater variation in wavelet energy. The wavelet energy change rates for lighter, regular, and heavier vehicles are 1%, 3%, and 4%, respectively. Therefore, it is recommended to use the proposed method to implement relatively heavy vehicles for bridge health monitoring.
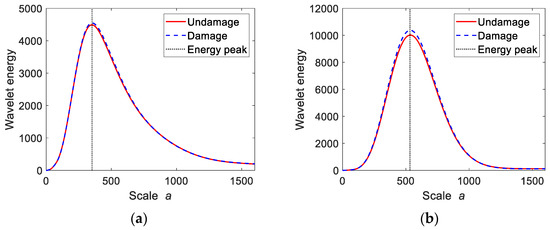
Figure 15.
Wavelet energy with different vehicle mass. (a) ‘lighter’ vehicle; (b) ‘heavier’ vehicle.
4.4. The Effect of Noise Signal
To investigate the effect of measurement noise, artificial noise is added to the measured response of the vehicle, using the following equation
where is the polluted response of the vehicle acceleration, denotes the generated clean signal of the vehicle acceleration and is its standard deviation, is a standard normal distributed vector with unit standard deviation, and denotes the level of the noisy signal. In most studies, the measurement noise level is under 5% [46,47]. Thus, 5% noise is considered in this study.
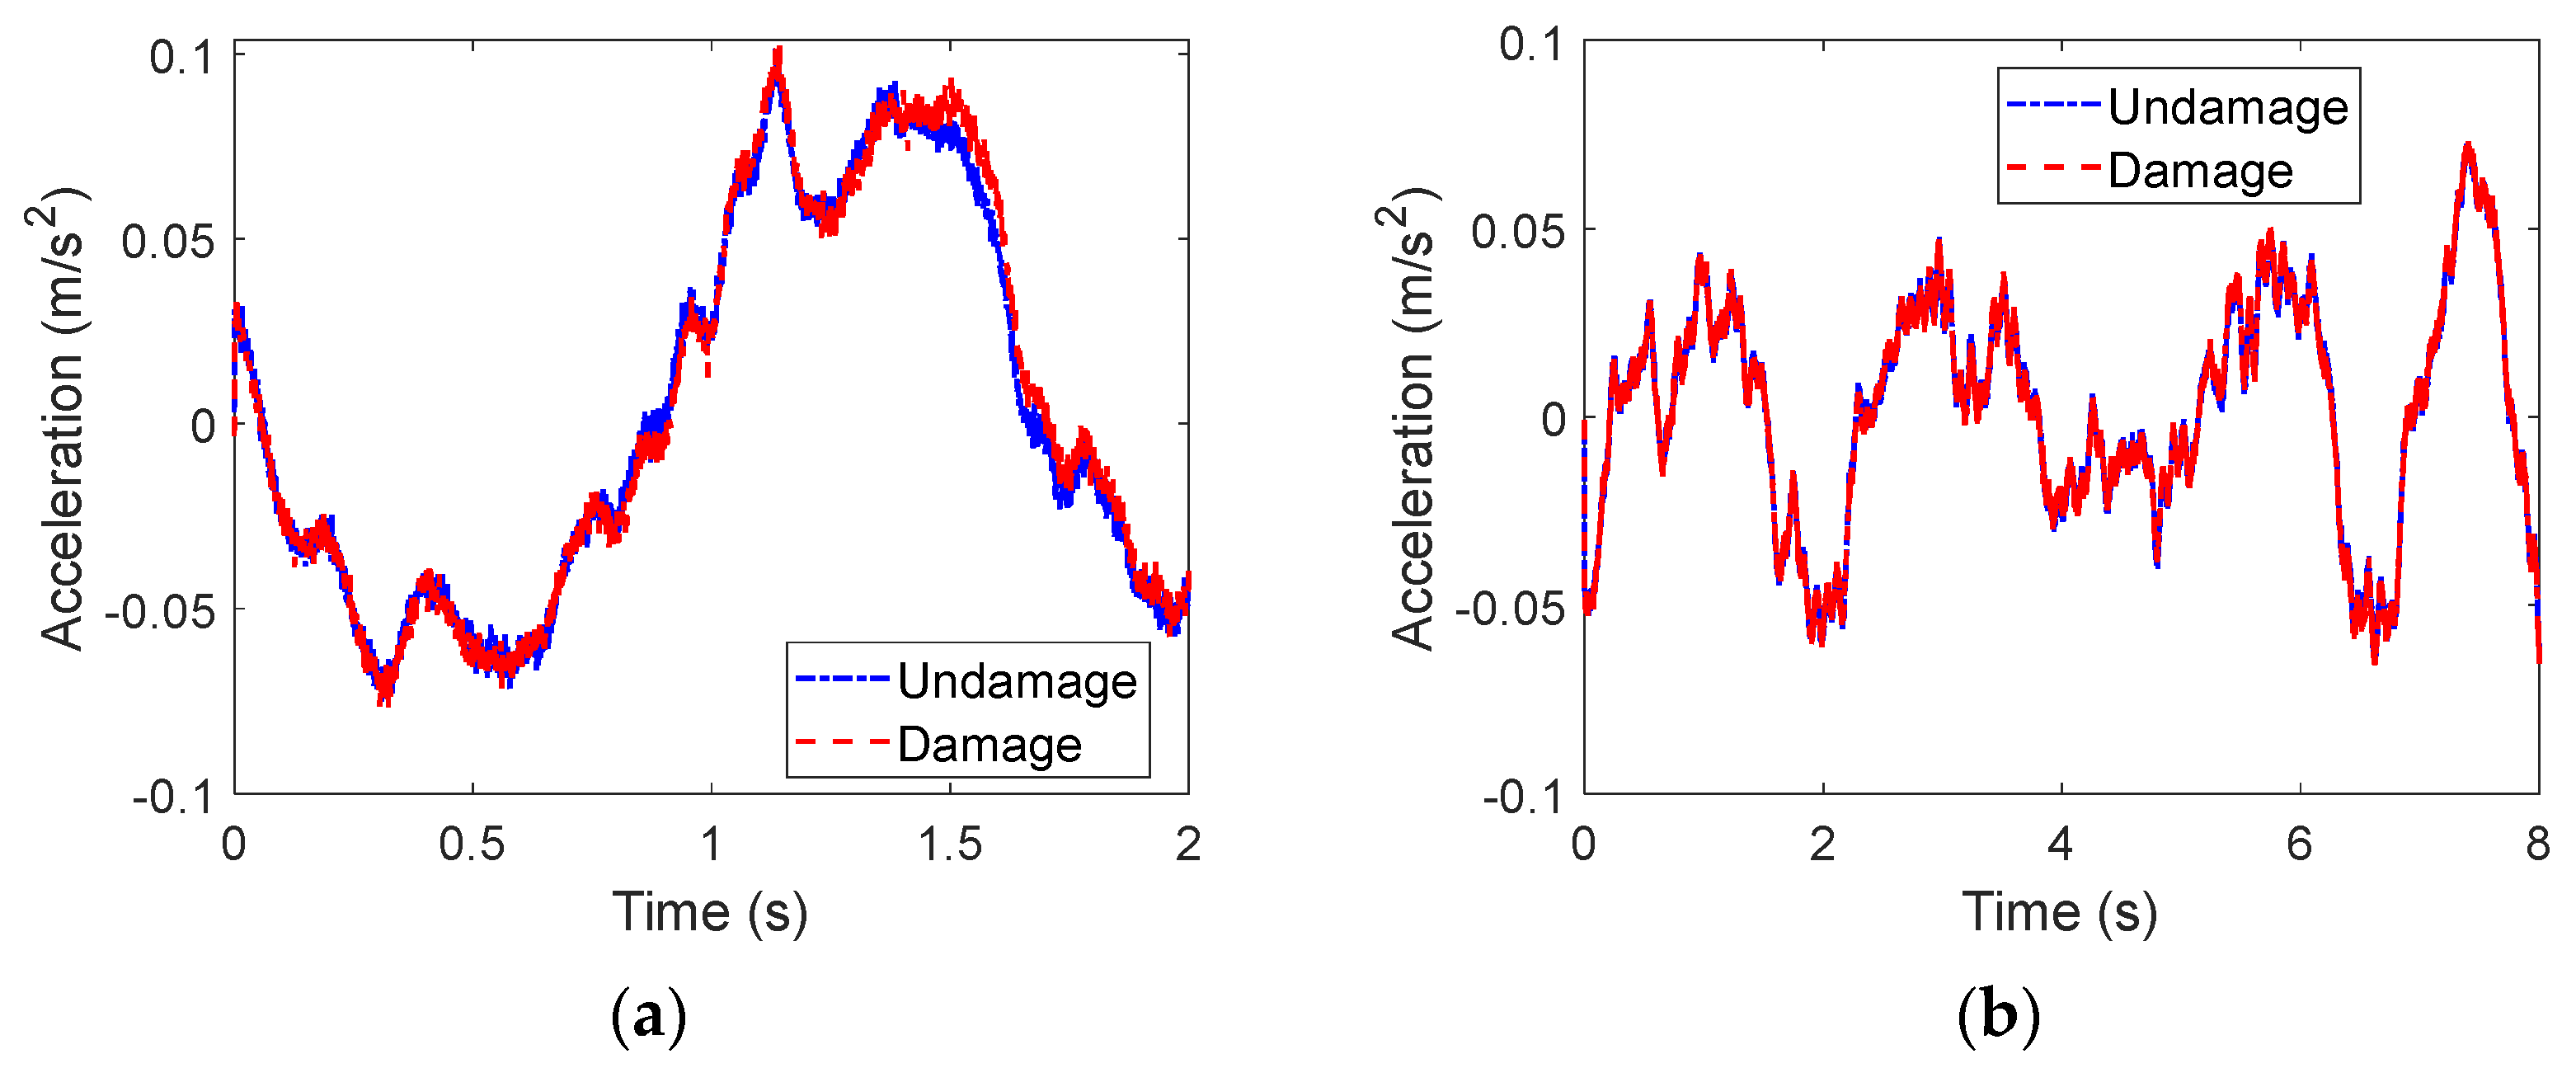
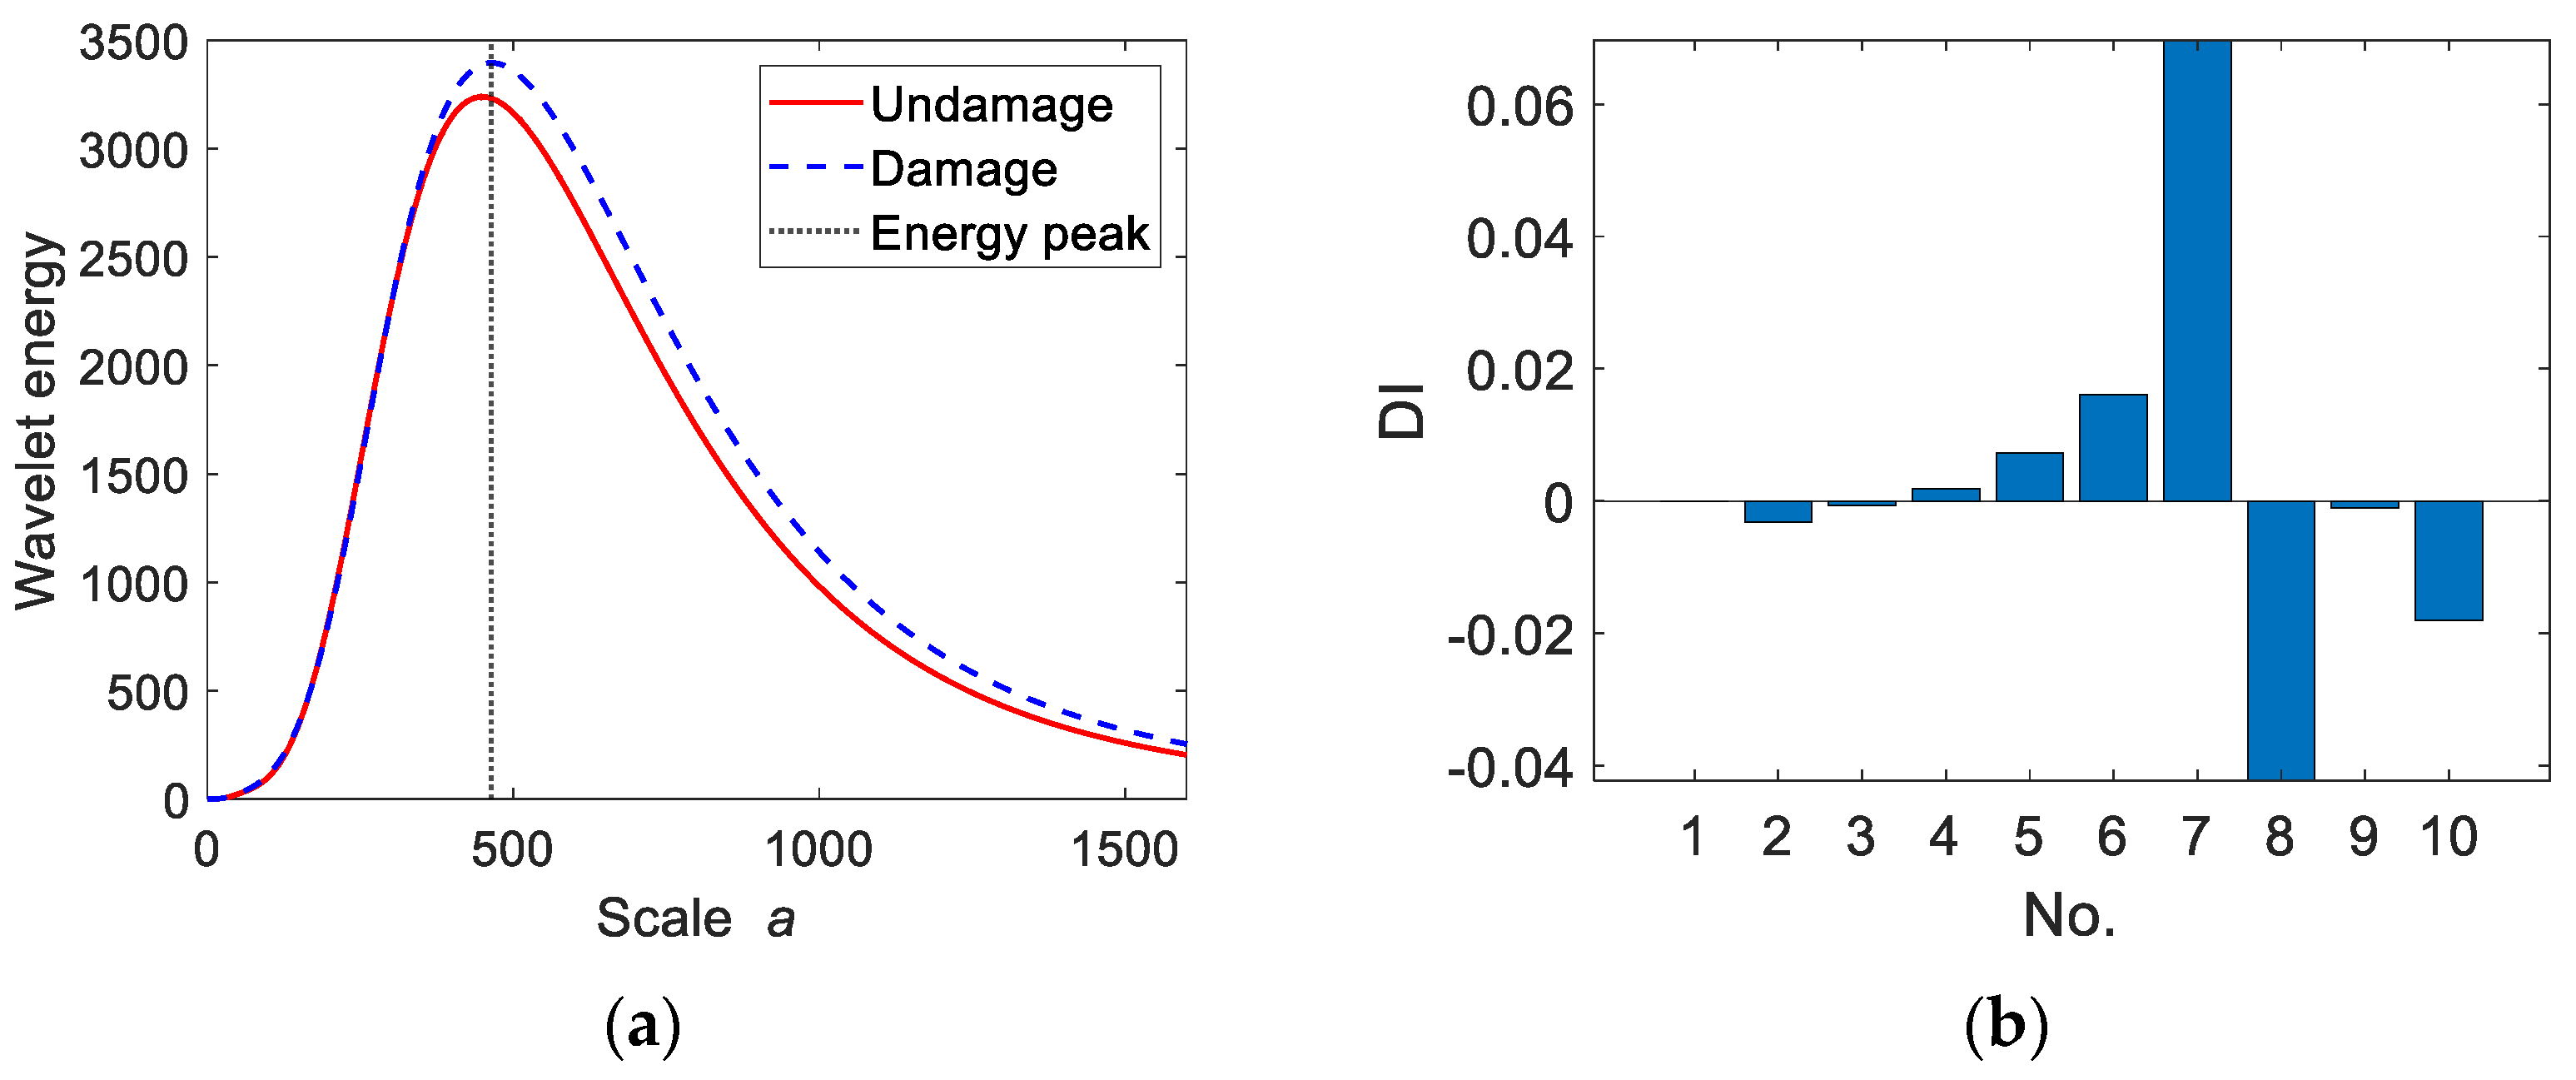
As suggested, two velocities ( 2.5 m/s and 10 m/s) are simulated here, where the higher and lower velocities are used to access the bridge health and detect damage locations, respectively. The regular vehicle mass is used in this case, and the bridge damage status is the same as above. The noise signals for different vehicle accelerations are different but at the same noise level. The polluted accelerations are plotted in Figure 16. The corresponding results using the proposed approach are shown in Figure 17. Apparently, the results are not sensitive to the noise signals. The bridge damage and its location can be clearly identified with the proposed approach.
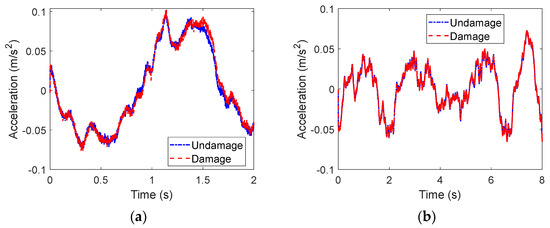
Figure 16.
Vehicle acceleration with noise. (a) 10 m/s; (b) 2.5 m/s.
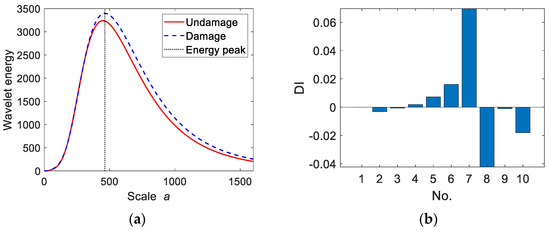
Figure 17.
Bridge damage identification with noise signal. (a) wavelet energy; (b) damage index.
4.5. Different Damage Severity
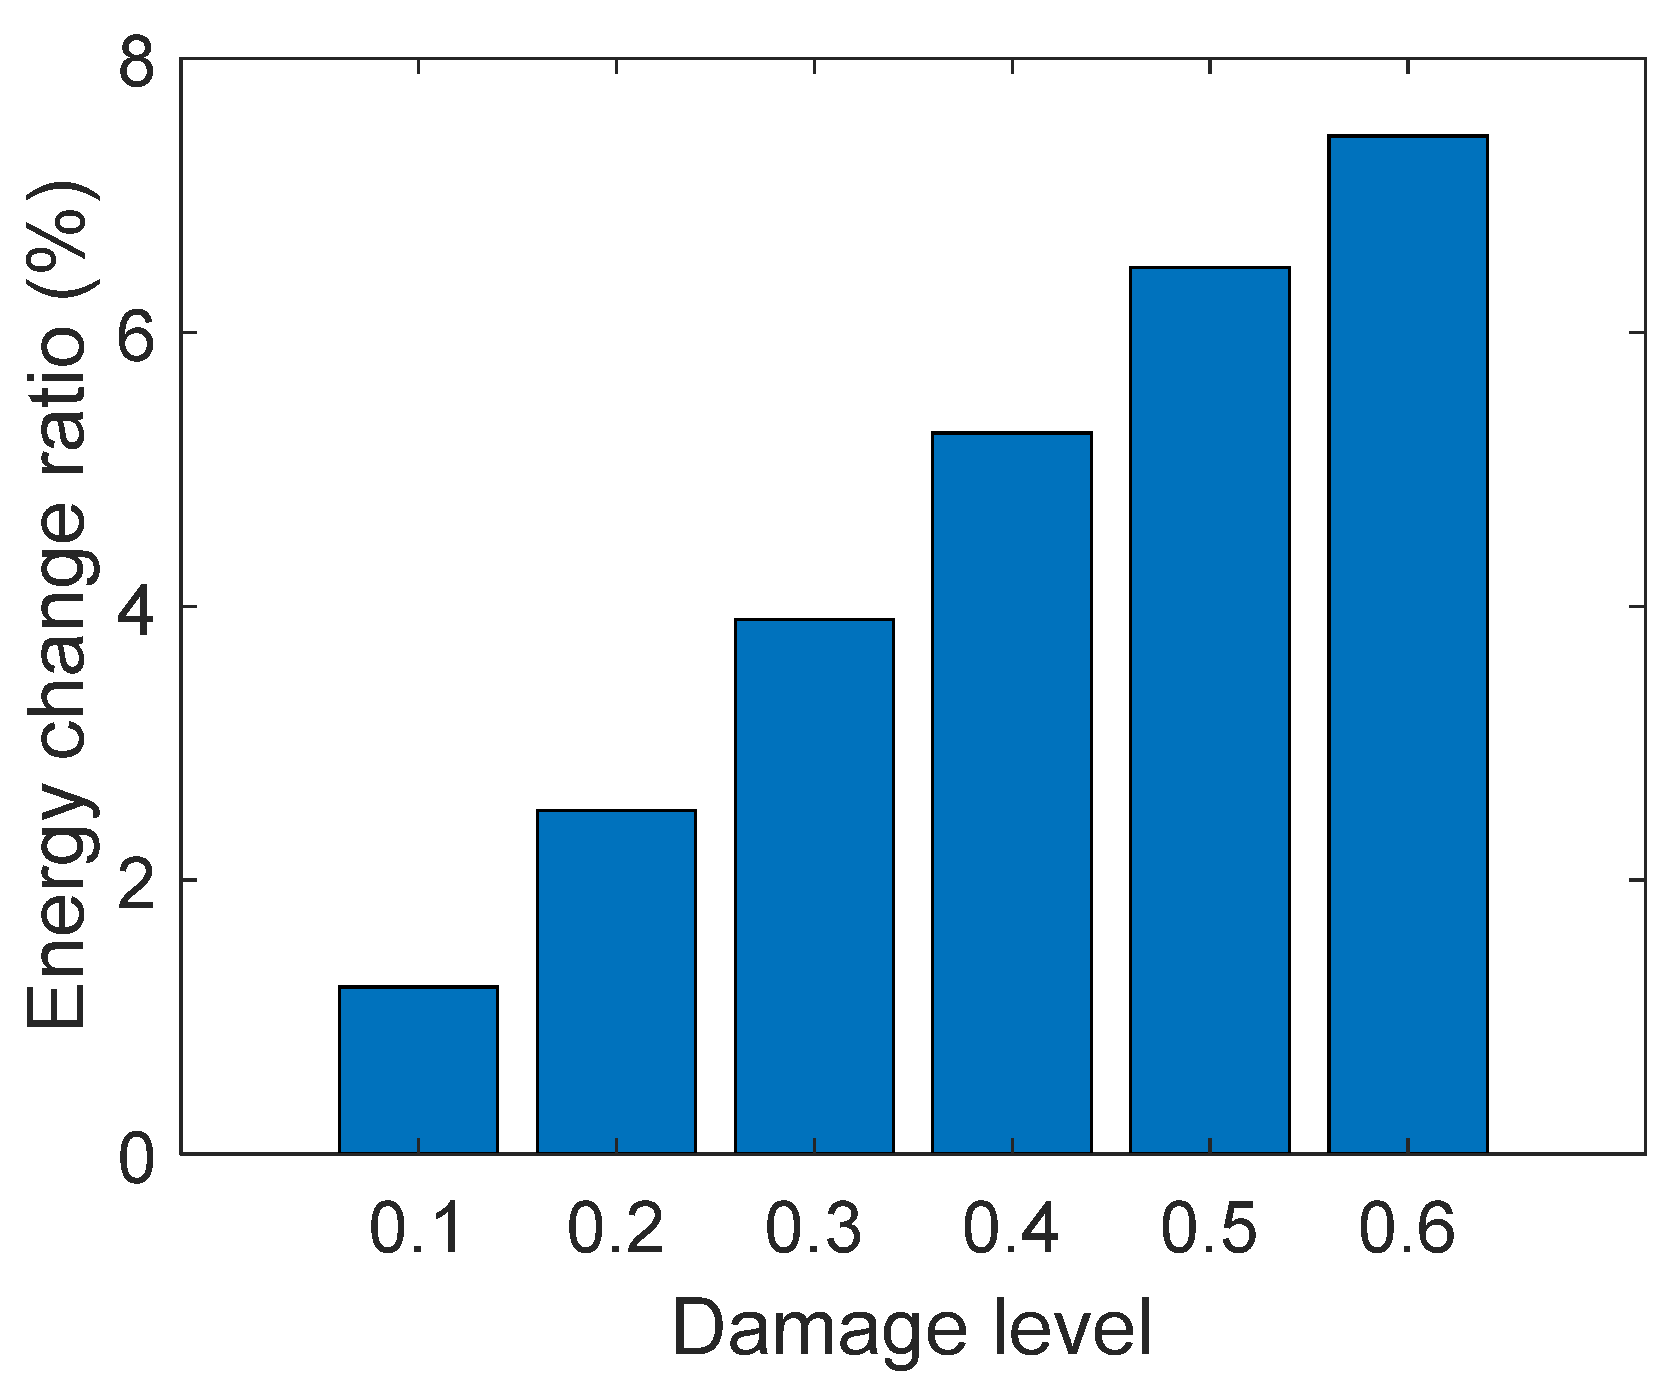
In this section, different damage levels are considered in the VBI model. The higher velocity, i.e., 10 m/s, is used to detect the presence of bridge damage. The wavelet energy change ratio compared to the health condition of the bridge is calculated and the result is illustrated in Figure 18. It is obvious that the wavelet energy change rate increases with the damage degree, and this increase is roughly linear. For bridge damage with a 60% damage level, the change in wavelet energy is over 7%. The rate of change in wavelet energy can provide a reference for quantitative assessment of damage severity. The proposed approach has potential applications for realizing bridge SHM in level 3.
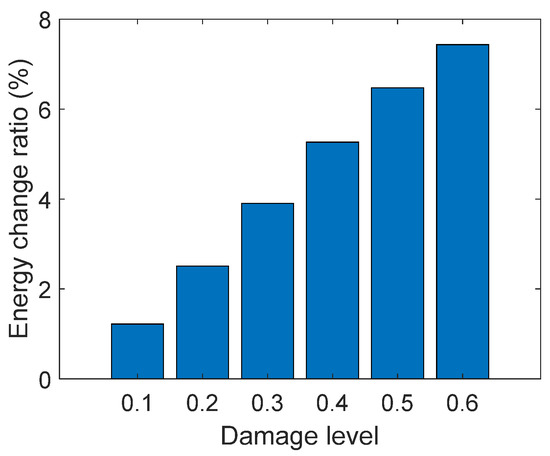
Figure 18.
Energy change ratio versus different damage levels.
5. Conclusions
This paper developed a wavelet-based approach to rapidly access the bridge health conditions using the measured signals of a moving vehicle. Vehicle responses are applied to wavelet transform and the wavelet energies are then calculated. Compared to the reference, the change in wavelet energy can be used to assess the bridge conditions. In addition, a damage index based on component wavelet energy is developed to approximately identify the damage location.
In this work, the VBI system is first derived and the solution to the vehicle response is found to contain information about the bridge’s dynamic parameters. The numerical simulation is then used to demonstrate the feasibility of the proposed approach. It is confirmed that the wavelet-based method using the signal discontinuity properties is limited by road roughness, while the proposed approach is robust to the road surface profile. In the end, the effects of vehicle velocity, vehicle mass, noise signal, and different damage severity on the proposed approach are investigated. It is found that the wavelet energy change rate increases with the damage degree, and this increase is roughly linear. For bridge damage with a 60% damage level, the change in wavelet energy is over 7%. The rate of change in wavelet energy can provide a reference for quantitative assessment of damage severity. In addition, the proposed method is found to be very robust to noisy signals. A relatively heavier vehicle is recommended with the proposed approach for bridge health monitoring, due to having a greater change in wavelet energy. The higher velocity can also improve the likelihood of successful damage detection but damage location identification may be less accurate. Therefore, both lower and higher velocities are recommended to scan the test bridge. The higher velocity is used to determine whether the damage happened. The lower velocity is used to localize the damage. The result shows that the proposed approach has a great potential application in bridge SHM using indirect measurements from a passing vehicle.
Author Contributions
Conceptualization, C.T. and H.Z.; methodology, C.T.; software, B.Y.; validation, C.T., H.Z. and B.Y.; formal analysis, C.T.; investigation, C.T.; resources, N.U.; data curation, B.Y.; writing—original draft preparation, C.T.; writing—review and editing, H.Z. and N.U.; visualization, N.U.; supervision, N.U.; project administration, B.Y.; funding acquisition, C.T. and H.Z. All authors have read and agreed to the published version of the manuscript.
Funding
This research was funded by the National Natural Science Foundation of China (52008162), Key Research, The Fellowship of China Postdoctoral Science Foundation (2020M680114) and Natural Science Foundation of Hunan Province (2022JJ40079).
Institutional Review Board Statement
Not applicable.
Informed Consent Statement
Not applicable.
Data Availability Statement
Not applicable.
Conflicts of Interest
The authors declare no conflict of interest.
References
- ASCE. 2021 Infrastructure Report Card; ASCE: Reston, VA, USA, 2021. [Google Scholar]
- Tan, C.; Elhattab, A.; Uddin, N. “Drive-by” bridge frequency-based monitoring utilizing wavelet transform. J. Civ. Struct. Health Monit. 2017, 7, 615–625. [Google Scholar] [CrossRef]
- Carden, E.P.; Fanning, P. Vibration based condition monitoring: A review. Struct. Health Monit. 2004, 3, 355–377. [Google Scholar] [CrossRef]
- Malekjafarian, A.; McGetrick, P.J.; OBrien, E.J. A Review of Indirect Bridge Monitoring Using Passing Vehicles. Shock Vib. 2015, 2015, 286139. [Google Scholar] [CrossRef]
- Yang, Y.B.; Zhang, B.; Chen, Y.A.; Qian, Y.; Wu, Y.T. Bridge damping identification by vehicle scanning method. Eng. Struct. 2019, 183, 637–645. [Google Scholar] [CrossRef]
- Yang, Y.; Li, Z.; Wang, Z.; Shi, K.; Xu, H.; Qiu, F.; Zhu, J. A novel frequency-free movable test vehicle for retrieving modal parameters of bridges: Theory and experiment. Mech. Syst. Signal Process. 2022, 170, 108854. [Google Scholar] [CrossRef]
- Urushadze, S.; Yau, J.-D.; Yang, Y.-B.; Bayer, J. Theoretical and Experimental Verifications of Bridge Frequency Using Indirect Method. In Dynamics of Civil Structures; Springer: Berlin/Heidelberg, Germany, 2020; Volume 2, pp. 153–158. [Google Scholar]
- Tan, C.; Zhao, H.; OBrien, E.J.; Uddin, N.; Fitzgerald, P.C.; McGetrick, P.J.; Kim, C.-W. Extracting mode shapes from drive-by measurements to detect global and local damage in bridges. Struct. Infrastruct. Eng. 2021, 17, 1582–1596. [Google Scholar] [CrossRef]
- Tan, C.; Elhattab, A.; Uddin, N. Wavelet-Entropy Approach for Detection of Bridge Damages Using Direct and Indirect Bridge Records. J. Infrastruct. Syst. 2020, 26, 04020037. [Google Scholar] [CrossRef]
- Yang, Y.B.; Lin, C.W.; Yau, J.D. Extracting bridge frequencies from the dynamic response of a passing vehicle. J. Sound Vib. 2004, 272, 471–493. [Google Scholar] [CrossRef]
- Yang, Y.B.; Lin, C.W. Vehicle–bridge interaction dynamics and potential applications. J. Sound Vib. 2005, 284, 205–226. [Google Scholar] [CrossRef]
- Lin, C.W.; Yang, Y.B. Use of a passing vehicle to scan the fundamental bridge frequencies: An experimental verification. Eng. Struct. 2005, 27, 1865–1878. [Google Scholar] [CrossRef]
- Yang, Y.B.; Chang, K.C. Extraction of bridge frequencies from the dynamic response of a passing vehicle enhanced by the EMD technique. J. Sound Vib. 2009, 322, 718–739. [Google Scholar] [CrossRef]
- Tan, C.; Uddin, N. Hilbert transform based approach to improve extraction of “drive-by” bridge frequency. Smart Struct. Syst. 2020, 25, 265–277. [Google Scholar] [CrossRef]
- McGetrick, P.J.; Gonzalez, A.; Obrien, E.J. Theoretical investigation of the use of a moving vehicle to identify bridge dynamic parameters. Insight 2009, 51, 433–438. [Google Scholar] [CrossRef]
- Siringoringo, D.M.; Fujino, Y. Estimating Bridge Fundamental Frequency from Vibration Response of Instrumented Passing Vehicle: Analytical and Experimental Study. Adv. Struct. Eng. 2012, 15, 417–433. [Google Scholar] [CrossRef]
- Kong, X.; Cai, C.S.; Kong, B. Numerically Extracting Bridge Modal Properties from Dynamic Responses of Moving Vehicles. J. Eng. Mech. 2016, 142, 04016025. [Google Scholar] [CrossRef]
- Elhattab, A.; Uddin, N.; Obrien, E. Drive-By Bridge Frequency Identification under Operational Roadway Speeds Employing Frequency Independent Underdamped Pinning Stochastic Resonance (FI-UPSR). Sensors 2018, 18, 4207. [Google Scholar] [CrossRef]
- Mei, Q.P.; Gul, M.; Boay, M. Indirect health monitoring of bridges using Mel-frequency cepstral coefficients and principal component analysis. Mech. Syst. Signal Process. 2019, 119, 523–546. [Google Scholar] [CrossRef]
- Gonzalez, A.; OBrien, E.J.; McGetrick, P.J. Identification of damping in a bridge using a moving instrumented vehicle. J. Sound Vib. 2012, 331, 4115–4131. [Google Scholar] [CrossRef]
- Keenahan, J.; Obrien, E.J.; McGetrick, P.J.; Gonzalez, A. The use of a dynamic truck–trailer drive-by system to monitor bridge damping. Struct. Health Monit. Int. J. 2013, 13, 143–157. [Google Scholar] [CrossRef]
- Tan, C.J.; Uddin, N.; OBrien, E.J.; McGetrick, P.J.; Kim, C.W. Extraction of Bridge Modal Parameters Using Passing Vehicle Response. J. Bridge Eng. 2019, 24, 04019087. [Google Scholar] [CrossRef]
- Zhang, Y.; Wang, L.Q.; Xiang, Z.H. Damage detection by mode shape squares extracted from a passing vehicle. J. Sound Vib. 2012, 331, 291–307. [Google Scholar] [CrossRef]
- Malekjafarian, A.; Brien, E.J. Identification of bridge mode shapes using Short Time Frequency Domain Decomposition of the responses measured in a passing vehicle. Eng. Struct. 2014, 81, 386–397. [Google Scholar] [CrossRef]
- Yang, Y.B.; Li, Y.C.; Chang, K.C. Constructing the mode shapes of a bridge from a passing vehicle: A theoretical study. Smart Struct. Syst. 2014, 13, 797–819. [Google Scholar] [CrossRef]
- Oshima, Y.; Yamamoto, K.; Sugiura, K. Damage assessment of a bridge based on mode shapes estimated by responses of passing vehicles. Smart Struct. Syst. 2014, 13, 731–753. [Google Scholar] [CrossRef]
- OBrien, E.J.; Malekjafarian, A. A mode shape-based damage detection approach using laser measurement from a vehicle crossing a simply supported bridge. Struct. Control Health Monit. 2016, 23, 1273–1286. [Google Scholar] [CrossRef]
- Malekjafarian, A.; OBrien, E.J. On the use of a passing vehicle for the estimation of bridge mode shapes. J. Sound Vib. 2017, 397, 77–91. [Google Scholar] [CrossRef]
- Marulanda, J.; Caicedo, J.M.; Thomson, P. Mode shapes identification under harmonic excitation using mobile sensors. Ing. Compet. 2017, 19, 140–145. [Google Scholar]
- Fitzgerald, P.C.; Malekjafarian, A.; Cantero, D.; OBrien, E.J.; Prendergast, L.J. Drive-by scour monitoring of railway bridges using a wavelet-based approach. Eng. Struct. 2019, 191, 1–11. [Google Scholar] [CrossRef]
- Cantero, D.; Basu, B. Railway infrastructure damage detection using wavelet transformed acceleration response of traversing vehicle. Struct. Control Health Monit. 2015, 22, 62–70. [Google Scholar] [CrossRef]
- Zhang, B.; Qian, Y.; Wu, Y.T.; Yang, Y.B. An effective means for damage detection of bridges using the contact-point response of a moving test vehicle. J. Sound Vib. 2018, 419, 158–172. [Google Scholar] [CrossRef]
- Mahato, S.; Teja, M.V.; Chakraborty, A. Combined wavelet–Hilbert transform-based modal identification of road bridge using vehicular excitation. J. Civ. Struct. Health Monit. 2017, 7, 29–44. [Google Scholar] [CrossRef]
- Khorram, A.; Bakhtiari-Nejad, F.; Rezaeian, M. Comparison studies between two wavelet based crack detection methods of a beam subjected to a moving load. Int. J. Eng. Sci. 2012, 51, 204–215. [Google Scholar] [CrossRef]
- Nguyen, K.V.; Tran, H.T. Multi-cracks detection of a beam-like structure based on the on-vehicle vibration signal and wavelet analysis. J. Sound Vib. 2010, 329, 4455–4465. [Google Scholar] [CrossRef]
- Shahsavari, V.; Bastien, J.; Chouinard, L.; Clement, A. Likelihood-based testing of wavelet coefficients for damage detection in beam structures. J. Civ. Struct. Health Monit. 2017, 7, 79–98. [Google Scholar] [CrossRef]
- Shahsavari, V.; Chouinard, L.; Bastien, J. Wavelet-based analysis of mode shapes for statistical detection and localization of damage in beams using likelihood ratio test. Eng. Struct. 2017, 132, 494–507. [Google Scholar] [CrossRef]
- Poudel, U.P.; Fu, G.K.; Ye, H. Wavelet transformation of mode shape difference function for structural damage location identification. Earthq. Eng. Struct. Dyn. 2007, 36, 1089–1107. [Google Scholar] [CrossRef]
- McGetrick, P.J.; Kim, C.W. A Parametric Study of a Drive by Bridge Inspection System Based on the Morlet Wavelet. Key Eng. Mater. 2013, 569–570, 262–269. [Google Scholar] [CrossRef]
- Hester, D.; Gonzalez, A. A wavelet-based damage detection algorithm based on bridge acceleration response to a vehicle. Mech. Syst. Signal Process. 2012, 28, 145–166. [Google Scholar] [CrossRef]
- Hester, D.; Gonzalez, A. A discussion on the merits and limitations of using drive-by monitoring to detect localised damage in a bridge. Mech. Syst. Signal Process. 2017, 90, 234–253. [Google Scholar] [CrossRef]
- Zhang, B.; Zhao, H.; Tan, C.; OBrien, E.J.; Fitzgerald, P.C.; Kim, C.-W. Laboratory Investigation on Detecting Bridge Scour Using the Indirect Measurement from a Passing Vehicle. Remote Sens. 2022, 14, 3106. [Google Scholar] [CrossRef]
- Hu, H.; Tang, J.H. A convolution integral method for certain strongly nonlinear oscillators. J. Sound Vib. 2005, 285, 1235–1241. [Google Scholar] [CrossRef]
- Sinha, J.K.; Friswell, M.I.; Edwards, S. Simplified models for the location of cracks in beam structures using measured vibration data. J. Sound Vib. 2002, 251, 13–38. [Google Scholar] [CrossRef]
- ISO. Mechanical Vibration—Road Surface Profiles—Reporting of Measured Data; ISO: Geneva, Switzerland, 1995. [Google Scholar]
- Fitzgerald, P.C.; Malekjafarian, A.; Bhowmik, B.; Prendergast, L.J.; Cahill, P.; Kim, C.W.; Hazra, B.; Pakrashi, V.; OBrien, E.J. Scour Damage Detection and Structural Health Monitoring of a Laboratory-Scaled Bridge Using a Vibration Energy Harvesting Device. Sensors 2019, 19, 2572. [Google Scholar] [CrossRef] [PubMed]
- Malekjafarian, A.; Kim, C.-W.; OBrien, E.J.; Prendergast, L.J.; Fitzgerald, P.C.; Nakajima, S. Experimental Demonstration of a Mode Shape-Based Scour-Monitoring Method for Multispan Bridges with Shallow Foundations. J. Bridge Eng. 2020, 25, 04020050. [Google Scholar] [CrossRef]
Publisher’s Note: MDPI stays neutral with regard to jurisdictional claims in published maps and institutional affiliations. |
© 2022 by the authors. Licensee MDPI, Basel, Switzerland. This article is an open access article distributed under the terms and conditions of the Creative Commons Attribution (CC BY) license (https://creativecommons.org/licenses/by/4.0/).

