1. Introduction
Nowadays, social media platforms and online social networks have become an important source of information. Users tend to rely on online communication platforms for getting information, publishing posts that reflect their interests, views, and activities [
1]. At the same time, users can express their opinions about other posts via different forms of feedback, such as reposts, quotes, mentions, replies, likes, etc. All these activities affect information spreading on social media [
2]. In the last two decades, online social networks have increased the spread of information, but also misinformation and disinformation, which can lead to an infodemic and other negative side effects [
3,
4]. Therefore, exploring patterns of information spreading on social networks is a significant aspect of research in the domain of disinformation detection and infodemic. The primary motivation for this research was the analysis of crisis-related communication on social networks. However, the proposed approach can be applied in other domains for tasks related to retweet prediction.
Because social media platforms such as Twitter, Facebook, Instagram, and Weibo play an increasingly important role, people are more likely to turn to them in search of information during a global crisis. They can serve as an essential communication platform in real-world crises, emergencies, or disasters [
5,
6]. Social media may even influence the course of global crises, particularly in the context of epidemics, climate change, migration crises, economic crises, or wars. For example, the outbreak of the COVID-19 disease caused a significant increase in social media usage among the public, and it seriously affected the public’s understanding of the COVID-19 risk [
7]. In some countries, there were many negative attitudes toward vaccines and anti-pandemic measures promoted on social networks [
8]. Therefore, information-spreading analysis during a global crisis is of great importance as one of the steps of social media monitoring (infoveillance).
Twitter is one of the largest social networks with around 330 million monthly active users [
9]. Consequently, it is one of the most studied social networks. Recently, it has frequently been used for monitoring and tracking different aspects of healthcare information and public disease [
8,
10,
11]. Among all the user behavior on social media, retweets are considered to be one of the primary ways of spreading information on Twitter [
12,
13]. There is a large number of studies that deal with the prediction of information spreading on Twitter and other social networks. Many complex factors may influence the patterns of information spreading. Thus, different studies propose different sets of features for retweet prediction. Previous methods studied the problem by using various linguistic features, personal information of users, or network properties [
12].
In some recent studies, authors combined heterogeneous data sources: information content, network structure, dynamics of spreading, information metadata, and other properties that can be referred to as heterogeneous data sources [
1,
13,
14,
15,
16,
17]. However, there are properties that have not been fully explored in the task of retweet prediction. One less-studied approach is the use of multilayer network properties as features, especially in combination with other features from heterogeneous data sources. The multilayer network is a formalism that captures various sorts of relationships over network data [
18,
19]. Used in the context of a social network, a multilayer network can represent different actions within the social network such as follow, share, quote, mention, or reply as the separate network layer. Because each action has a different impact on information spreading, in this way it is possible to make a fine-grade differentiation between layers and to include all this information as predictors of retweeting. We have already shown that a multilayer network structure is fundamentally more expressive than individual layers in examples of modeling a multilayer language network [
20] and multidimensional knowledge network [
21]. In [
22], the authors use multilayer network features for disinformation detection in US and Italian news spreading on Twitter.
Inspired by these results, we decided to employ multilayer network features in the more general task of information-spreading prediction. However, in our approach, we construct a different multilayer network of Twitter and select different network measures to construct a multilayer network set of features. In addition, we combine multilayer network features with text features. To the best of our knowledge, this is the first time that anyone has attempted to use this set of multilayer network features in the task of retweet prediction and the first time anyone has attempted to combine multilayer network features with text features. We formalized our approach by introducing a multilayer framework for the representation of key elements of communications on social networks.
The main objective of this study is to explore the potential of the multilayer network measures as the set of features in the task of retweet prediction. Additionally, we investigate whether the multilayer network features combined with text features perform better than just one set of features. Therefore, this study explores how message features extracted from heterogeneous data sources may affect tweet spreading in terms of retweeting.
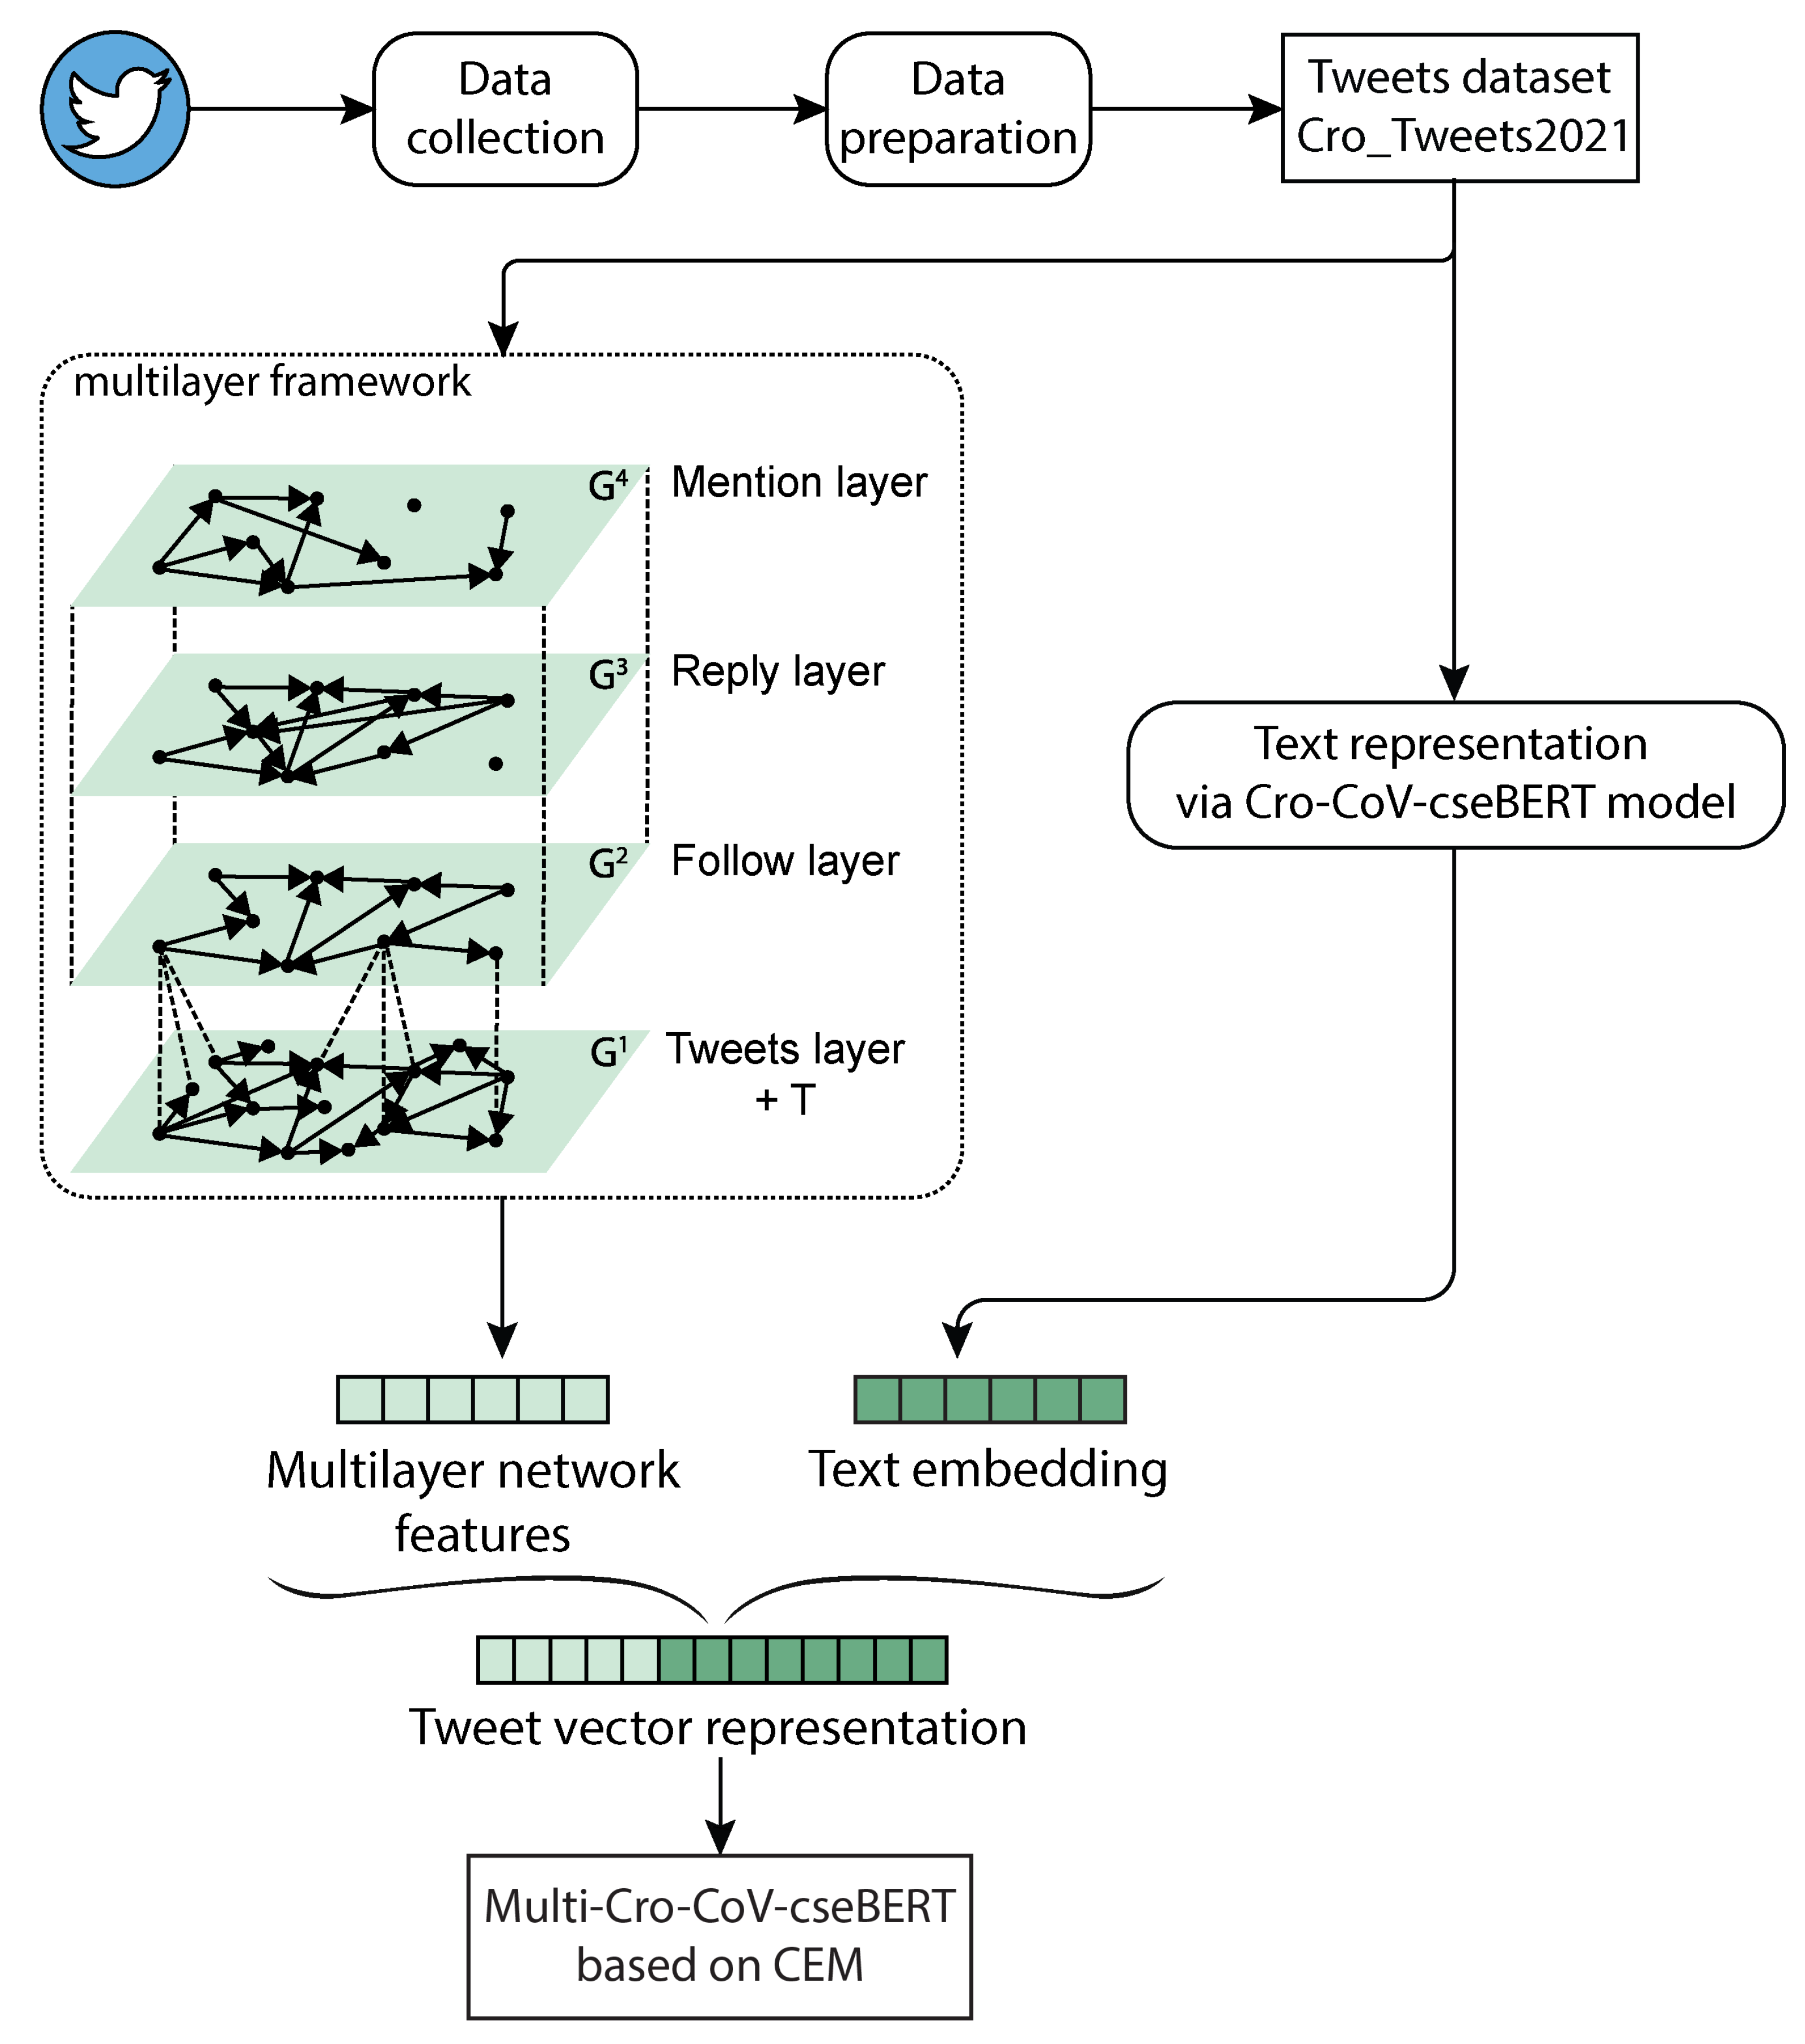
Multilayer network features are extracted from the multilayer model of the social network within which a message is spreading. For the purpose of retweeting prediction, we propose and construct a multilayer network representation with four layers representing actions of following, mentioning, replying, and a layer of tweets, and select several network measures from each layer. Text features are represented as a low-dimensional vector (embedding) that captures its semantics and structure. More specifically, we adopt a BERT-based language model, namely Cro-CoV-cseBERT [
8] for representation of tweets as embeddings, which we use as a set of text features.
We model the prediction problem as a binary classification task in which the first class contains tweets with just one retweet and the second class contains tweets with more than one retweet. Next, we explore the performance of different feature sets by conducting an extensive set of experiments in which we train six machine learning models in three different setups: (i) classification based on text features, (ii) classification based on multilayer network features, and (iii) classification based on text and multilayer network features. More precisely, we trained the following classifiers: random forest (RF), multilayer perceptron (MLP), light gradient boosting machine (LGBM), category-embedding model (CEM), neural oblivious decision ensembles (NODE), and attentive interpretable tabular learning (TabNet model). We evaluated the performance of trained classifiers on three different sets of features in terms of standard evaluation measures: accuracy, precision, recall, and F1 score on a large dataset of tweets. For this purpose, we prepared an empirical dataset of 199,431 tweets in the Croatian language posted during the pandemic period between 1 January 2020 and 31 May 2021.
Our main research question is whether the use of multilayer network features in combination with features from heterogeneous data sources yields better results in terms of classification evaluation measures over just text features. Additionally, we are interested in understanding which of the above features are most effective in the classification task, and we analysed this by using the SHAP approach.
To summarize, the main contributions of this study are as follows.
We propose a multilayer framework formalism for Twitter representation based on multilayer network and select a set of measures from each layer to be extracted and combined with the metadata as the set of multilayer network features.
We conducted a set of experiments on a dataset of tweets using separate text features and multilayer network features and their combination and evaluated the performance of six machine learning classifiers.
We performed an analysis of feature importance to determine the impact of two sets of features for the task of retweet prediction and studied various multilayer network features chosen by using SHAP.
The rest of the paper is organized as follows.
Section 2 discusses some of the existing research in the prediction of retweeting.
Section 3 describes datasets, machine learning classifiers and the methods utilized in this study.
Section 4 presents the results and analysis of our proposed approach.
Section 5 discusses the proposed approach. Finally,
Section 6 concludes our work.
2. Related Work
Information-spreading analysis and the retweet-prediction task have been extensively studied by a number of researchers. There are many different ways to approach the problem of retweet prediction. It can be modelled as a binary or multiclass classification problem in which classes are defined according to the number of retweets, and the model should predict the class of a given tweet, as well as a regression/prediction problem in which the model should predict the number of retweets for a given tweet [
23]. There are also some other approaches such as prediction a
p value, which is the probability of a retweet of the given tweet by the given user [
24] or users’ retweet behaviour prediction [
15], retweet time prediction [
13] or the prediction of the size of retweet cascade size as in [
25]. In the domain of complex networks, this task is usually described as the link prediction in the network of retweeting. From a broader perspective, spreading patterns have been studied in many fields ranging from disease spreading [
26,
27] to information spreading on social networks [
28].
In all these approaches, one of the major research questions is related to the identification of the properties that affect the spreading. There are many possible factors that influence information spreading on a social network, ranging from linguistic features, personal information of users such as user profiles, user post history, user following relationships, network properties, etc. There are studies that try to predict retweeting based solely on text properties [
29,
30] or based on topic and emotion extracted from text [
31]. On the other hand, many authors use only network properties to predict retweeting [
32,
33].
Some recent studies show the advantages of combining features from different, heterogeneous sources: information content, network structure, dynamics of spreading, information metadata, and other properties that can be referred to as heterogeneous data sources [
1,
13]. There are still some combinations of heterogeneous data sources worth exploring as predictors of spreading. One such approach is combining multilayer network features with text features proposed in this study. In the following subsections we give an overview of two research domains related to the proposed approach: (i) research studies that combine features from heterogeneous data sources in the task of retweet prediction, and (ii) research of the multilayer network approach.
2.1. Retweet Prediction Based on Heterogeneous Data Sources
Usually, in approaches based on heterogeneous data sources authors combine features extracted from the message text and from the social network. There have been attempts to combine content features (extracted from text) and contextual features (extracted from networks) even in some earlier research studies. However, the proposed feature sets are relatively simple and include only partial information extracted from the text and networks. Thus, Suh et al. [
34] examined two classes of features that might affect the retweetability of tweets: (i) the content features that include whether the tweet contains URLs, hashtags, and mentions and (ii) the contextual features that include the number of followers and followees, the age of the account, the number of favorite tweets, and the number and frequency of tweets. The results revealed that, when it comes to content features, URLs and hashtags have a strong influence on retweeting. When it comes to contextual features, the number of followers and followees, as well as the age of the account, seem to affect retweetability. Similarly, in [
35] the authors studied the effect of the message content in the task of the spreading prediction of ideas. They analyzed the contribution and the limitations of the various feature sets on the information spreading. According to their results, it seems that a combination of content features with temporal and topological network features minimizes prediction error.
In one more recent study, Sharma and Gupta [
14] explored the impact of different numerical features extracted from tweet content and network in the task of retweet prediction. They proposed three features from the author’s profile that can capture the behavioral pattern of the user: author total activity, author activity per year, and author tweets per year. They performed their experiment by using a large dataset (Scott, Jason, and Sketch the Cow. “Archiveteam-Twitter-Stream-2018-08: Free Download, Borrow, and Streaming”. Internet Archive, Archive Team: The Twitter Stream Grab:
https://archive.org/details/archiveteam-twitter-stream-2018-08, accessed on 20 September 2022) containing 100 million random tweets from the online twitter archive of August 2018. Their results showed that the proposed model has better accuracy when user features are combined with tweet content features. Yin et al. [
13] combined text and network features and proposed a novel deep fusion of multimodal features (DFMF) method for retweet time prediction. Their method combines text features and node features in a way that it constructs a word-embedding layer to learn the semantics of a tweet and a node-embedding layer to learn social relationships within the network. The proposed method is evaluated on the real-world Twitter dataset (UDI-Twitter Crawl-Aug20123:
https://wiki.illinois.edu/wiki/display/forward/Dataset-UDI-TwitterCrawl-Aug2012, accessed on 20 September 2022) that contains 284 million following relationships, 3 million user profiles, and 50 million tweets. The evaluation results showed that the proposed method was more accurate in predicting the retweet time and can achieve as much as an 11.25% performance improvement on the recall accuracy compared to logistic regression (LR) and support vector machine (SVM).
The properties used for retweet prediction may be extracted from the author of the tweet (author-centered prediction) or from the user who will retweet (user-centered prediction). Thus, some recent studies combine features extracted from author, tweet text, and user. For example, Fu et al. [
15] proposed a prediction model MDF-RP (multidimensional feature-based retweeting prediction) that combines features extracted from three different sources: author, tweet, and user in order to predict if the user will retweet the given tweet message. The evaluation of the proposed model was performed on the dataset of messages crawled from Weibo (social network in China, similar to Twitter) from 1 June 2018 to 31 July 2018 with 3352 users and 316,829 tweets (the dataset is available upon request). Their results based on different classifiers showed that the performances of MDF-RP outperformed the basic features in terms of precision, recall, and F1 score.
On the other hand, Fridaus et al. performed only user-centered prediction [
1]. They analyzed the impact of the users’ behaviors on retweet activities based on three aspects: topic preference, emotion, and personality. They proposed two types of retweet-prediction models, one of which uses classification algorithms, and the other matrix factorization algorithms. For their experiment, authors collected a dataset of tweets (dataset of Twitter IDs:
https://github.com/snadiaf/Twitter-Data, accessed on 20 September 2022). The evaluation results showed that in terms of the F1 score, the proposed classification models based on user behavior-related features provided a 5–9% improvement over baseline models and the matrix factorization model showed a 4–6% improvement over the baseline. Similarly, Ma et al. [
17] explored features from different sources related to the hot topics discussed by the users’ followees proposing a novel masked self-attentive model to perform retweet prediction. They incorporated the posting histories of users with an external memory and utilized a hierarchical attention mechanism to construct the users’ interests. The results obtained on a dataset collected from Twitter with a total of 411,054 users and 36,807,681 tweets showed that the proposed method can perform better than state-of-the-art methods. Dai et al. [
16] improved the SVM model for the prediction of user forwarding behavior of hot topics which was also based on user features. The prediction of user retweeting behavior is based on combining three different data sources: user interest tags, user history behavior, and external factors influence. For the purpose of the experiment, the collected dataset of tweets was divided into a training dataset and a test dataset (the training and test datasets are available at:
https://www.sciencedirect.com/topics/engineering/test-dataset, accessed on 20 September 2022). In addition to retweet prediction, heterogeneous feature sources have also been successfully used to predict buzz tweets. Amitani et al. [
36], in their study on the classification of “buzz” tweets, examine the trends on social media and propose a classification method to study the factors that cause the buzz phenomenon on Twitter. This phenomenon can be understood as an explosion of popularity within a short period of time. The authors note that it is difficult to determine the causes of the buzz phenomenon based solely on texts posted on Twitter. However, they developed a multitask neural network by using both image and text-extracted features as input and buzz class (buzz or non-buzz) and number of “likes” and “retweets” as output. The text features of the tweets were extracted by using the pre-trained BERT model, and the image features were obtained from pre-trained models such as VGG16. The results of the experiments showed that the correct response rate for predicting buzz classes with the proposed method using both text and image features was higher than when using the text or image features alone [
36].
2.2. Multilayer Network-Based Approach in Social Networks Representation
As can be seen from the previous section, there are many possibilities in combining heterogeneous data sources for feature engineering in the task of retweet prediction, and almost all of them include some features extracted from the social network, involving author-centered properties, user-centered properties or a combination of both. However, there is still a dearth of research studies that represent a social network as a multilayer network which can capture different users’ actions (such as reply, quote, mention, and follow) as separate layers. As we claim in the introduction section, network properties extracted from different layers provide more detailed insight into online communication, and based on this it is possible to better predict the action of retweeting. Thus, we expect that multilayer network measures combined with text features have great potential in the prediction of retweeting.
One such study carried out by Pierri et al. [
22] modeled Twitter as a multilayer network including four layers: mention, reply, retweet, and quote layer. They applied multilayer network representation of Twitter in the task of disinformation detection in US and Italian news spreading over Twitter. More precisely, they used multilayer network measures for classifying news articles pertaining to disinformation vs. mainstream news by solely inspecting their diffusion mechanisms on Twitter. They trained a logistic regression model to classify disinformation vs. mainstream networks on two large-scale datasets of diffusion cascades (tweets for United States and Italy). The proposed approach has a high accuracy (AUROC up to 94%) in the task of disinformation detection and suggests that a similar approach based on multilayer networks might be possible for the task of information-spreading prediction in general.
There are some other studies that used multilayer networks to model different aspects of online social networks communication. Thus, Arenas et al. [
37] modelled various kinds of interactions (specifically, retweeting, mentioning, and replying) as separate layers aiming to characterize interactions in online social networks during exceptional events that cause a large number of tweets (such as the discovery of the Higgs boson). They showed that a multilayer approach can reveal the presence of statistical regularities across different events, suggesting that there are some universal properties of online social networks during exceptional events. In [
38], the authors proposed a method based on a multilayer approach-capable of identifying influencers on online social networks. The layers represent users, items, and keywords, along with the intralayer interactions among the actors of the same layer. Magnani and Rossi proposed a model for the representation of multilayer networks and applied this model to two online social networks [
39]. Their results confirmed that considering a multilayer network model allows us to extract results that do not correspond completely to the ones that can be obtained from each network layer separately.
In [
40], the authors explored two online platforms, Twitter and Foursquare, analyzing the geosocial properties of links. They represented the two platforms as a composite multilayer online social network, wherein each platform represents a layer in the network. According to their results, by using the multilayer approach it is possible to successfully predict links across social networking services. It is also worth mentioning that in [
41,
42,
43] the authors investigated the spreading patterns in multilayer networks. However, they did not apply machine learning algorithms, and their approaches were based on diffusion modeling.
All of these studies of the multilayer network-based approach in modeling social networks are valuable, and they have proven the potential of multilayer networks when it comes to capturing important properties of online communication. In our research, we adopted some of these ideas. However, we have modeled Twitter differently and utilized network measures that differ from all previous approaches.
3. Materials and Methods
3.1. Multilayer Framework Definition
In this section we introduce a multilayer framework, as a formalism that can capture various aspects of message spreading on Twitter. This is an extension of our previous work published in [
4], in which we proposed a communication multilayer framework for representing communication on social media. Here, we define a framework based on the multilayer network that we use to represent different users’ actions on Twitter. Within the multilayer framework, we aggregate the multilayer social network with a set of metadata corresponding to text messages published on social media. Next we select set of network measures from each layer and define a set of multilayer network features used to train six ML models for retweet prediction.
According to [
18], a multilayer network is defined as a pair:
where
is a family of networks (graphs)
called network layers of
and
is the set of interconnections between nodes of different layers
and
where
.
Similar to work presented in [
4], layers are annotated as numbers from the set
, where
m is the number of layers. Like one-layer networks, multilayered networks can be directed or undirected, weighted or unweighted. Note that communication in social networks is best described by using a weighted and directed multilayer network.
Next, we introduce and consider a set
T of metadata related to text messages posted on social networks. Generally, set
T includes all messaging metadata that is available; however, the concrete metadata represented within the framework may vary depending on the task. In the case of Twitter and the retweet-prediction task, this metadata includes information such as the number of retweets, quotes, mentions, etc. In the context of network analysis, these vectors may be attributes of nodes that represent messages. Finally, the multilayer framework is defined as a tuple:
3.2. Twitter Communication Represented by Using Multilayer Network
Given the framework
defined according to the (
3), we model a Twitter network as the multilayer framework consists of four layers, thus
. Each layer represents one aspect of communication on Twitter as follows.
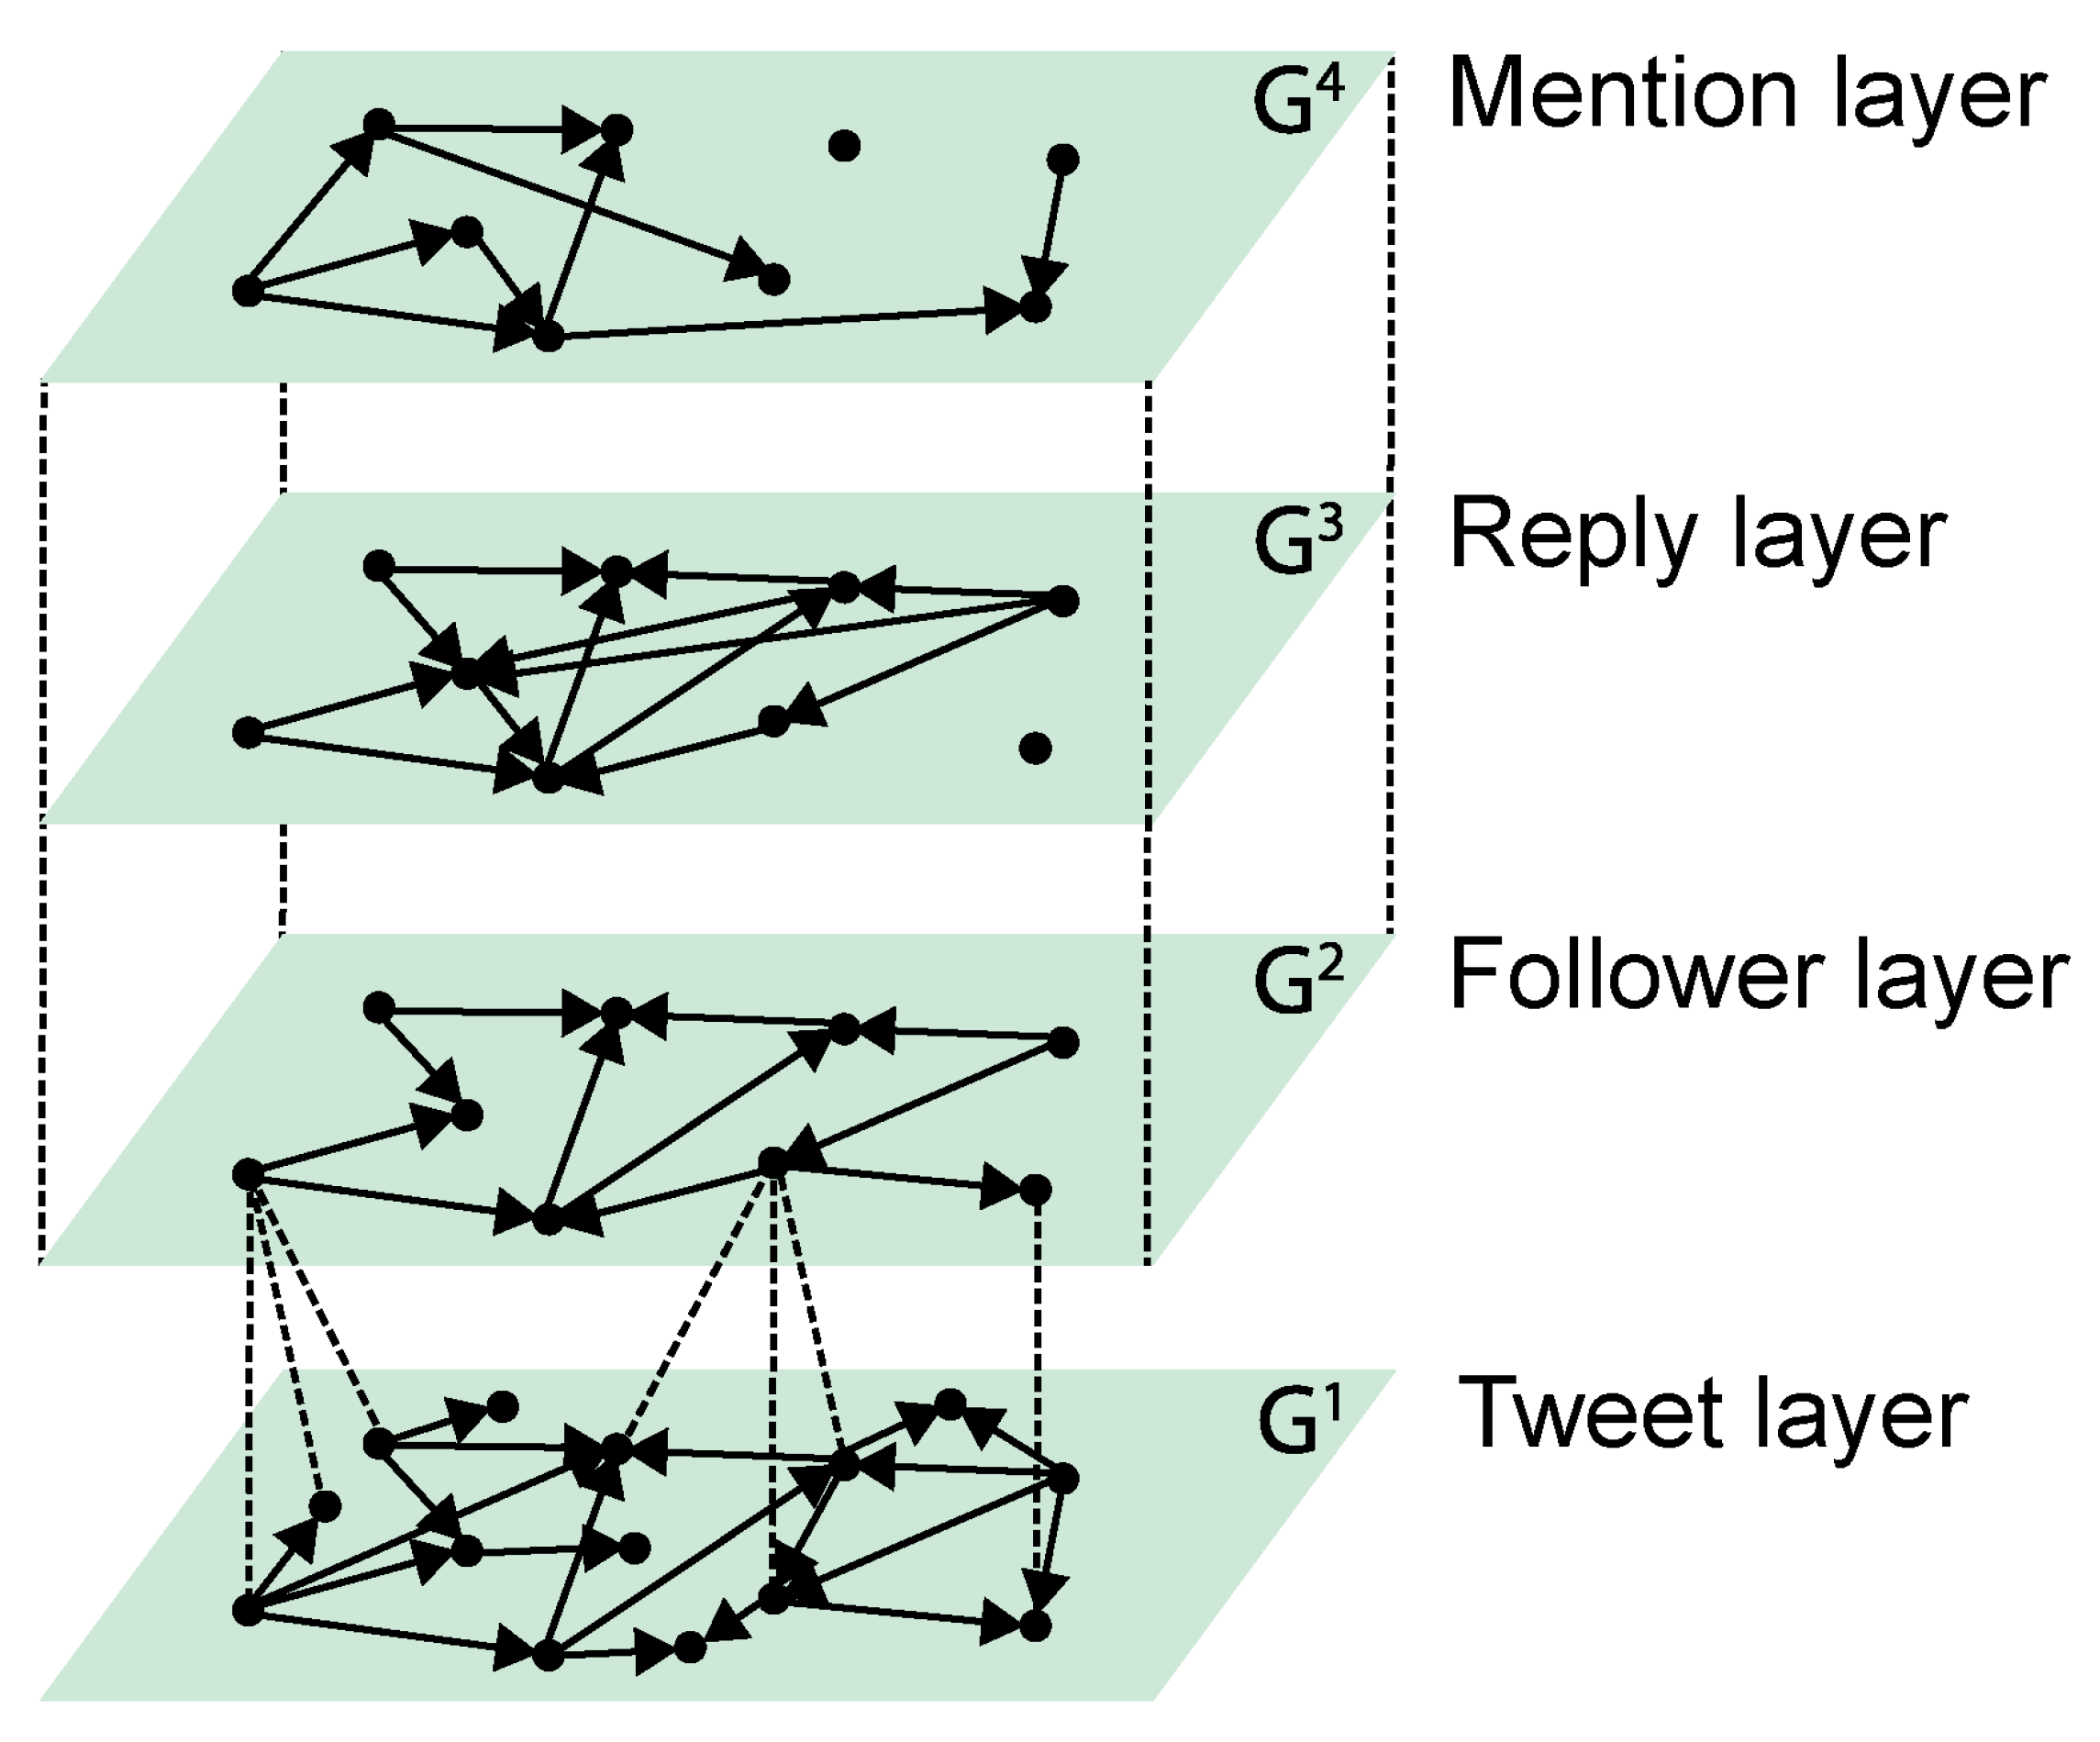
The first layer is the tweet layer, , in which nodes represent Twitter messages and two nodes i and j are connected with the directed link if message i and j have at least three words and/or hashtags in common. The direction of the link is defined according to the timeline; from the first tweet to the second tweet. The link weight is defined as the number of common words/hashtags. The second layer is the follower layer, , in which nodes represent Twitter users and two nodes i and j are connected with the directed link if user j follows user i. This is an unweighted network; however, the whole network is weighted, and thus all weights in this layer are set to 1. The third layer is the reply layer, , in which nodes represent Twitter users and two nodes i and j are connected with the directed link if user j replies to user i. The weight is defined as the number of replies. The fourth layer is is a mention layer, , in which nodes represent Twitter users and two nodes i and j are connected with the directed link if user j mentions user i. The weight is defined as the number of mentions. Next, we define a set of interconnections between nodes of different layers. The first layer of tweets (tweet layer) is connected with the second layer (follower layer) in the way that there is a directed link from the user (follower) to every tweet that he/she posts. The reply layer is connected with the tweet layer in the way that there is a directed link from the user to the tweet if the user replies to this tweet. Analogously, the mention layer is connected with the tweet layer in the way that there is a directed link from the user to the tweet if the user mentions this tweet. The rest of the layers, , and represent a multiplex network in which interconnections are established between the same nodes. A multiplex network is a special case of the multilayer network in which interlayer links can only connect nodes that represent the same node in different layers.
The model of Twitter represented as the multilayer network is illustrated in
Figure 1. The figure is taken from [
4] and adapted to the experiment of this study.
Further explanations and details of the multiplex, which is illustrated in
Figure 1, the connections between the nodes of the same or different layers, and the weights can be found in [
4].
3.3. Multilayer Network Features
Next, we select a set of local network measures: degree (in/out), strength (in/out), eigenvector centrality (in/out), Katz centrality (in/out), average clustering coefficient and number of communities.
In general, local network measures are based on the number of node links, node position within the network, and relationship with other nodes. These are centrality measures, and they help in identification of the most influential individuals (nodes) in the network. These measures can give an insight into how nodes communicate with each other, which nodes are the most popular (hubs), how close are nodes with each other, and which nodes control the network (in terms of information flow). In the context of retweeting prediction, node centrality measures can exhibit the nodes with the largest potential to be retweeted. It is important to emphasize that the appropriate usage of centrality measures depends on the understanding of the type of links in the network and network flow [
44].
Degree centrality of a node is the measure that takes into account the total number of links incident with a node. In the context of Twitter network, degree centrality can be interpreted as node with the largest number of followers or friends. However, if we capture more than one layer, degree centrality may also indicate the node with the largest number of mentions or replies. A higher degree implies popularity, and a higher possibility to gain information that is flowing through the network. According to [
45], for a node
i and the number of its links to other nodes
, degree centrality is usually normalized by dividing it by the maximum possible degree
:
In weighted networks, a weighted degree is refereed to as node strength. Strength of a node
i is defined as the sum of all weights attached to links belonging to this node [
45]:
where
denotes the set of neighbouring nodes of a node
i.
Eigenvector centrality is introduced by Bonacich [
46]. It takes into account the centrality of the adjacent nodes. It can be interpreted as a measure of influence of a node in a network. A high eigenvector score means that a node is connected to many nodes that themselves have high scores. Relative scores are assigned to all nodes in the network based on the concept that connections to high-scoring nodes contribute more to the score than equal connections to low-scoring nodes. For the node
i and constant
centrality
of node
i is defined as [
46]:
Eigenvector centrality computes the centrality for a node based on the centrality of its neighbors. The eigenvector centrality for node
i is the
ith element of the vector
x defined by the equation [
45]
where
A is the adjacency matrix of graph
G with eigenvalues
. There is a unique solution
x, all of whose entries are positive, if
is the largest eigenvalue of the adjacency matrix [
45].
For directed graphs, Equation (
6) calculates the “left” eigenvector centrality which corresponds to the in-edges in the graph. For calculating out-edges’ eigenvector centrality, it is necessary to reverse the graph
G.
Katz centrality introduced by Leo Katz [
47] calculates topological centrality that helps to discover the relative influence of each node on the network. It is a generalization of the eigenvector centrality. Katz centrality computes the centrality for a node based on the centrality of its neighbors. The general equation for calculating Katz centrality for node
i is [
47]:
where parameter
controls the initial centrality and
.
Katz centrality computes the relative influence of a node within a network by measuring the number of the immediate neighbors (first degree nodes) and also all other nodes in the network that connect to the node under consideration through these immediate neighbors. For directed graphs, it is possible to calculate in- and out-Katz centrality by taking into account that Equation (
8) can find “left” eigenvectors which correspond to the in-edges in the graph. For out-edge Katz centrality, it is necessary to use the reverse graph
G.
Clustering coefficient of a node measures how well are neighbors interconnected and quantifies if they are becoming a clique. The local clustering coefficient is calculated as the proportion of links between the nodes within its neighborhood divided by the number of links that could possibly exist between them. Real-world networks (and in particular social networks) have on average higher clustering coefficient than random networks (when comparing networks of the same size). The clustering coefficient of a node
i is defined as [
48]
where
represents the number of pairs of neighbours of a node
i that are connected.
For each layer, we compute a set of network features separately and quantify different aspects of the information-spreading process. Based on these five centrality measures, we calculate values for in- and out-centrality measure (except clustering coefficient which is undirected) according to the equations defined in (
4)–(
6), (
8), (
9). As a result, we have nine features for each layer which makes 36 features in total.
In addition, we integrate network measures with the Twitter network metadata from . We incorporate metadata from the Twitter network and use the following information as additional vector features for each tweet: number of user followers, number of user friends, number of mentions, number of hashtags, number of user statuses, indicator whether tweet contains a URL, indicator whether tweet contains media, indicator whether tweet contains COVID-19 related keywords, etc. We add some auxiliary variables, such as whether the user is in the follower network, etc. Overall, 13 features are extracted from the set T of Twitter metadata.
The result is a 49-dimensional vector as the representation of tweets extracted from the multilayer framework .
3.4. Text Features
When we are faced with the problem of natural language processing, the choice of an appropriate language model that will be useful in solving the given problem certainly involves the development of a new sophisticated model or the choice of an existing language model that includes, e.g., semantic, syntactic and other linguistic features of the text. The seminal work of [
49] contributed to the emergence of numerous variants of text representation models in terms of low-dimensional vectors in continuous space embeddings, where embeddings allow semantically related linguistic units to be represented with similar vector representations. As described in [
8], the first generation was characterised by shallow language models, such as Word2Vec [
49], Doc2Vec [
50], GloVe [
51], and fastText [
52]. They have some shortcomings, such as static embeddings in which multiple concepts (i.e., different meanings of the same entity, polysemy) are not represented by different embedding vectors, or poor performance in new domains. Due to such shortcomings, the next generation of deep language models have been developed, namely ELMo [
53], GPT/GPT-2 [
54], GPT-3 [
55], and BERT [
56]. They replace static embeddings with contextualized representations and successfully solve the mentioned shortcomings. Moreover, they enable learning of context- and task-independent representations which yielded an improvement in performance on various NLP tasks [
57,
58].
To represent tweets in this study, we used the Cro-CoV-cseBERT language model from [
8]. Cro-CoV-cseBERT is based on CroSloEngualBERT [
59], a trilingual language model that was pre-trained on a large volume of texts from online news articles in Croatian, Slovenian, and English, and additionally fine-tuned on a large corpus of texts related to COVID-19 in Croatian (dataset Cro-CoV-Texts). Cro-CoV-Texts contains 186,738 news articles and 500,504 user comments related to COVID-19 published on Croatian online news portals, as well as 28,208 COVID-19 tweets in Croatian (excluding tweets from the Senti-Cro-CoV-Tweets dataset) [
8].
3.5. Classification Models
Here, we describe six ML models that we trained for binary classification of tweets in our research.
Random forest (RF) is well known for taking care of data imbalances in different classes [
60,
61], especially for large datasets [
62].
Multilayer perceptron (MLP) is another relatively simple model that can be used to perform classification [
63].
The light gradient boosting machine (LGBM) classifier is based on decision trees to increases the efficiency of the model and reduces memory usage. It is described in [
64].
The category-embedding model (CEM) is a basic model that is relatively simple with relatively simple architecture—a feed-forward network with categorical features passed through a learnable embedding layer. It is similar to MLP, but with learned embeddings for category variables.
The neural oblivious decision ensembles (NODE) for deep learning on tabular data is a model presented in ICLR 2020 [
65]. According to the authors, it has beaten well-tuned gradient-boosting models on many datasets. It uses a neural equivalent of oblivious trees (the kind of trees that catboost uses) as the basic building blocks of the architecture.
Attentive interpretable tabular learning (TabNet) is another model coming out of Google Research that uses sparse attention in multiple steps of decision making to model the output [
66].
3.6. Data Collection and Experiment Setup
To perform the experiments, data were collected from the social network Twitter. The data were collected automatically by using a pipeline for a continuous collection of tweets over a long period of time, with the data structure organized so that there are records of users and their friends, their followers, and all their posts (i.e., published tweets) for a given period of time. The data collection pipeline is organized in such a way that it first collects accounts located in Croatia, and then it collects all their friends and followers, as well as the published tweets of all the previously mentioned profiles.
The collected Twitter dataset (
Cro-Tweets2021) captures tweets posted in the Croatian language during the period between 1 January 2020 and 31 May 2021. The data were collected by using tweepy [
67], a Python library for accessing the Twitter API. After preprocessing the tweets and removing tweets without retweet, the final dataset consists of 199,431 tweets. Next, we performed cleaning and processing of tweets following the same procedure as proposed in [
68]. This includes several steps including: replacing usernames, replacing URLs, and translating emojis to ASCII code.
In the next, step we train six ML classifiers in the task of binary retweet classification: random forest, multilayer perceptron, light gradient boosting machine, category-embedding model, neural oblivious decision ensembles and attentive interpretable tabular learning model. For the purpose of training the classification models, we split the initial set of tweets, T into training, validation, and test sets with an 80:10:10 ratio. It is important to mention that we split the tweets according to the time stamps of tweets.
After training and testing all classifiers, we perform the SHAP analysis [
70] to identify the features that have the most impact on the classification.
4. Results
In this section, we present the comparison results of the performance of six trained models by using three different sets of features. These are features from the text, features from the multilayer network, and their combination. In the next step, we perform SHAP values analysis.
4.1. Evaluation Results
We trained and compared six ML models, namely RF, MLP, LGBM, CEM, NODE, and TabNet. The evaluation was performed in terms of standard machine learning classification metric such as: accuracy (), precision (P), recall (R), and -score (). Model performance was measured in a macro-averaged setting to ensure equal care for all classes.
Based on the results presented in
Table 1, several important observations can be highlighted.
The first observation suggests that classifiers regularly achieve better results on network features than on text features in terms of all considered performance measures (, P, R and ).
Another observation concerns combined features (the union of text and network features), which provide classifiers with even more fruitful ground for inducing classification models. With respect to the standard measure of accuracy (), the classifiers induced from the combined features show a meaningful improvement over those induced from the text features, ranging from 3.9 to up to 7.7%, whereas with respect to the score, this progress ranges from 3.7 to up to 8.2%. Considering the features from the network, we also find that the performance improvement, which favors combined features over network features, is at most 1.4% for and at most 1.7% for score. There are also exceptions: for the LGBM classifier, performance remains the same whether features from the network or a combination of features are used, and the exception is the RF classifier, where combined features do not improve performance. In short, the observation based on the results suggests that the features from the network complement the text features well, and in such a combined set achieve better classification performance.
Considering only the most fruitful results are obtained with a set of combined features, in terms of score, CEM is the most successful classification model with 67.9%. The lowest performance is achieved for the TabNet model with 66.6%. The MLP and NODE models perform well compared to the CEM model, as their performance is only one percentage point lower.
Based on these results, we decided to integrate the CEM model as the part of the Multi-Cro-CoV-cseBERT model for retweet prediction based on multilayer network and text features. We will further use this model for information-spreading analysis in the domain related to COVID-19 pandemic.
4.2. Feature Analysis
Shapley additive explanations (SHAP), introduced in [
70], is used to show the contribution or importance of each feature to the prediction of the model. SHAP values analysis, in the case of the RF model, was performed on a sample of 1000 examples from the test set. The absolute SHAP value indicates how much a single feature affected the prediction.
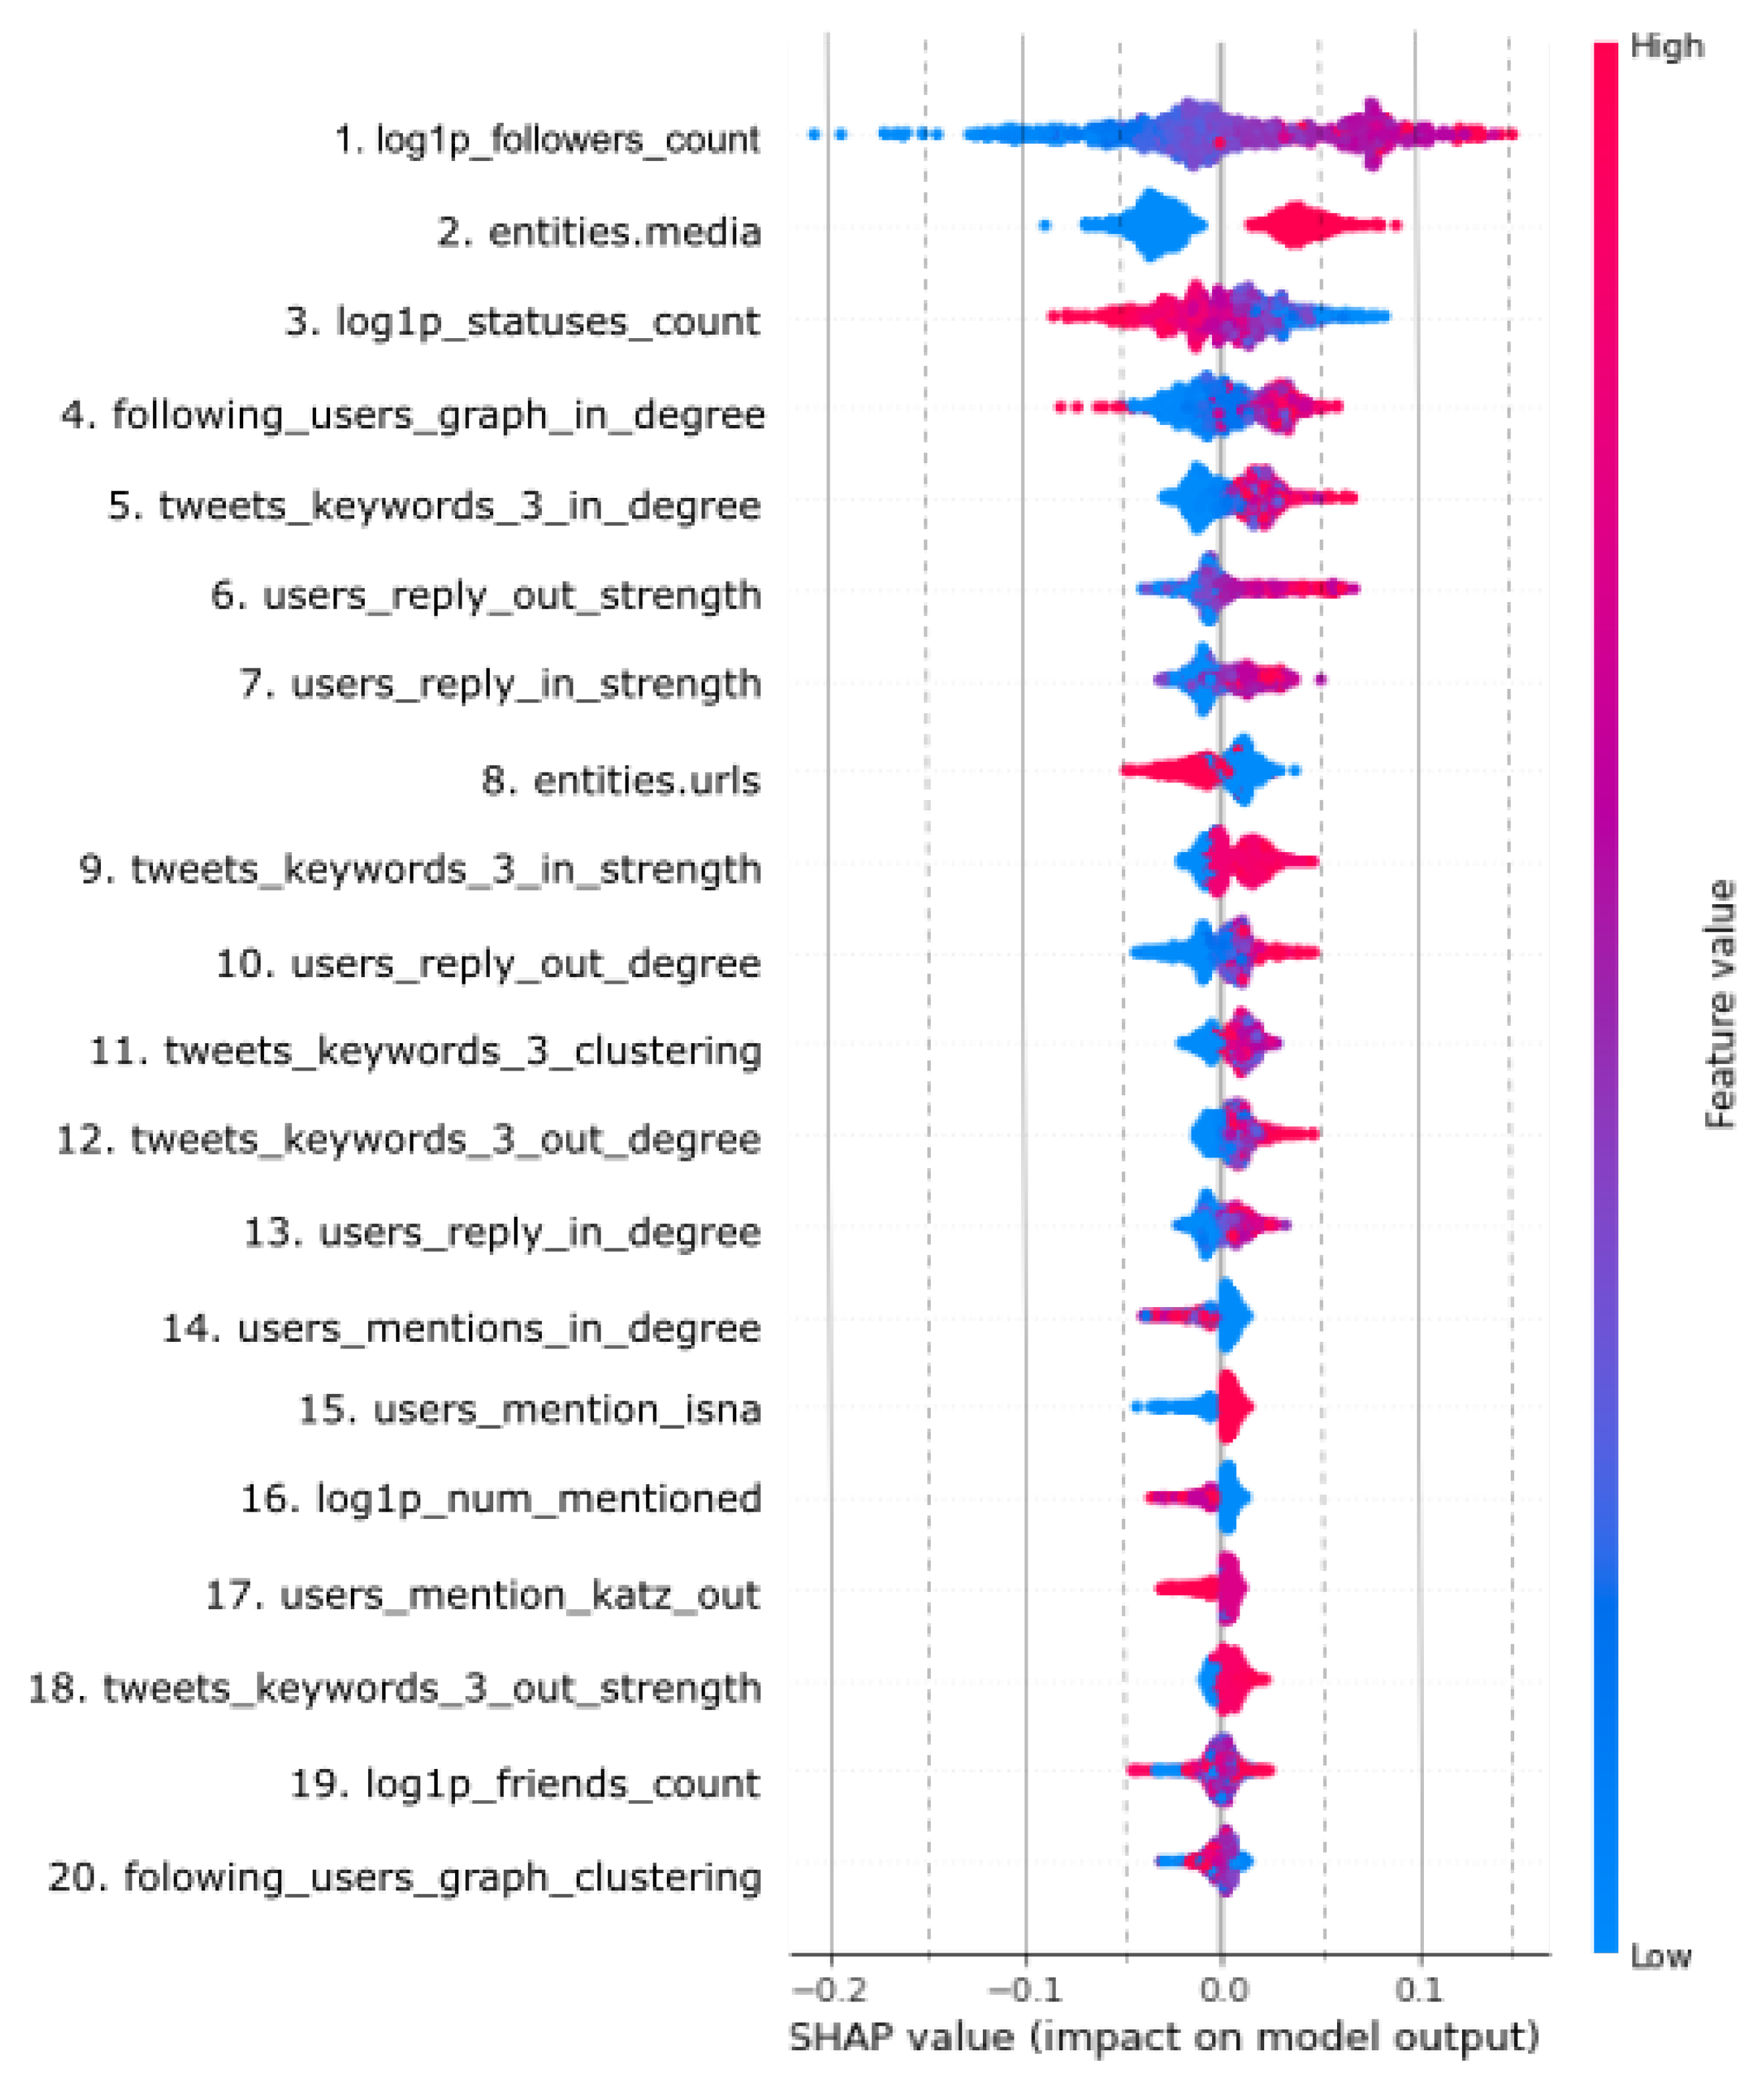
In order to understand the importance or contribution of the features for the whole dataset, the bee swarm plot is illustrated in
Figure 3. In this plot, the features are ordered by their effect on the prediction in such a way that the most important feature is listed on the top, and the rest of the list is sorted in descending order. The features’ importance is determined according to SHAP values, which are calculated with a unified framework for interpreting predictions [
70] and presented simply with the mean average value for each feature. Features are sorted by the sum of the SHAP value magnitudes across all samples. In addition, the plot also illustrates how higher and lower values of the feature affect the outcome. Small dots on the plot represent a single observation. The horizontal axis represents the SHAP value, whereas the color of the dot shows whether this observation has a higher (red) or lower value (blue) compared to other observations.
The features listed in
Figure 3 are in order of global importance, with the first feature being the most important and the last being the least important. The most important feature—
log1p_followers_count—is found to have a very high positive contribution when its values are high, and a very low negative contribution when its values are low. The same applies to the variable
entities.media, which is second in the order of feature importance. For the third most important feature (
log1p_statuses_count), high values of the variable were found to make a high negative contribution to prediction, whereas low values made a high positive contribution. Such conclusions can also be drawn from the plot for all other features. Moreover, it can be seen that some features, such as
tweets_keywords_3_out_strength, hardly (or do not) contribute to prediction, regardless of whether their values are high or low. It is interesting to note how some properties of the network are reflected in features that have a stronger impact than other features that reflect other properties of the network. The most important feature is the number of followers (
1. log1p_followers_count), and the most important feature from the group of centrality measures is follower in-degree (
4. fallowing_users_graph_in_degree). It is fair to say that the concept of followers plays an important role in the selection of contributing features. Apart from that, keywords are also a superior contributing feature, especially in the form of features resulting from centrality measures in/out-degree, in-strength and clustering coefficient (in
Figure 3 those are the features 5, 9, 11 i 12). A detail to note is that in-degree centrality of keywords has a greater impact than out-degree. In terms of layers/graph types, the replay network has spawned a larger number of features with valuable impact than the mention layer/graph. Last but not least, network metadata also make a satisfactory contribution to the retweet prediction, for example number of followers (follower count), number of changed statuses of the user (statuses count), presence of media in the tweet (entities media), or presence of URL in the tweet (entities URLs) are important features that are positioned at the top of the list.
Compared with other similar studies, our results are in line with the findings of Suh et al. [
34]. They also examined the content and contextual features in the task of retweet prediction, but to a much lesser extent than our study. In general, their findings suggest that retweetability has a very close relationship with the social network context of the authors and the informational content and value contained in tweets, similar to our results. In particular, they showed that among content features, URLs and hashtags have strong potential in the prediction of retweeting. Furthermore, among contextual features which are related to the network, the number of followers and followees as well as the age of the account affect retweetability. In our results, the number of followers also has a high correlation with retweeting. However, according to our SHAP analysis, the presence of media has a much stronger impact than the presence of URLs. Next, the in-degree measures of the follower layer and the tweet layer are ranked as high, as well as the impact of the in-strength and out-strength centrality measures of the retweet layer. This suggests that multilayer network measures have the potential for retweet prediction which has not been shown before.
5. Discussion on Retweet Prediction Based on Heterogeneous Features
In this study, several aspects related to the retweet-prediction task are investigated. The two main objectives were to explore the potential of multilayer representation of the social network for the retweet prediction and to analyse the possibilities of retweet prediction based on heterogeneous data sources.
Overall, the multilayer network features perform better than text features for all six trained models. According to that, we can confirm that multilayer network representation of Twitter has great potential for retweet prediction. These findings are in line with results of the study [
22] in which Pierri et al. have shown that multilayer network features perform better in the task of disinformation classification on Twitter. Although this study modeled Twitter differently than the
method proposed here and used different network measures, all these results indicate that multilayer approach in the task of retweet prediction is worthy of further examination.
Furthermore, according to the results presented in the previous section, we can conclude that the combination of multilayer network features with text features in general performs better than only one set of features in the task of predicting the number of retweets. We have to emphasize that the combination of features only slightly outperforms the multilayer network features. However, this is consistent for five of six models (only the RF algorithm has better performance in the case of multilayer network features). The potential of combination of features from heterogeneous data sources has been considered in several studies before [
1,
13,
14,
15,
16,
17,
34,
35], and it has been shown that the combination of features is better than one set of features. Specifically, in [
15] authors showed that models based on multidimensional features extracted from author, tweet, and user outperform models based on the standard set of features. Our approach also combines features extracted from tweet with data related to author and user, but in a different way.
To the best of our knowledge, the combination of multilayer network measures and text embedding as features for information-spreading prediction has not been examined previously. The feature analysis performed by the SHAP approach indicates that among multilayer network measures, the in-degree calculated from the follower layer and the in-degree calculated from the tweet layer have highest impact on the model. Furthermore, the impact of the in-strength and out-strength centrality measures of the retweet layer are also high. Besides that, as expected, the number of followers and some other metadata, such as the presence of media and URLs, have a positive influence on retweeting. These findings suggest that except for the standard measures, multilayer network measures may be valuable in retweet-prediction models.
Here we need to emphasize that feature engineering and the selection of appropriate feature sets is an important step in all classification tasks, although some studies have examined the potential of using deep neural networks to avoid the manual construction of features. For example, in [
12] authors proposed attention-based deep neural networks in the task of retweet prediction, and in [
71] the authors applied graph representation learning to extract the structural attributes of the ego network and predict user retweet behavior. However, it is still worth examining different possibilities in the construction sets of features, especially the combination of features from heterogeneous data sources. In this way, it is possible to detect which data sources have higher influence to information spreading, and in the next step we can include these sources as an input into a deep neural network. In this context, the next research direction of the proposed approach is to perform joint representation learning from heterogeneous data sources: multilayer network and text.
Another important aspect of this research is the comparison of the performance of six different ML algorithms in the task of retweet prediction. We identify the CEM model as the one with the best performance according to all used evaluation measures in all three feature set scenarios, whereas the overall lowest performance is achieved in the case of TabNet model. Again, it has to be emphasised that differences across all algorithms are not so significant. The only significant difference is in the performance of models that use only text features in comparison to a multilayer network set of features which seems to be significantly better for multilayer network features (as well as for combined features) for all six models. This is again an indicator that multiyear network features have great potential in the analysis of information spreading.
This research is an extension of our previous studies of online communication on social media during the COVID-19 pandemic. In [
72], we compared the retweeting of COVID-19-related tweets and tweets that are not related to COVID-19. Our findings indicate that nearly 60% of tweets related to COVID-19 belong to the high-spreadable class, whereas less than 40% of non-COVID-19 tweets belong to this high-spreadable class. This suggests that tweet content may have a high impact on retweeting (spreadability), especially during a global crisis, such as the COVID-19 pandemic. In another study [
73], we explored the potential of graph neural networks (GNNs) in the task of prediction if the user would tweet about COVID-19 or not. By using the proposed multi-Cro-CoV-cseBERT model for retweet prediction, we will further analyse the information-spreading patterns in the domain of COVID-19-related communication on Twitter.
This research has several limitations that we plan to address in future work. First, our results are not directly comparable to other studies, because we modelled the task of retweet prediction as the binary classification task into two classes: (i) class of tweets with only one retweet and (ii) class of tweets with more than one retweet. In this way, we try to predict whether the amount of retweets would be poor or not, but we did not take into account tweets that are not retweeted at all. We decided to discard all tweets with no retweets because there are too many reasons why the tweet is not retweeted and this may negatively affect the prediction. We assumed that the prediction models would perform better if we concentrated only on the dataset of retweeted tweets in this first step. In addition, we used this setup because this way we ensured balanced classes of the dataset. However, in future research we plan to include tweets with no retweet into the prediction task. Another limitation is that we used only one dataset of tweets to compare the performance of features and ML models. However, this dataset is a representative sample of tweets in the Croatian language posted during the pandemic years 2020 and 2021, and our intention was to analyse the crisis-related communication in Croatia during the COVID-19 pandemic period. That is the reason why we trained and compared ML models on this specific dataset of tweets.
6. Conclusions and Future Work
In this paper, we introduce a multilayer framework formalism for the representation of online communication on social media. We utilized this formalism for feature extraction from heterogeneous data sources: multilayer networks and text messages. We performed a detailed analysis of possible features and a combination of network and multilayer features in the task of binary classification of tweets according to the amount of retweeting.
The main focus of this research is to compare the performance of different sets of features and its combination. In addition, we evaluated six different ML classification models: random forest, multilayer perceptron, light gradient boosting machine, category-embedding model, neural oblivious decision ensembles, and attentive interpretable tabular learning model.
According to the overall results, exclusively multilayer network features performed significantly better than exclusively text-based features for all six algorithms. Overall, our results indicate that the structural features of Twitter represented as the multilayer network might be effectively exploited in the retweeting-prediction task.
The combination of both feature sets has the best performance in the case of all classification models, except the random forest. We identify that the category-embedding model has the best performance according to the F1 score, which is 0.679. However, this result is only slightly better than results of other algorithms, and we can conclude that all six algorithms have similar performance in the task of retweet classification. Additionally, we explored the impact of different features by using SHAP analysis and determine that the number of followers in the network, the presence of media, the number of changed user statuses, the in-degree on the follower network layer, and the in-degree on the Twitter network layer features have major impacts on the model. Thus, we believe that our multilayer network-based approach provides useful insights into the future development of a system for predicting information spreading on social media.
The proposed approach can be further extended in the several directions, and we have several of plans for future work. First, we plan to test more multilayer network measures as predictors and also to explore the potential of deep learning automatic feature extraction from the multilayer network in the task of retweet prediction. Secondly, we plan to extend the multilayer framework model with the dynamic aspect (in the sense that we capture the dynamics of users’ actions) and to use three sets of features for prediction of retweeting and information spreading on social media in general. Thirdly, we plan to utilize graph neural networks for link prediction.


