Abstract
Due to the high demand for compression recovery tests of metal gaskets, it is difficult to provide and evaluate uniform stress on metal gaskets. To effectively evaluate the uniformity of surface stress on a metal gasket, we propose a method of evaluating gasket surface stress based on gray-level co-occurrence matrix theory. Angular second moment and entropy are selected as the main characteristic parameters, and the evaluation indexes ( and ) are proposed. The analysis is based on finite element calculation under different parameters of a gasket test rig. The angular second moment and entropy curve of the stress distribution cloud map are drawn according to the result of finite element calculation. The results show that the method can evaluate the uniformity of stress distribution. The best parameters of the gasket testing rig are obtained by analyzing the uniformity evaluation index. The method can realize rapid comparison and accurate evaluation of the gasket surface stress.
1. Introduction
A compressibility and recovery test is a method for measuring the behavior of gasket materials under a short compressive loading time at room temperature. During the compression recovery test, the uneven load applied on the gasket will cause the gasket material to deform too quickly and lead to material failure [1]. At present, some scholars have applied finite element analysis on gaskets and obtained the relationship between gasket stress, bolt section stress, and flange deflection angle; that is, the larger the flange deflection angle is, the more uneven the gasket stress is, and the more likely seal failure occurs in the bolted flange joints [2]. Attoui et.al analyzed the inner ring warpage of wound gaskets through a combination of experiments and simulation studies and considered that the warpage of the inner ring is caused by the uneven radial contact stress on the surface of the gasket caused by the pre-tightening force of the bolts during the installation of the gasket, which causes stress concentration in a small range of the inner ring of the gasket, which in turn causes the inner ring metal winding layer to be warped inward [3]. Chen Ran studied the compression recovery elastic properties of graphite-wound gaskets at different temperatures (room temperature to 573 K) and different gasket stresses (40 MPa to 100 MPa) through experiments. Based on the results, they proposed that the recovery decreases with the increase in the gasket stress at a lower temperature (normal temperature and 373 K), and the greater the stress, the more obvious the decrease. Under higher temperatures (473 K and 573 K), the gasket recovery did not change much with increasing stress [4]. Therefore, research on the performance of the gasket under the condition of relatively uniform load is conducive to prolonging the effective time of the gasket in the test, so as to find a method to prolong the service period of the gasket.
Over the years, a few methods have been established to evaluate the uniformity of stress distribution. Scholars in China and worldwide have evaluated the uniformity of stress distribution through visual comparison [5], parameter evaluation [6], and digital image evaluation. Visual comparison can only judge stress changes in the cloud map that are obvious and can be directly identified by the naked eye. Parameter evaluation is used to quantitatively evaluate the distribution uniformity in the stress distribution cloud map by taking samples in a direction and distance on the surface, then calculating the average value and standard deviation. Parameter evaluation is applicable to situations where the variation range of stress is small. The digital image method uses digital image processing technology to analyze the characteristics of the cloud map and extract the image characteristic information, so as to evaluate the stress distribution. The gray-level co-occurrence matrix is a kind of digital image method. By extracting image texture features, the texture distribution is measured by the value of the image’s characteristic parameters. This method has high accuracy, more information, and requires less calculation time [7]. In this work, the gray-level co-occurrence matrix method was selected to extract the characteristic parameters of the cloud map based on finite element calculation to evaluate the stress distribution. The analysis was conducted on various compression conditions and test rig parameters. The computational model of the gasket test rig was established to apply pressure on a gasket. By extracting characteristic parameters, the cloud map of surface stress was evaluated based on different test conditions from three aspects, namely the inner radius of the test rig’s compression rod, the compression condition, and the height of the compression plate. Finally, optimization guidance for the gasket test rig is provided.
2. Evaluation of Gasket Contact Stress Distribution
2.1. Gray-Level Co-Occurrence Matrix Theory
The gray-level co-occurrence matrix analyzes the relationship between two pixels at a certain distance in the image matrix. In the whole image, the frequency of occurrence of each group of gray-level pairs is counted as . The gray-level co-occurrence matrix is essentially a joint histogram of two pixel points. If the interval distance values are combined with different values, the gray-level co-occurrence matrix of the image in a certain direction and at a certain distance d can be obtained [8].
The mathematical expression of the gray-level co-occurrence matrix is
2.2. Evaluation Characteristic Parameters
The gray-level co-occurrence matrix has many characteristic parameters. Haralick et al. defined 14 gray-level co-occurrence matrix parameters for texture analysis [9], of which entropy is a parameter representing the texture thickness, complexity, and the amount of information contained in the image, and angular second moment is a parameter representing the uniformity of gray pixel distribution.
The expression of entropy is
If there is no texture in the image, the gray-level co-occurrence matrix is basically zero, and its entropy is close to zero. If the image is full of fine textures, the values of are approximately equal, and the entropy of the image is larger.
The expression of angular second moment is
Angular second moment is a parameter representing the uniformity of gray distribution. The thicker the texture, the greater its value, and the more uniform the stress distribution. The thinner the texture, the smaller its value, and the less uniform the stress distribution.
2.3. Implementation Based on Python
The gray-level co-occurrence matrix method in this paper is realized by Python. Based on the finite element calculation, the grayscale cloud map of stress distribution is obtained through post-processing. The image processed by the gray-level co-occurrence matrix method is usually square; however, the stress distribution cloud map of the gasket is circular, which is not conducive to the calculation and extraction, so it is necessary to extract the circular part of the image as , where the inner radius is and the outer radius is . Take the center position O as the origin to establish a rectangular coordinate system and perform polar coordinate transformation [10]. Then, expand along the radial direction. Take O as the origin of the polar coordinate axis. By converting the rectangular coordinate system to the polar coordinate system, the coordinates of each point in the cloud map can be converted to the coordinates under the polar coordinate system [11]. Since the inner radius of the circle is smaller than the outer diameter, the expanded image is not a standard rectangle, so it is necessary to apply the nearest neighbor interpolation algorithm [12] and use the data interval N between the pixel points and . Apply linear fitting on the blank pixel that appears after the shorter edge is extended, and the pixel value obtained is the value of the blank pixel . The transformation process is shown in Figure 1.
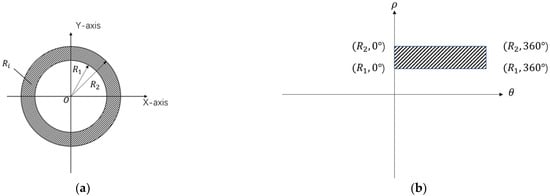
Figure 1.
(a) Image in rectangular coordinate system. (b) Image in polar coordinate system.
The circular image is expanded and interpolated to a rectangular image with a length of L and a width of D, where L is the circumference of the outer ring and D is the width of the ring, that is, the difference between the radius of the outer ring and the radius of the inner ring. The part of the image whose length and width are all D is taken as the analysis target T and saved in bmp format, and the gray-level co-occurrence matrix algorithm is imported to obtain the characteristic parameters. The program steps are as follows:
- (1)
- The 256 gray levels of the original image are compressed into 128 gray levels.
- (2)
- Take , , and calculate four gray-level co-occurrence matrices.
- (3)
- Normalize the co-occurrence matrix.
- (4)
- According to Equations (1) and (2), the entropy and angular second moment of the gray-level co-occurrence matrix are calculated.
- (5)
- Average the characteristic parameters of 0°, 45°, 90°, and 135° to obtain the final two-dimensional texture feature.
3. Test and Analysis of Test Results
3.1. Experimental Design
The gasket test rig selected was designed by Hefei General Machinery Research Institute Co., Ltd. The type of gasket is a basic metal gasket, and the size is shown in Figure 2.
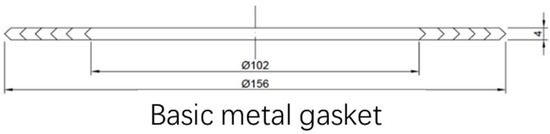
Figure 2.
Geometrical dimensions of the gasket.
The upper half of the gasket test rig is taken as the modeling object, and the model is established by taking half of the structure in the vertical direction. The top layer is a water cooling plate, and the second layer is a compression rod and a heating plate. Since the heating structure does not participate in stress transmission, only a compression rod model is established, and the third layer is a compression plate. The substructure of the gasket test rig is divided into grids by an automatic method, as shown in Figure 3.
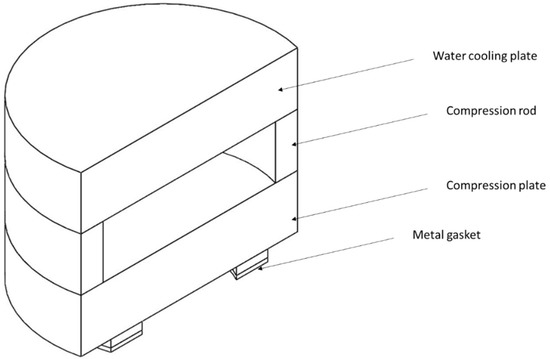
Figure 3.
Calculation model of the gasket test rig.
Boundary conditions. Set the boundary conditions of the gasket test rig according to the actual experience of the project: the upper face of the water cooling plate is free, the gasket symmetry plane is set with fixed constraints, and friction contacts are set between the water cooling plate and the compression rod, the compression rod and the compression plate, and the compression plate and the gasket.
Load conditions. Apply a 10 MPa pressure load with an area of A on the top surface of the water cooling plate to simulate the bolt preload, of which the applied area A is adjusted according to the compression condition.
The study focuses on the surface stress distribution of the gasket during compression. Therefore, according to the contact relationship between the compression plate and the gasket, the contact relationships and friction coefficients between components in this simulation are set in Table 1 [13].

Table 1.
Contact relationships of the gasket test rig during compression.
To ensure the accuracy and objectivity of the test data, we repeated 10 groups of tests for the targets obtained by polar coordinate transformation and image segmentation in each stress cloud map [14]. Through image acquisition and texture feature extraction, 10 groups of different angular second moments and entropy values are obtained. In data processing, the maximum and minimum values of 10 groups of data are removed and the average value is taken as the value of each group of variables.
In the process of generation and conversion of the cloud map, due to different test conditions in each group, the maximum and minimum stress values in the results are different, which will cause the same gray pixels in each group of the cloud map to represent different stress values, so it is hard to compare between groups. Therefore, before outputting the cloud map, it is necessary to fix the representation interval of the legend as [10 MPa, 80 MPa] and carry out gray compression and size adjustment on the cloud map, so as to unify the measurement standard of pixels and provide more reliable and accurate angular second moment and entropy.
3.2. Material Parameters
The water cooling plate of the gasket test rig is made of 316 L stainless steel. The compression rod and compression plate are made of K465 superalloy with a density of 8341 kg/m3. The elastic modulus is 151 GPa [15]. The metal gasket is composed of 304 stainless steel, with an elastic modulus of 189 GPa and a Poisson’s ratio of 0.3. Since only the stress distribution of the metal wound gasket is analyzed, the deformation of the compression plate is not considered, so the compression plate is set as a rigid surface to simplify the calculation.
3.3. Evaluation of Stress Distribution in Different Inner Radii of Compression Rods
In the gasket test rig, the compression rod transfers the pressure from the top surface of the water cooling plate to the surface of the compression plate. Since there are also heating plates and insulation layers on the inner side the compression rod, the inner radius of the compression rods ranges from 75 mm to 95 mm.
Before the test, we set other parameters for the model; that is, the height of the compression plate was 50 mm. For the calculation model corresponding to each group of compression rods, we set the inner radius to 85, 90, 95, 100, and 105 mm, and conducted finite element calculations.
The cloud map presented in rainbow colors more clearly reveals the basic distribution of stress without other tools. We take the cloud map of the group with , as an example. As can be seen from Figure 4, the stress on the surface increased from the inner side of the gasket to the outer side. The variation hardly occurs along the circumference direction but mainly in the radial direction. There is no sudden variation along the radial direction, and the difference value between two color areas is within 4 MPa, which presents relatively uniform variation.
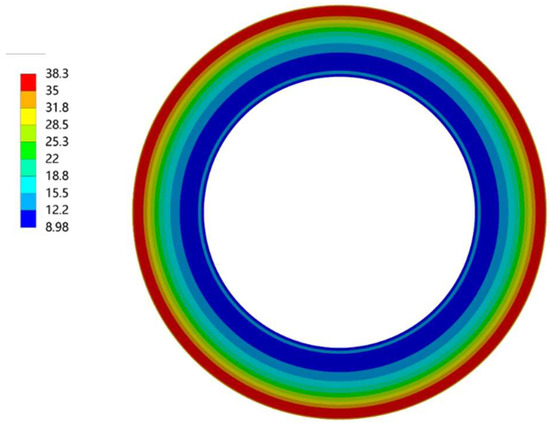
Figure 4.
Cloud map (, ) in rainbow colors.
To compare the angular second moment and entropy of different groups, an artificially created uneven situation was simulated and is shown in Figure 5b. The stress is concentrated in the middle ring area of the gasket, which represents the deflection angle of the flange after a long test time. The comparison of the characteristic parameters of two groups is shown in Figure 6.
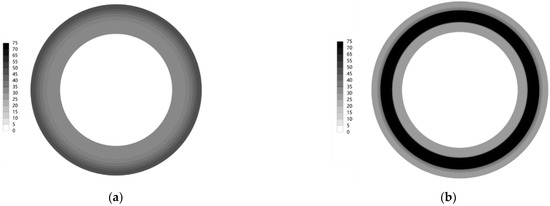
Figure 5.
(a) Relatively uniform cloud map (group 1). (b) Non-uniform cloud map (group 2).
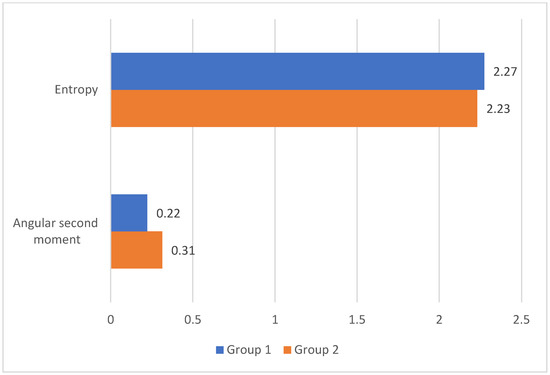
Figure 6.
Histogram of entropy and angular second moment of group 1 and group 2.
The angular second moment of group 1 is sharply lower than that of group 2, which reflects that the variation between adjacent pixels is small in Figure 5a but large in Figure 5b. In Figure 5b, the gray pixels are not uniformly distributed along the radial direction. However, there are some dominant gray-tone transitions near the boundary of the stress concentration area, resulting in a larger angular second moment and a smaller entropy.
In Figure 5b, the stress concentration area presents a relatively uniform distribution, which results in a smaller entropy.
Though the uniformity of Figure 5a is much better than that of Figure 5b, the difference between two values of entropy is not large.
We placed the stress distribution cloud map in order according to the test number, as shown in Figure 7.
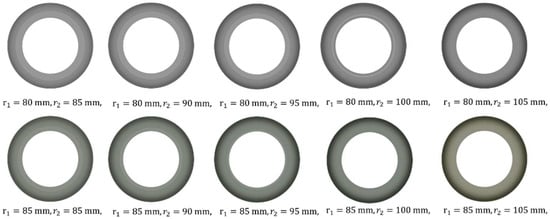
Figure 7.
Cloud map of finite element calculation.
We collected the stress distribution cloud map, converted the circular image into a rectangular image, and then segmented the rectangular image, as shown in Figure 8.
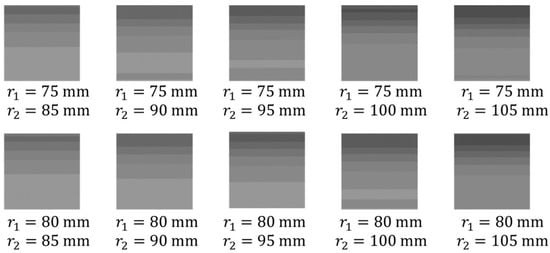
Figure 8.
Cloud map of triangular finite element calculation.
Then, the characteristic parameters of the image were obtained. The angular second moment and entropy curves of the test results corresponding to the inner radius of each compression rod under different compression conditions are shown in Figure 9 and Figure 10.
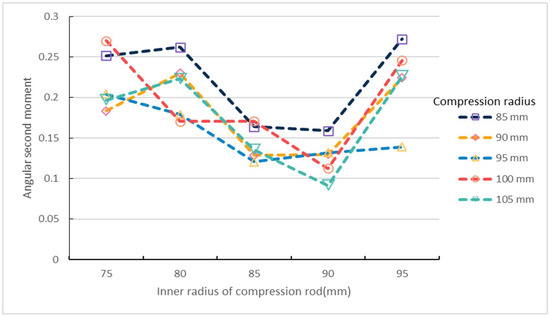
Figure 9.
Angular second moment curve of different compression rod inner radius.
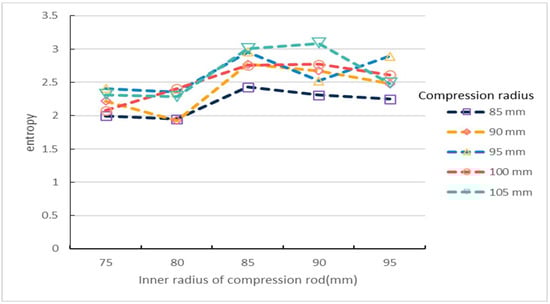
Figure 10.
Entropy curve of different compression rod inner radius.
The angular second moment curve of = 85 mm is above the whole curve. The groups of = 100 mm, = 75 mm and 85 mm are larger than the group of = 85 mm, and the other four groups of compression conditions are smaller than the group of = 85 mm. Under the five compression conditions, the entropy with a compression radius of 105 mm is basically at the top of all curves, reaching the maximum value of 3.085 when the inner radius of the compression rod is 90 mm, followed by the inner radius of 85 mm, which is slightly smaller than the entropy when the inner radius of the compression rod is 90 mm. The entropy curves of = 85 mm and 90 mm are below other curves.
According to the evaluation standard, the smaller the angular second moment is, the greater the entropy value is, and the better the uniformity of stress distribution is. The following test conclusions are drawn: the compression rod with an inner radius of 90 mm has the best effect on the uniformity of contact stress distribution on the gasket surface, while the compression rod with an inner radius of 75 mm has the worst effect on the uniformity of contact stress distribution on the gasket surface.
3.4. Evaluation of Distribution of Different Compression Plate Heights
During the test, the compression plate disperses the load transmitted by the compression rod to the gasket surface. Too low a compression plate height cannot maintain the strength in the test. Too great a compression plate height is not conducive to load transmission and may surpass the maximum stroke of the gasket test rig. Therefore, finite element calculation tests were conducted for compression plate heights between 40 mm and 60 mm. The angular second moment and entropy value curves of the corresponding test results under each compression plate height obtained from the tests are shown in Figure 11 and Figure 12.
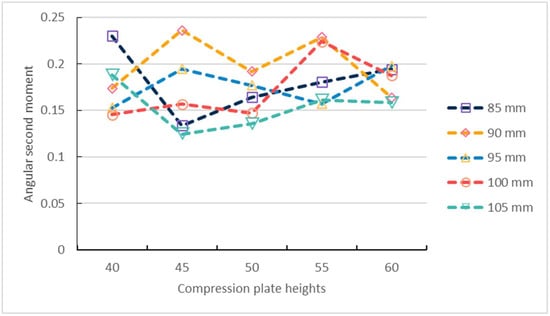
Figure 11.
Angular second moment curve of different compression rod heights.
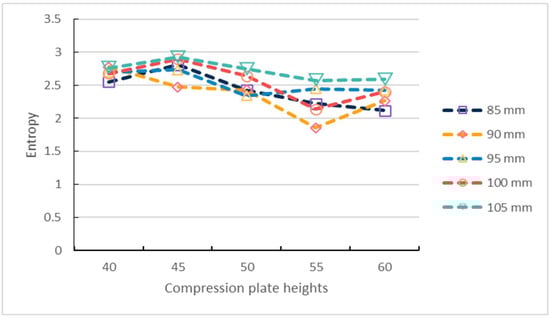
Figure 12.
Entropy curve of different compression rod heights.
In Figure 11, there are four groups with angular second moments between 0.2 and 0.25, in which the compression plate heights of the two groups are 45 mm and 55 mm. Therefore, excessive pressure plate height and too low compression plate height are not conducive to stress dispersion. When the compression plate height is 50 mm, the angular second moment under the five compression conditions is less than 0.2, and the overall uniformity is acceptable.
According to Figure 12, the comparison shows that except for the compression radius with 90 mm, the entropy of other compression conditions shows a trend of first increasing and then decreasing. The entropy of the group of 105 mm compression radius is larger than that of the other four compression radius, and reaches the maximum value when the compression plate height is 45 mm. The uniformity of the five groups is 45 mm > 50 mm > 40 mm > 55 mm > 60 mm.
The optimal test parameters of the gasket test rig in this paper are a compression radius of 105 mm, a compression plate height of 45 mm, and an inner radius of the compression rod of 90 mm.
4. Conclusions
In this paper, the digital image processing method is used to analyze and preprocess the stress distribution cloud map obtained by the finite element calculation. Based on the theory of gray-level co-occurrence matrix, a method is proposed to identify the uniformity of stress distribution by using the angular second moment and entropy of the gray-level co-occurrence matrix. Python is used to realize the calculation of the gray-level co-occurrence matrix and the extraction of characteristic parameters. To evaluate the surface distribution uniformity of the metal gasket, a fast and accurate method is obtained.
The stress distribution uniformity was analyzed with different inner radii of the compression rod, compression conditions, and different compression plate heights. The results show that increasing the compression radius can make the stress distribution more uniform, and can effectively reduce the difference between the stress areas. When the inner radius of the compression rod is between 85 and 90 mm, the stress distribution uniformity is better, and an internal diameter of the compression rod of 90 mm is optimal for the gasket test rig. The compression plate has a suitable dispersion effect in the process of transferring stress. When the compression plate height is 45 mm, it can more effectively promote the uniformity of the surface stress.
The methodology still has the following limitations. First, the methodology is not suitable for groups when the difference between the maximum and minimum stress values of each figure is too large. Too large differences will account for a greater stress value corresponding to the grayscale value, and the sensitivity of the methodology will decrease. If the calibration conditions change, the results from different conditions cannot be compared. Secondly, the methodology needs to calibrate the grayscale range of the cloud map and keep the image size the same before each test. Thirdly, the higher gray levels will increase the accuracy of the methodology but also increase the calculation time. The methodology can combine the traditional GLCM algorithm with the LBP algorithm to reduce the calculations without reducing the loss of grayscale information and ensuring the validity of features. It can effectively improve the calculation efficiency.
Due to the large amount of calculation in the finite element calculation and the long time spent on a single test, no more tests were carried out within the existing parameter range to observe the change law of angular second moment and entropy values. In subsequent research, the interpolation model will be introduced to reduce the experimental time of different test objects in the same test group.
Author Contributions
Formal analysis, L.W.; Project administration, J.C.; Writing—original draft, Z.Z.; Writing—review & editing, Q.W. All authors have read and agreed to the published version of the manuscript.
Funding
National Key Research and Development Program of China: 2020YFB2008002. Zhejiang Special Support Program for High-Level Personnel Recruitment of China: 2019R52017.
Institutional Review Board Statement
Not applicable.
Informed Consent Statement
Not applicable.
Data Availability Statement
Not applicable.
Conflicts of Interest
The authors declare no conflict of interest.
References
- Dong, X.; Zhou, F.; Jiang, W.; Xie, Y.; Zhang, Y.; Xie, X.; Zhai, X.; Lu, C.; Li, G.; Jiang, X. Failure Analysis of the Conical Gaskets in Ultra-High Pressure Pipeline Sealing Devices: Experiment and Numerical Simulation. Eng. Fail. Anal. 2022, 133, 105946. [Google Scholar] [CrossRef]
- Chen, Y.; Guan, K.S.; Kai, M.A.; Zhang, L.Z.; Yan-Yan, X.U. Gasket Stress Analysis of Bolted Flanged Joints Based on Metal to Metal Contact. Press. Vessel Technol. 2015, 32, 36–41. [Google Scholar] [CrossRef]
- Attoui, H.; Bouzid, A.-H.; Waterland, J.A. On the Buckling of Spiral Wound Gaskets. J. Press. Vessel Technol. 2016, 138, 041205. [Google Scholar] [CrossRef]
- Chen, R.; Zhang, L.; Han, W.; Fu, X. Research on the Sealing Performance of Flexible Graphite Spiral Wound Gasket. In Proceedings of the Advanced Technology of Pressure Vessels—Proceedings of the 10th National Pressure Vessel Academic Conference (Part 1), Hangzhou, China, 26–29 September 2021; The Chinese Mechanical Engineering Society Pressure Vessel Institution: Hangzhou, China, 2021; pp. 620–628. [Google Scholar]
- Chen, Y.; Yanyan, X.U.; Guan, K.; Zhang, L. Sealing Performance of Metal to Metal Contact Bolted Flanged Joints under Insulation. Lubr. Eng. 2016, 41, 48–53+59. [Google Scholar] [CrossRef]
- Guo, J.; Fu, H.; Pan, B.; Kang, R. Recent Progress of Residual Stress Measurement Methods: A Review. Chin. J. Aeronaut. 2021, 34, 54–78. [Google Scholar] [CrossRef]
- Haralick, R.M.; Shanmugam, K.; Dinstein, I. Textural Features for Image Classification. IEEE Trans. Syst. Man Cybern. 1973, SMC-3, 610–621. [Google Scholar] [CrossRef]
- Mohammed, K.M.C.; Prasad, G. Defective Texture Classification Using Optimized Neural Network Structure. Pattern Recognit. Lett. 2020, 135, 228–236. [Google Scholar] [CrossRef]
- Guo, L.; Wang, W.; Zhong, L.; Guo, L.; Zhang, F.; Guo, Y. Texture Analysis of the Microstructure of Internal Curing Concrete Based on Image Recognition Technology. Case Stud. Constr. Mater. 2022, 17, e01360. [Google Scholar] [CrossRef]
- Dai, J.; Yang, T.; Xiong, W. Chinese Seal Text Recognition Based on Polar Coordinate Conversion. Comput. Eng. Des. 2021, 42, 3174–3180. [Google Scholar] [CrossRef]
- Gindis, E.J.; Kaebisch, R.C. Chapter 8—Polar, Rectangular, and Path Arrays. In Up and Running with AutoCAD® 2021; Gindis, E.J., Kaebisch, R.C., Eds.; Academic Press: Cambridge, MA, USA, 2021; pp. 211–232. ISBN 978-0-12-823117-3. [Google Scholar]
- Bai, X.; Chen, Y.; Duan, G.; Feng, C.; Zhang, W. A Data Hiding Scheme Based on the Difference of Image Interpolation Algorithms. J. Inf. Secur. Appl. 2022, 65, 103068. [Google Scholar] [CrossRef]
- Liang, R.; Chen, F.; Guo, Y.; Jiang, F.; Zhou, W.; Yu, R.; Yang, X. Comparative Study on EN Method and Waters Method for Determining Flange Bolt Pre-tightening Force. Lubr. Eng. 2021, 46, 137–144. [Google Scholar]
- Cao, Y.; Wu, C.; Zheng, T.; Xiao, W.; Zheng, N. PVA Fiber Dispersion Evaluation Method Based on Grey Co-Occurrence Matrix Theory. Harbin Gongye Daxue Xuebao/J. Harbin Inst. Technol. 2019, 51, 157–161. [Google Scholar] [CrossRef]
- Wang, S.; Wang, Z.; Gao, M.; Chai, H.; Cao, X.; Sang, Z. Effect of homogenizing temperature on microstructure and mechanical properties of K465 superalloy. Heat Treat. Met. 2022, 47, 167–171. [Google Scholar] [CrossRef]
Publisher’s Note: MDPI stays neutral with regard to jurisdictional claims in published maps and institutional affiliations. |
© 2022 by the authors. Licensee MDPI, Basel, Switzerland. This article is an open access article distributed under the terms and conditions of the Creative Commons Attribution (CC BY) license (https://creativecommons.org/licenses/by/4.0/).