Abstract
Relation classification is an important fundamental task in information extraction, and convolutional neural networks have been commonly applied to relation classification with good results. In recent years, due to the proposed pre-training model BERT, the use of which as a feature extraction architecture has become more and more popular, convolutional neural networks have gradually withdrawn from the stage of NLP, and the relation classification/extraction model based on pre-training BERT has achieved state-of-the-art results. However, none of these methods consider how to accurately capture the semantic features of the relationships between entities to reduce the number of noisy words in a sentence that are not helpful for relation classification. Moreover, these methods do not have a systematic prediction structure to fully utilize the extracted features for the relational classification task. To address these problems, a SpanBert-based relation classification model is proposed in this paper. Compared with existing Bert-based architectures, the model is able to understand the semantic information of the relationships between entities more accurately, and it can fully utilize the extracted features to represent the degree of dependency of a pair of entities with each type of relationship. In this paper, we design a feature fusion method called “SRS” (Strengthen Relational Semantics) and an attention-based prediction structure. Compared with existing methods, the feature fusion method proposed in this paper can reduce the noise interference of irrelevant words when extracting relational semantics, and the prediction structure proposed in this paper can make full use of semantic features for relational classification. We achieved advanced results on the SemEval-2010 Task 8 and the KBP37 relational dataset.
1. Introduction
Relation classification is an important part of information extraction and is a supervised relation extraction [1]. Its target task is to predict the relation between two entities from the text with well-labeled entities. Relation classification is an important step in constructing structured data. It is also an important basis for many tasks, such as text classification [2], sentiment analysis [3], question answering, etc.
Deep-neural-network-based methods have been widely used in relation classification. However, existing deep learning methods usually use the feature vector of whole sentences as semantic information for relation classification. This usually contains a lot of information that is not useful for relation classification, resulting in a model that does not accurately focus on the semantics of the relationships between entities. In addition, relation classification models usually use the Linear() function to map the final relational category probability distribution, and when a vector with a large dimension is mapped to a vector with only a dozen category dimensions, the semantic information that is helpful for relation classification is likely to be lost.
In the early days, methods such as word2vec [4], GloVe [5], and ELMo [6] were used to generate word vectors, which were then used to extract deep semantics through neural networks. Ref. [7] used convolutional neural networks to extract lexical-level features and sentence-level features and map them into high-level features for relation classification. Ref. [8] applied recurrent neural networks to relation classification. Recurrent neural networks accumulate the semantics of sentences word by word, whereas convolutional neural networks must learn two local patterns and merge them. Obviously, the recurrent neural network model is more reasonable. Further, the semantic distribution formed by recurrent neural networks is smoother than that of convolutional neural networks. Although recurrent neural networks have excellent performance in extracting local features, they are somewhat weak in processing sequential data. Ref. [9] used a Bidirectional Long Short-Term Memory network, which aims to address the fact that Bidirectional Recurrent Neural networks do not extract information with long-term dependencies well. Recently, pre-trained language models have had a significant impact in the field of natural language processing. Ref. [10] used a pre-trained Bert model as a feature extractor and obtained quite good results by stitching the extracted features together and feeding them into the classifier. Ref. [11] outlined an innovative approach to perform textual information extraction by using domain ontologies and language rules, which is experimentally proven to be a feasible approach.
Most of the above methods connect lexical-level features and sentence-level features to form the final feature vector for classification. However, sentence-level features cannot accurately represent the relation between two entities, and inevitably carry interference information. This will affect the final relation classification results. Moreover, existing methods put entity features and sentence features through simple splicing and then feed the features into Linear() function to obtain prediction results. Such a straightforward approach not only fails to make full use of feature information but also loses some semantic information.
In order to solve the above problems, we start from the perspective of “How can we accurately focus on the connection between two entities?”. We started to think and study deeply from this perspective. The existing approach is to remove the meaningless edge information and keep the meaningful core information by sentence compression. However, this will increase the computation and make the model become complicated [12]. We find that the description of entity relations in a sentence exists between two entities in most cases. The words outside of this are meaningless information for the relation classification. Therefore, we truncate the sentence span between the two entities and merge the semantics of this span with the semantics of the whole sentence. The feature vector of “Strengthen Relational Semantics” is obtained. Using this feature vector, it is possible to greatly improve the model’s understanding of what kind of relationship should exist between a pair of entities, thus enabling the model to focus on the semantics of the relationship between entities. To be able to make full use of the semantic features extracted by the model, a completely new prediction structure was designed for relation classification. The various feature vectors extracted by the model are fed into this structure, and the final prediction results are obtained after Multi-Class Attention. In this way, we are able to capture not only the overall semantic information of the whole sentence but also focus on the relational information between entities. Various semantic features are fully utilized to enable the model to better handle the relational classification task. Therefore, to address the problems in existing methods, we propose a method called capturing relational span and using attention for relation classification.
The innovations in this paper are as follows:
1. A feature fusion method called “SRS (Strengthen Relation Semantics)” is proposed. We fuse the global information of the whole sentence and the relational information between entities to form the vector for strengthening relational semantics, which is used to solve the problem that existing methods cannot effectively focus on the relational semantics between entities.
2. A new attention-based prediction structure is designed. In our known work, we are the first to use full attention instead of fully connected layers to predict the probability distribution of each category for multiple classifications. With this prediction structure, we can make full use of various feature information and reduce the loss of semantic information.
2. Related Work
Traditionally, the two main approaches to relation extraction are supervised and semi-supervised. Supervised relation extraction, also known as relation classification, is the most effective and well-researched method that uses fully labeled manual data for training. The supervised relation extraction task does not have a subtask of entity recognition; so, the main structure of the model is a feature extractor + relational classifier. Remote supervision is a form of semi-supervision and is currently a solution to the lack of supervision data. However, there are several problems with remotely supervised data: Firstly, remote supervision of labeled data has a large number of errors. Secondly, it cannot solve the situation where a pair of entities contains multiple relations. Thirdly, the False-negative problem, where instances labeled as negative samples actually have relations, but such knowledge does not exist in the knowledge graph, leading to labeling errors. Most of the current research on remote supervision focuses on the first problem. The research in this paper focuses on supervised relation classification, and the main feature extraction networks for relation classification are the convolutional neural network, recurrent neural network, and attention-based mechanism of transformer [13,14], and Bert et al. [15].
Convolutional neural networks: Ref. [16] applied convolutional neural networks to achieve relation classification and proposed a convolutional DNN algorithm for extracting lexical-level features and sentence-level features. Positional features are also proposed to encode the relative distance between the current word and the target word pair. The model architecture proposed by [17] is basically the same as the previous work; the biggest change is the replacement of the loss function. The innovation lies in the Ranking loss, which enables the model to consider not only the positive category score as high as possible but also the category score that is prone to misclassification as low as possible compared with the Softmax function. The disadvantage is still the defect of the model structure. Ref. [18] proposed a new structure, the Augmented Dependency Path, which combines the shortest dependency path between two entities and a subtree connected to the shortest dependency path. By modeling the subtree using a recurrent neural network, a representation of the generated dependency subtree is appended to the words on the shortest dependency path so that the words on the shortest dependency path receive new word embeddings, and then a convolutional neural network is used to capture the key features on the shortest dependency path. The above methods all use convolutional neural networks as feature extraction frameworks, and all use the Linear() function to map the probability distribution of relational categories. Although convolutional neural networks are widely used in computer vision because of their excellent local information extraction ability, global-dependent information is very important in the field of NLP, especially in the field of relation classification. Convolutional neural networks have been phased out because of their shortcomings in extracting global information. Table 1 shows a summary of our model and the convolutional-neural-network-based models.

Table 1.
Summary of our model and the convolutional-neural-network-based models.
Recurrent neural networks: Ref. [19] proposed an RNN-based framework to model long-range relational patterns, and experiments demonstrated the capability of the RNN-based approach in remote pattern modeling. Ref. [20] proposed a deep-learning relation classification model based on the shortest dependency path. They not only used a Bidirectional RCNN but also considered the problem of the directionality of relationships between entities. Ref. [9] proposed the use of a Bidirectional Long Short-Term Memory network (BLSTM) to model sentences containing complete, sequential information about all words, achieving state-of-the-art performance at the time. Ref. [21] added the attention mechanism to Bi-LSTM and proposed the AttBLSTM model to capture the most important semantic information in sentences. Ref. [22] designed an attention-based BLSTM layer for converting semantic information into high-level features, and also proposed a new filtering mechanism to reduce noise. All of the above methods use recurrent neural networks or their variants of long and short-term memory networks as feature extraction frameworks, and all use the Linear() function to map the probability distribution of relational categories. Although recurrent neural networks are better able to process sequential data and extract global information compared with convolutional neural networks, they still have the disadvantages of being unsuitable for long sequences and prone to the problem of gradient disappearance. Table 2 shows a summary of our model and the recurrent-neural-network-based models.
Table 2.
Summary of our model and the recurrent-neural-network-based models.
Attention mechanism: Ref. [23] added the attention mechanism to CNNs. Two levels of attention mechanism are employed; the first one is applied to attention between individual word pairs in the input sequence, and the second one is applied to attention on the blending layer for the target category. Ref. [24] proposed a Bert-based model to perform relation extraction without combining lexical and syntactic features, achieving SOTA performance and providing a baseline for follow-up. Ref. [25] proposed a transformer-based relation extraction method TRE, which replaces the explicit linguistic features required by previous methods with implicit features captured in a pre-trained linguistic representation. Ref. [26] added an additional MTB (Matching The Blanks) task to the pre-training process of BERT to improve the performance of relation extraction during the pre-training phase. Ref. [27] introduced a dependency-based attention mechanism in the BERT architecture to learn high-level syntactic features. The dependency relation between each word and the target entity is considered, while different levels of semantic information are obtained by using the BERT middle layer to fuse multi-grain features for the final relation classification. Ref. [28] used a fine-tuned BERT model to extract the semantic representation of sequences and then used segmental convolution to obtain the semantic information affecting the relation classification. The closest to our work is RBERT [10], which also uses the pre-trained model BERT as a feature extractor to extract high-quality semantic features, and adds special symbols $ and # in data pre-processing as a way to highlight entity vectors and facilitate the classification of entity relations. The above methods all use Transformer or BERT based on attention mechanism as the feature extraction framework, and all use Linear() function to map the probability distribution of relational categories. These methods were able to extract semantic-rich feature vectors using pre-trained models and are still improving the performance of relation classification models. However, these models do not have a systematic prediction structure and simply use the Linear() function to obtain the probabilities of each category in a brute-force manner, which results in the loss of feature vector semantics. Table 3 shows a summary of our model and the attention-based mechanism models.
Table 3.
Summary of our model and the attention-based mechanism models.
Based on the problems in the above methods, the model proposed in this paper uses SpanBert as a feature extraction framework to solve the problems of convolutional neural networks and recurrent neural networks in extracting features from sequence data. We use the “SRS” proposed in this paper to capture the relationship information between entities and reduce the interference of other irrelevant words. In this paper, a prediction structure is also designed for the model to make full use of various feature information and reduce the semantic loss of feature vectors. This is for works using remotely supervised methods to achieve relation classification, e.g., Ref. [29], which used a contrast learning approach to aggregate features and reduce noise in the data. However, this paper mainly focuses on supervised relational classification tasks; so, remote supervision will not be described in detail. We aim to cover relation classification with remote supervision in future work.
3. Methodology
3.1. Overview
The model architecture of this paper is shown in Figure 1, which is divided into two main parts: feature extraction (see Section 3.2 for details) and prediction structure (see Section 3.4 for details), where the prediction structure contains “SRS” feature fusion (see Section 3.3 for details). Due to the data imbalance problem in the relation classification datasets, we use the Focal loss function (see Section 3.5 for details) instead of the traditional Cross-Entropy loss function. For a given sequence data, the identifiers <e1>, </e1> and <e2>, and </e2> from the original data are used to mark the position information of the entity. Based on the position information of the entities, the relationship span between the entities can be truncated, and we use the relationship span and the complete sentences as the input to the model.
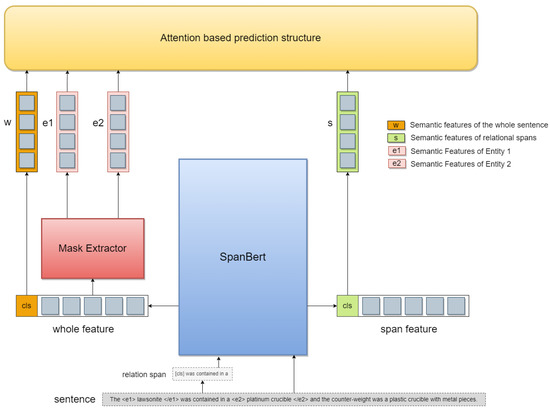
Figure 1.
This is an overview of our model. When a sentence is an input, we extract the span of the relationship between entities by pre-processing and then send the span to BERT to extract features along with the sentence piece by piece. The features extracted from the sentence are passed through a mask extractor to extract the entity vector; eventually, w, e1, e2, and s are fed together into the prediction structure for predictive classification.
In the feature extraction part, we use the pre-trained SpanBert [30] as the feature extraction framework. We extract whole_feature, which represents the semantics of the whole sentence, and span_feature, which represents the semantics of the relational span, by using the feature extraction architecture. whole_feature goes through a mask extractor to obtain the feature vectors e1 and e2 of entity1 and entity2, and a fully connected layer to refine the vector w representing the semantics of the whole sentence. span_feature goes through a fully connected layer to refine a vector s representing the semantics of the relational span. After extracting the feature vectors w, s, e1, and e2, we input these vectors to the attention-based prediction structure to calculate the probability distribution of each relation R. Finally, we feed them to the softmax classifier to obtain the prediction results.
3.2. Feature Extraction
We use the pre-trained SpanBert as our feature extractor. SpanBert is built based on the encoder of transformers with powerful linguistic representation and feature extraction capabilities, and it uses Span mask to pre-train bidirectional transformers to generate deep bidirectional linguistic representations. We first send the whole sentence and the relation span of the sentence to SpanBert, obtain the corresponding two feature vectors, use the “[cls]” token in the vector as the global semantics of the whole vector, and then extract the entity vector by the mask extractor. Suppose a sentence has the following form:
The feature extraction process can be summarized as the following equation:
where S represents a sentence, span represents a relational span, B represents the SpanBert model, w represents the feature vector of the whole sentence, s represents the feature vector of the relation span, represents the feature vector of the entity, represents the entity’s mask vector, and Mask represents the mask extractor. , are the weight matrices and , are the biases.
Mask Extractor
The masking mechanism is a frequently used method in deep learning. The use of masking can be seen as covering a film on top of the original tensor, and this film can mask the elements we do not want to see, so as to achieve the purpose of masking or selecting some specific elements. The purpose of our mask extractor is to extract the entity vector we need from the feature vector of the whole sentence. This is achieved by performing a matrix multiplication operation with the designed mask vector and the feature vector of the whole sentence to finally obtain the entity vector we need. The mask extractor is shown in Figure 2.
where x and y are vectors, and length represents the number of tokens that constitute the entity.
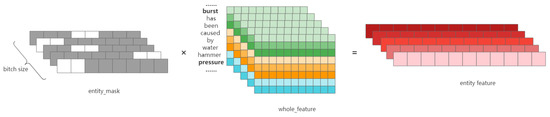
Figure 2.
This is how the mask extractor works. The black and white vectors on the left side of the figure represent the entity mask, which is used to mask words outside the entity, where the white squares represent unmasked and the black squares represent masked. The and perform a matrix multiplication operation to extract the features of the entity vector.
3.3. SRS Feature Fusion
We always want different feature vectors to contain different semantic information so that each feature vector can distinctly express a particular semantic meaning. Therefore, we want to construct a feature vector that can express the relation between entities. In the above process, we have extracted the vector w that can express the semantics of the whole sentence; however, it does not express the relation between two entities accurately and distinctly. Through our investigation and research, we found that the description of the relation between two entities in a sentence appears between two entities with a high probability. Therefore, we intercept the “span” between two entities and use it as a representation to strengthen the relation between the entities. We extract the features of this span and fuse it with the w vector to obtain the fusion vector , a process we call SRS. See Figure 3 for details.
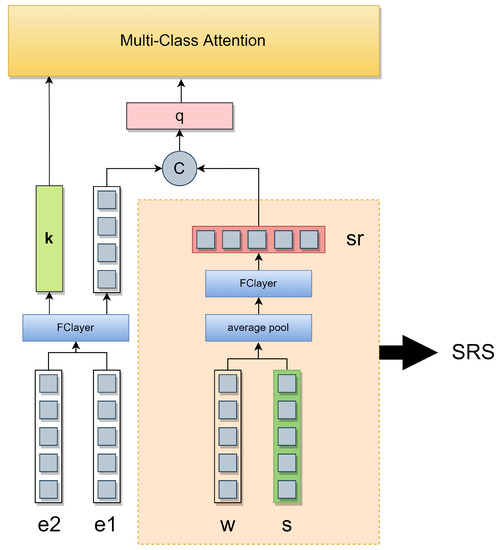
Figure 3.
This is the internal detail diagram of the prediction structure. When the , w, and s are fed into the prediction structure, they will be divided into two ways, one way to construct the keys needed for Multi-Class Attention and one way to construct the queries needed for Multi-Class Attention. SRS is the process of averaging the w representing the global semantics and the s representing the local semantics, and then feeding them into the fully connected layer.
We use the average pool approach to fuse the semantic features of s and w. The specific calculation is performed by adding s and w, then dividing by 2 to obtain their average value. This can average the contribution of global information and local relation information, and significantly reduce the noisy information.
3.4. Attention-Based Prediction Structure
We designed an attention-based prediction structure for fusing global and local semantic features. The previous prediction layer simply passes the feature vector through a fully connected layer, maps the probability distribution of each category in the multi-classification by a linear function, and then uses a softmax classifier for classification. Such a direct reduction of the vector dimension using the linear function not only reduces the ability of the model to capture features but also loses some semantic information in the feature dimension transformation. To solve this problem, we propose to use attention instead of a fully connected layer. We use our own design of Multi-Class Attention (see Figure 4 for details) to map each relation vector space, and finally, calculate the probability distribution of each relation. The prediction structure is shown in Figure 3. When the extracted feature vectors w, s, e1, and e2 are input to the prediction structure, we let these features construct the q and k needed for attention, respectively. We fuse the w and s using “SRS” to obtain the reinforcement vector sr and then stitch sr and e1 together to form q; k is composed of e2. The reason we use this design is to form a paradigm that allows an entity and a relation to query and verify another appropriate entity. We believe that such a paradigm is also consistent with our human intuition (e.g., given an entity “Hamlet” and a relation “author”, our intuition is that the other entity must be a person’s name). Therefore, this paradigm can help the model to perform the relation classification task better. After feeding q and k into Multi-Class Attention, we obtain a vector of probability distributions for each relation, which is finally fed into a softmax classifier for classification.
where q represents the queries of the attention mechanism; k represents the keys of the attention mechanism; e1, e2 represent the entity vectors; represents the SRS fusion feature; and p represents the probability distribution of the relation.
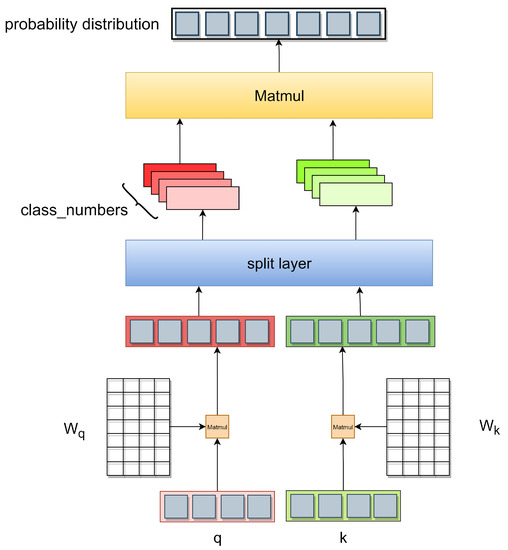
Figure 4.
The internal details of Multi-Class Attention are shown. q and k are first calculated with the corresponding parameter matrices; then, they are divided into different and by the split layer; finally, the probability distribution of each relation class is calculated by MatMul.
Multi-Class Attention
We design Multi-Class Attention to predict the probability distribution of each relation instead of the fully connected layer. Multi-Class Attention is shown in Figure 4. The processing flow is to multiply the q and k constructed in the above process by the corresponding parameter matrices and , respectively. Then, q and k are fed to the split layer, which is divided into class-numbers of different and , where the split layer is implemented by the permute() function and class-numbers are the number of relational categories in the dataset. Then, the different and are matrixed separately to calculate the attention score of each category, which is finally used as the probability distribution of each relation. Finally, the obtained probability distribution vector is fed into the softmax classifier to obtain the final prediction results.
Our Attention is similar to the Multi-Head Attention mechanism in the transformer but with the following differences. First, although our Multi-Class is similar to Multi-Head, each class matrix represents each relation category, and the number of Multi-Class is determined by the relation category of the dataset. Second, our attention mechanism removes values and uses only queries and keys. The reason for this is that we only need to calculate the attention score of each relation for relation classification and do not need values to integrate the global information. So, we do not need to compute with values anymore. The process can be described as the following equation:
where , are the q and k of each class after the split layer, and and are the parameter matrices corresponding to q and k of each class.
3.5. Focal Loss Function
In traditional multi-classification problems, the most commonly used loss function is the cross-entropy loss function. Its binary classification formulation form is as follows:
where y is the true label and is the predicted value.
Although the cross-entropy loss function has the advantages of fast convergence and good results in applications, it does not cope with the problem of imbalance between hard and easy samples. Meanwhile, for the classification of hard and easy samples, the cross-entropy loss function is treated consistently; so, when the loss of a large number of easy samples is accumulated, the loss contribution of hard samples is almost completely swamped, which makes it difficult for the network model to learn the classification of hard samples. To cope with the problem of imbalance between difficult and easy samples in relation classification data, we adopt focal loss [31,32,33] instead of the traditional cross-entropy loss function. Focal loss, as its name suggests, can focus on the problem of classification of difficult samples and the problem of imbalance between samples of different categories. Its binary classification formula has the following form:
The focal loss balances the imbalance of samples by the parameter . For example, if the negative samples are much more than the positive samples, the model will definitely favor the negative class with a larger number; then, the of the negative class will be very small, while the of the positive class will be very large, and the model will then start to focus on the positive samples. After and are adjusted, the status of the positive and negative samples may be reversed. Therefore, it is necessary to downscale the positive samples by adding an parameter to Equation (15), which is used to balance the weights of the whole formula. The final focal loss function formula is shown below:
where is the weighting factor; is the focusing parameter, where y is the real label; and is the predicted value. The final focal loss function is extended to multi-classification by the following equation:
where is the weighting factor for each category and is the predicted value of the target.
4. Experiment
In this section, we verify that our proposed method can effectively capture relational information as well as fully exploit various semantic features. We conducted experiments on two publicly available datasets, and the specific experimental results and analysis are shown in Section 4.2. The specific settings in the experiment are described in Section 4.1. To better represent the specific role of the components in our approach, we performed ablation experiments on the SemEval-2010 Task 8 dataset (see Section 4.3 for details).
4.1. Setup
Datasets: We used two publicly available datasets to validate the effectiveness of our method: The SemEval-2010 Task 8 dataset and the KBP37 dataset. Table 4 shows the statistics of each dataset. The SemEval-2010 Task 8 dataset was provided by Hendrickx et al. as a free dataset, containing 10,717 samples total, 8000 samples for training, and 2717 samples for testing. The dataset contains nine relation types where the relations are ordered. The directionality of the relations effectively doubles the number of relations, since entity pairs are considered to be correctly labeled if the order is also correct. So, finally, there are 19 relations (2 × 9 + 1 other class). The KBP37 dataset includes 18 semantic relations and “no relation” classes. Similar to SemEval-2010 Task 8, the relations are directional; so, the actual number of relation types is 37. It contains 15,917 training instances and 3405 test instances.
Table 4.
Statistics of Semeval-2010 Task 8 and KBP37 datasets.
Evaluation: We adopt the evaluation scheme of the relation classification criteria: precision, recall, and micro F1 are used as evaluation parameters. For the SemEval-2010 Task 8 dataset and the KBP37 dataset, only the prediction of the subject–object order between entities in the predicted relation is considered a positive sample. Otherwise, it is a negative sample (e.g., a sentence with a relation label Message–Topic (e1,e2), if the prediction is Message–Topic (e2,e1), would represent an incorrect prediction).
Platform Setup: The IDE used for the experiments in this paper is Pycharm2021 Professional Edition, PyTorch version 1.9.1, CUDA version 11.6, and CUDNN version 10.2. The model training and inference are performed on an NVIDIA A100-SMX with 40 GB GPU memory, and CPU memory of 16 GB.
Implementation details: For a fair comparison with previous work, we used the SpanBert-base uncased as our base encoder for extracting features from the corpus in the dataset. In addition to using SpanBert-base uncased as an encoder, we also designed a model based on SpanBert-large uncased as an encoder. We set the learning rate to , the training bitch size to 32, the test bitch size to 16, the number of epochs to 50, and the dropout to 0.1. The detailed settings of the hyperparameters are shown in Table 5 and Table 6.
Table 5.
Hyperparameter settings for our model on the SemEval-2010 Task 8 dataset.
Table 6.
Hyperparameter settings for our model on the KBP37 dataset.
4.2. Experimental Results
This section will show the experimental results of our method on two publicly available datasets. On the SemEval-2010 Task 8 dataset, we used precision, recall, and micro f1 as our parameter metrics, and performed a full comparison experiment with previous methods. Additionally, to demonstrate the specific performance of our method on each relation class, we compared it in more detail with two, more powerful, current state-of-the-art models. To verify that our model has good generalizability, we conducted a comparison test on the KBP37 dataset using micro f1 as a parameter indicator.
Table 7 shows the experimental results of our model with previous models on the SemEval-2010 Task 8 dataset. Our models are divided into two types, and one is the base model with SpanBert as the feature extraction architecture. The other is the advanced model with spanbert_large as the feature extraction architecture. Previous models include GLFN; TRE; BERTEM+MTB; R-BERT; Att-RCNN; LGCNN; Bi-SDP-Att; MALNet; BERT with Entity, convolution, and max-pooling; and D-BERT. The experimental results prove that our method outperforms all other methods, where the values in bold represent the most advanced results in this metric. It can be observed that our base model achieves state-of-the-art results in both recall and f1 metrics. The advanced model with spanbert_large as the feature extraction framework substantially outperforms the existing models in all three metrics. Take the BERT with Entity, convolution, and max-pooling model as an example, where precision improves by 0.63 percentage points, recall improves by 0.44 percentage points, and f1 improves by 0.6 percentage points.
Table 7.
Comparison of our model with existing methods on the SemEval-2010 Task 8 dataset.
Table 8 specifically shows the score comparison of our base model with R-BERT and BERT-ECM (BERT with entity, convolution, and max-pooling) on the SemEval-2010 Task 8 dataset for precision, recall, and f1. We find that R-BERT only performs better in the Message–Topic relation, and in comparison with BERT-ECM, we find that BERT-ECM is slightly better than our model in precision; however, in recall and f1, our model outperforms BERT-ECM, especially in the recall metric. We attribute this to our proposed attention-based prediction structure. We set the paradigm of q and k to make full use of various features, which, in turn, facilitates the model to better identify the correct class of relationships. We also find that the score of f1 exceeds 90% for five relations, namely, Cause–Effect, Content–Container, Entity–Destination, Member–Collection, and Message–Topic. Our guess is that these five relations may be more in line with our SRS feature vector extraction paradigm, where the relationship between entities is hidden between two entities.
Table 8.
Comparison of precision, recall, and f1 score of our model with RBERT model and BERT-ECM on the SemEval-2010 Task 8 dataset.
In the above experiments, it has been demonstrated that our model has a good ability to capture the semantics of relationships between entities and to make full use of various features. To further validate the generalizability of our model, we conducted experiments on the KBP37 dataset. The experimental results are shown in Table 9. We selected some of the models from the above experiments for comparison. These include GLFN, R-BERT, Att-RCNN, LGCNN, MALNET, Bi-SDP-Att, and D-BERT models. The experimental results show that our model has good generalization. Both the basic and advanced models outperform existing methods. The base model with SpanBert as the feature extraction architecture achieves an f1 value of 69.33% on the KBP37 dataset, and the advanced model with spanbert_large as the feature extraction architecture achieves an f1 value of 69.55% on the KBP37 dataset.
Table 9.
Comparison of our model with existing methods on the KBP37 dataset.
4.3. Ablation Studies
We have demonstrated the effectiveness of our proposed approach. We would like to further understand the specific contribution of the proposed components. For this purpose, we designed ablation experiments. We designed experimental protocols without SRS and without predicted structures, respectively.
4.3.1. Role of SRS
In this section, we perform a specific analysis and experiment on the role of SRS, where we discard the span of the relation between entities and let the model no longer focus on the relation between entities. Thus, in Figure 1, there is no more output of the green vector s and the prediction structure does not receive the input of s. We call this model CRSAtt_NO_SRS. We conducted corresponding experiments on the SemEval-2010 Task 8 dataset for CRSAtt_NO_SRS and the original model; the experimental results are shown in Table 10. In the model with only the prediction structure and no SRS, the f1 of CRSAtt_NO_SRS decreases by 1.05. The experiments demonstrate that our proposed SRS feature fusion can effectively capture the relation features between entities.
Table 10.
Comparison of the model without SRS feature fusion and the full model on the SemEval-2010 Task 8 dataset.
4.3.2. Role of Prediction Structure
In this section, we perform specific analyses and experiments on the role of the prediction structure. We remove the prediction structure designed by ourselves and use the same method as RBERT to predict the classification by feeding it into the softmax classifier with only one fully-connected layer. Therefore, we directly stitch together the four vectors in Figure 1 and feed them into the softmax classifier to predict the results after a fully connected layer. We call this model CRSAtt_NO_PR. We perform corresponding experiments on the SemEval-2010 Task 8 dataset for CRSAtt_NO_PR and the original model, and the experimental results are shown in Table 11. The f1 of CRSAtt_NO_PR decreases by 0.9 compared with the full model. The experiments demonstrate that our proposed prediction structure can effectively fuse global semantic information and local relational information.
Table 11.
Comparison of the model without prediction structure and the full model on the SemEval-2010 Task 8 dataset.
5. Conclusions
In recent years, Bert-based relation classification models have become increasingly popular with the rise of pre-trained models. However, these models cannot focus well on the semantics of the relationships between entities and rely only on the powerful feature extraction ability of the Bert model for relation classification. Therefore, in order to enable the model to focus on the semantics of relationships between entities, as well as to make full use of various feature information that facilitates relation classification. We propose a new relation classification model, CRSAtt, for solving the problem whereby existing models cannot accurately extract the semantics of relationships between entities by sentence-level features alone. We intercept the span between entities in a sentence during data pre-processing and use it as the semantics of the relationship between entities. The sentence and span are fed into the feature extraction architecture to extract various features that are fed into the attention-based prediction structure for relation classification. In order to have a better grasp of the semantic information of the relationships between entities, we propose a feature fusion method called SRS (Strengthen Relational Semantics), which aims to integrate global information and local relational information. In the prediction structure, we make our model perform particularly well on the recall metric by cleverly designing the way q and k are constructed. Experiments on the SemEval-2010 Task 8 dataset showed that the CRSAtt model improved performance over existing methods with an f1 score of 90.55%. In addition, the results of the ablation study on the SemEval-2010 Task 8 dataset show that our proposed SRS and attention-based prediction structures have a positive impact on the classification performance of the model.
In future work, the relation classification model needs to further improve its generalizability; so, we will train the model using a remotely supervised approach based on the research in this paper, focusing on introducing external knowledge with an aim to improve the generalizability and classification performance of the model using a large amount of data that do not require manual annotation.
Author Contributions
Conceptualization, M.L. and C.S.; methodology, G.L.; software, G.L.; validation, M.L., C.S. and G.L.; formal analysis, M.L.; investigation, M.L.; resources, C.S.; data curation, C.S.; writing—original draft preparation, G.L.; writing—review and editing, M.Z.; visualization, D.H.; supervision, M.Z. and D.H.; project administration, M.L. All authors have read and agreed to the published version of the manuscript.
Funding
This work was supported by the National Key R&D Plan of China (2022YFF0608000).
Institutional Review Board Statement
Not applicable.
Informed Consent Statement
Not applicable.
Data Availability Statement
Not applicable.
Conflicts of Interest
The authors declare no conflict of interest.
References
- Han, X.; Gao, T.; Lin, Y.; Peng, H.; Yang, Y.; Xiao, C.; Liu, Z.; Li, P.; Sun, M.; Zhou, J. More Data, More Relations, More Context and More Openness: A Review and Outlook for Relation Extraction. arXiv 2020, arXiv:2004.03186. [Google Scholar]
- Khadhraoui, M.; Bellaaj, H.; Ammar, M.B.; Hamam, H.; Jmaiel, M. Survey of BERT-Base Models for Scientific Text Classification: COVID-19 Case Study. Appl. Sci. 2022, 12, 2891. [Google Scholar] [CrossRef]
- Li, H.; Ma, Y.; Ma, Z.; Zhu, H. Weibo Text Sentiment Analysis Based on BERT and Deep Learning. Appl. Sci. 2021, 11, 10774. [Google Scholar] [CrossRef]
- Mikolov, T.; Chen, K.; Corrado, G.; Dean, J. Efficient Estimation of Word Representations in Vector Space. arXiv 2013, arXiv:1301.3781. [Google Scholar]
- Pennington, J.; Socher, R.; Manning, C. Glove: Global Vectors for Word Representation. In Proceedings of the 2014 Conference on Empirical Methods in Natural Language Processing (EMNLP), Doha, Qatar, 25–29 October 2014; Association for Computational Linguistics: Doha, Qatar, 2014; pp. 1532–1543. [Google Scholar]
- Peters, M.E.; Neumann, M.; Iyyer, M.; Gardner, M.; Clark, C.; Lee, K.; Zettlemoyer, L. Deep Contextualized Word Representations. arXiv 2018, arXiv:1802.05365. [Google Scholar]
- Nguyen, T.H.; Grishman, R. Relation Extraction: Perspective from Convolutional Neural Networks. In Proceedings of the 1st Workshop on Vector Space Modeling for Natural Language Processing, Denver, CO, USA, 5 June 2015; Association for Computational Linguistics: Denver, CO, USA, 2015; pp. 39–48. [Google Scholar]
- Nguyen, T.H.; Cho, K.; Grishman, R. Joint Event Extraction via Recurrent Neural Networks. In Proceedings of the 2016 Conference of the North American Chapter of the Association for Computational Linguistics: Human Language Technologies, San Diego, CA, USA, 12–17 June 2016; Association for Computational Linguistics: San Diego, CA, USA, 2016; pp. 300–309. [Google Scholar]
- Zhang, S.; Zheng, D.; Hu, X.; Yang, M. Bidirectional Long Short-Term Memory Networks for Relation Classification. In Proceedings of the 29th Pacific Asia Conference on Language, Information and Computation, Shanghai, China, 30 October–1 November 2015. [Google Scholar]
- Wu, S.; He, Y. Enriching Pre-Trained Language Model with Entity Information for Relation Classification. In Proceedings of the CIKM ’19: Proceedings of the 28th ACM International Conference on Information and Knowledge Management, Beijing China, 3–7 November 2019. [Google Scholar]
- de Araujo, D.A.; Rigo, S.J.; Barbosa, J.L.V. Ontology-Based Information Extraction for Juridical Events with Case Studies in Brazilian Legal Realm. Artif. Intell. Law 2017, 25, 379–396. [Google Scholar] [CrossRef]
- Park, Y.-H.; Lee, G.-H.; Choi, Y.-S.; Lee, K.-J. Sentence Compression Using BERT and Graph Convolutional Networks. Appl. Sci. 2021, 11, 9910. [Google Scholar] [CrossRef]
- Vaswani, A.; Shazeer, N.; Parmar, N.; Uszkoreit, J.; Jones, L.; Gomez, A.N.; Kaiser, L.; Polosukhin, I. Attention Is All You Need. arXiv 2017, arXiv:1706.03762. [Google Scholar]
- Reis, E.S.D.; Costa, C.A.D.; Silveira, D.E.D.; Bavaresco, R.S.; Righi, R.D.R.; Barbosa, J.L.V.; Antunes, R.S.; Gomes, M.M.; Federizzi, G. Transformers Aftermath: Current Research and Rising Trends. Commun. ACM 2021, 64, 154–163. [Google Scholar] [CrossRef]
- Devlin, J.; Chang, M.-W.; Lee, K.; Toutanova, K. BERT: Pre-Training of Deep Bidirectional Transformers for Language Understanding. arXiv 2019, arXiv:1810.04805. [Google Scholar]
- Zeng, D.; Liu, K.; Lai, S.; Zhou, G.; Zhao, J. Relation Classification via Convolutional Deep Neural Network. In Proceedings of the COLING 2014, the 25th International Conference on Computational Linguistics, Dublin, Ireland, 23–29 August 2014. [Google Scholar]
- dos Santos, C.N.; Xiang, B.; Zhou, B. Classifying Relations by Ranking with Convolutional Neural Networks. In Proceedings of the 53rd Annual Meeting of the Association for Computational Linguistics and the 7th International Joint Conference on Natural Language Processing, Beijing, China, 26–31 July 2015. [Google Scholar]
- Liu, Y.; Wei, F.; Li, S.; Ji, H.; Zhou, M.; Wang, H. A Dependency-Based Neural Network for Relation Classification. arXiv 2015, arXiv:1507.04646. [Google Scholar]
- Zhang, D.; Wang, D. Relation Classification via Recurrent Neural Network. arXiv 2015, arXiv:1508.01006. [Google Scholar]
- Cai, R.; Zhang, X.; Wang, H. Bidirectional Recurrent Convolutional Neural Network for Relation Classification. In Proceedings of the 54th Annual Meeting of the Association for Computational Linguistics (Volume 1: Long Papers), Berlin, Germany, 7–12 August 2016; Association for Computational Linguistics: Berlin, Germany, 2016; pp. 756–765. [Google Scholar]
- Zhou, P.; Shi, W.; Tian, J.; Qi, Z.; Li, B.; Hao, H.; Xu, B. Attention-Based Bidirectional Long Short-Term Memory Networks for Relation Classification. In Proceedings of the 54th Annual Meeting of the Association for Computational Linguistics (Volume 2: Short Papers), Berlin, Germany, 7–12 August 2016; Association for Computational Linguistics: Berlin, Germany, 2016; pp. 207–212. [Google Scholar]
- Jin, Y.; Wu, D.; Guo, W. Attention-Based LSTM with Filter Mechanism for Entity Relation Classification. Symmetry 2020, 12, 1729. [Google Scholar] [CrossRef]
- Wang, L.; Cao, Z.; de Melo, G.; Liu, Z. Relation Classification via Multi-Level Attention CNNs. In Proceedings of the 54th Annual Meeting of the Association for Computational Linguistics (Volume 1: Long Papers), Berlin, Germany, 7–12 August 2016; Association for Computational Linguistics: Berlin, Germany, 2016; pp. 1298–1307. [Google Scholar]
- Shi, P.; Lin, J. Simple BERT Models for Relation Extraction and Semantic Role Labeling. arXiv 2019, arXiv:1904.05255. [Google Scholar]
- Alt, C.; Hubner, M.; Hennig, L. Improving Relation Extraction by Pre-Trained Language Representations. arXiv 2019, arXiv:1906.03088. [Google Scholar]
- Soares, L.B.; FitzGerald, N.; Ling, J.; Kwiatkowski, T. Matching the Blanks: Distributional Similarity for Relation Learning. arXiv 2019, arXiv:1906.03158. [Google Scholar]
- Huang, Y.; Li, Z.; Deng, W.; Wang, G.; Lin, Z. D-BERT: Incorporating Dependency-based Attention into BERT for Relation Extraction. CAAI Trans. Intell. Technol. 2021, 6, 417–425. [Google Scholar] [CrossRef]
- Liu, J.; Duan, X.; Zhang, R.; Sun, Y.; Guan, L.; Lin, B. Relation Classification via BERT with Piecewise Convolution and Focal Loss. PLoS ONE 2021, 16, e0257092. [Google Scholar] [CrossRef]
- Chen, T.; Shi, H.; Tang, S.; Chen, Z.; Wu, F.; Zhuang, Y. CIL: Contrastive Instance Learning Framework for Distantly Supervised Relation Extraction. arXiv 2021, arXiv:2106.10855. [Google Scholar]
- Joshi, M.; Chen, D.; Liu, Y.; Weld, D.S.; Zettlemoyer, L.; Levy, O. SpanBERT: Improving Pre-Training by Representing and Predicting Spans. Trans. Assoc. Comput. Linguist. 2020, 8, 64–77. [Google Scholar] [CrossRef]
- Lin, T.-Y.; Goyal, P.; Girshick, R.; He, K.; Dollar, P. Focal Loss for Dense Object Detection. In Proceedings of the 2017 IEEE International Conference on Computer Vision (ICCV), Venice, Italy, 22–29 October 2017. [Google Scholar]
- From Hard Truncation of Loss, Softening to Focal Loss. Available online: https://wmathor.com/index.php/archives/1548/ (accessed on 7 October 2022).
- What is Focal Loss and When Should You Use It? Available online: https://amaarora.github.io/2020/06/29/FocalLoss.html#so-why-did-that-work-what-did-focal-loss-do-to-make-it-work (accessed on 7 October 2022).
- Li, P. Correlation Temporal Feature Extraction Network via Residual Network for English Relation Extraction. ICST Trans. Scalable Inf. Syst. 2018, 2018, 172213. [Google Scholar] [CrossRef]
- Guo, X.; Zhang, H.; Yang, H.; Xu, L.; Ye, Z. A Single Attention-Based Combination of CNN and RNN for Relation Classification. IEEE Access 2019, 7, 12467–12475. [Google Scholar] [CrossRef]
- Deng, K.; Wu, S. Improving Relation Classification by Incorporating Dependency and Semantic Information. In Proceedings of the 2020 International Joint Conference on Neural Networks (IJCNN), Glasgow, UK, 24 July 2020; pp. 1–6. [Google Scholar]
- Wang, H.; Qin, K.; Lu, G.; Luo, G.; Liu, G. Direction-Sensitive Relation Extraction Using Bi-SDP Attention Model. Knowl.-Based Syst. 2020, 198, 105928. [Google Scholar] [CrossRef]
Publisher’s Note: MDPI stays neutral with regard to jurisdictional claims in published maps and institutional affiliations. |
© 2022 by the authors. Licensee MDPI, Basel, Switzerland. This article is an open access article distributed under the terms and conditions of the Creative Commons Attribution (CC BY) license (https://creativecommons.org/licenses/by/4.0/).