Abstract
With the increasing proportion of wind power access year by year, it brings many challenges to the voltage stability of power systems. In order to maintain the stability of the voltage in the power grid, it is impossible to take into account the regulation ability and economy when a single reactive power compensation device is installed. In this paper, a combined reactive power compensation device was installed, which is composed of a static var generator (SVG) and a parallel capacitor bank. The SVG has the characteristics of fast and smooth adjustment, and the application of the capacitor bank reduces the overall investment cost and has a great economy. The modal analysis method was used to find the optimal installation position for the reactive power compensation device. The improved particle swarm algorithm was used to optimize the capacity of the optimal reactive power compensation device to ensure the best performance of the compensation device. Finally, by formulating the control strategy of the combined reactive power compensation system, the reliable switching of the compensation device is controlled. The PSCAD simulation software was used to model the power grid in the Hami area, and six different configuration programs were set for static voltage stability simulation verification and three different configurations. The program was simulated and verified for transient voltage stability, and comparative analysis showed that the proposed method was correct, which strongly supports the voltage stability of the region and meets the demand of reactive power compensation of the power grid. This provides a good reference program for other wind power gathering areas.
1. Introduction
Due to the reverse distribution of energy and load in China, large-scale thermal power and clean energy need to be transmitted to the receiving end grid over long distances and across regions, while the ultrahigh voltage direct current (UHV DC) transmission project is responsible for the arduous mission of Xinjiang power transmission [1,2]. Since the operation of ±800 kV Tianzhong DC, the wind power in the Hami area has been continuously transported to the power load center. However, the large-scale wind power grid connection has also brought voltage fluctuations and other influences to the region, which has severely challenged the stability of the power grid [3,4,5,6]. In recent years, the rapid development of the static reactive power generator SVG device represents the latest reactive power compensation system. It has a rapid response, wide operating range, and can suppress voltage flicker, but its complex structure and high cost make it difficult to be used on a large scale. Therefore, it is of high practical significance to study a new type of combined reactive power compensation device which would have both the cost advantage of traditional reactive power compensation device SC and the continuous smooth adjustment ability of SVG device.
According to the current research status, the authors of [7] proposes using SVC to replace the conventional reactive power compensation device, and rationally configuring the capacity of SVC to further ensure the stability of bus voltage. In order to evaluate the voltage support, the dynamic reactive power support is studied by the comprehensive analysis of time domain and frequency domain. Related scholars proposed that in the process of voltage static stability research, the corresponding reactive power compensation device should be added to the weak point of voltage, which can basically meet the requirements of wind power delivery in the Hami area to a certain extent. The authors of [8] put forward the optimization measures to install the corresponding series and parallel reactive power compensation devices on the top of the network channel, and carried out relevant research, analysis, and demonstration. The authors of [9,10] conducted a comparative analysis of the effect of reactive power compensation on the medium-voltage side compensation and low-voltage side of the UHV transformer. Although the operation of the UHV DC project was guaranteed, the DC near-region voltage was not analyzed. The authors of [11] rationalized the configuration of the capacity through SVC and conventional capacitor banks in order to minimize the total investment, but did not consider the best performance of the compensation device. In [12], the reactive power capacity of the large-scale wind power grid-connected system was calculated, and the recommended and unrecommended operation modes were analyzed. The authors of [13] studied the structure, coordinate control method, and parameter design of the hybrid system proposed for active power injection and non-active power (reactive, harmonic, and unbalanced power) compensation. The proposed hybrid system consists of a static var compensator (SVC) and a capacitively coupled grid-connected inverter (CGCI) (SVC//CGCI). The authors of [14] analyzed the transient voltage stability of the wind farm connection point, and created the transient voltage margin by formulating a reactive power compensation strategy. The authors of [15] optimized the configuration of wind and fire bundling capacity and DC drop point through a quantum particle swarm algorithm. The authors of [16,17] proposed a new type of reactive power compensation device or application scenario, but the scope of the application is limited. The authors of [18,19] proposed a combined reactive power compensation device, and optimized its topology and control strategy, but did not optimize the parameters. The existing voltage control methods have shortcomings in terms of adjustment range and response speed. The authors of [20,21,22,23,24] proposed a corresponding dynamic coordinated control strategy to improve the support capability of the voltage. However, the selection of dynamic reactive power planning address based on trajectory sensitivity has been introduced in detail, and the corresponding characteristics and effects of reactive power compensation of two commonly used dynamic reactive power compensation devices, SVC and STATCOM, have been fully compared and analyzed.
The main contributions of this paper are as follows:
- Using the advantages of fast response and strong economy of the combined reactive power compensation device, a control strategy for the reactive power compensation system based on the wind farm is formulated. This strategy not only avoids the frequent switching of capacitor banks but also guarantees the linear demand of the system for reactive power.
- The active power margin and modal numerical analysis of the wind power gathering area in the Hami area show that the Mahuanggou east wind farm, located in the Santanghu wind area, is the weak node of voltage in this area, so this area is the best place to install reactive power compensation devices.
- The improved particle swarm algorithm is used to optimize the capacity of the optimal reactive power compensation device, which ensures the best performance of the compensation device.
- Using PSCAD simulation software to model the power grid in the Hami area, six different reactive power compensation device configuration programs are set up for static voltage stability simulation verification, as well as three different reactive power compensation device combination programs for transient voltage stability simulation verification.
In summary, in order to solve the problem of weak voltage support in wind power gathering areas, considering the continuity and smoothness of regulation in reactive power compensation, and taking into account the economy of cost, this paper proposes a new combined reactive power compensation device composed of SVG and a capacitor bank. Taking the Tianzhong DC near-area power grid as an example, we analyzed and derived the voltage weakness area of the grid, used the improved particle swarm algorithm to find the optimal capacity of the compensation device, and finally verified the effectiveness of the method by setting up four configuration programs, which have guiding significance for the power grid in this area.
2. Research the Basic Characteristics and Compensation Strategy of SVG
SVG uses fully-controlled switching devices to form a self-commutation inverter, and then uses a small-capacity energy storage element as an auxiliary to perform the corresponding reactive power compensation work, so it can realize the function of instantaneous reactive power compensation [25,26,27].
The control method of SVG is mainly composed of two layers: outer loop control and inner loop control. The outer loop control mainly includes the following parts: the reactive power control part, the DC voltage control part, and the grid connection point voltage control part; its main function is to generate d, q axis current reference values idref, iqref.
The DC voltage control part is used to further compare the DC side voltage Udc and its reference value voltage Udcref. The voltage value is also used to generate the d-axis current reference value idref, which is used to further stabilize the DC side voltage Udc, and idref satisfies the following equation.
In Formula (1), Kdi and Kdp represent the integral coefficient and proportional coefficient of the d-axis PI controller, respectively.
The control method of the reactive power and grid connection point voltage is to compare the reactive power output in the grid connection point voltage Upcc or SVG with the reactive power reference, and to obtain the q-axis current reference value iqref. The voltage of the stable grid-connected point is determined through the reference value, or the reactive power required for the output with the reference value is directly adjusted [28,29]. The current reference value satisfies the following equation:
In terms of reactive power, it needs to meet:
In the above formula, Kqi and Kqp represent the integral coefficient and proportional coefficient in the PI controller corresponding to the q-axis, respectively.
The main purpose of the current inner loop control is to enable the output current id, and for the iq of the SVG to be further controlled and regulated by UAd and UAq. However, for the dynamic reactive power compensation device SVG, there is a certain coupling relationship between the d-axis and the q-axis of each voltage and current amount. With the further change in the current amount id, it will directly cause the UAq and iq values to change accordingly. For coupled loops, with the general treatment, it is difficult to separate them for separate numerical analysis, and decoupling is necessary when encountering this situation. To the PI output value of the inner loop circuit control, two feedforward compensations are added, namely ωLid and ωLiq. The control situation is shown in Figure 1 below.
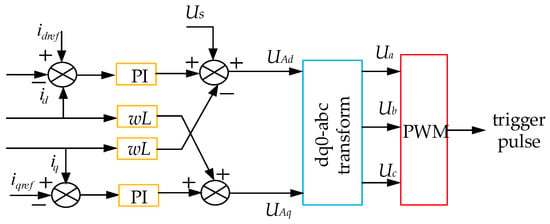
Figure 1.
Static Var Generator control system structure diagram.
In the above figure, the voltage transfer function output by SVG is given as follows.
In Formula (4), K1 and Kp represent the integral coefficient and proportional coefficient of the PI controller, respectively.
Formula (1) is substituted into Formula (4), and the following equation is obtained after simplification:
In the above Formula (5), the non-diagonal elements of the matrix are all set to zero values so that before the PI controller output in the current inner-loop control, and after adding feedforward compensation, the d, q axes have basically achieved complete decoupling control. The overall double-loop control of SVG is shown in Figure 2 below.
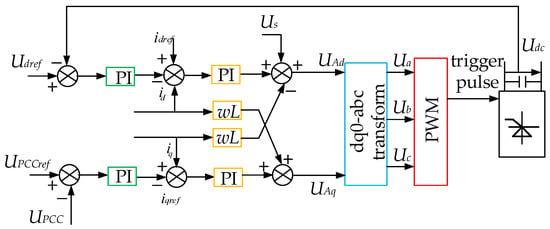
Figure 2.
Static Var Generator double ring control system structure diagram.
3. Control Strategy of Hybrid Reactive Power Compensation System
In order to be able to fully consider the response speed of reactive power compensation equipment, and, at the same time, to achieve its economy, a combined reactive power compensation program is proposed. This solution not only has the characteristics of SVG continuous and fast adjustment, but also has the advantages of low-cost and large-capacity reactive power compensation, such as parallel capacitors. Its corresponding system structure is shown in Figure 3 below.
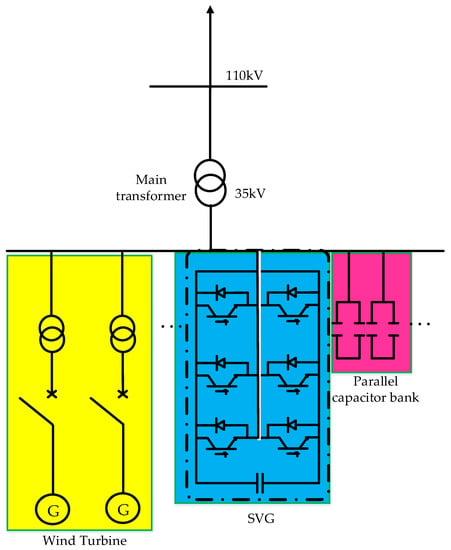
Figure 3.
Hybrid reactive power compensation system topology diagram.
We assume that the capacity of a single group of switchable parallel capacitors is Qc, and the reactive power capacity required in the wind farm is Q. When kQc < Q < (k + 1) Qc, the control system issues a command to switch in the k groups of capacitor banks. At the same time, the system detects the gap in reactive power compensation and issues the input SVG command, in order to further perform reactive power compensation on the system. In this way, the smooth regulation of reactive power and the voltage stability of the grid connection point are always maintained.
Conventional capacitor banks generally choose the SC type. Usually, to avoid frequent switching of SC capacitor banks, a compensation margin (Y) will be set within the reactive power range. If the power grid system has been put into k groups of capacitor banks as reactive power compensation, then: (1) when Q > (k + 1)Qc + Y, put in the k + 1 group of capacitor banks; (2) when Q < kQc − Y, exit the k-th capacitor bank. Setting the compensation margin not only avoids the frequent switching of capacitor banks, but also ensures the linear demand of the system for reactive power. The control system flow of the hybrid reactive power compensation is shown in Figure 4 below.
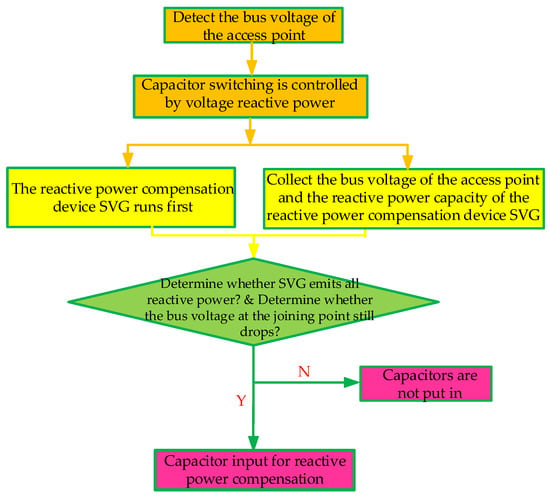
Figure 4.
Flowchart of the hybrid reactive power compensation control system.
The cost advantage of the device itself, compared with the SVC type, is that the SVG type reactive power compensation device adopts digital control technology, which has high system reliability, basically does not need maintenance, and can save a lot of maintenance costs. SVG adopts static operation, with no large rotating equipment, no wear, and no mechanical noise. This greatly improves the device’s life, and also improves the environmental impact. With the same compensation capacity, the footprint of SVG is reduced by 1/2 to 2/3 compared with that of SVC. Since SVG uses fewer reactors and capacitors than SVC, it greatly reduces the volume and footprint of the device. The reactors in SVC not only have a large volume, but also occupy a large area, considering the installation interval between them.
In terms of economic analysis of assessment, taking a station as an example, the average monthly assessment was RMB 20,000 before the installation of the reactive power compensation device. After the installation, the assessment was not only exempted, but the monthly reward was stable at more than RMB 5000, and good economic benefits were achieved, as shown in Table 1 below.

Table 1.
Summary table of assessment indicators.
4. Parameter Configuration of Reactive Power Compensation System
The optimal capacity configuration of the reactive power compensation device is crucial to improving the efficiency of regulating reactive power. This section aims to optimize the capacity of the reactive power compensation, and uses an improved particle swarm optimization algorithm (chaotic particle swarm optimization with adaptive mutation operator) to optimize the reactive power capacity.
4.1. Improved Particle Swarm Optimization
At present, most scholars use random initialization to operate the particle position when using particle swarm optimization, but this will directly lead to the problem of the particle distribution becoming more and more uneven in the iterative process [30,31,32]. The chaotic motion has the characteristics of going through all states without repetition according to its laws within a certain range. Therefore, using chaos theory to initialize the particles in the algorithm can further enhance the diversity of the population, and fundamentally prevent the solution set from falling into a local optimum situation, which generates the corresponding chaotic sequence, as shown in Equation (6):
For particle i in W-dimensional space, the first step is to generate a W-dimensional vector yi(1), and each component must be in the range of (−1, 1). Then, each dimension of the vector is entered into the above formula, and Hset-1 iterations are performed. After the iteration, the generated Hset-1 chaotic sequences enter the search space of the corresponding particle swarm.
It can be obtained from the above that qtbest represents the optimal position of the particle after one iteration; for the qtbest generated after each iteration process, it is given a relatively reasonable weight: st (0 < st < 1, Σst = 1). In order to further weigh all the particles in the algorithm, the following can be obtained: . The speed update formula of the basic algorithm is replaced by , in which qtbest_iw is replaced. Thus, after the improvement, the new particle speed update formula is as follows:
In order to further ensure the diversity of the population, to avoid local optima at the beginning of iterative evolution, and to ensure the stability of the population and improve the ability of local searches at the later stage of iterative evolution, this paper adopts a strategy to improve the particle initialization by adaptive operators. This strategy updates the particle positions variably during the iterative evolution of the algorithm by setting the variation probability, using a relatively large variation size at the beginning of the iteration, and causing it to gradually decrease during the evolution process.
In this formula, Px: represents the probability of occurrence of mutation, which is 0.5, and the random number is U(0,1). If the value is greater than Px, the corresponding population particle will mutate. If the value is smaller than Px, the corresponding population will not mutate. Additionally, η(x) ∈ [0, 1] is the variation scale of the population in the iterative evolution process; a ∈ (0, 1); max gen is the total number of evolutionary iterations; the value of b is 2, and r is a random value.
4.2. Parameter Optimization of Reactive Power Compensation System
By improving the particle swarm algorithm, the search range of the particle swarm can be guaranteed to a certain extent, and the diversity of the population can be further ensured. The algorithm can ensure the optimal value of reactive power capacity required by the reactive power compensation system, and the optimization process is shown in Figure 5.
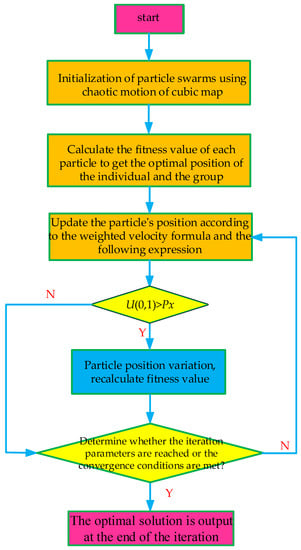
Figure 5.
Flowchart of the adaptive variation operator chaotic particle swarm algorithm.
5. Simulation and Verification of Hybrid Reactive Power Compensation Program
This section takes the Tianzhong DC wind power gathering area, the main channel of Xinjiang power transmission, as the main analysis object. It also uses PSCAD electromagnetic simulation software to build models of the Santanghu area, the central area of Hami, and the southeast wind area of Hami. It is connected to the wind power collection station by the 35 kV voltage level, and is then uniformly connected to the main grid of the entire power grid by the 220 kV bus. The connection method is shown in Figure 6. In view of the regional power grid in Figure 6, firstly, the active power margin is analyzed in three regions to find out the high permeability area of wind power; then, the modal analysis method is used to find out the best location for installing reactive power compensation device in this region; and, finally, the simulation method is used to verify the voltage support effect of installing the reactive power compensation device in this region.
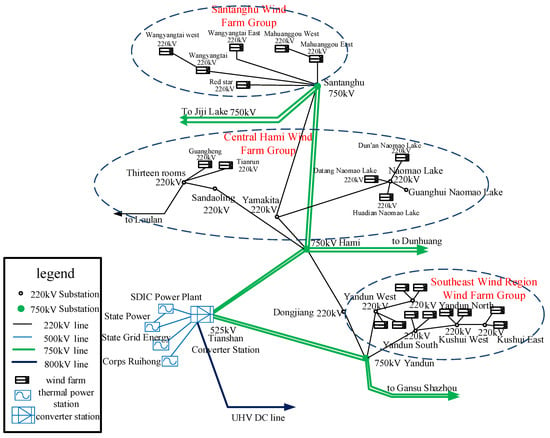
Figure 6.
Distribution map of the DC near-area power grid in Tianzhong.
5.1. Analysis of the Best Installation Location
Through the simulation analysis of Santanghu, central Hami, and Southeast wind areas, the distribution of tidal currents in this area is obtained. The active power of the Santanghu wind power gathering area is the maximum of 2582.3 MW in the three areas. The reactive power of the Southeast wind power gathering area is the largest of 3401.2 MVar in the three areas. The active power margin is used to judge whether the wind power gathering area is an area with high wind power penetration. As shown in Table 2 below, the KP of the central Hami wind area is 65.4%, and the margin is the largest; the KP of the Southeast wind area is 15.8%, and the margin is the second; the KP of the Santanghu wind area is 5.7%, with the smallest margin. The Santanghu area has a large wind power transmission capacity and the lowest active power margin, which belongs to the high penetration area of wind power.

Table 2.
Busbar margin analysis of the wind farm group area.
The modal analysis is carried out on the 220 kV collective bus of each wind farm in the Hami area [33,34,35], and the specific voltage stability modal data in each wind farm in the Hami area can be obtained, as shown in Table 3.

Table 3.
The 220 kV aggregate busbar value of the wind farm in the Hami area.
From the margin analysis in Table 2 and the modal numerical analysis in Table 3, it is not difficult to find that the Yandun north wind farm in the southeast wind area and the Mahuanggou east wind farm in the Santanghu wind area are weak links in the voltage in this area. Therefore, the installation of reactive power compensation devices has the best effect in this area, which is the best installation position for combined reactive power equipment.
In Figure 7, the reactive power control method for the combined flow chart is shown. The control method first uses active power margin analysis and modal analysis to confirm the optimal installation position of the reactive power compensation device. Secondly, it uses the improved particle swarm optimization algorithm to optimize the best parameters. Finally, a six-team comparison program is set in the static voltage control and a three-team comparison program is set in the transient voltage control. The correctness of the proposed program is verified by the simulation results.
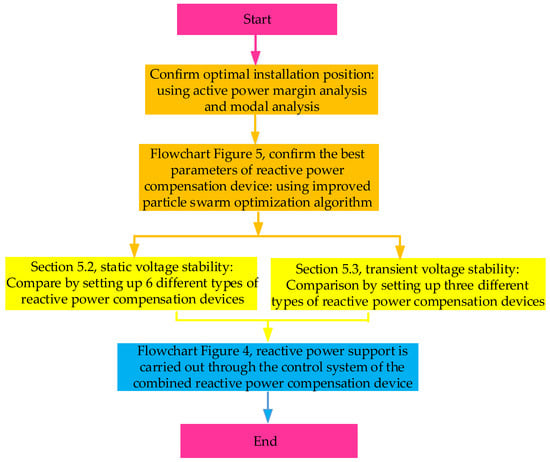
Figure 7.
Flow chart of combined reactive power control method.
5.2. Static Voltage Stability Simulation Verification
By improving the particle swarm algorithm, as discussed in Section 4 of this paper, when the fixed compensation capacity of the parallel capacitor is set to 10 MVar, the best compensation effect should be obtained when the SVG compensation capacity is set to 9.2 MVar.
In order to verify the correctness of the method proposed in this paper, through the P-U characteristic curve of the wind farm in the eastern area of Mahuangou in the Santanghu wind area, the static voltage stability under the control of different types of reactive power compensation devices was analyzed by setting different configuration programs combined with the methods in the literature [5,11,13,17,18,26,27]. Taking the Shengtian and Huaneng wind farms in weak areas as examples, the following six programs are simulated and compared.
Program 1: no reactive power compensation device.
Program 2: set 20MVar SC capacitor banks.
Program 3: set 20MVar SVC as wind farm reactive power compensation equipment.
Program 4: set the combined reactive power compensation device proposed in this paper; the parallel capacitor capacity is 10MVar, and the SVC compensation capacity is 9.2 MVar.
Program 5: set 20 MVar SVG as the reactive power compensation equipment of the wind farm.
Program 6: set the combined reactive power compensation device proposed in this paper; the parallel capacitor capacity is 10 MVar, and the SVG compensation capacity is 9.2 MVar.
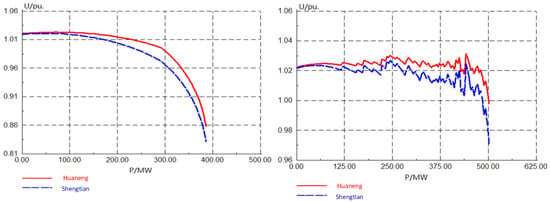
Figure 8.
P-U characteristic curve in programs 1 and 2.
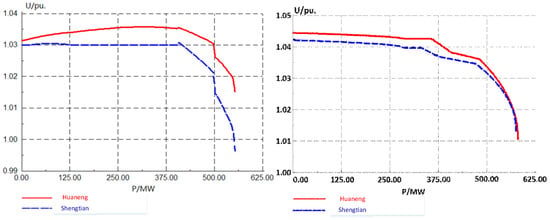
Figure 9.
P-U characteristic curve in programs 3 and 4.
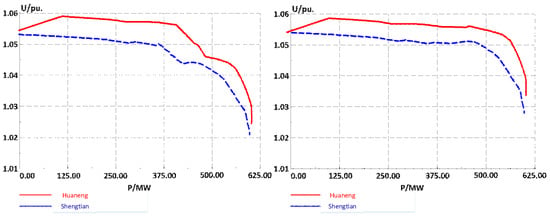
Figure 10.
P-U characteristic curve in programs 5 and 6.
Program 1: In the case that there is no reactive power compensation device in either wind farm when the active power is about 385 MW, the busbar voltage drops rapidly and quickly reaches the limit instability point.
Program 2: When the SC-type capacitor bank is put in, it leads to a large oscillation of the wind turbine terminal voltage. The active power is about 500 MW when the bus voltage shows a sudden drop, but the static voltage stability limit of the wind farm convergence area is improved compared to option 1.
Program 3: When the static reactive power compensation device SVC is put in, compared to the first two programs, the ultimate destabilizing active power output of the wind farm voltage can reach 543 MW before the voltage destabilization phenomenon finally occurs. This raises the voltage destabilization threshold and can further enhance the static voltage stability limit of the wind farm cluster to a certain extent.
Program 4: When combined SVC and shunt capacitor reactive power compensation equipment are used, the SVC can smooth the reactive power output and further maintain a constant voltage at the controlled bus within the reactive power regulation capacity. Compared with the aforementioned programs, it can more significantly improve the static voltage stability limit, for which the wind farm group’s active output reaches 570 MW when voltage instability eventually occurs.
Program 5: When the dynamic reactive power compensation device SVG is put in, the ultimate destabilized active power output of the wind farm voltage can reach 600 MW compared to the first two programs, which raises the voltage destabilization critical point.
Program 6: When the combined reactive power compensation device of SVG and shunt capacitor is used, because SVG also can smoothly regulate the reactive power, when a serious fault occurs in the power system, it will further cause the bus voltage to drop significantly. For the combined reactive power compensation device of the shunt capacitor plus SVG proposed in this paper, its reactive power compensation performance is better than that of SVG, which can further maintain the voltage stability. The active power output of its wind farm group reaches 610 MW before the voltage instability finally occurs.
In summary, the voltage support ability of the above six reactive power compensation configuration programs is enhanced in turn. The minimum is when the active power of program 1 is about 385 MW, and the bus voltage drops rapidly. The maximum is when the active power output of program 6 reaches 610 MW, and the voltage instability finally occurs. Program 6 adopts the combined reactive power compensation of SVG and capacitor, which has more advantages in maintaining voltage stability and improving voltage stability limit. Program 6 also takes into account the advantages of rapid adjustment ability and the small size of SVG, and has the advantages of the low cost and large capacity of shunt capacitors.
5.3. Transient Voltage Stability Simulation Verification
In this section, the characteristics related to the transient voltage stability of the power grid in the Hami region of Xinjiang are further analyzed and studied by the time-domain simulation method. Based on the previous section, it can be known that the static voltage stability of the power grid near the Santanghu wind area in the Hami region is lower compared to the other two wind areas, and is the weak point of the voltage in the whole Hami region. Thus, the Santanghu wind area is the focus of this section, and the model built is shown in Figure 11.
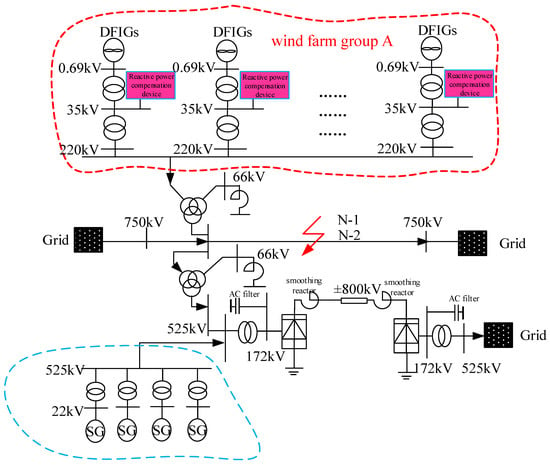
Figure 11.
Schematic diagram of the power grid structure of the wind farm group near Santanghu.
By improving the particle swarm algorithm, as discussed in Section 4 of this paper, when the fixed compensation capacity of the parallel capacitor is set to 10 MVar, the best compensation effect should be obtained when the SVG compensation capacity is 9.2 MVar.
Program 1: The program of the reactive power compensation device, SVC, and a combination of SVC and parallel capacitors are used. The system has a three-phase short-circuit fault in the middle part of the transmission line between the busbar and the grid-connected busbar at 2.5 s, and the fault is eliminated after 0.3 s resection.
Program 2: The reactive power compensation device, SVG, SVG, and shunt capacitor combination program are adopted, and other conditions are the same as program 1.
Program 3: The combination of SVC and the shunt capacitor as well as the combination of SVG and the shunt capacitor are adopted, and other conditions are the same as program 1.
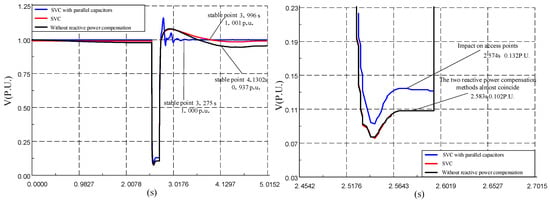
Figure 12.
P-U characteristic curve in program 1.
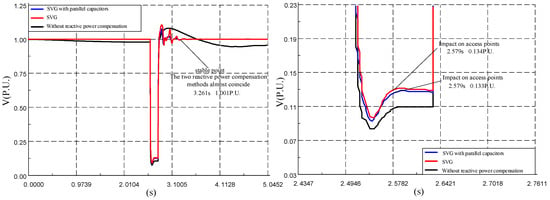
Figure 13.
P-U characteristic curve in program 2.
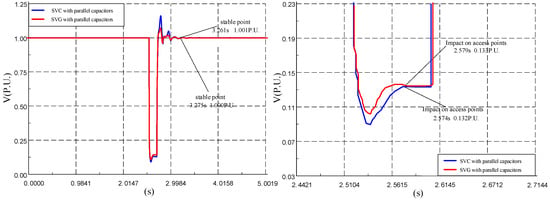
Figure 14.
P-U characteristic curve in program 3.
Program 1: When there is no reactive power compensation device in the system, the voltage drops to 0.102 P.U. at the time of the fault. At only 1.6 s after the fault, the wind farm outlet voltage bus finally reaches a new stabilization curve, though the voltage value at the moment of stabilization is only 0.937 P.U., which is much smaller than the normal voltage value. However, after adding the dynamic reactive power compensation device SVC to the system, although the fall position was basically the same as above without the reactive power compensation device, the short circuit fault was removed. This further enabled the bus to recover stability quickly, with the voltage at the controlled bus returning to 1.001 P.U. within 1.4 s after the fault was removed. When the combined SVC and shunt capacitor reactive power compensation program is added, it is obvious that the bus voltage drops to 0.132 P.U., which shows some improvement compared with the first two methods, and the bus voltage is restored to 1.00 P.U. by 0.7 s after the fault removal.
Program 2: When the dynamic reactive power compensation device SVG is added, the voltage dip is only 0.134 P.U. when the fault voltage dip occurs in the system. This is nearly 0.032 P.U. higher than without the reactive power compensation device, and the bus voltage recovery speed after the fault is removed is also much faster than without the reactive power compensation device. The bus voltage recovered to 1.001 P.U. within 0.76 s after the fault. However, when SVG is used for reactive power compensation, the tracking of bus voltage oscillation occurs, which directly causes the corresponding bus voltage to oscillate to a large extent. When the proposed combined reactive power compensation program of SVG and the shunt capacitor is used, it is similar to the dynamic reactive power compensation device SVG alone in terms of suppressing voltage dips, but after fault removal, especially in the process of bus voltage stabilization, it is obvious that the oscillation voltage is much smaller when the combined reactive power compensation program is used than when the SVG alone is used. The oscillation voltage is obviously much smaller than that of SVG alone.
Program 3: When a fault occurs in the system, both combined reactive power compensation programs perform relatively well in suppressing voltage dips, with essentially the same effect. However, when the fault is completely removed, especially in the process of bus voltage recovery, the combined reactive power compensation program of SVG and the shunt capacitor makes the oscillation of the bus voltage smaller. Therefore, its reactive power compensation performance is better than that of the combined program of SVC and the shunt capacitor.
According to the above three comparison programs, when the system fails, both the SVC + SC and the SVG + SC combination can effectively suppress voltage sags, but when the fault is removed, the SVG + SC combination performs better in the voltage recovery stage. Therefore, compared with other reactive power compensation programs, the SVG + SC combination has obvious advantages in transient voltage stability. It is also more suitable to adopt the proposed reactive power compensation combination program where the voltage is weaker in the wind power gathering area.
6. Conclusions
Firstly, this paper finds out the weak points of the power grid through the modal analysis of the gathering bus of the wind farm. Secondly, the improved particle swarm optimization algorithm is used to find the optimal reactive power installed capacity. Finally, six static voltage stability simulation verification programs were configured based on the power grid in the Hami region, and the analysis and comparison of the program simulation results verified that the combined reactive power compensation device of SVG and a capacitor bank has the best effect on static voltage stability support. Based on the power grid in the Santanghu area, three types of transient voltage stability simulation verification programs were configured, and through the analysis and comparison of the program simulation results, it was verified that the combined reactive power compensation device of SVG and a capacitor bank has the best effect on supporting transient voltage stability. The proposed combined reactive power compensation device, based on SVG and a capacitor bank, not only achieves the effect of reactive power smooth regulation, but also achieves economy of equipment. The combined reactive power compensation device not only enhances the static and transient voltage stability of the grid, but also improves the capability of wind power transmission via UHV Tianzhong DC. This study conducts a detailed study on the wind power gathering area in only the Hami region, and lacks research data from other wind power gathering areas. In the future, detailed studies on other areas will be conducted in order to verify the popularization of the proposed method.
Author Contributions
Conceptualization, Y.P. and H.W.; methodology, Y.P.; software, Q.Z.; validation, Y.P., D.N. and W.L.; formal analysis, W.L.; investigation, D.N.; resources, H.W.; data curation, Y.P.; writing—original draft preparation, Y.P.; writing—review and editing, Y.P. and H.W.; visualization, Q.Z.; supervision, H.W.; project administration, H.W.; funding acquisition, H.W. All authors have read and agreed to the published version of the manuscript.
Funding
This work was supported by the National Natural Science Foundation of China under Grant 51667020.
Institutional Review Board Statement
Not applicable.
Informed Consent Statement
Not applicable.
Data Availability Statement
Not applicable.
Conflicts of Interest
The authors declare no conflict of interest.
References
- Fan, X.C.; Wang, W.Q.; Shi, R.J.; Cheng, Z.J. Hybrid Pluripotent Coupling System with Wind and Photovoltaic-Hydrog Enenergy Storage and the Coal Chemical Industry in Hami, Xinjiang. Renew. Sustain. Energy Rev. 2017, 72, 950–960. [Google Scholar] [CrossRef]
- Xu, L.J.; Fan, X.C.; Wang, W.Q. Renewable and sustainable energy of Xinjiang and development strategy of node areas in the “Silk Road Economic Belt”. Renew. Sustain. Energy Rev. 2017, 79, 274–285. [Google Scholar] [CrossRef]
- Psarros, G.N.; Tsourakis, G.I.; Papathanassiou, S.A. Dimensioning of Reactive Power Compensation in an Autonomous Island System. Appl. Sci. 2022, 12, 2827. [Google Scholar] [CrossRef]
- Chompoo-inwai, C.; Yingvivatanapong, C.; Methaprayoon, K.; Lee, W.J. Reactive Compensation Techniques to Improve Theride-Through Capability of Wind Turbine During Disturbance. IEEE Trans. Ind. Appl. 2005, 41, 666–672. [Google Scholar] [CrossRef]
- Pereira, R.M.M.; Ferreira, C.M.M.; Barbosa, F.P.M. Comparative Study of STATCOM and SVC Performance on Dynami-c Voltage Collapse of an Electric Power System with Wind Generation. IEEE Latin Am. Trans. 2014, 12, 138–145. [Google Scholar] [CrossRef]
- Peng, Y.Z.; Wang, H.Y.; Wang, W.Q. 110 kV Artificial Short-Circuit Test and Result Analysis of Xinjiang Power Grid Wind power base. Autom. Electr. Power Syst. 2020, 44, 226–231. [Google Scholar]
- Zhao, Y.H.; Xia, Y.; Zhou, Q.Y. Coordinated Control Strategy and Configuration Scheme of Reactive Power Compensation Device in DC System of Air-fire baling DC Delivery System. Power Grid Technol. 2016, 40, 2081–2086. [Google Scholar] [CrossRef]
- Liu, Z.Y.; Zhang, Q.P.; Wang, Y.T. Research on Reactive Power Compensation Measures to Improve the Safety and Stability Level of 750kV Transmission Terminal Power Grid in Xinganqing, Northwest China. Proc. CSEE 2015, 35, 1015–1022. [Google Scholar] [CrossRef]
- Yang, G.; Li, L.; Zhang, X. Numerical and Experimental Analysis of CSR of Transformer Type for Bidirectional Reacti-ve Power Compensation. IEEE Trans. Appl. Supercond. 2016, 26, 5500704. [Google Scholar] [CrossRef]
- Joksimovic, G. Transformer Reactive Power Compensation–Fixed Capacitor Bank Calculation. IEEE Trans. Power Deliv. 2015, 30, 1629–1630. [Google Scholar] [CrossRef]
- Cheng, S.; Zhang, N.; Cui, X.; Fu, Z. Research on Reactive Compensation Technology Based on SVC-APF. In Proceedings of the 2018 IEEE 3rd Advanced Information Technology, IAEAC, Chongqing, China, 12–14 October 2018; pp. 1547–1551. [Google Scholar] [CrossRef]
- Singh, B.; Niwas, R.; Dube, S.K. Load Leveling and Voltage Control of Permanent Magnet Synchronous Generator-Based DG Set for Standalone Supply System. IEEE Trans. Ind. Inform. 2014, 10, 2034–2043. [Google Scholar] [CrossRef]
- Wang, L.; Lam, C.; Wong, M. Multifunctional Hybrid Structure of SVC and Capacitive Grid-Connected Inverter (SVC//CGCI) for Active Power Injection and Nonactive Power Compensation. IEEE Trans. Ind. Electron. 2019, 66, 1660–1670. [Google Scholar] [CrossRef]
- Wang, L.; Truong, D. Stability Enhancement of a Power System with a PMSG-Based and a DFIG-Based Offshore Wind Farm Using a SVC with an Adaptive-Network-Based Fuzzy Inference System. IEEE Trans. Ind. Electron. 2013, 60, 2799–2807. [Google Scholar] [CrossRef]
- He, H.; Lu, Z.; Guo, X.; Shi, C.; Jia, D.; Chen, C.; Guerrero, J.M. Optimized Control Strategy for Photovoltaic Hydrogen Generation System with Particle Swarm Algorithm. Energies 2022, 15, 1472. [Google Scholar] [CrossRef]
- Rather, Z.H.; Chen, Z.; Thøgersen, P.; Lund, P. Dynamic Reactive Power Compensation of Large-Scale Wind Integrated Power System. IEEE Trans. Power Syst. 2015, 30, 2516–2526. [Google Scholar] [CrossRef]
- Wang, L.; Lam, C.; Wong, M. Hybrid Structure of Static Var Compensator and Hybrid Active Power Filter (SVC//HAPF) for Medium-Voltage Heavy Loads Compensation. IEEE Trans. Ind. Electron. 2018, 65, 4432–4442. [Google Scholar] [CrossRef]
- Wang, L.; Lao, K.; Lam, C.; Wong, M. Delta-connected static var compensator (SVC) based hybrid active power filter (SVC-HAPF) and its control method. In Proceedings of the IECON 2017—43rd Annual Conference of the IEEE Industrial Electronics Society, Beijing, China, 29 October–1 November 2017; pp. 6384–6388. [Google Scholar] [CrossRef]
- Shokouhandeh, H.; Latif, S.; Irshad, S.; Ahmadi Kamarposhti, M.; Colak, I.; Eguchi, K. Optimal Management of Reactive Power Considering Voltage and Location of Control Devices Using Artificial Bee Algorithm. Appl. Sci. 2022, 12, 27. [Google Scholar] [CrossRef]
- Zhang, K.j.; Wang, X.; Bing, H. Research on Reactive Power Compensation Based on Magnetic Saturation Controllable Reactor. IEEE Access 2022, 10, 31377–31384. [Google Scholar] [CrossRef]
- Keskes, S.; Salleem, S.; Chrifi-Alaoui, L.; Ali Kammoun, M.B. Nonlinear Coordinated Passivation Control of Single Ma-chine Infinite Bus Power System with Static Var Compensator. J. Mod. Power Syst. Clean Energy 2021, 9, 1557–1565. [Google Scholar] [CrossRef]
- Ouyang, J.; Li, M.; Zhang, Z.; Tang, T. Multi-Timescale Active and Reactive Power-Coordinated Control of Large-Scale Wind Integrated Power System for Severe Wind Speed Fluctuation. IEEE Access 2019, 7, 51201–51210. [Google Scholar] [CrossRef]
- Ghosh, S.; Isbeih, Y.J.; Bhattarai, R.; Moursi, M.S.E.; El-Saadany, E.F.; Kamalasadan, S. A Dynamic Coordination Control Architecture for Reactive Power Capability Enhancement of the DFIG-Based Wind Power Generation. IEEE Trans. Power Syst. 2020, 35, 3051–3064. [Google Scholar] [CrossRef]
- Hua, Y.Z.; Xie, Q.Q.; Zheng, L.; Cui, J.d.; Shao, L.H.; Hu, W.W. Coordinated Voltage Control Strategy by Optimizing the Limited Regulation Capacity of Air Conditioners. Energies 2022, 15, 3225. [Google Scholar] [CrossRef]
- Liu, L.; Li, H.; Xue, Y.; Liu, W. Reactive Power Compensation and Optimization Strategy for Grid-Interactive Cascaded Photovoltaic Systems. IEEE Trans. Power Electron. 2015, 30, 188–202. [Google Scholar] [CrossRef]
- Xiao, M.X.; Wang, F.; He, Z.X.; Ouyang, H.L.; Hao, R.Y.F.; Xu, Q.M. Power Control and Fault Ride-Through Capability Analysis of Cascaded Star-Connected SVG under Asymmetrical Voltage Conditions. Energies 2019, 12, 2361. [Google Scholar] [CrossRef]
- Wan, Y.; Murad, M.A.A.; Liu, M.; Milano, F. Voltage Frequency Control Using SVC Devices Coupled with Voltage Dependent Loads. IEEE Trans. Power Syst. 2019, 34, 1589–1597. [Google Scholar] [CrossRef]
- Almohaimeed, S.A.; Abdel-Akher, M. Power Quality Issues and Mitigation for Electric Grids with Wind Power Penetration. Appl. Sci. 2020, 10, 8852. [Google Scholar] [CrossRef]
- She, X.; Huang, A.Q.; Wang, F.; Burgos, R. Wind Energy System with Integrated Functions of Active Power Transfer, Reactive Power Compensation, and Voltage Conversion. IEEE Trans. Ind. Electron. 2013, 60, 4512–4524. [Google Scholar] [CrossRef]
- Liu, B.; Wang, M.; Men, J.; Yang, D. Microgrid Trading Game Model Based on Blockchain Technology and Optimized Particle Swarm Algorithm. IEEE Access 2020, 8, 225602–225612. [Google Scholar] [CrossRef]
- Sun, Y.Y.; Wang, X.W.; Yang, J.J. Modified Particle Swarm Optimization with Attention-Based LSTM for Wind Power Prediction. Energies 2022, 15, 4334. [Google Scholar] [CrossRef]
- Javed, M.Y.; Khurshid, I.A.; Asghar, A.B.; Rizvi, S.T.H.; Shahid, K.; Ejsmont, K. An Efficient Estimation of Wind Turbine Output Power Using Neural Networks. Energies 2022, 15, 5210. [Google Scholar] [CrossRef]
- Martinez-Lucas, G.; Sarasua, J.I.; Fernandez-Guillamon, A.; Molina-Garcia, A. Combined hydro-wind frequency control scheme: Modal analysis and isolated power system case example. Renew. Energy 2021, 180, 1056–1072. [Google Scholar] [CrossRef]
- Dorile, P.O.; Jagessar, D.R.; Guardado, L.; McCann, R.A.; Ahanch, M. Grid strength assessment and maximum loadability of a wind-dominated power system through QV modal analysis. In Proceedings of the 2021 IEEE PES/IAS PowerAfrica, Power Africa 2021, Nairobi, Kenya, 13–27 August 2021; pp. 1–5. [Google Scholar] [CrossRef]
- Mugnaini, V.; Zanotti Fragonara, L.; Civera, M. A machine learning approach for automatic operational modal analysis. Mech. Syst. Signal Proc. 2022, 170, 108813. [Google Scholar] [CrossRef]
Publisher’s Note: MDPI stays neutral with regard to jurisdictional claims in published maps and institutional affiliations. |
© 2022 by the authors. Licensee MDPI, Basel, Switzerland. This article is an open access article distributed under the terms and conditions of the Creative Commons Attribution (CC BY) license (https://creativecommons.org/licenses/by/4.0/).