Review

Real-Time Visual Feedback in Singing Pedagogy: Current Trends and Future Directions

Faculty of Education, Department of Didactics, School Organization and Special Didactics, The National Distance Education University (UNED), 28040 Madrid, Spain
*
Author to whom correspondence should be addressed.
Appl. Sci. 2022, 12(21), 10781; https://doi.org/10.3390/app122110781
Submission received: 30 September 2022 / Revised: 18 October 2022 / Accepted: 20 October 2022 / Published: 25 October 2022
(This article belongs to the Special Issue Current Trends and Future Directions in Voice Acoustics Measurement)

Abstract

:

Featured Application

The technological tools described here can be applied to provide real-time visual feedback of different subsystems that constitute the vocal apparatus when training singers of different musical genres.

Abstract

Singing pedagogy has increasingly adopted guide awareness through the use of meaningful real-time visual feedback. Technology typically used to study the voice can also be applied in a singing lesson, aiming at facilitating students’ awareness of the three subsystems involved in voice production—breathing, oscillatory and resonatory—and their underlying physiological, aerodynamical and acoustical mechanisms. Given the variety of real-time visual feedback tools, this article provides a comprehensive overview of such tools and their current and future pedagogical applications in the voice studio. The rationale for using real-time visual feedback is discussed, including both the theoretical and practical applications of visualizing physiological, aerodynamical and acoustical aspects of voice production. The monitorization of breathing patterns is presented, displaying lung volume as the sum of abdominal and ribcage movements signals. In addition, estimates of subglottal pressure are visually displayed using a subglottal pressure meter to assist with the shaping of musical phrases in singing. As to what concerns vibratory patterns of the vocal folds and phonatory airflow, the use of electroglottography and inverse filters is applied to monitor the phonation types, voice breaks, pitch and intensity range of singers of different music genres. These vocal features, together with intentional voice distortions and intonation adjustments, are also displayed using spectrographs. As the voice is invisible to the eye, the use of real-time visual feedback is proposed as a key pedagogical approach in current and future singing lessons. The use of such an approach corroborates the current trend of developing evidence-based practices in voice education.

1. Introduction

Over the last decade, increasing numbers of singing teachers have combined traditional pedagogical tools with kinesthetic and visual feedback [1,2]. Good results have been reported from combining visual feedback with specific exercises in voice lessons [3,4]. Such pedagogical approaches are highly recommended, as they serve the current educational goals of a student-centered learning approach, known to facilitate critical reflective abilities, self-regulation and appraisal skills [5]. These competences are crucial for today’s expectations of professional lifelong learners; like other professionals, singers are expected to be able to handle fast-changing technologies, manage highly competitive global working environments and make career choices to maintain employability [6]. Given these expectations, guided awareness is currently a central point in music education; it facilitates a successful transition from a student to a professional musician [7,8]. A means to promote guided awareness is the use of technological tools that monitor voice production.
The human voice, unlike any other musical instrument, is hidden to the eye [2,9]. Therefore, one may argue that modification of neuromuscular behavior in ‘voice building’, which pertains to the pedagogical responsibilities of singing teachers, should not be limited to or solely based on personal experience [10,11,12]. Singing requires motor learning, which is facilitated by a knowledge of processes and procedures [13,14], resulting in two types of responses: (i) knowledge of performance (KP) or, in other words, knowledge of how the body develops and acts; and (ii) knowledge of results (KR), that is, the outcomes associated with a particular bodily action [9,15]. KR is of particular interest for the developing singer, as it leads to the promotion of self-regulation, increased motivation to practice and neuromotor improvement, provided that the offered feedback was objective, positive, instructive, task-orientated and meaningful [9,16].
Real-time visual feedback in singing assists with the acquisition of KR by establishing effective biomechanical behavior based on meaningful visual information [4,16,17]. When combined with verbal instruction, it has been proven to be effective in the training of particular singing skills, such as intonation [16,18]. Providing a direct visualization of the singer’s vocal response to a given instruction helps circumvent “critical points” commonly observed in more traditional voice teaching models. In these models, the student needs to wait and process the verbal instruction of the teacher before attempting a subsequent vocal response [16,19].
The increasing number of technological tools that provide real-time visual feedback of the voice justifies a comprehensive overview and discussion of their possible current and future pedagogical applications. Thus, the present article focusses on how to visualize salient aspects of voice production, ordered according to the three subsystems that constitute the vocal apparatus: respiratory, oscillatory and resonatory. The visualization of key components within these subsystems facilitates the connection between perceived voice qualities and their underlying physiological, aerodynamical and acoustical correlates, as illustrated in Figure 1. The ultimate goal is the development of both vocal and expert listening competences in singing students.
With respect to the respiratory subsystem, we will discuss real-time visual feedback of breathing patterns. This is relevant to voice pedagogy because these patterns control lung volume, which affects subglottal pressure (psub), i.e., the air pressure in the lungs [18]. Variation in psub results in changes in both sound pressure level and spectrum tilt, which determine vocal loudness [20].
With regard to the oscillatory subsystem, technology used to visually monitor variations in the tension, extension and adduction of the vocal folds will be discussed. These are relevant as they determine the number of vocal fold oscillations per second and glottal resistance. Both will determine fundamental frequency (fo) and phonation types, respectively, which are significant to qualities such as pitch, roughness, vibrato and voice timbre [18].
Finally, concerning the resonatory system, movements of the larynx, jaw, soft palate, lips and tongue, are associated with modifications of sound radiation and vocal tract resistance. Acoustically, this leads to various vocal tract transfer functions that differentiate vowels, consonants and voice timbre, characteristics that can be visualized in real-time by spectrographic displays.

2. The Respiratory Subsystem

2.1. Breathing Patterns

Breathing behaviors are crucial to determine voice quality and, therefore, play an important role in voice pedagogy. Terms such as ‘appoggio’ and ‘support’ are extensively used, referring to the coordination between laryngeal and breathing events [21,22]. Also, less efficient phonatory habits, such as the habitual use of pressed phonation (hyperfunctional), can been modified as a consequence of altering breathing patterns [23,24]. However, finding an optimal breathing strategy for a particular song is highly idiosyncratic. On the one hand, different muscular strategies can be applied depending on the singer’s individual characteristics [18]. For example, some singers mainly use the ribcage to vary lung volume, whereas others also recruit the abdominal wall to either assist with changes in the ribcage or stabilize it [25]. After inhalation and just before a phrase starts, singers have been found: (1) to apply a slight contraction of the abdominal wall [26]; or (2) to modify ribcage volume [27].
Visual feedback of transdiaphragmatic pressure can help both trained and untrained singers to direct their attention to the act of contracting the diaphragm [23]; such feedback might contribute to developing an optimal breathing strategy. Breathing patterns during singing have been monitored using magnetometers [28], optoelectronic plethysmograph [29] and respiratory inductance plethysmograph (RIP systems) [25,30]. RIP systems are relatively easy to manage and allow for the generation of real-time feedback [31]. An example is the RespTrack system (by J. Stark, available at www.columbi.se, accessed on 6 June 2022). It has two elastic belts that should be placed— one around the ribcage and the other around the abdominal wall (Figure 2). These belts are connected to a unit equipped with an on-board AD-converter and a reset button. A potentiometer knob allows for varying of the balance between the ribcage and abdominal signals so that they reflect lung volume. The unit has outputs for volumes of the ribcage (RC) and the abdomen (AB) and their sum, which, when accurately balanced, corresponds to lung volume (LV).
The RespTrack unit can be connected to a portable computer with a USB cable. The RespTrack Recorder software (Columbi Computers AB, Stockholm, Sweden) visually displays RC, AW and LV signals simultaneously in real-time. To record these signals, data acquisition devices or audio interfaces with direct current-coupled inputs are required; the signals are slowly varying and, therefore, cannot be recorded with normal sound cards.
Figure 3 displays audio, LV, RC and AW signals, recorded with a microphone and a RespTrack unit for a female jazz singer performing a phrase from an aria with, at the top, the audio signal of the phrase, and below, the LV, RC and AW signals. The red box highlights the inhalatory behavior, showing the expansion of AW and RC and the associated increase in LV. Note that the AW is contracting during the first part of the phrase. This breathing behavior is consistent with previous descriptions [26].

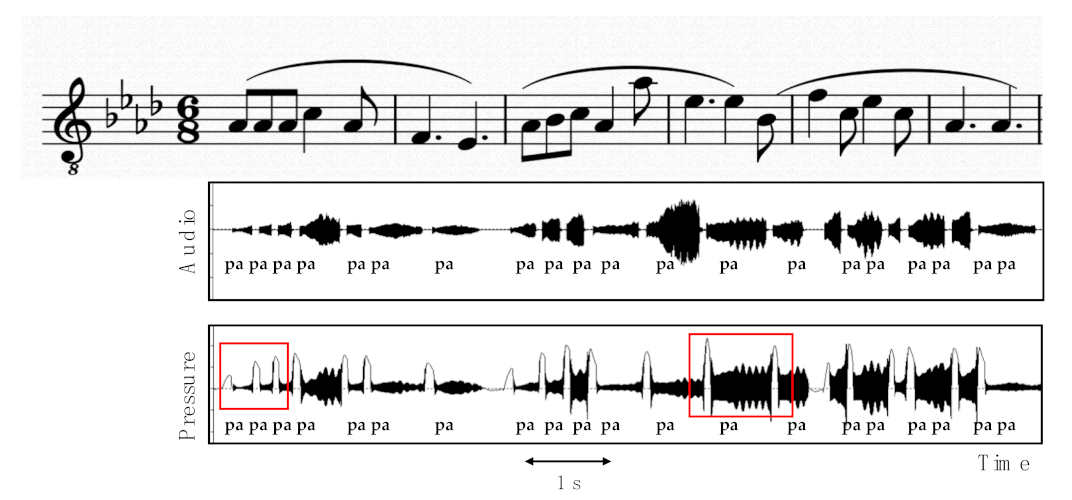
2.2. Subglottal Pressure

Breathing patterns influence lung volume, which affects the elasticity of the breathing apparatus and, hence, is significant to psub. Along with adduction, extension and tension of the vocal folds, psub is also a key physiological parameter for controlling voice quality.
Subglottal pressure is the main tool for controlling sound pressure level (SPL), which is significant to perceived vocal loudness [18,32]. Besides affecting SPL and loudness, psub also has a strong influence on vocal fold contact time and closing speed [20,33]. Acoustically speaking, increasing psub will decrease the tilt of the voice source spectrum, thus enhancing the higher frequency partials more than the lower [18,32,34]. Further, it needs to be increased with increasing fo. Also, fo is slightly affected by psub. An increase in psub tends to slightly increase fo [18]. Thus, singers need to learn to produce the correct pressure for a given pitch and loudness before the tone starts [2]. This pre-planned fine-tuning is quite essential for vocal control. One way of automatizing this ability is to practice regularly staccato and arpeggio exercises [35]. In addition, exaggerated psub may lead to stronger vocal folds collisions, which, when habitual, often produce voice disorders [33].
Subglottal pressure peaks can be estimated from the intraoral pressure during the occlusion of the consonant /p/, as this consonant is produced with an open glottis and a closed mouth so the lungs-to-lips airway is open [36].
The intraoral pressure can be captured with a small tube inserted into the corner of the mouth. If attached to a pressure meter, e.g., the PG-100E unit (Glottal Enterprises, Syracuse, NY, USA), it can be visualized while singing syllables /p + vowel/ (Figure 4). Intraoral pressure peaks can be monitored in real-time using an oscilloscope or by means of the RespTrack recorder software.
Providing real-time visual feedback of psub can be helpful not only for vocal health, but also for controlling vocal expressiveness. For example, psub is crucial to musical phrasing. Figure 5 shows audio and corresponding pressures for the first six bars of the aria, “O mio babbino caro”, from the opera Gianni Schicchi by G. Puccini. The excerpt was sung by a female soprano, substituting the lyrics with the syllable /pa/. The left red box highlights the first three notes of the first bar. Although they have the same pitch (Ab3), the psub peaks increase in value throughout this note sequence. This is required to produce a crescendo. The right red box illustrates another example of the use of psub for the purpose of musical phrasing; the highest pressure was not produced for the highest pitch in the phrase (Ab5), which occurs in an unstressed position of the bar, but in the following note (Eb5), which occurs in a stressed position in the bar (the first beat).

3. The Oscillatory Subsystem

In addition to psub, singers must learn to master vocal fold tension, extension and adduction, as these are crucial to intonation, vocal registers and phonation types. These parameters can be visualized by means of an electroglottograph (EGG), an electrolaryngograph (ELG) and an inverse filter unit. Both EGG/ ELG can show vocal fold contact variations in real-time [37,38], while an inverse filter can provide feedback of variations in glottal airflow [33].

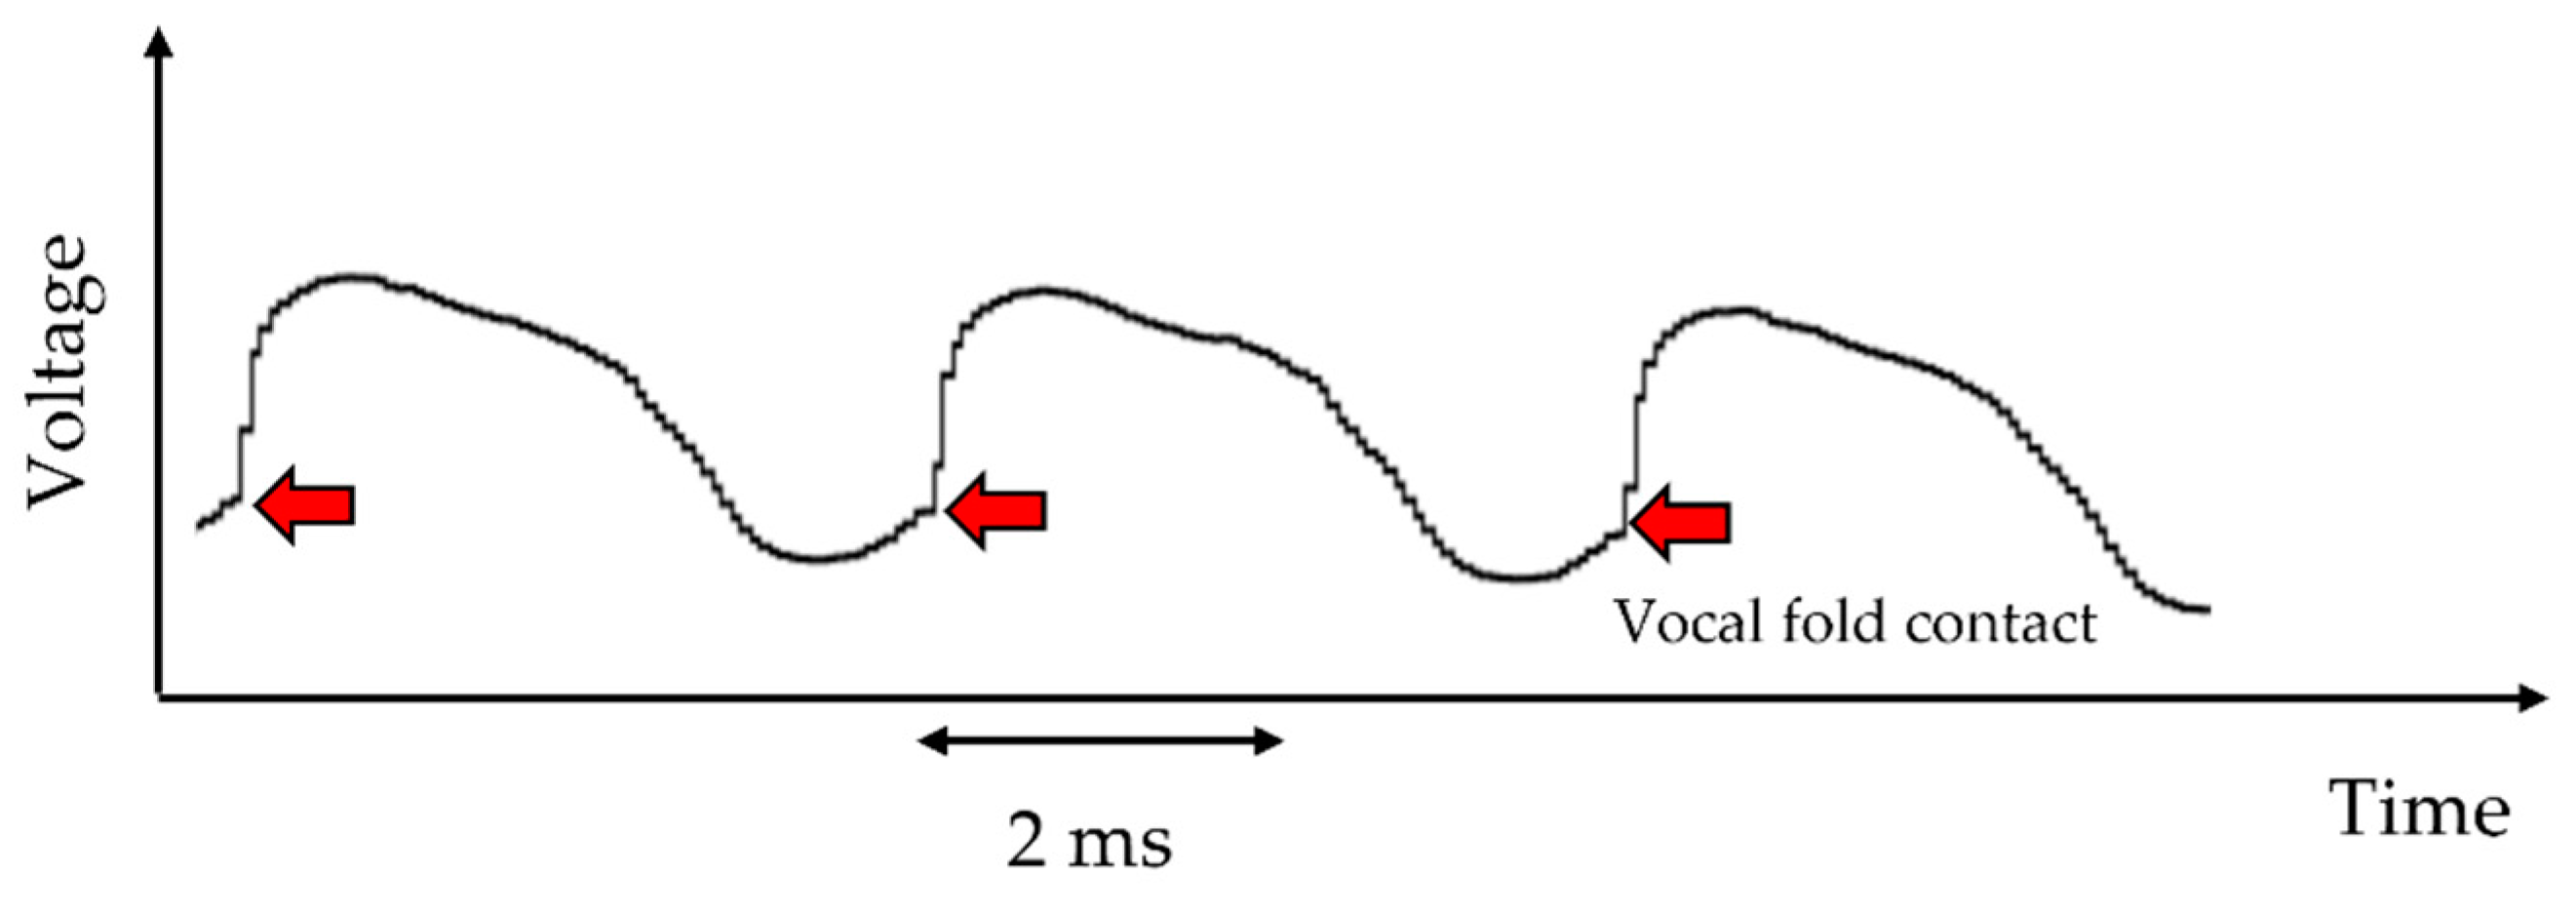
3.1. Vocal Folds Contact Variations

The electroglottograph is a non-invasive device that has two electrodes placed on each side of the thyroid notch. When the vocal folds contact, an imperceptible electric current is sent between the electrodes. The resulting signal displays vocal fold contact area in terms of a waveform corresponding to the voltage variation across the glottis; it reaches a maximum at full contact and a minimum when the vocal folds are separated (Figure 6) [37].
Real-time visual feedback of EGG shapes can be provided by several software systems, such as SpeechStudio (Laryngograph, UK) and VoceVista Video Pro (Sygyt Software, Bochum, Germany). By visualizing EGG shapes, different degrees of vocal fold adduction can be monitored. For example, the top panel of Figure 7 shows EGG signals and their corresponding derivative (dEGG), as displayed by the VoceVista Video Pro software. This was recorded from a male singer sustaining the vowel /a/ with different degrees of glottal adduction on the same pitch and sound pressure level; the longer the vocal fold contact, the broader and more knee-like the EGG shape. The rightmost bottom EGG shapes illustrate the variation from breathy (hypofunctional) to pressed (hyperfunctional) phonation. Minimal glottal adduction, as used in breathy phonation, results in a waveform with a narrow pulse. In flow phonation, the glottal closure is complete and the pulse is wider. The pulse is still wider for firmer glottal adduction, as it is in neutral and pressed phonation [34,39]. Firm phonation refers to an elevated but not maximal degree of adduction, reflected in a wide pulse that is still narrower than it is for pressed phonation.
Real-time displays of EGG signals for phonation types may be advantageous for a developing singer, for both aesthetic and vocal health reasons. As mentioned, glottal adduction determines phonation types which, in turn, determine voice timbre [20,40]. Moreover, habitual use of pressed phonation (hyperfunctional) may lead to phonotrauma [33]. Finally, in classically trained singing, flow phonation is often considered a baseline phonation type and seems to be associated with a more resonant voice quality [41].
VoceVista Video Pro software also offers a wavegram analysis of EGG (by C. Herbst) [42], showing continuous sequences rather than single EGG periods. The amplitude of the wavegram patterns reflect the pulse width and, thus, glottal adduction. The wavegram can be complemented with a display of the EGG derivative sequence (dEGG wavegram), as well as a narrow band spectrogram [38]. This combination may help a student learn how to avoid or intentionally produce phonatory events, such as register breaks. Figure 8 shows an example of one voice break during an ascending glissando sung by a male singer. The red arrows highlight fo variations, while the red box highlights a voice break. The chaotic event in the right part of both EGG and dEGG wavegrams illustrates a loss of vocal fold contact.
More recently, real-time visual feedback of EGG shapes and their related metrics are also freely available using the software FonaDyn (https://github.com/ElsevierSoftwareX/SOFTX_2019_251, accessed on 6 September 2021) [43]. Apart from clinical and voice research applications, it can also be used to map the entire dynamic and pitch range of a voice in real-time. FonaDyn combines the audio and EGG signals to create voice maps of a number of acoustic and EGG metrics and also statistical clustering of these metrics [43]. Figure 9 shows a voice map of the vocal range of a female singer. One normalized EGG shape is also displayed, representing how the contact quotient is calculated by FonaDyn; this corresponds to the total area of the normalized EGG shape during contact, i.e., the contact quotient by integration (Qci) [43]. This EGG metric can be plotted as a voice map. The voice map displays Qci at different combinations of fo (horizontal axis) and SPL (vertical axis). The color scale indicates short contacting in blue and long contacting in red.
Contact quotient by integration can be used to assess the students’ vocal progress. According to previous research, there is a tendency to increase vocal fold contact time and, hence, diminish acoustical losses with training [44]. It should be recalled, however, that an increase in psub also results in an increase in contact time [45], so very long contact times may reflect pressed phonation. Thus, EGG shapes should be interpreted in combination with perceptual evaluations of the corresponding acoustical output.
Voice maps can also display other EGG metrics, such as the normalized peak derivative (Q) and the index of contacting (Ic) (Figure 10). The former provides information on the speed of the vocal fold contact: the faster the contact, the louder the voice. The latter combines information from both Qci and Q, providing a relative indication of vocal fold collision force. It should be noted that this metric has not yet been completely validated, but it is reasonable to assume that a high Ic (red color in the map) could be related to a high collision impact stress. This is quite important, especially when the target is a more sustainable vocal technique; habitual use of high collision force tends to result in voice disorders [46,47].
Voice maps of EGG metrics using FonaDyn can also visualize phonation types in terms of pre-clustered EGG shapes. These are displayed within the yellow boxes in Figure 11, with the left representing firm (hyperfunctional) and the right representing breathy (hypofunctional) phonation. Singing students can try to model the real-time EGG shape (red boxes) such that they match the pre-clustered EGG shapes. The position of a single point in the pre-recorded voice map can be changed in real-time according to the phonation type. The grey color corresponds to vocalizations previously made to match other intended clustered shapes rather than the one selected as the current model.
Building a voice map that corresponds to a voice range profile can be time-consuming, requiring singers to phonate over their entire pitch and dynamic range without leaving large ‘holes’ in the map. Also, staying on the vowel /a/ is recommended, because modifying the vowel can affect SPL. However, the visualization of voice properties in such a dynamic range of frequencies and intensities can be worthwhile, particularly if the goal is to monitor vocal development. For example, Figure 12 shows voice maps of Q and Ic metrics for an amateur female singer. As shown in both maps, this singer has two main vibratory patterns, depending on fo and SPL. Above approximately 300 Hz, phonation is mainly achieved by reducing vocal fold adduction, as shown by a clear color change from yellow to green in the Q map (left panel) and from green to light blue in the Ic map (right panel).
As expected, EGG voice maps differ between individuals. This is particularly relevant when training a singer; teaching tools should be tailored to the student and not the other way around [48]. For example, when comparing the voice maps in Figure 10 and Figure 12, pertaining to a female trained jazz singer and to a female amateur singer, respectively, they differ substantially. As compared with the amateur singer, the jazz singer phonated with stronger vocal fold contact over a wider range of frequencies and intensities. The singer reduced vocal fold contact only at higher pitches (approximately above 500 Hz). This can be seen as the green area in the Q map, which corresponds to a slower vocal fold contact speed, and the light blue area in the Ic map, corresponding to a weaker collision force.
Voice maps can also be used to investigate whether implemented teaching approaches resulted in the intended pedagogical goals. For example, immediate effects of flow ball exercises were analyzed as differences between pre- and post-exercise voice maps. The results showed that the use of flow ball phonation assisted with the development of less pressed phonation and gentler vocal fold collisions [49].

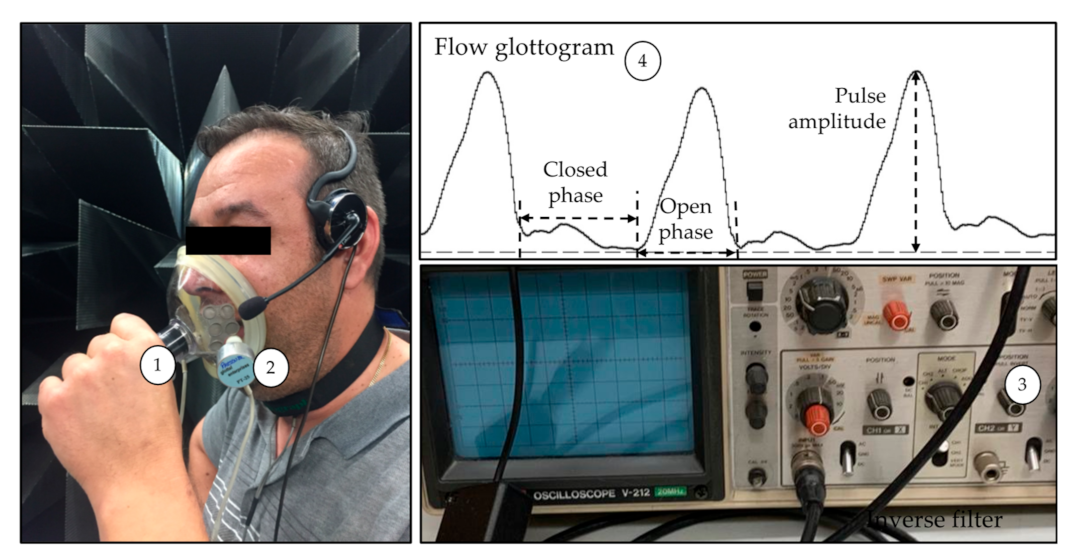
3.2. Flow Glottograms

Glottal adduction can be observed by means of a real-time inverse filter unit connected to a pressure transducer in a flow mask. When appropriately tuned, the inverse filter displays the oscillation of glottal airflow, henceforth the flow glottogram (FLOGG), which can be visualized by an oscilloscope, for example [50,51]. Tuning the inverse filter is done by frequency nobs that introduce antiresonances and, thus, cancel the effects of the vocal tract resonances on the signal [50,52,53].
An example of a typical FLOGG for a male singer is displayed in Figure 13. The right panel shows the FLOGG [18,54]. Its ascending part corresponds to the airflow increase during the glottal opening and the descending parts correspond to the airflow decrease during glottal closing. The peak amplitude is strongly related to the amplitude of the voice source fundamental, a parameter relevant to voice quality and phonation type [55].
The real-time visual feedback provided by a FLOGG has assisted both trained and untrained singers to achieve specific phonation types [33]. Figure 14 shows examples of audio, FLOGG and EGG signals typical of three phonation types—breathy, flow and pressed. FLOGG and EGG metrics reflect different, but related, aspects of phonation, as shown in this figure [56]. Breathy phonation is produced with a substantial airflow as the vocal folds fail to close completely. Thus, the quasi-closed phase is short. The EGG signal, therefore, has a long non-contact time. Pressed phonation, by contrast, is produced with firm glottal adduction and with a complete glottal closure, resulting in minimal airflow and pulse amplitude and a long, closed phase. The EGG reveals a knee-like shape in its descending part. For flow phonation, the vocal folds allow generous airflow, as shown by the large pulse amplitude, combined with complete glottal closure. The EGG lacks the sharp knee of pressed phonation.
As mentioned above, changes in lung volume are associated with changes in tracheal pull, which, in turn, tends to affect glottal adduction, a crucial parameter for phonation type [18]. From a pedagogical point of view, it should be mentioned that a student singer may be advised to avoid a pressed voice (hyperfunctional) at high pitches by producing them at high lung volumes, i.e., after a deep inhalation, or, by practicing exercises with a descending melodic pitch direction. The opposite will apply for students tending to produce a breathy phonation at higher pitches [35].

4. The Resonatory System

Among available real-time visual feedback tools with pedagogical applications, those concerning spectrographic displays are not unknown to singing teachers [4,9,17,57,58,59,60,61,62]. A commonly used method for obtaining such displays is the fast Fourier transform, which calculates the spectrum for any periodic or non-periodic signals [63]. Currently, there are several freeware recording software that can be used to display spectrograms and spectra (see for example, RTSect, by S. Granqvist, available at www.tolvan.com, Wavesurfer, available at www.speech.kth.se/wavesurfer/ or Praat, available at https://www.fon.hum.uva.nl/praat/, accessed on 20 February 2020). As teaching tools for singing, spectrographic displays should preferably be used with a condenser omnidirectional microphone [64] and an external sound card (for more information on this equipment, please visit the “EVTA zoom panel 2: equipment for Online Teaching”, available at https://www.youtube.com/watch?v=mNxRyyMVUw4, accessed on 20 February 2020).

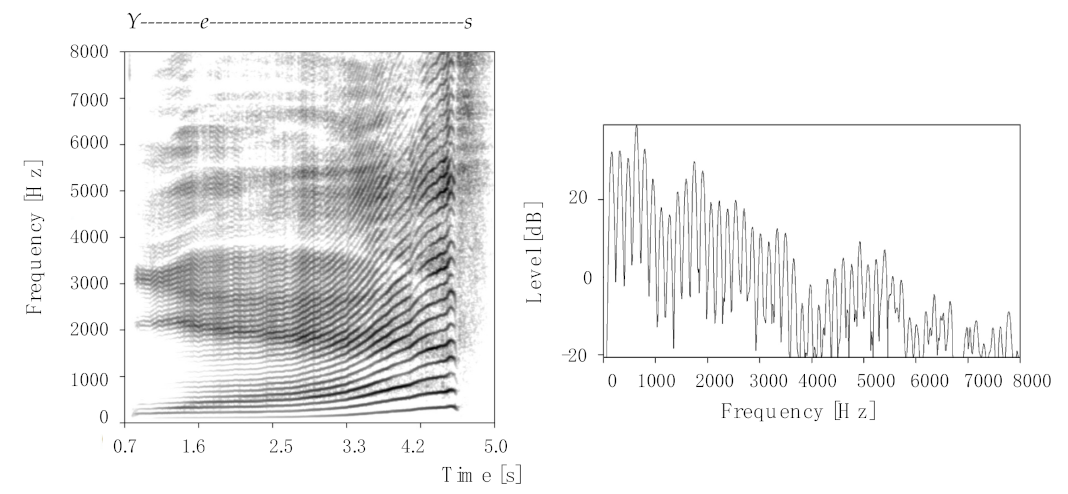
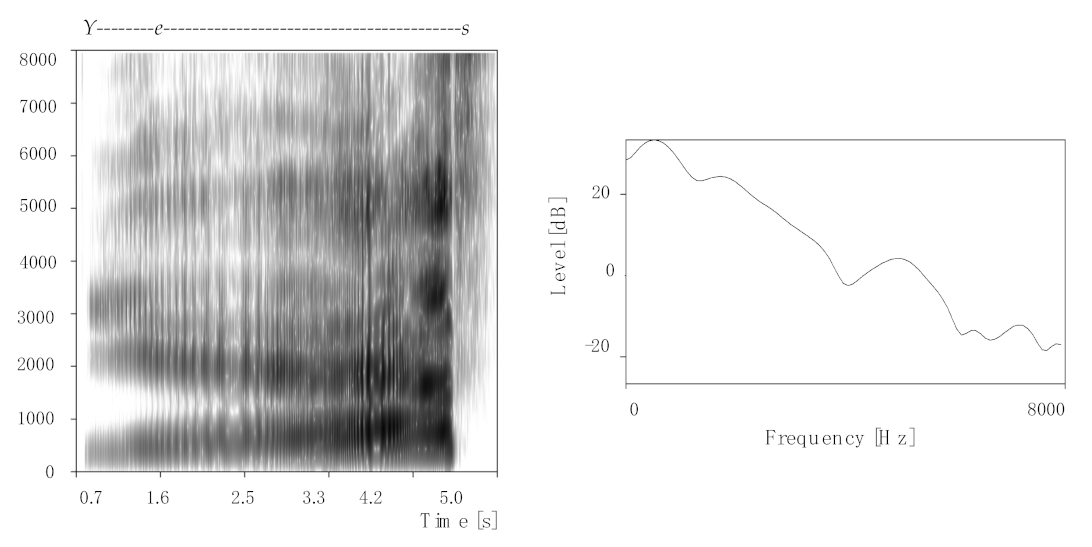
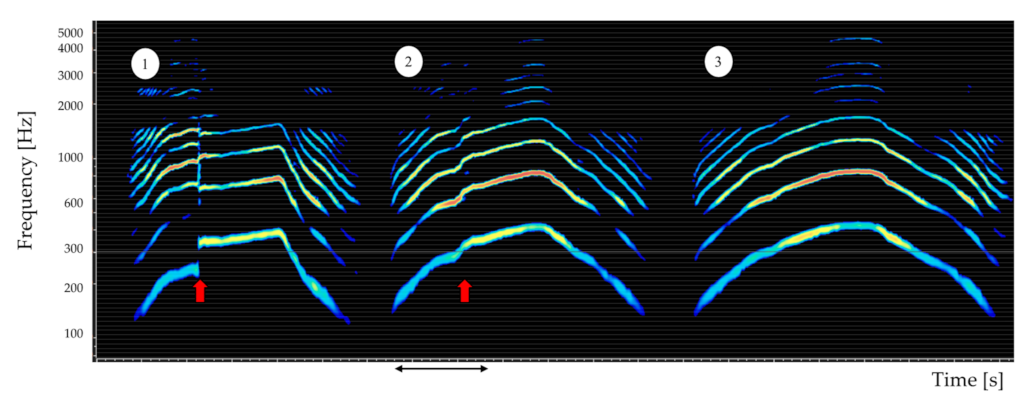
4.1. Spectrographic Displays
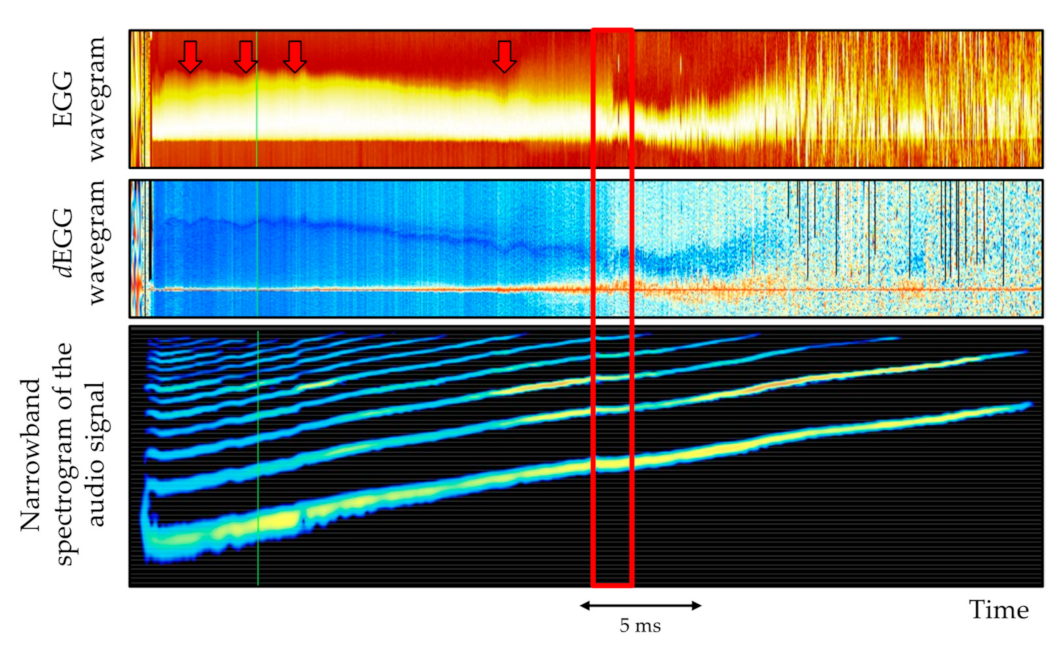
There are two types of spectrographic displays: spectrogram and spectrum. The underlying analysis can be performed with a narrow- or wide-band filter. The former provides information on individual spectral components and the latter on spectral envelope peaks and valleys.
Figure 15 provides examples of narrow-band analyses of the word yes, spoken with an ascending pitch. The left panel shows the spectrogram, where the vertical axis represents frequency and the horizontal axis shows time, with grey scale representing amplitude [4,9]. This figure visualizes the changing spectrum peaks, i.e., the formant pattern. The right panel shows the spectrum for a single moment in time (few milliseconds) of the vowel/ε/. Here, frequency is run along the horizontal axis and intensity along the vertical. The individual harmonic partials are displayed as vertical spikes.
Figure 16 visualizes a wide-band analysis of the same utterance. In the spectrogram (left panel), individual partials cannot be seen, but rather the formant peaks in the spectrum envelope. The first formant starts at a low frequency for the vowel /i/ in yes and rises to a high frequency in the vowel /ε/. At the same time, the second formant starts at a high frequency and changes to a low frequency. The spectrum (right panel) shows no individual harmonic partials, but rather spectrum envelop peaks at a given moment of the /ε/ vowel.
Both spectrograms and spectra have been applied in the voice studio for visualizing, for example, voice onset, i.e., the manner in which the voice is initiated [4]. An onset can be breathy if the increase of psub is prior to glottal adduction and vocal fold vibration. If hard, adduction occurs first, followed by a rise in psub and, hence, vocal fold vibration. The staccato onset is typically produced with a simultaneous start of glottal adduction and psub rise and, hence, also of vocal fold vibration [8]. In addition, expressive elements of singing, such as legato, vibrato, ornamentations and intonation, can also be displayed by real-time spectrographs [17,65,66,67]. Moreover, the synchronization of singing and piano accompaniment can be visualized and, thus, improved [4]. Finally, several singing teachers use spectrographs to fine-tune vocal tract resonances in accordance with the aesthetic demands of the music style [9,16,57,58,60,61,62].
Spectrograms are also quite useful for visualizing register breaks, phonation types, intentional voice distortions and intonation. The visualization of such events can be relevant to voice pedagogy for three main reasons. First, it can assist with the training of intentional voice breaks for expressive purposes, i.e., in yodeling. Second, as register breaks normally occur at specific pitches, depending on voice classification, visualizing spectrograms may help the teacher to classify a voice [68]. Third, it can aid the learning of vowel modification for equalizing voice timbre across the whole vocal range [69].

4.2. Voice Breaks

Figure 17 provides VoceVista Video Pro examples of pitch glides sung by a male singer. On the left, a case of a voice break during the ascending part of the glissando is shown, clearly observed as a significant discontinuity in all harmonic partials. As the singer learns the required adjustments to reduce voice breaks (middle), the register discontinuity is less marked. When the singer has learnt to successfully avoid a register break (right), the harmonic partials show an even change.

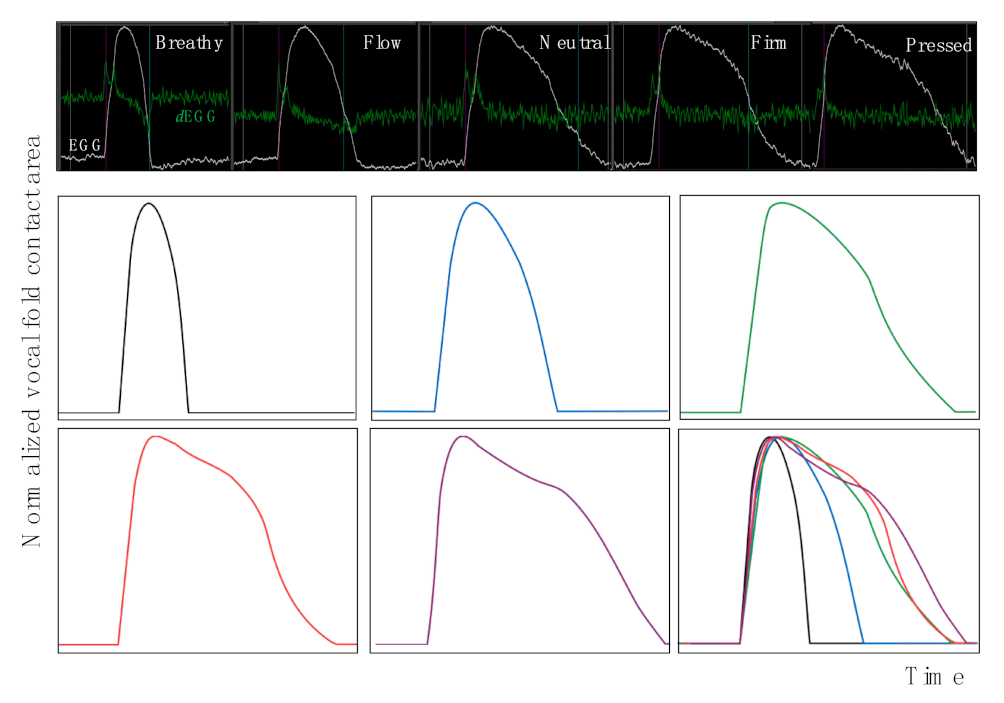
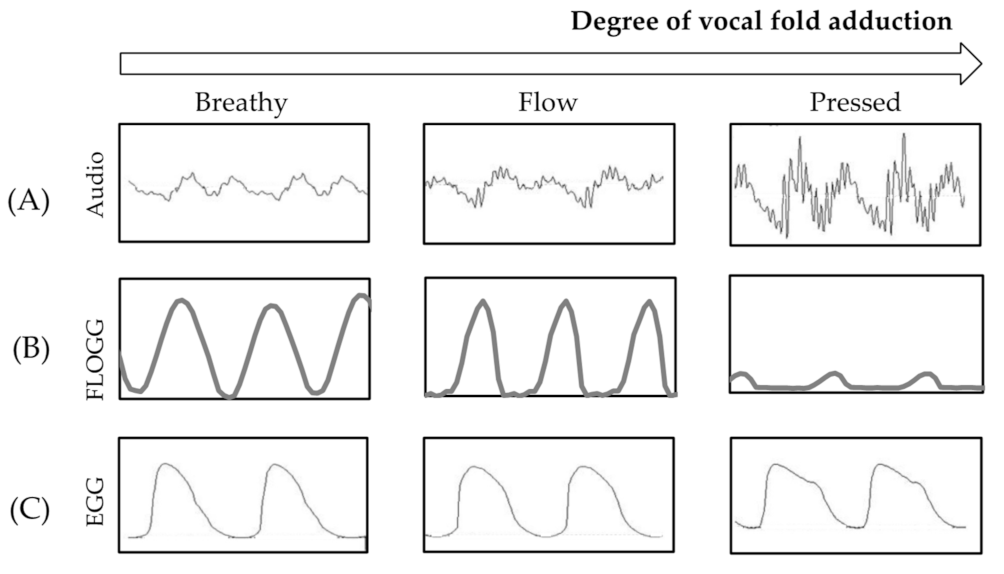
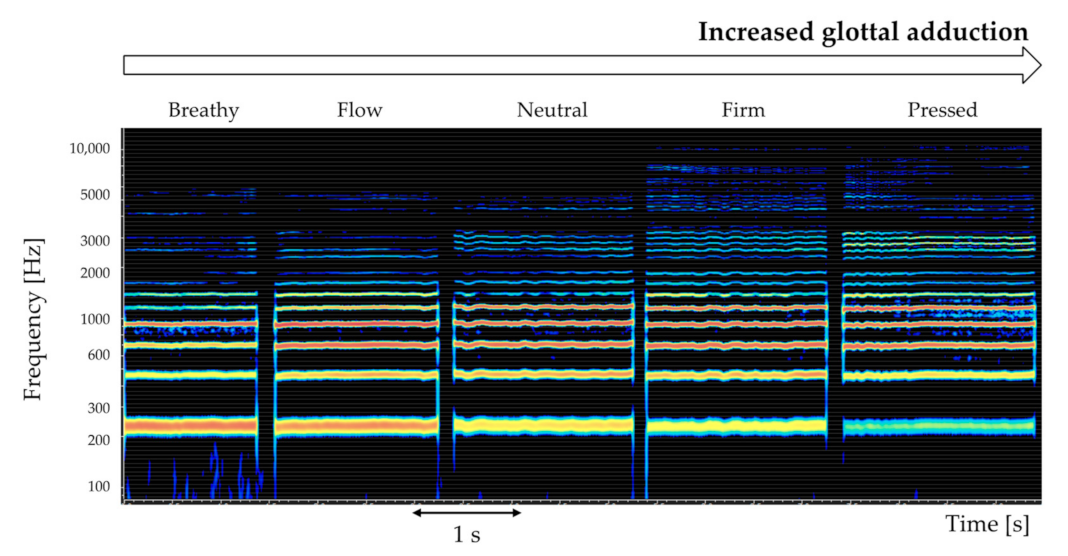
4.3. Phonation Types

Spectrographic displays can also be used to visualize phonation types. However, it should be mentioned that they will often show effects of both glottal and resonance events. For clearer displays of phonation type, EGG, ELG and FLOGG will always be preferable.
Spectrograms cannot visualize vocal tract resonances per se, but only the resulting spectrum peaks; partials with higher amplitudes appear near or at vocal tract resonances [70,71]. Figure 18 provides an example of narrow-band spectrograms of the vowel /a/ sung by a male singer, demonstrating different degrees of glottal adduction. The color scale indicates the amplitudes of the individual harmonic partials, with red representing higher and blue lower. Changing from breathy to pressed phonation is associated with a decrease in the intensity of the first partial. Simultaneously, the partials above 2 kHz increase in amplitude.
A caveat regarding real-time spectrographic displays as visual feedback is that the resulting display heavily depends on the choice and placement of the microphone. For example, dynamic microphones (also called “stage microphones”) enhance certain frequency ranges and reduce others. Moreover, their proximity effect heavily enhances low frequencies when placed near the lip opening. To circumvent these drawbacks, it is required that, for all lessons, the microphone is the same, preferably omnidirectional and placed always at same distance and position from the student’s mouth.

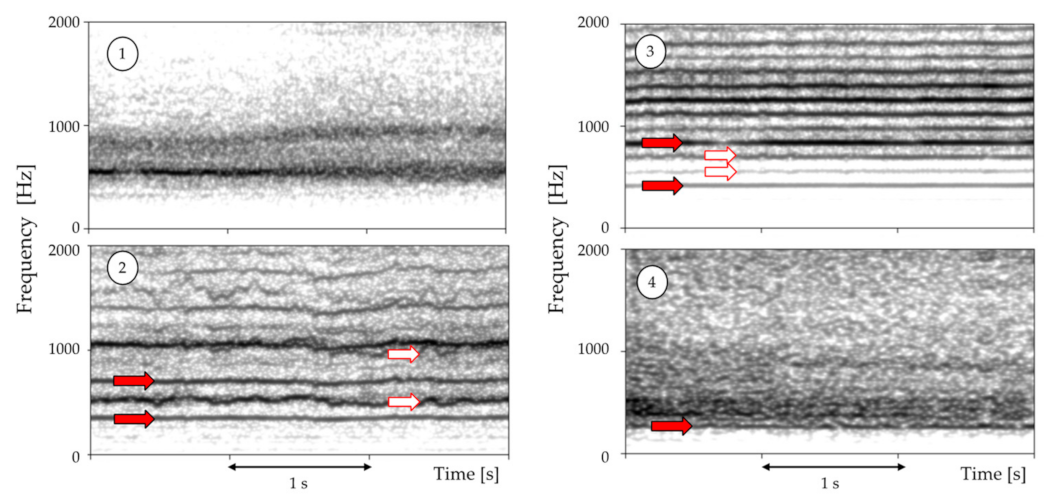
4.4. Intentional Voice Distortion
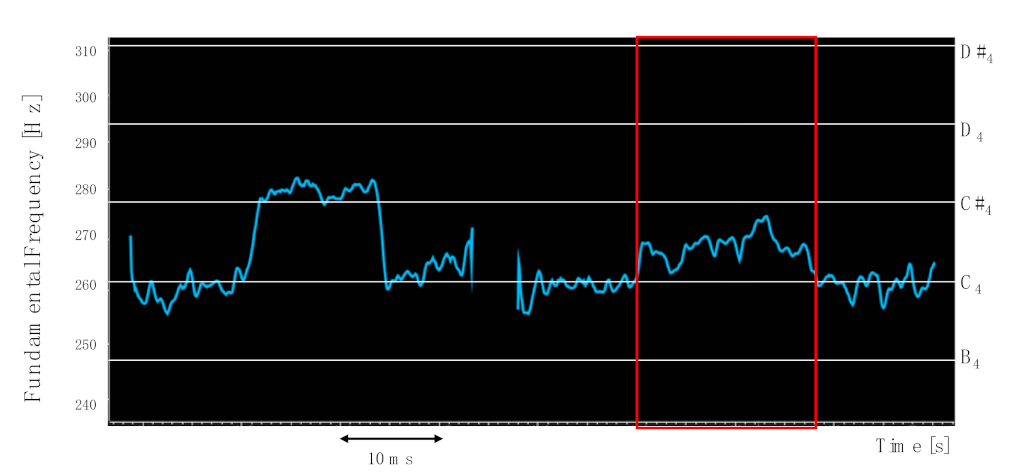
Intentional voice distortions (IVD) are used quite commonly for aesthetic and expressive purposes in several music genres and can be produced without damaging the voice [59]. They result from vocal fold aperiodic vibrations, vibration modulations or even the vibration of laryngeal or supralaryngeal structures.
IVD can be visualized by spectrograms [59,72]. Figure 19 shows examples of four different types: (1) vocal folds vibration produced by the absence of vocal folds contact; (2) vocal fold vibrations that produce two independent frequencies (red filled arrows), as well as inharmonic partials (empty red arrows); (3) periodic vocal fold vibrations that produce harmonic (filled red arrows), as well as inharmonic partials (empty red arrows) shaped by simultaneous vibrations of supralaryngeal structures; and (4) minimal vocal fold vibrations (red filled arrows) combined with disturbances produced by chaotic vibrations of supraglottal structures.
Pedagogical applications of spectrographic displays of IVD include: (i) improving the understanding of a given adjustment, e.g., the presence or absence of periodic vocal fold vibration; (ii) enhancing the stability and quality of the IVD; and (iii) facilitating the knowledge transfer from exercise outcomes to songs [59]. Red filled arrows correspond to independent frequencies; red empty arrows indicate inharmonic partials.

4.5. Intonation

Nowadays, there is a vast number of software and cell phone applications to display, in real-time, the fo contour and thus keep a visual track of pitches [57,58]. Tracking fo contour is relevant in voice pedagogy, as intonation is used as an expressive tool [73,74]. Most of these applications quantify fo in semitones, thus disregarding finer pitch effects. This excludes the possibility of monitoring microtonal effects, which are used in many singing styles [74,75,76]. The VoceVista Video Pro software, by contrast, can also visualize micro-intonation effects; Figure 20 shows an example of this. Each semitone is marked by a white line and the fo contour by the blue curve. The fifth tone (red rectangle) is centered between the pitches C4 and C#4.

5. Conclusions

The current article aimed at a comprehensive review of technological tools with pedagogical applications for the teaching of singing students. The benefits of the real-time visualization of physiological, aerodynamic and acoustical aspects of voice production in singing were discussed, especially concerning knowledge of results. As in physiological voice therapy programs, teaching singing can strive for the achievement of an aesthetic acoustical output grounded in the balance between the three subsystems of voice production—respiratory, oscillatory and resonatory—which is a goal clearly facilitated by their visualization in real-time. The voice is a unique musical instrument, hidden to the naked eye. Therefore, teaching singing requires pedagogical approaches, among which guided awareness enhanced by meaningful feedback constitutes an example.
The RespTrack system allows for the guided awareness of breathing patterns, crucial to control lung volume and, thus, the elasticity of the breathing apparatus and psub. This physiological parameter controls SPL, a significant acoustical parameter for the perceived vocal loudness. Still related to the respiratory system, the use of psub meters in singing lessons were also discussed for the purposes of monitoring behaviors related to vocal health and musical phrasing.
As to what concerns the oscillatory subsystem, the visualization of the vibratory patterns of the vocal folds helps master vocal fold tension, extension and adduction at different degrees of vocal loudness. Real-time visual feedback can be provided by means of an electroglottograph, electrolaryngograph and an inverse filter. Displays using these technologies allow for the visualization of phonation types and an understanding of associated voice qualities. The recent FonaDyn software also allows the display of voice maps, which is crucial to monitor vocal development and control glottal adduction at different pitches and intensities.
Real-time visual feedback of adjustments of the resonatory system can be provided by spectrographic displays. Several software can be used for this purpose, showing details of voice onset, intonation, legato, vibrato, ornamentations, synchronization between singing and piano accompaniment and formant tuning or de-tuning, according to the aesthetic requirements of the singing style. Voice breaks, phonation types, intentional voice distortions and intonation are other parameters relevant to voice quality and expressiveness in singing that can be displayed in real-time using spectrographic displays.
Singing teachers have used spectrographic displays since the 1970s; such displays have become more accessible, are easy to handle and can be complemented by real-time visual feedback on breathing behaviors and vibratory patterns of the vocal folds during singing. We believe that, in the near future, the use of technology in singing lessons can become a gold standard for the development of effective pedagogical approaches. Singing pedagogy is already moving towards the development of science-based practices. Like any other musical instrument, the voice may be impaired by misuse; however, unlike other instruments, the voice cannot be replaced if ‘ruined’. It is a teacher’s pedagogical responsibility to guide the student in achieving individual vocal homeostasis simultaneously with the fulfilment of artistic expectations. This guidance greatly benefits from real-time visual feedback displays such as the ones reviewed here.

Author Contributions

Conceptualization, F.M.B.L. and M.B.F.; software, F.M.B.L. and M.B.F.; investigation, F.M.B.L. and M.B.F.; resources, F.M.B.L. and M.B.F.; writing—original draft preparation, F.M.B.L. and M.B.F.; writing—review and editing, F.M.B.L. and M.B.F.; project administration, F.M.B.L.; funding acquisition, F.M.B.L. All authors have read and agreed to the published version of the manuscript.

Funding

This research was funded by the PROGRAMA DE ATRACCIÓN DE TALENTO INVESTIGADOR A LA COMUNIDAD DE MADRID, Spain, reference number 2018-T1/HUM-12172.

Informed Consent Statement

Informed consent was obtained from all subjects involved in the study.

Data Availability Statement

Not applicable.

Acknowledgments

The authors would like to acknowledge Johan Sundberg for his advice on figures and proofreading.

Conflicts of Interest

The authors declare no conflict of interest.

References

  1. Harrison, S.D.; O’Bryan, J. Teaching Singing in the 21st Century; Springer: Dordrecht, The Netherlands, 2014; ISBN 978-94-017-8850-2. [Google Scholar]
  2. Lã, F.M.B.; Gill, B.P. Physiology and Its Impact on the Performance of Singing. In The Oxford Handbook of Singing; Welch, G.F., Howard, D.M., Nix, J., Eds.; Oxford University Press: Oxford, UK, 2019; pp. 66–84. ISBN 9780199660773. [Google Scholar]
  3. Herbst, C.T.; Qiu, Q.; Schutte, H.K.; Švec, J.G. Membranous and cartilaginous vocal fold adduction in singing. J. Acoust. Soc. Am. 2011, 129, 2253–2262. [Google Scholar] [CrossRef] [PubMed]
  4. Lã, F.M.B. Teaching Singing and Technology. In VOX HUMANA, Fachzeitschrift für Gesangspädagogik; Basa, K.S., Ed.; BDG e.V: Nürnberg, Germany, 2012; pp. 88–109. ISBN 1861-065X. [Google Scholar]
  5. Lennon, M.; Reed, G. Instrumental and vocal teacher education: Competences, roles and curricula. Music Educ. Res. 2012, 14, 285–308. [Google Scholar] [CrossRef]
  6. Lã, F.M.B. Prácticas Vocales Basadas En La Evidencia. Rev. Logop. Foniatr. Audiol. 2017, 37, 180–187. [Google Scholar] [CrossRef]
  7. Hallam, S.; Gaunt, H. Preparing for Success: A Practical Guide for Young Musicians; Institute of Education-London: London, UK, 2012; ISBN 978-0854739035. [Google Scholar]
  8. Lã, F.M.B. Learning to Be a Professional. In Advanced Musical Performance: Investigations in Higher Education Learning; Routledge: Abingdon, UK, 2016; pp. 297–318. ISBN 9781597560788. [Google Scholar]
  9. Nair, G.; Howard, D.M.; Welch, G.F. Practical Voice Analyses and Their Application in the Studio. In The Oxford Handbook of Singing; Oxford University Press: Oxford, UK, 2019; pp. 1048–1070. [Google Scholar] [CrossRef]
  10. Gill, B.P.; Herbst, C.T. Voice pedagogy—What do we need? Logop. Phoniatr. Vocology 2015, 41, 168–173. [Google Scholar] [CrossRef] [PubMed]
  11. Ragan, K. Defining Evidence-Based Voice Pedagogy: A New Framework. Voice Pedagog. 2018, 75, 157–160. [Google Scholar]
  12. Crocco, L.; Meyer, D. Motor Learning and Teaching Singing: An Overview. J. Sing. 2021, 77, 693–702. [Google Scholar]
  13. Titze, I.R.; Abbott, K.V. Vocology: The Science and Practice of Voice Habilitation; National Center for Voice and Speech: Salt Lake City, UT, USA, 2012; ISBN 978-0-9834771-1-2. [Google Scholar]
  14. Roth, D.F.; Verdolini Abbott, K. Vocal Health and Singing Pedagogy: Considerations from Biology and Motor Learning. In Teaching Singing in the 21St Century; Harrison, S.D., O’Bryan, J., Eds.; Springer: Dordrecht, The Netherlands, 2014; pp. 69–89. [Google Scholar]
  15. Crocco, L.; McCabe, P.; Madill, C. Principles of Motor Learning in Classical Singing Teaching. J. Voice 2019, 34, 567–581. [Google Scholar] [CrossRef]
  16. Welch, G.F.; Howard, D.M.; Himonides, E.; Brereton, J. Real-time feedback in the singing studio: An innovatory action-research project using new voice technology. Music Educ. Res. 2005, 7, 225–249. [Google Scholar] [CrossRef]
  17. Howard, D.M. Technology for Real-Time Visual Feedback In Singing Lessons. Res. Stud. Music Educ. 2005, 24, 40–57. [Google Scholar] [CrossRef]
  18. Sundberg, J. The Science of the Singing Voice; Northern Illinois University Press: Dekalb, IL, USA, 1987. [Google Scholar]
  19. Howard, D.M.; Brereton, J.; Welch, G.F.; Himonides, E.; DeCosta, M.; Williams, J.; Howard, A.W. Are Real-Time Displays of Benefit in the Singing Studio? An Exploratory Study. J. Voice 2006, 21, 20–34. [Google Scholar] [CrossRef]
  20. Sundberg, J. Flow Glottogram and Subglottal Pressure Relationship in Singers and Untrained Voices. J. Voice 2017, 32, 23–31. [Google Scholar] [CrossRef] [PubMed]
  21. Stark, J. Bel Canto: A History of Vocal Pedagogy (Review), 1st ed.; University of Toronto Press: Toronto, ON, Canada, 1999; Volume 58, ISBN 0802086144. [Google Scholar]
  22. Herbst, C.T. A Review of Singing Voice Subsystem Interactions—Toward an Extended Physiological Model of “Support”. J. Voice 2016, 31, 249.e13–249.e19. [Google Scholar] [CrossRef]
  23. Leanderson, R.; Sundberg, J.; von Euler, C. Breathing muscle activity and subglottal pressure dynamics in singing and speech. J. Voice 1987, 1, 258–261. [Google Scholar] [CrossRef]
  24. Iwarsson, J.; Thomasson, M.; Sundberg, J. Effects of lung volume on the glottal voice source. J. Voice 1998, 12, 424–433. [Google Scholar] [CrossRef]
  25. Thomasson, M.; Sundberg, J. Consistency of Inhalatory Breathing Patterns in Professional Operatic Singers. J. Voice 2001, 15, 373–383. [Google Scholar] [CrossRef]
  26. Salomoni, S.; Hoorn, W.V.D.; Hodges, P. Breathing and Singing: Objective Characterization of Breathing Patterns in Classical Singers. PLoS ONE 2016, 11, e0155084. [Google Scholar] [CrossRef] [Green Version]
  27. Watson, P.J.; Hixon, T.J. Respiratory Kinematics in Classical (Opera) Singers. J. Speech Lang. Hear. Res. 1985, 28, 104–122. [Google Scholar] [CrossRef] [PubMed]
  28. Thorpe, C.; Cala, S.J.; Chapman, J.; Davis, P.J. Patterns of breath support in projection of the singing voice. J. Voice 2001, 15, 86–104. [Google Scholar] [CrossRef]
  29. Binazzi, B.; Lanini, B.; Bianchi, R.; Romagnoli, I.; Nerini, M.; Gigliotti, F.; Duranti, R.; Milic-Emili, J.; Scano, G. Breathing pattern and kinematics in normal subjects during speech, singing and loud whispering. Acta Physiol. 2006, 186, 233–246. [Google Scholar] [CrossRef]
  30. Ternström, S.; D’Amario, S.; Selamtzis, A. Effects of the Lung Volume on the Electroglottographic Waveform in Trained Female Singers. J. Voice 2020, 34, 485.e1–485.e21. [Google Scholar] [CrossRef] [Green Version]
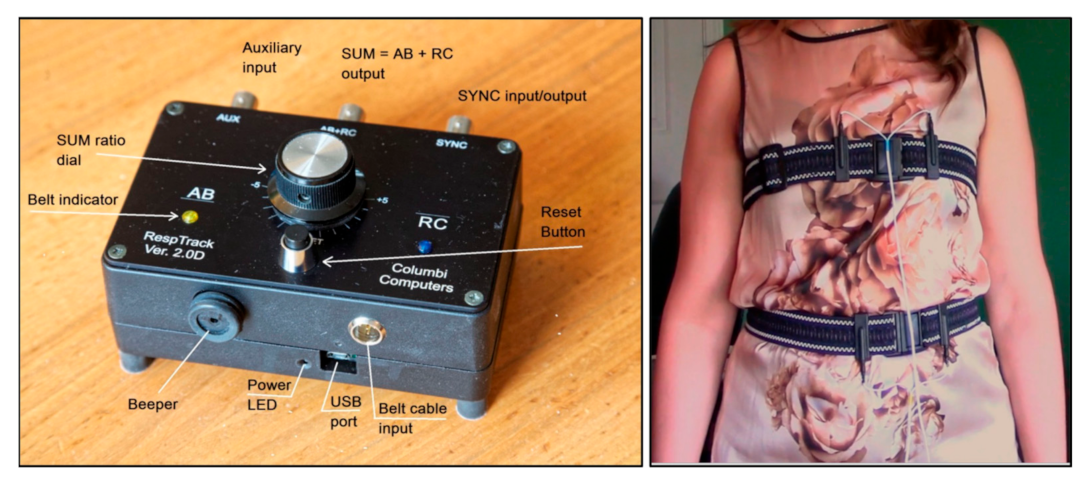
  31. Heldner, M.; Włodarczak, M.; Branderud, P.; Stark, J. The RespTrack System. In Proceedings of the 1st International Seminar on the Foundations of Speech—Pausing, Breathing and Voice, Sønderborg, Denmark, 1–3 December 2019; pp. 16–18. [Google Scholar]
  32. Titze, I.R. Simulation of Vocal Loudness Regulation with Lung Pressure, Vocal Fold Adduction, and Source-Airway Interaction. J. Voice 2021, in press. [Google Scholar] [CrossRef] [PubMed]
  33. Patel, R.R.; Sundberg, J.; Gill, B.; Lã, F.M. Glottal Airflow and Glottal Area Waveform Characteristics of Flow Phonation in Untrained Vocally Healthy Adults. J. Voice 2020, 36, 140.e1–140.e21. [Google Scholar] [CrossRef] [PubMed]
  34. Herbst, C.T.; Hess, M.; Müller, F.; Švec, J.G.; Sundberg, J. Glottal Adduction and Subglottal Pressure in Singing. J. Voice 2015, 29, 391–402. [Google Scholar] [CrossRef] [PubMed]
  35. Welch, G.F. Solo Voice. In The Oxford Handbook of Music Performance; Parncutt, R., McPherson, G.E., Eds.; Oxford University Press: Oxford, UK, 2002; Volume 2, pp. 377–398. ISBN 9780195138108. [Google Scholar]
  36. Sundberg, J.; La, F.M.B. Avaliação Aerodinâmica e Acústica Da Fonte De Voz. In Fundamentos e Atualidades Em Voz Profissional; Lopes, L., Moreti, F., Zambon, F., Vaiano, T., Eds.; Thieme Revinter: São Paulo, Brazil, 2021; ISBN 9786555721171. [Google Scholar]
  37. Herbst, C.T. Electroglottography—An Update. J. Voice 2020, 34, 503–526. [Google Scholar] [CrossRef] [PubMed]
  38. Herbst, C.T.; Howard, D.; Schlömicher-Thier, J. Using Electroglottographic Real-Time Feedback to Control Posterior Glottal Adduction during Phonation. J. Voice 2010, 24, 72–85. [Google Scholar] [CrossRef]
  39. Sundberg, J. Vocal Fold Vibration Patterns and Modes of Phonation. Folia Phoniatr. Logop. 1995, 47, 218–228. [Google Scholar] [CrossRef]
  40. Herbst, C.T.; Howard, D.M.; Svec, J.G. The Sound Source in Singing: Basic Principles and Muscular Adjustments for Fine-Tuning Vocal Timbre. In The Oxford Handbook of Singing; Oxford University Press: Oxford, UK, 2019; pp. 109–144. [Google Scholar]
  41. Verdolini, K.; Druker, D.G.; Palmer, P.M.; Samawi, H. Laryngeal adduction in resonant voice. J. Voice 1998, 12, 315–327. [Google Scholar] [CrossRef]
  42. Herbst, C.T.; Fitch, W.T.S.; Švec, J.G. Electroglottographic wavegrams: A technique for visualizing vocal fold dynamics noninvasively. J. Acoust. Soc. Am. 2010, 128, 3070–3078. [Google Scholar] [CrossRef] [Green Version]
  43. Ternström, S.; Johansson, D.; Selamtzis, A. FonaDyn—A system for real-time analysis of the electroglottogram, over the voice range. SoftwareX 2018, 7, 74–80. [Google Scholar] [CrossRef]
  44. Howard, D. Variation of electrolaryngographically derived closed quotient for trained and untrained adult female singers. J. Voice 1995, 9, 163–172. [Google Scholar] [CrossRef]
  45. Sundberg, J.; Andersson, M.; Hultqvist, C. Effects of subglottal pressure variation on professional baritone singers’ voice sources. J. Acoust. Soc. Am. 1999, 105, 1965–1971. [Google Scholar] [CrossRef] [PubMed]
  46. Jiang, J.J.; Titze, I.R. Measurement of vocal fold intraglottal pressure and impact stress. J. Voice 1994, 8, 132–144. [Google Scholar] [CrossRef]
  47. Verdolini, K.; Hess, M.M.; Titze, I.R.; Bierhals, W.; Gross, M. Investigation of vocal fold impact stress in human subjects. J. Voice 1999, 13, 184–202. [Google Scholar] [CrossRef]
  48. Lã, F.M.; Wistbacka, G.; Andrade, P.A.; Granqvist, S. Real-Time Visual Feedback of Airflow in Voice Training: Aerodynamic Properties of Two Flow Ball Devices. J. Voice 2016, 31, 390.e1–390.e8. [Google Scholar] [CrossRef] [Green Version]
  49. Lã, F.M.; Ternström, S. Flow ball-assisted voice training: Immediate effects on vocal fold contacting. Biomed. Signal Process. Control 2020, 62, 102064. [Google Scholar] [CrossRef]
  50. Alku, P. Glottal Inverse Filtering Analysis of Human Voice Production—A Review of Estimation and Parameterization Methods of the Glottal Excitation and Their Applications. Sadhana-Acad. Proc. Eng. Sci. 2011, 36, 623–650. [Google Scholar] [CrossRef]
  51. Hertegård, S.; Gauffin, J.; Sundberg, J. Open and covered singing as studied by means of fiberoptics, inverse filtering, and spectral analysis. J. Voice 1990, 4, 220–230. [Google Scholar] [CrossRef]
  52. Lindestad, P.; Södersten, M.; Merker, B.; Granqvist, S. Voice Source Characteristics in Mongolian “Throat Singing” Studied with High-Speed Imaging Technique, Acoustic Spectra, and Inverse Filtering. J. Voice 2001, 15, 78–85. [Google Scholar] [CrossRef]
  53. Sundberg, J.; Gramming, P.; Lovetri, J. Comparisons of pharynx, source, formant, and pressure characteristics in operatic and musical theatre singing. J. Voice 1993, 7, 301–310. [Google Scholar] [CrossRef]
  54. Švec, J.G.; Schutte, H.K.; Chen, C.J.; Titze, I.R. Integrative Insights into the Myoelastic-Aerodynamic Theory and Acoustics of Phonation. Scientific Tribute to Donald G. Miller. J. Voice 2021, in press. [Google Scholar] [CrossRef]
  55. Lã, F.M.B.; Sundberg, J.; Granqvist, S. Augmented visual-feedback of airflow: Immediate effects on voice-source characteristics of students of singing. Psychol. Music 2021, 50, 933–944. [Google Scholar] [CrossRef]
  56. Lã, F.M.; Sundberg, J. Contact Quotient Versus Closed Quotient: A Comparative Study on Professional Male Singers. J. Voice 2014, 29, 148–154. [Google Scholar] [CrossRef] [PubMed]
  57. Callaghan, J.; Thorpe, W.; Doorn, J. van The Science of Singing and Seeing. In Proceedings of the Conference on Interdisciplinary Musicology—Proceedings, Graz, Austria, 15–18 April 2004; pp. 1–10. [Google Scholar]
  58. Erickson, H.M. Mobile Apps and Biofeedback in Voice Pedagogy. J. Sing. 2021, 77, 485–500. [Google Scholar]
  59. Fiuza, M.B.; Pecoraro, G. Distorções Vocais No Canto: Aspectos Fisiológicos, Estilísticos e Acústicos. In Fundamentos e Atualidades Em Voz Profissional; Lopes, L., Moreti, F., Zambon, F., Vaiano, T., Eds.; Thieme Revinter: São Paulo, Brazil, 2021. [Google Scholar]
  60. Schutte, H.; Miller, R. Resonance Balance in Register Categories of the Singing Voice: A Spectral Analysis Study. Folia Phoniatr. Logop. 1984, 36, 289–295. [Google Scholar] [CrossRef] [PubMed]
  61. Mcquade, M. Dynamic Uses of Spectrographic Analysis in Choral Rehearsals and the Voice Studio. J. Assoc. Technol. Music. Instr. 2020, 1, 1–20. [Google Scholar]
  62. Titze, I.R.; Worley, A.S.; Story, B.H. Source-Vocal Tract Interaction in Female Operatic Singing and Theater Belting. J. Sing. 2011, 67, 561–572. [Google Scholar]
  63. Howard, D.M.; Murphy, D.T. Voice Science, Acoustics and Recording; Plural Publishing: San Diego, CA, USA, 2008; ISBN 1597560782. [Google Scholar]
  64. Svec, J.G.; Granqvist, S. Guidelines for Selecting Microphones for Human Voice Production Research. Am. J. Speech-Lang. Pathol. 2010, 19, 356–368. [Google Scholar] [CrossRef]
  65. Hoppe, D.; Sadakata, M.; Desain, P. Development of real-time visual feedback assistance in singing training: A review. J. Comput. Assist. Learn. 2006, 22, 308–316. [Google Scholar] [CrossRef]
  66. Callaghan, J.; Lee, K.; Thorpe, W.; Wilson, P. Learning to Sing in Tune: Does Real-Time Visual Feedback Help? J. Interdiscip. Music. Stud. 2008, 2, 157–172. [Google Scholar]
  67. Jeanneteau, M.; Hanna, N.; Almeida, A.; Smith, J.; Wolfe, J. Using visual feedback to tune the second vocal tract resonance for singing in the high soprano range. Logop. Phoniatr. Vocology 2020, 47, 25–34. [Google Scholar] [CrossRef]
  68. Miller, R. The Structure of Singing: System and Art in Vocal Technique; Schirmer Books: New York, NY, USA, 1986; ISBN 978-0534255350. [Google Scholar]
  69. Bozeman, K.W. Practical Vocal Acoustics. In Pedagogic Applications for Teachers and Singers; Pendragon Press: Hillsdale, MI, USA, 2013. [Google Scholar]
  70. Borch, D.Z.; Sundberg, J. Some Phonatory and Resonatory Characteristics of the Rock, Pop, Soul, and Swedish Dance Band Styles of Singing. J. Voice 2011, 25, 532–537. [Google Scholar] [CrossRef] [PubMed]
  71. Sundberg, J.; Lã, F.; Gill, B.P. Formant Tuning Strategies in Professional Male Opera Singers. J. Voice 2013, 27, 278–288. [Google Scholar] [CrossRef]
  72. Neubauer, J.; Edgerton, M.; Herzel, H. Nonlinear phenomena in contemporary vocal music. J. Voice 2004, 18, 1–12. [Google Scholar] [CrossRef]
  73. Sundberg, J.; Lã, F.M.; Himonides, E. Intonation and Expressivity: A Single Case Study of Classical Western Singing. J. Voice 2013, 27, 391.e1–391.e8. [Google Scholar] [CrossRef] [PubMed]
  74. Sundberg, J. Some Observations on Operatic Singer’s Intonation. Interdiscip. Stud. Musicol. 2011, 10, 47–60. [Google Scholar]
  75. Chadwin, D.J. Applying Microtonality to Pop Songwriting: A Study of Microtones in Pop Music Original. Master’s Thesis, University of Huddersfield, Huddersfield, Germany, 2019. [Google Scholar]
  76. Cutting, C.B. Microtonal Analysis of “Blue Notes” and the Blues Scale. Empir. Music. Rev. 2019, 13, 84–99. [Google Scholar] [CrossRef]
Figure 1. Schematic representation of the subsystems that constitute the vocal apparatus and underlying physiological, aerodynamical, acoustical and perceptual correlates.
Applsci 12 10781 g001
Figure 2. (Left) RespTrack unit; (Right) placement of belts monitoring ribcage and abdominal wall movements.
Applsci 12 10781 g002
Figure 3. Audio, lung volume (LV), ribcage (RC) and abdominal wall (AW) signals from a phrase of “Summertime” (G. Gershwin), as sung by a female jazz singer and recorded by an omnidirectional microphone and the RespTrack System. Respiratory signals are displayed by the software Sopran (by S. Granqvist, www.tolvan.com, accessed on 6 September 2021): (1) inhalation; (2) phonation; (3) abdominal wall contraction, see text.
Applsci 12 10781 g003
Figure 4. (1) Subglottal pressures for individual notes of an arpeggio, recorded by a PG-100E unit (Glottal Enterprises, USA) and displayed by the software Sopran. (2) Plastic tube placed in the corner of the mouth. (3) PG-100E pressure meter unit (Glottal Enterprises, New York, NY, USA).
Applsci 12 10781 g004
Figure 5. Recording of the first 6 bars of the aria, “O mio babbino caro”, from the opera Gianni Schicchi by G. Puccini, sung by a female soprano on the syllable /pa/. Intraoral pressures were recorded with the PG-100E unit and audio with an omnidirectional microphone. Both signals are displayed with the software Sopran. Red boxes highlight relevant pressure events related to musical phrasing (see text).
Applsci 12 10781 g005
Figure 6. Electroglottograph signal for three vocal fold vibratory cycles recorded by an electrolaryngograph, here displayed by the software Sopran. The sudden voltage changes (red arrows) represent an initiation of vocal fold contact.
Applsci 12 10781 g006
Figure 7. Electrolaryngograph (EGG) shapes displayed by the VoceVista Video Pro software for a single vibratory cycle of a male singer sustaining the vowel /a/ with the indicated phonation types. The top panel shows EGG shapes with their corresponding derivative (dEGG) for the indicated phonation types. In the middle and lower panels, the waveforms of the indicated phonation types are shown with greater detail, with normalized amplitudes and differentiated by colored lines for comparisons.
Applsci 12 10781 g007
Figure 8. VoceVista Video Pro display of an ascending glissando sung by a male. Top panel: EGG wavegram. Middle panel: dEGG wavegram. Bottom panel: narrow band spectrogram. Red box highlights a voice break and the red arrow highlights fo variations.
Applsci 12 10781 g008
Figure 9. Typical voice map displayed in FonaDyn, showing sound pressure level (SPL) as a function of fundamental frequency (fo) for the metric of contact quotient by integration (Qci): (1) Electroglottograph (EGG) shape showing the calculation of Qci; (2) Real-time voice map of a female singer.
Applsci 12 10781 g009
Figure 10. Real-time voice maps of a female singer’s voice displayed by FonaDyn software. (Left panel): normalized peak derivative (Q), with red and green indicating high and low values, respectively. (Right panel): index of contact (Ic), with red and blue indicating high and low values, respectively.
Applsci 12 10781 g010
Figure 11. Examples of voice maps displayed by FonaDyn software for (1) firm and (2) breathy phonation, produced by a male singer while observing the EGG waveshape (red boxes) in real-time and trying to match the EGG waveshape model of the intended phonation type (yellow boxes). The result is also presented in real-time as an individual cell in the voice map (red arrows). Note: SPL, sound pressure level; fo, fundamental frequency.
Applsci 12 10781 g011
Figure 12. Voice maps of a female amateur singer displayed by FonaDyn software. (Left panel): normalized peak derivative (Q), with red and green indicating high and low values, respectively. (Right panel): index of contact (Ic), with red and blue indicating high and low values, respectively.
Applsci 12 10781 g012
Figure 13. Left panel: (1) a flow mask with a (2) pressure transducer. Its output can be connected to (3) an inverse filter unit and the resulting (4) FLOGG can be displayed on an oscilloscope.
Applsci 12 10781 g013
Figure 14. Examples of three phonation types—breathy, flow and pressed—and corresponding (A) audio signals, (B) flow glottograms (FLOGG) and (C) EGG shapes, displayed by the software Sopran, recorded with an omnidirectional microphone, a flow mask and an electrolaryngograph. The shapes of both FLOGG and EGG signals reflect different types of phonation.
Applsci 12 10781 g014
Figure 15. Spectrographic display of the word “yes”, pronounced in an ascending pitch, displayed by the software Praat (by P. Boersma and D. Weenink) as a narrow-band spectrogram (left) and a narrow-band spectrum (right).
Applsci 12 10781 g015
Figure 16. Spectrographic display of the word “yes”, pronounced in an ascending pitch, displayed by the software Praat as a narrow-band spectrogram (left) and a narrow-band spectrum (right).
Applsci 12 10781 g016
Figure 17. VoceVista Video Pro narrow-band spectrograms of ascending and descending glissandi sung by a male singer (1) with a voice break (red arrow), (2) with a minor instability (red arrow) and (3) with a smooth transition between registers.
Applsci 12 10781 g017
Figure 18. Narrow-band spectrograms of different degrees of glottal adduction displayed by Voce Vista Pro software. Glottal adduction increases from left (breathy) to right (pressed).
Applsci 12 10781 g018
Figure 19. Spectrograms of different intentional voice distortions displayed by Praat software. Four examples are presented: (1) irregular aperiodic phonation; (2) biphonation; (3) subharmonic phonation with a predominance of harmonic components; (4) subharmonic phonation with a predominance of noise components (adapted from [59] with authors’ permission).
Applsci 12 10781 g019
Figure 20. VoceVista Video Pro software display of a male singer practicing micro-intonation between pitches C4 and C#4, marked within the red box.
Applsci 12 10781 g020
Publisher’s Note: MDPI stays neutral with regard to jurisdictional claims in published maps and institutional affiliations.

