Article

Variation Mechanism and Prediction of Soil–Water Characteristic Curve Parameters of Low-Liquid-Limit Silty Clay under Freeze–Thaw Cycles

1
College of Transportation, Jilin University, Changchun 130022, China
2
WISDRI City Construction Engineering & Research Incorporation Ltd., Wuhan 430000, China
*
Author to whom correspondence should be addressed.
Appl. Sci. 2022, 12(21), 10713; https://doi.org/10.3390/app122110713
Submission received: 25 July 2022 / Revised: 5 September 2022 / Accepted: 20 October 2022 / Published: 22 October 2022
(This article belongs to the Section Civil Engineering)

Abstract

:
The soil–water characteristic curve (SWCC) is a key input for the numerical simulation of geotechnical engineering. It contains the basic information needed to describe the mechanical behavior of unsaturated soil. In order to study the variation of the SWCC characteristics and its mechanism after the freeze–thaw (F–T) process of low-liquid-limit silty clay in seasonally frozen regions, the SWCC of the soil samples subjected to zero, one, three, five, and seven F–T cycles at three dry densities were measured; then the microstructure was scanned by scanning electron microscopy (SEM) to analyze the relationship between the characteristic parameters of the SWCC and the microstructure after F–T cycles. Finally, according to the mathematical law of characteristic parameters, the prediction equation for the parameters of the SWCC considering the F–T cycles was established, which has a suitable fitting effect with the experimental data. The result shows that with the increase in F–T cycles, the air-entry value (AEV) and residual saturation (RS) decrease gradually, while the saturated water content and the moisture-losing rate of the transition section slightly increased. According to the microstructure analysis, it is due to the F–T process that the compacted soil sample has cracks, the entire plate structure is destroyed, and thus the arrangement between the soil particles becomes looser, and the porosity and average pore size increase. This study can provide data support and references for the design of low-liquid-limit silty clay foundation engineering in seasonally freezing regions.

1. Introduction

A reliability analysis of unsaturated soils is an important field in geotechnical engineering. Considering the unsaturated characteristics of soil in geotechnical design, a safer and more reliable solution can be obtained. The SWCC indicates the ability of the soil to maintain itself relative to the change in matric suction, and contains the basic information needed to describe the mechanical behavior of unsaturated soil [1]. The soil-freezing characteristic curve (SFCC) is a mathematical description of the relationship between unfrozen-water content and negative temperature in frozen soil. During soil freezing and thawing, unfrozen water and porous ice coexist in the soil, and temperature is the main factor determining their respective amounts [2]. Some studies have discussed the similarity between the SWCC and the SFCC [3]. During the wetting and drying process of unsaturated soil, soil-water-potential energy will decrease with the increase in soil water content, which is similar to the change in the potential energy gradient when liquid water turns into ice in saturated frozen soil. In addition, the SWCC also shows hysteresis behavior similar to SFCC [4]. Some characteristic parameters, such as AEV, slope at the inflection point, residual moisture content, and residual suction, are often used to correlate the SWCC and some soil properties such as shear strength and permeability. In addition, these parameters also play a key role in the seepage analysis and the soil balance humidity estimation [5,6]. Wijaya et al. [7] studied the influence of soil shrinkage on AEV by constructing a shrinkage curve, and proposed a method to determine the AEV of soil with shrinkage during drying. The matric suction of unsaturated residual soil varies with the change in climatic conditions, while the change in climatic conditions is related to the cyclic dry and wet conditions, resulting in hysteresis of SWCC. The hysteretic effect of the unsaturated residual soil slope is studied by Kristo et al. [8], and the difference of pore water pressure and water content under dry and wet conditions is studied by means of numerical seepage and stability analysis. The results show that no matter whether the soil is wet or dry, the numerical analysis results incorporated with the combined SWCC are more consistent with those with only wetting the SWCC than those with drying the SWCC only. A bimodal SWCC model considering a dual-porosity structure to describe the drying process of granular soil was proposed by Li et al. [9]. The new SWCC model shows a strong ability to fit the SWCC from gravel to silt.
Because it takes a lot of time to measure the SWCC, many previous studies [10,11,12,13,14,15] have focused on modeling the SWCC and other unsaturated-soil properties in order to find a method to estimate the SWCC accurately. One of the most influential is the equation established by Fredlund et al. [10] which describes the relationship between suction and soil-pore characteristics through the induction and analysis of the experimental data. It is widely used in a variety of soils and has a good fitting effect in the whole suction range. Some studies [16,17] have shown that the parameters for the grain size distribution with bimodal soil of the SWCC equation can be calculated by the dry density and volumetric water content in the grain size distribution.
The reliable estimation of the mean value, standard deviation, and correlation probability density function of the SWCC fitting parameters are important tools to solve the problem of the reliability design of unsaturated-soil mechanics. By optimizing the average and standard deviation, Raghuram et al. [18] make the error of quantile, percentile, and cumulative distribution functions as low as possible, so as to provide the most suitable continuous probability density function. The mean, coefficient of variation, and probability density function are recommended for the reliability design of unsaturated soil slopes. Under the assumption of geometric symmetry, Zhou et al. [19] proposed a more accurate prediction method for SWCCs based on the analysis of the SWCC shape features of S, C-1 and C-2 critical points. Compared with the SWCC obtained from experiments, it is shown that the improved prediction method can effectively reduce the deviation of direct-fitting-empirical equations for finite-class soil data. Qian et al. [20] proposed a formula for determining the SWCC characteristic parameters, and discussed the relationship between the SWCC characteristic parameters and the fitting parameters of the model from Fredlund et al. [10] and Van Genuchten [10] for calculation and analysis, which aimed at replacing the traditional graphic method and providing consistent results. G Tao proposed a sample size scale effect coefficient to predict AEVs [21]. There are also some researchers [22,23,24,25] who used a variety of statistical mathematical methods to evaluate and modify the accuracy of the proposed prediction model. A better estimate of the SWCC is called upon to require more accurate consideration of soil types, properties, and water temperature states in nature.
Owing to the fact that the engineering project is actually affected by natural factors (e.g., moisture fluctuation and climate variation), many researchers have devoted themselves to the study of suction changes in the wet and dry paths, as well as different temperature states, and the causes of such changes in recent years. Fredlund et al. [26] examined the error of in situ soil estimation using a SWCC without considering the wet and dry effect, and gave a median and suction range that could estimate the in situ soil suction. His estimation results showed that the error of estimating suction clay of in situ soil by a SWCC was higher than that of sandy soil. Hong et al. [27] studied the hysteresis in the growth and dewetting of five types of sandy soils. The results showed that the lower dry density and coarser soil particles would result in lower intake and residual values. Ng et al. [28] used the phenomenological method to model the lag SWCC in any dry and wet path. Between 5 °C and 35 °C, soil-suction tests at different temperature gradients showed that temperature had little effect on soil suction. For the arid and semi-arid seasonal permafrost regions, the freezing and thawing process would cause various structural changes inside the subgrade soil, which seriously affected the strength and soil characteristics of the subgrade [29,30,31]. Some studies need to be continued, for example, by establishing a general prediction model suitable for various types of soil freezing and thawing characteristics, so that the F–T characteristics of the required soil samples could be quickly obtained in the absence of data.
In order to explore the changes of the soil–water characteristic curve after the F–T cycles, this study is aims the development of unsaturated low-liquid-limit silty clay in seasonally frozen soil areas. The matric suction of three different dry densities was measured by the filter-paper method, and the change in suction of the soil was tested after zero, one, three, five, and seven F–T cycles. The change in pores produced by F–T cycles of different cycles was analyzed by an SEM, and the changes in suction caused by F–T of the soil were analyzed.

2. Materials and Methods

2.1. Materials

The silty clay used in the test was taken from the homogeneous soil layer of a 10 m deep foundation pit in a large construction site near South Lake in Changchun. The soil is relatively uniform and pale yellow. The basic physical indicators are shown in Table 1. The parameters in the table are measured according to [32].
The particle size distribution of silty clay is shown in Figure 1a and the photograph of the silty clay is shown in Figure 1b.
Firstly, the soil was passed through a 2 mm sieve. Soil samples with moisture contents of 15%, 20%, 25%, 30%, 35% and 40% were prepared after drying and cooling, respectively. Secondly, the soil samples at each moisture content level were compacted by static compaction to reach the dry density of 1.73 g/cm3, 1.67 g/cm3, and 1.62 g/cm3 (the corresponding compaction degree is 96%, 93% and 90%), respectively. Finally, the soil samples with different water content and compaction degrees were cut into cylindrical specimens of ring-cutter size.

2.2. F–T Cycle Test Method

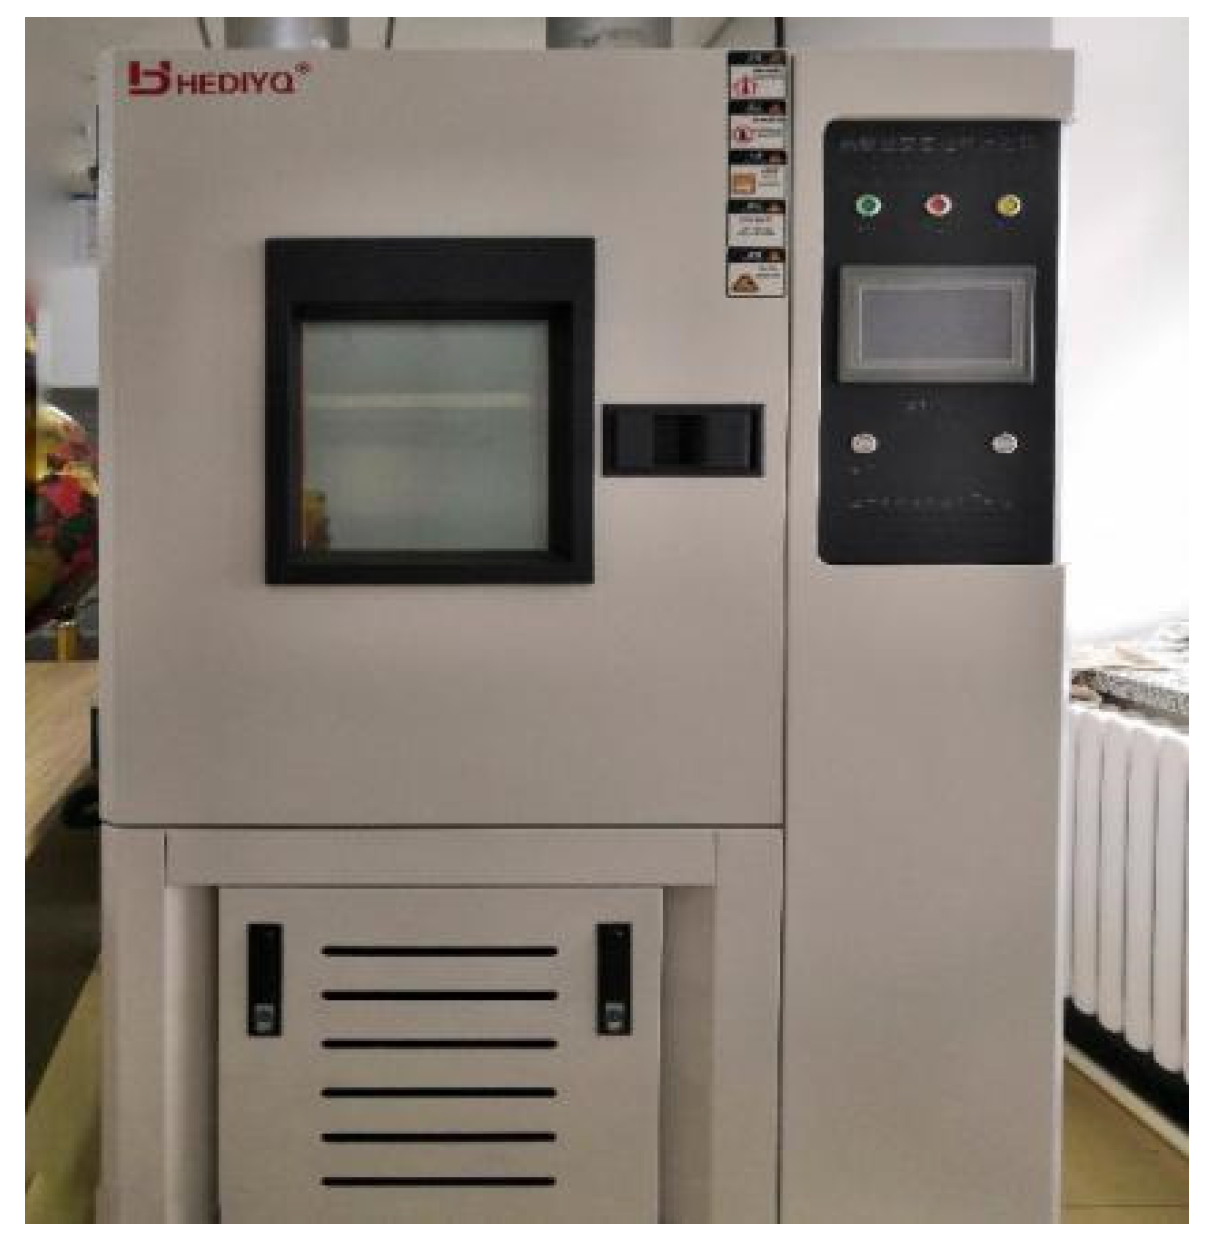
The freezing process was completed by using a constant-humidity thermostatic chamber (Figure 2). The temperature was set to −20 °C for 24 h to complete the freezing process. The thawing process was carried out at a constant temperature of 20 °C for 24 h. Freezing for 24 h and thawing for 24 h is one F–T cycle [33]. In order to keep the moisture content of the sample unchanged during the experiment, the sample is wrapped with a waterproof film to prevent moisture-content change. Each sample was subjected to zero, one, three, five, and seven cycles, and then their matric suction was measured.

2.3. Matric Suction Test Method

Due to the large range of matric suction measured in this study–and the unified test standards of all samples should be strictly ensured during measurement–the filter paper method was used to measure matric suction.
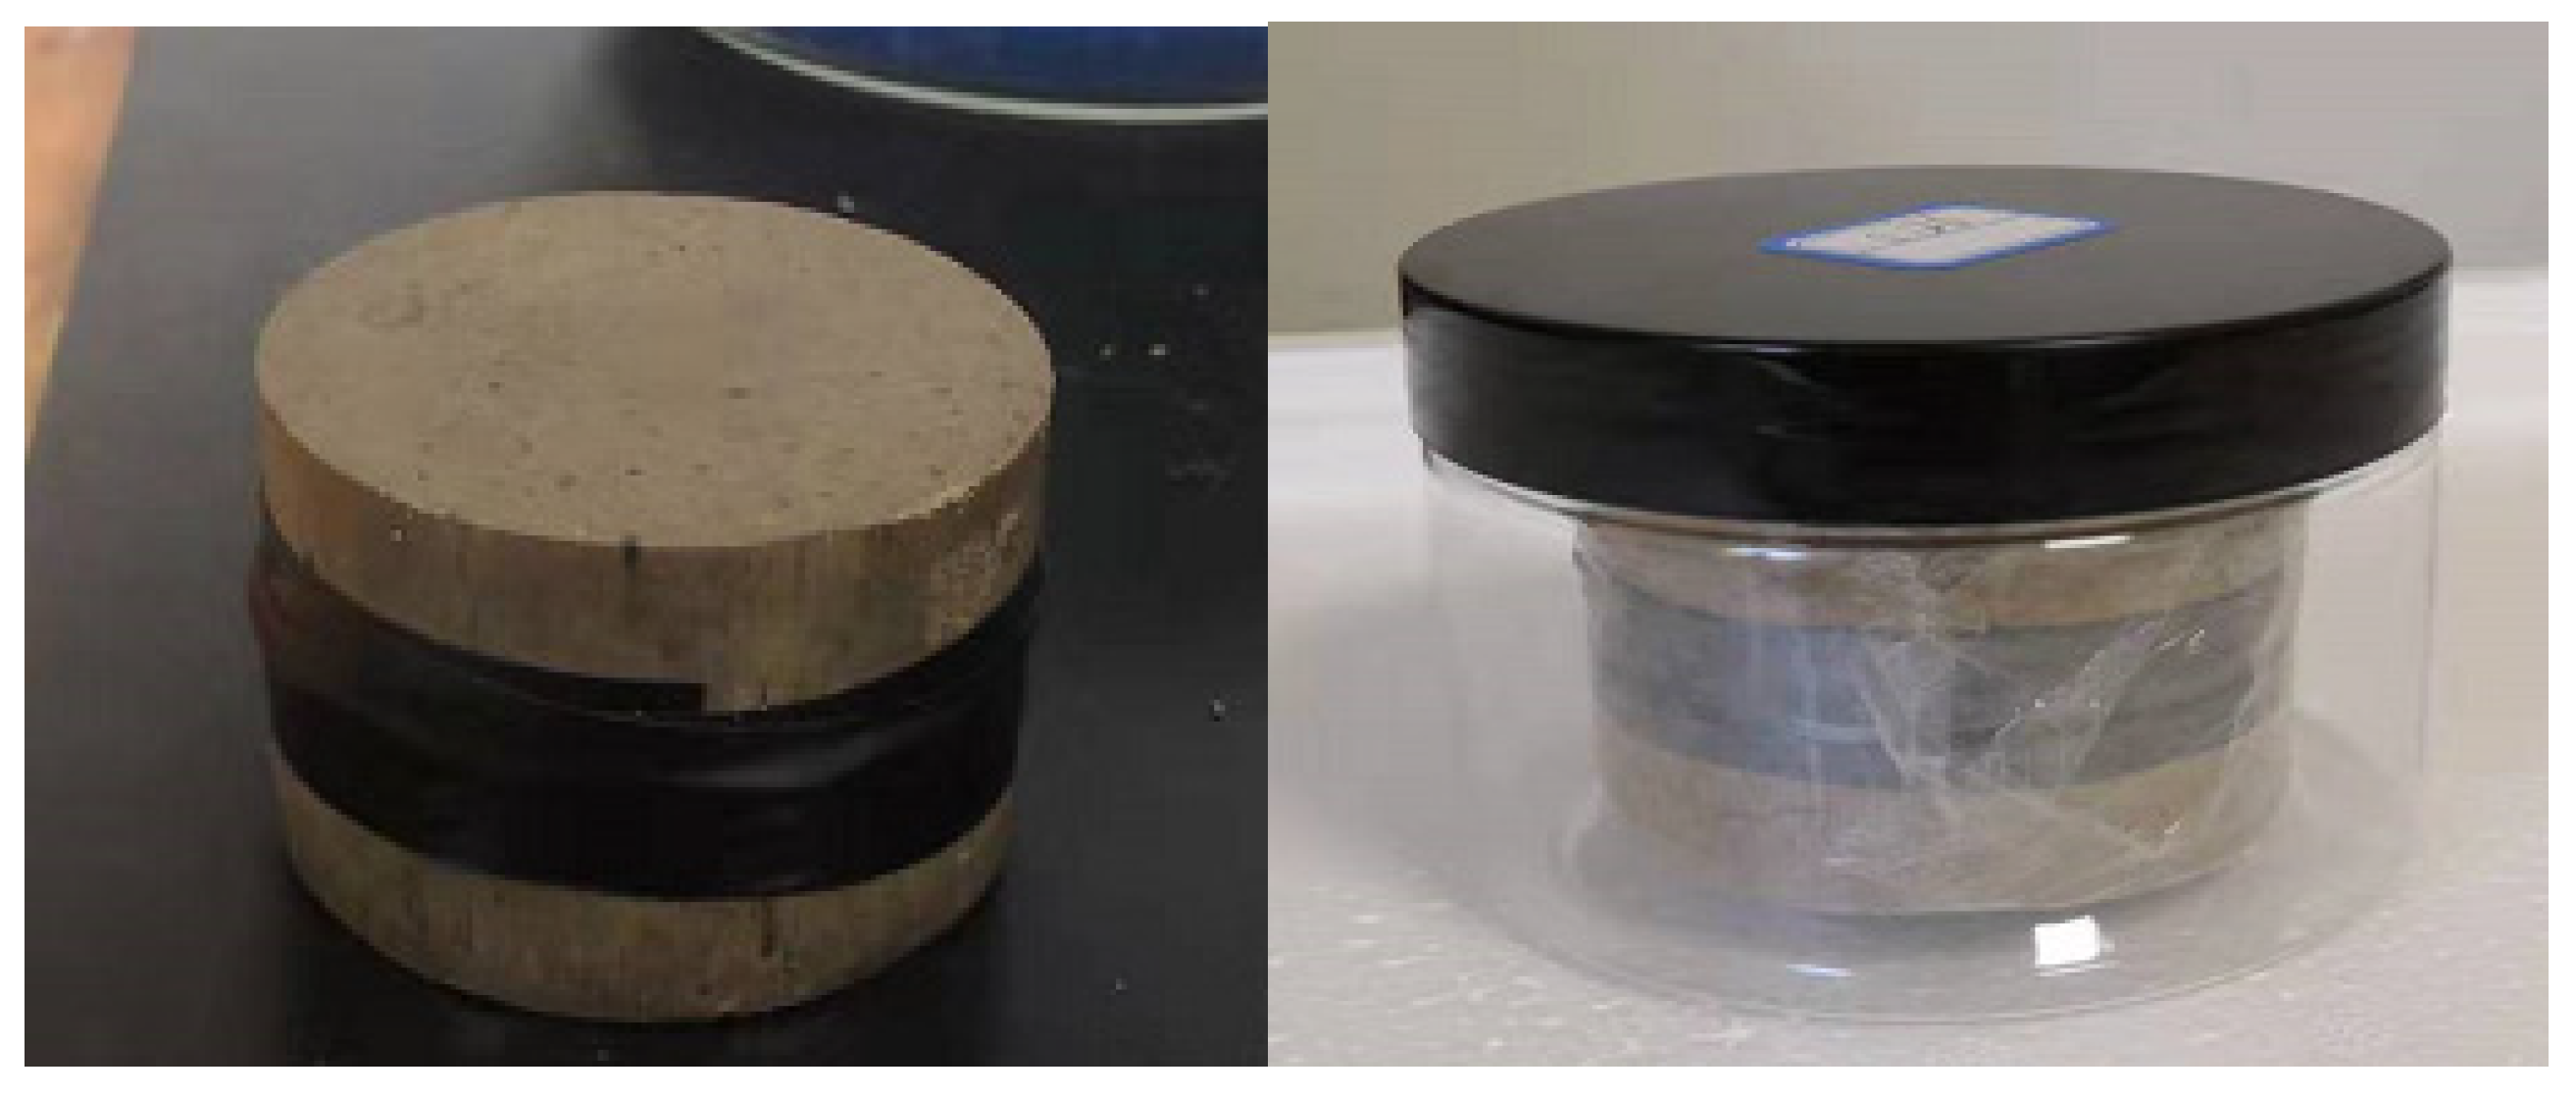
The matric suction was measured using a Whatman-42 type quantitative filter paper, and the test standard referred to ASTM-D5298-10 [34]. The filter paper was divided into upper, middle and lower layers. The middle-layer filter paper was for the filter paper measurement, while the upper and lower layers were used to ensure that the intermediate layer measured the filter paper without contamination. The filter papers were clamped between two identical cylindrical soil samples, and then wrapped with electrical tape and with plastic wrap to avoid water evaporation (Figure 3).
The water content of the middle-layer filter paper was measured by an electronic balance (accuracy of 0.0001 g) after seven days. The suction value was then tested by the rate equation of the filter paper. The rate equation for this filter paper is:
log S = 5.327 0.0779 w f ( w f 47 % ) log S = 2.412 0.0153 w f ( w f > 47 % )
where wf represents the moisture content of the filter paper at equilibrium, and S represents the suction. All weighing processes were completed within 5 s to reduce the error caused by suction and desorption of the filter paper in the air.

2.4. Electron Microscopic Scanning Test Method

The differences in the microstructure of the soil samples after different F–T cycles were observed by the SEM. The changes in the particle and pore distribution of the samples after the F–T cycles and the effects of such changes on the matric suction were analyzed. The SEM test, after the F–T cycles, was carried out using the sample (ρ = 1.76 g/cm3, F–T cycles=0, 1, 5). After the matric suction test, a rectangular parallelepiped sample of 10 mm × 5 mm × 5 mm (height × length × width) was cut from the naturally dried soil sample. The samples were glued to the tray and plated for scanning. The magnification of the test was 500 times. After obtaining the scanned images, the image which clearly reflected the typical structure of the soil and did not contain special information points (such as cracks) was selected as the representative image for further imaging analysis.

3. Results and Discussion

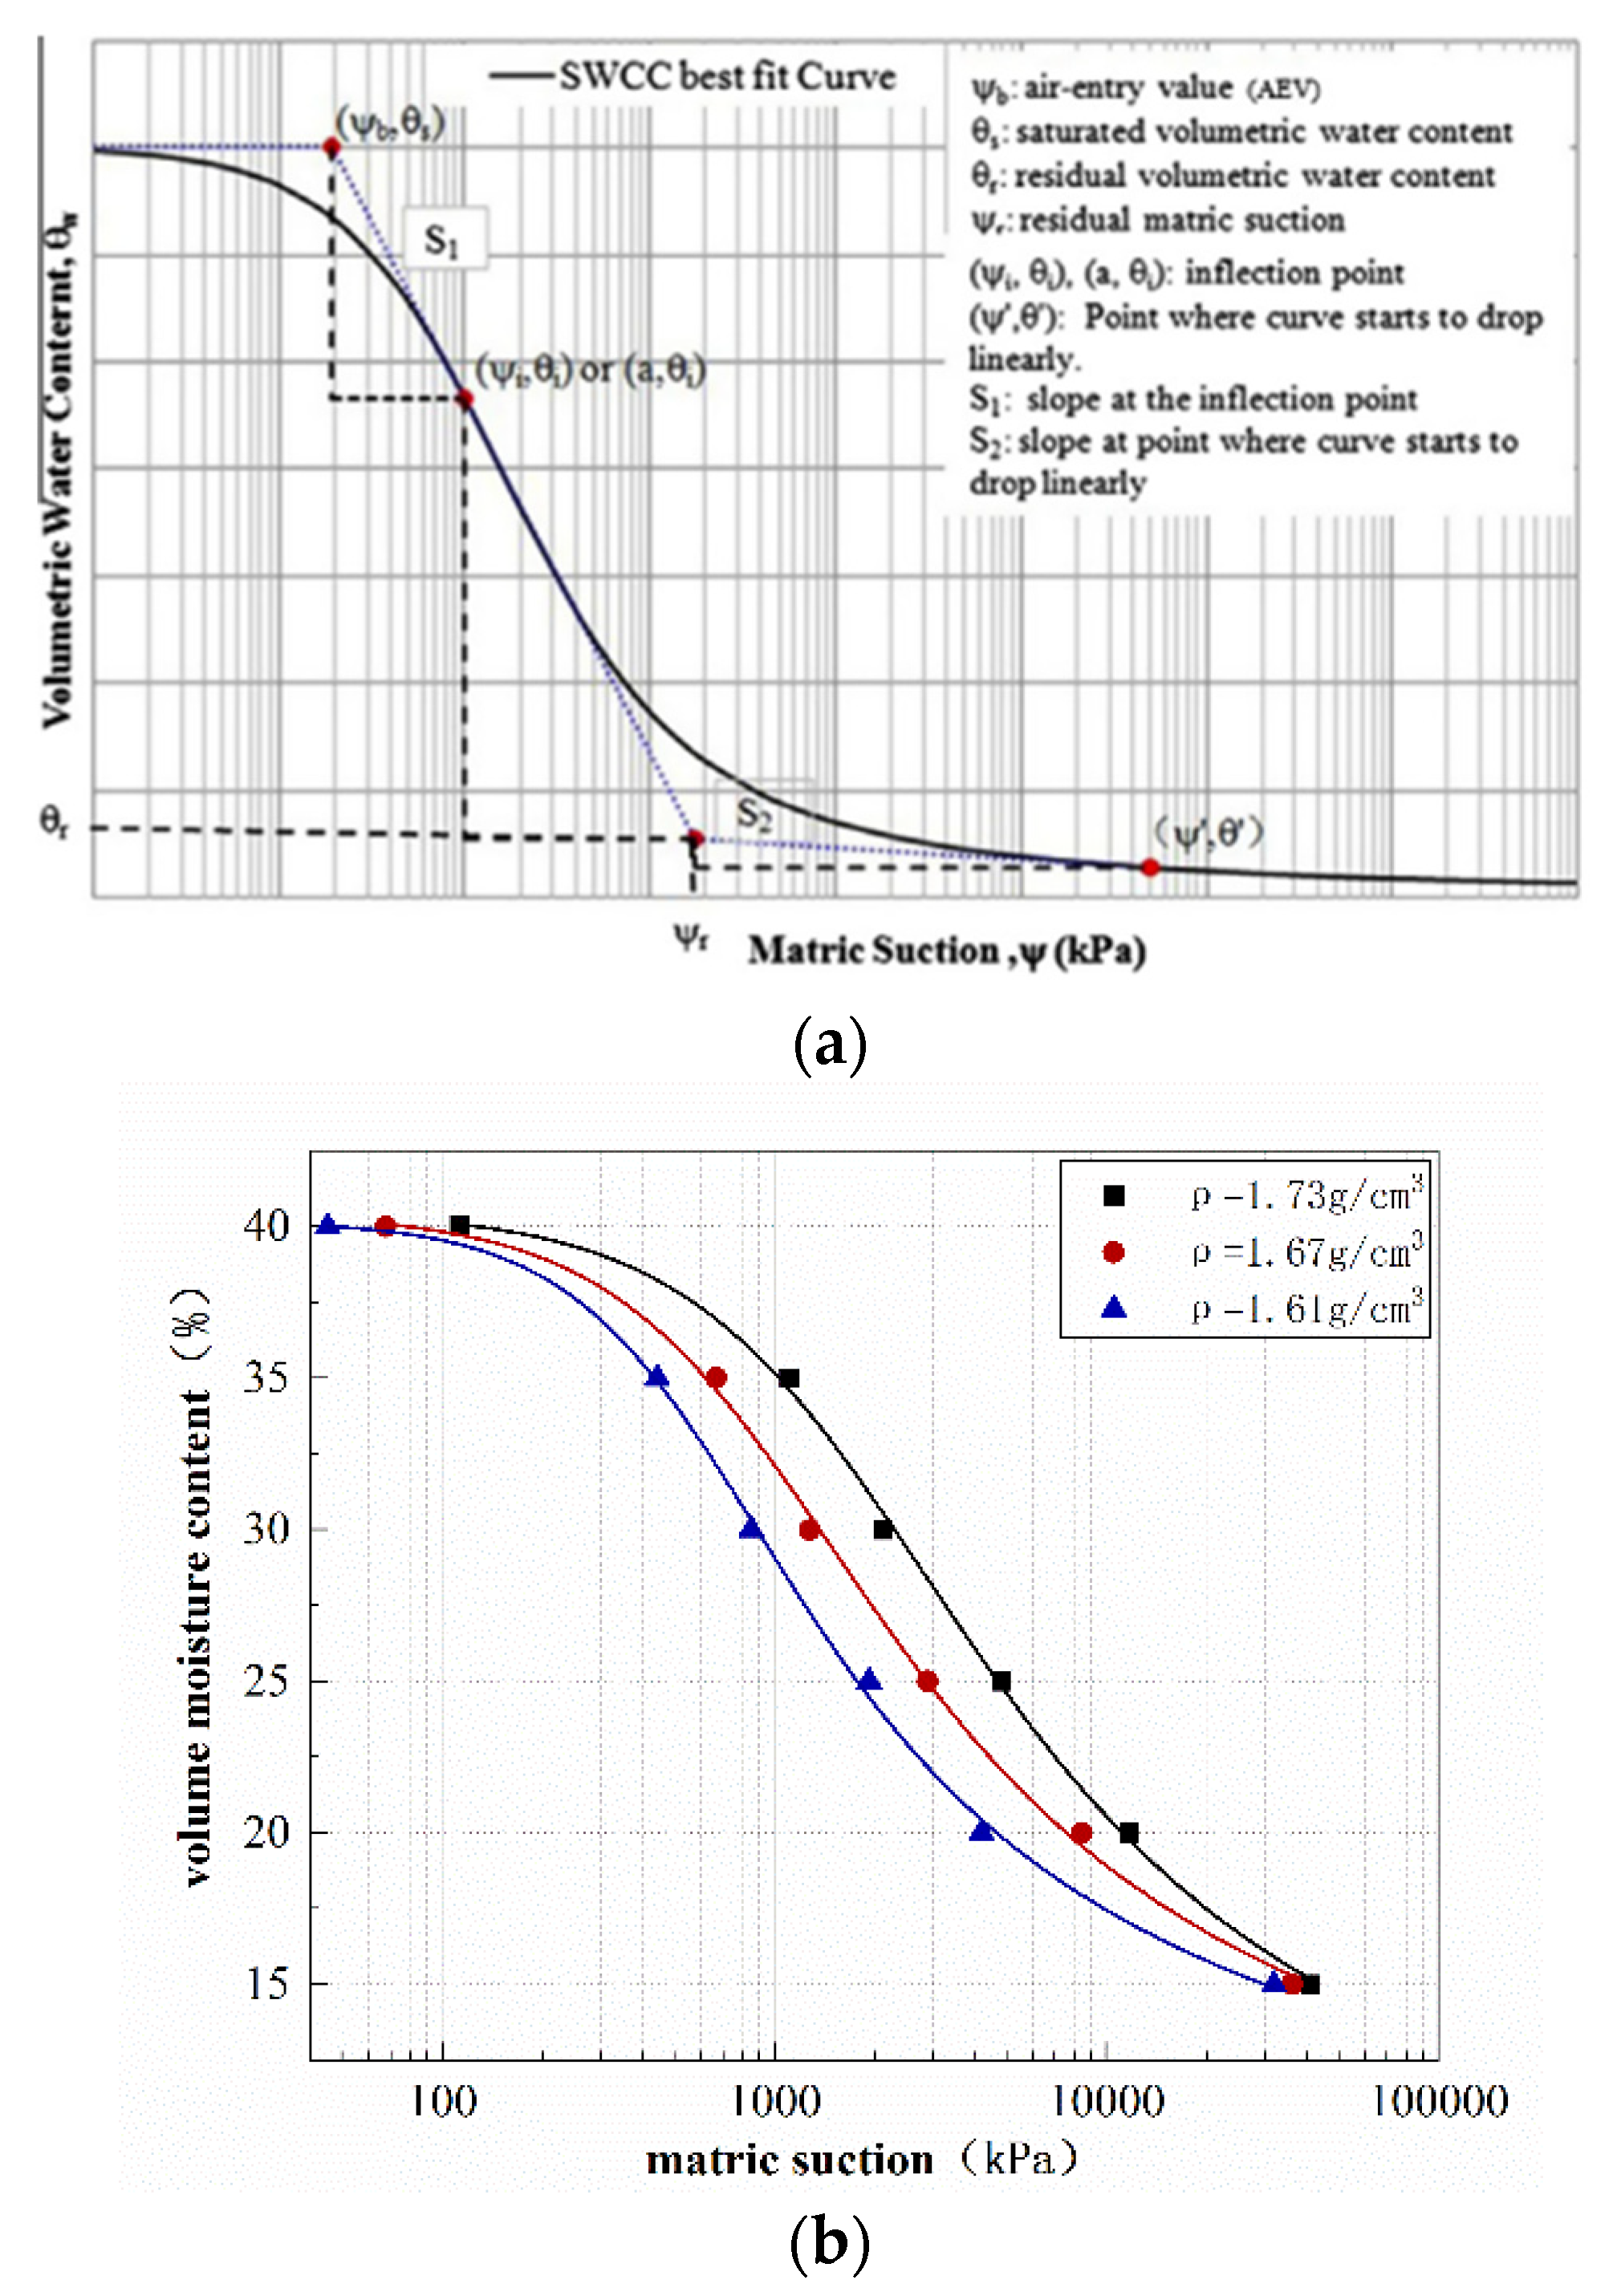
In a typical SWCC (Figure 4a) [20], the AEV can also be expressed as ψb (bubbling pressure); it is a turning point on the soil–water characteristic curve. In the boundary-effect phase, almost all the pores in the soil are filled with water. After the suction reaches ψb, the water content decreases drastically with the increase in suction. In a traditional way [1], this point is often obtained by extending the portion with a constant slope to intersect the suction axis at saturation. At this stage, the slope of the curve in the semi-logarithmic coordinate system is approximately constant, and this phase is referred to as the transition section. As the suction increases, the connectivity of pore water continues to decrease as the suction value increases, reaching the residual moisture content θr. It can be considered as the moisture content at the time when the liquid phase begins to become discontinuous. When the soil is dehumidified to this moisture content, it will become more difficult to discharge pore water by the increase in the suction force.
Through the geometry of a SWCC in semi-logarithmic coordinates, the characteristic parameters of a SWCC can be calculated as follows (Equations (3)–(7) are quoted from reference [20]).
Fit the SWCC with the Fredlund model [10]:
θ = θ s ln e + Ψ a n m
where θs is the saturated-water-content coefficient, which represents the starting position of the Fredlund fitting curve, and the m, n, and a are the soil parameters affecting the soil–water characteristic curve. Referring to Figure 4, in the semi-logarithmic coordinate system, the slope at the inflection point and the constant slope portion of the curve is defined as s1 (defined as positive). Since ψ = a at the inflection point,
s 1 = d θ d log ( ψ ) ψ a = ( m ) × θ s ln e + ( a / a ) n m + 1 × n e + ( a / a ) n × a a n 1 × a a × ln 10 = m × θ s 1.31 m + 1 × n 3.72 × ln 10
AEV obtained by geometric relational operation,
ψ b = a × 0.1 3.72 + 1.31 n + 1 ( 1 e m 3.67 ) m × n × ln 10
Similarly, when you take a residual segment point (ψ’, θ’), the slope of the residual segment can be represented by s2.
s 2 = m × θ s ln e + ( ψ ' / a ) n m + 1 × n e + ( ψ ' / a ) n × ψ ' a n 1 × ψ ' a × ln 10
According to the geometric relation, the residual water content and residual suction can be obtained by combining the above equations as follows:
ψ r = 10 θ i θ ' + s 1 × log ( a ) s 2 × log ( ψ ' ) s 1 s 2
θ r = θ i s 1 × ( log ψ r log a )
The results consistent with the traditional construction can be obtained. The characteristic parameters calculated by the number of different F–T cycles under three dry densities are summarized in Table 2.

3.1. Effect of F–T Cycles on SWCC for Three Dry Densities

Table 2 shows that the saturation-moisture content of the low-density sample is higher than that of the high-density sample. The low-density sample reaches the AEV before the high-density sample. At this time, the water begins to flow in the liquid phase and quickly dissipates as the suction increases, and the SWCC shows a turning point. In the transition section, the slope s1 of the low-density sample SWCC in the semi-logarithmic coordinate system is larger than that of the high-density sample. This is due to the fact that the low-density soil sample has a looser particle structure with a larger pore size and a total pore volume [35]. The smaller pores of high-density soil samples make the pore water more difficult to dissipate, so it has a higher moisture- holding capacity.
After the soil sample undergoes the F–T cycles, the characteristic parameters show similar trends as when the density decreases. Table 2 shows that as the number of F–T cycles increases, the saturated water content of the sample increases slightly by 0.22% to 0.45% compared to the unfrozen sample. Samples subjected to F–T cycles will begin to dissipate moisture at lower inhalation locations, that is, the AEV of this kind of samples will become lower. After seven F–T cycles, the AEV of the three dry density samples will reduce to 76%, 68%, and 59% of the initial value, respectively. The s1 increases as the number of F–T cycles increases. The trend of the dehumidification rate of the transition section is characterized by s1 and s1 increased with the increase in the number of F–T cycles. Compared with the original curve, the s1 calculated by the SWCC of three dry density samples increased by about 0.8% after seven F–T cycles. With an increase to the suction force, the unfrozen sample first reaches the residual water content, which makes the dehydration difficult, and the pore-water-dissipation rate is significantly reduced. When the samples under different F–T cycles reached this residual state, the pores of the unfrozen sample held more water.

3.2. Effect of F–T Cycles on the Microstructure of Soil Samples

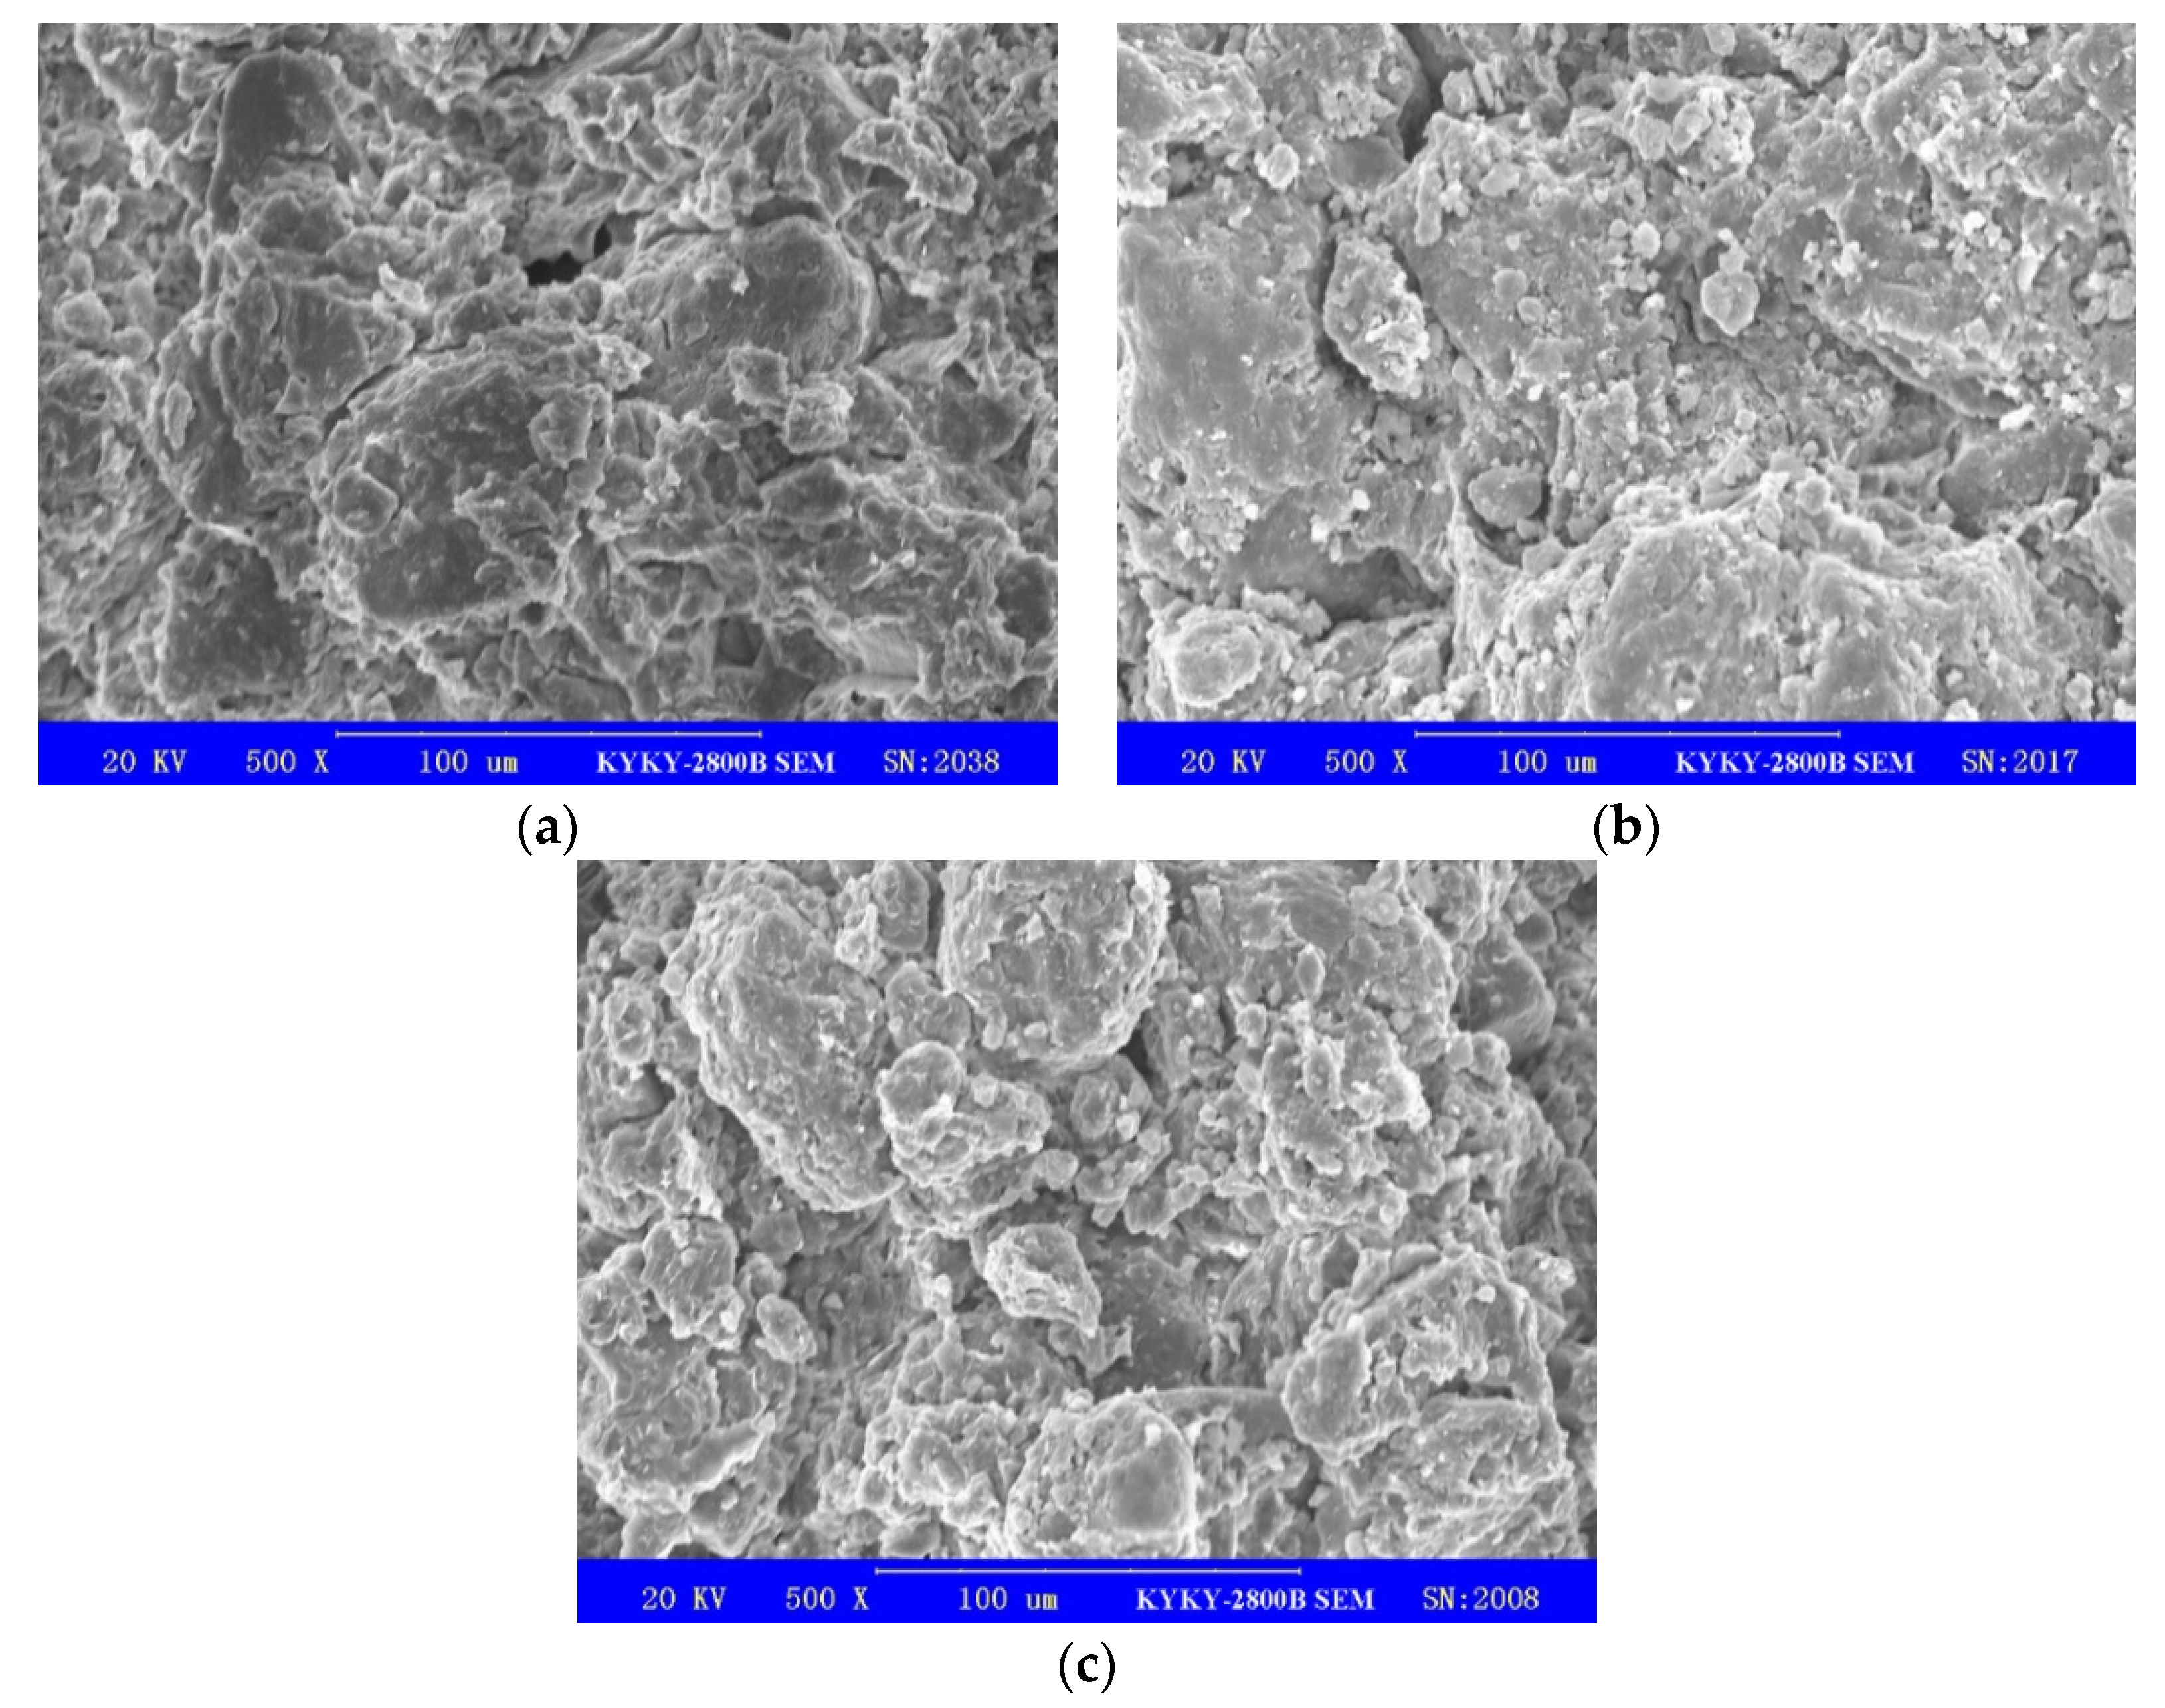
To analyze the mechanism of the SWCC change after the F–T cycles, the microstructure of the samples was analyzed by the SEM. Three parallel samples were prepared for electron-microscopy scanning in each case to ensure the validity of the analysis results. The scanning range was selected from the most representative area of the samples after different freeze–thaw cycles, and at least five scanning images were obtained for each sample. As an example, Figure 5 shows the representative SEM images without processing after zero, one, and five F–T cycles.
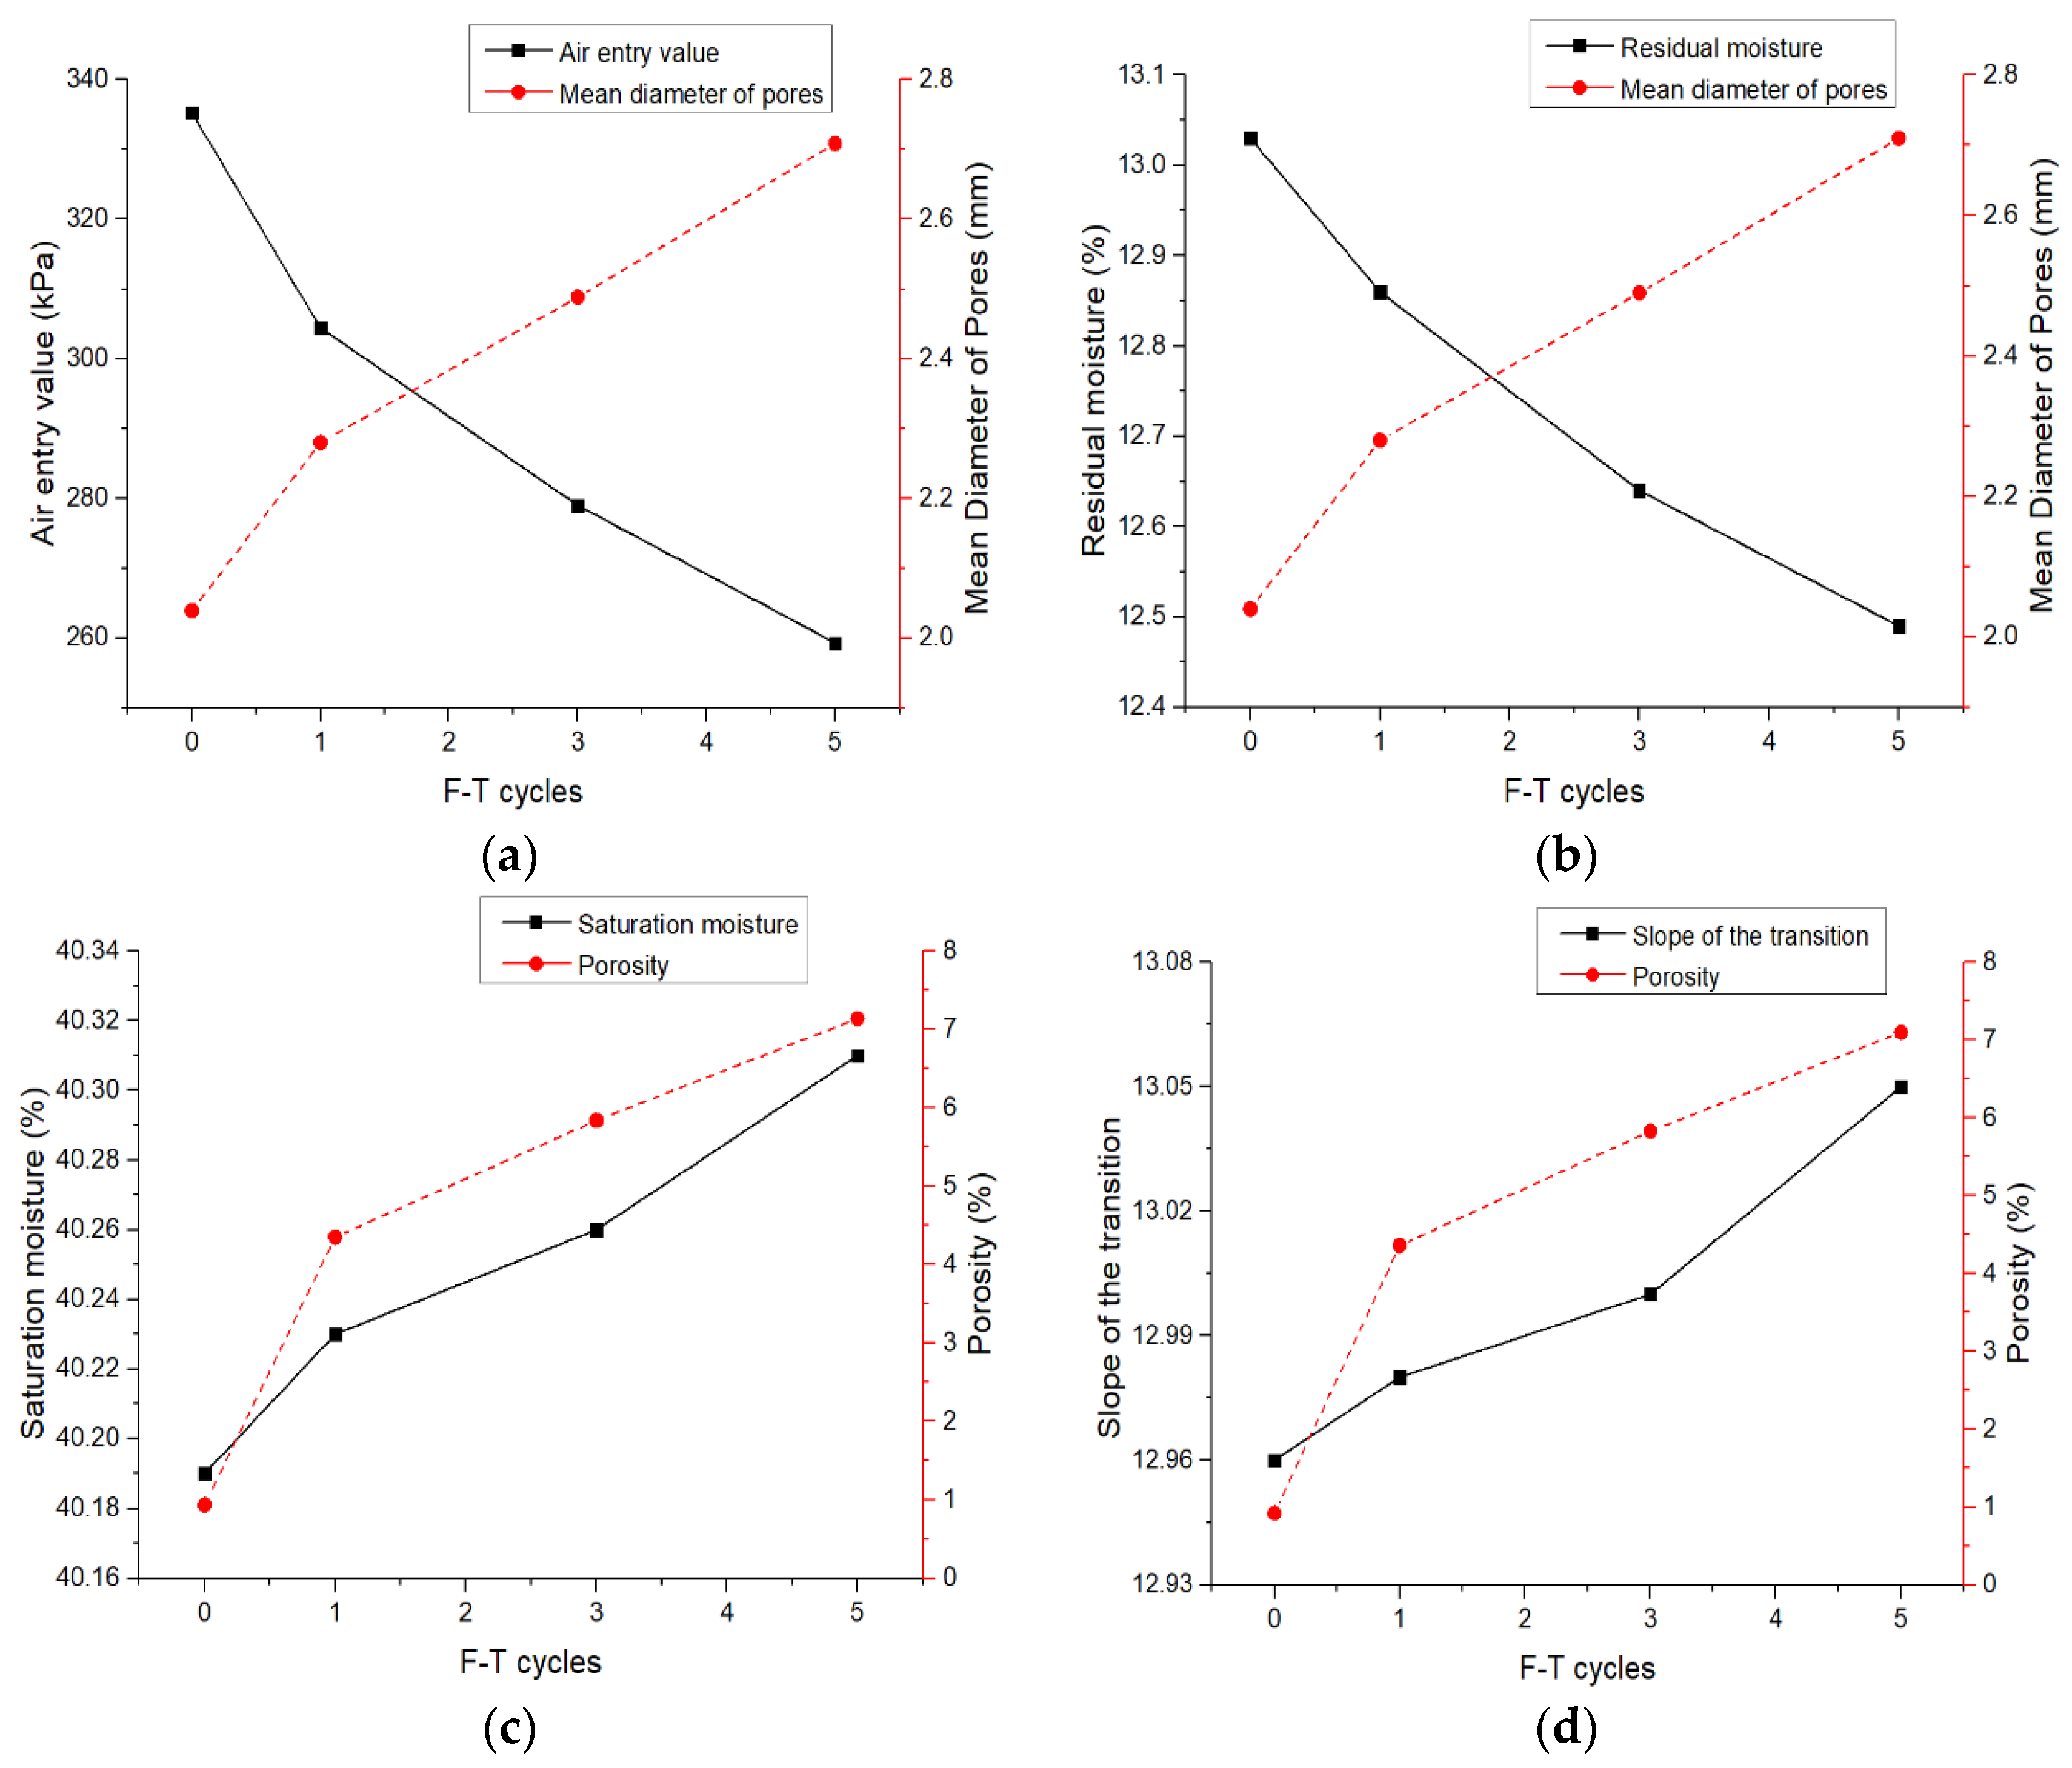
Analysis of the images revealed that the particles of SC specimens without freeze–thaw cycle are closely connected and present a plate-like structure as a whole. After one F–T cycle, the compact connections between the particles are broken and the sample shows cracks. With the continuation of a F–T cycle, the sample structure was significantly different from that before freezing and thawing, especially the connectivity between soil particles was significantly reduced. The microstructure of the sample becomes looser and larger pores began to form between the soil particles. In order to quantitatively analyze the characteristics of pore changes after F–T cycles, IPP (Image Pro Plus) software was used to statistically analyze the porosity and average diameter of the samples. Before this, the original image needs to be binarized to accurately identify the pores in the image and remove the small and irregular noise points by selecting an appropriate threshold. Based on the observation of the statistical data, the pore size was divided into small pores (d < 2 μm), medium pore (2 < d < 5 μm), and large pores (d > 16 μm). The results are shown in Table 3.
The data in Table 3 indicate that the F–T cycles result in the large and medium pores in the soil structure increase, and the small pores become less. As the number of F–T cycles increases, the porosity gradually increases, and the average diameter of the soil pores becomes larger. After the first F–T cycle, the increase is most obvious and then gradually decreases. Figure 6 shows the comparative relationship between pore parameters and SWCC characteristic parameters.
Figure 6 explains the results of the above SWCC experiment. As the porosity increases after F–T cycles, the sample obtains a higher-saturated water content. The porosity of the soil increases, and the large pores become larger, making it easier for the soil to reach the critical point of releasing moisture due to the suction force, resulting in a decrease in the AEV. The water-loss rate after reaching the AEV is also greater than those samples without F–T cycles. Small pores affect the residual moisture content. When the small pores in the soil increase, more water that is difficult to dissipate is stored. On the contrary, when the number of small pores is reduced by the freezing and thawing process, the residual water content will be reduced accordingly.

3.3. Prediction of Characteristic Parameters after F–T Cycles

The current prediction of soil under cyclic conditions usually revolves around the study of the fitting parameters of the model (1). In order to predict the SWCC characteristic parameters after F–T cycles directly, the relationship function between these characteristic parameters and the number of F–T cycles n according to the variation law of SWCC characteristic parameters after F–T cycles was established in this section.
Table 2 shows that in the semi-logarithmic coordinates, each increase in the number of F–T cycles causes the SWCC to undergo a shape adjustment and a shift to the lower left as a whole. The change in shape and the overall offset reduce with the increasing number of F–T cycles. The changes in SWCC were small between five and seven F–T cycles; therefore, assuming that the number of F–T cycles n increases, the SWCC will eventually become a stable state, and the characteristic parameters and the slope used to describe the curve will tend to a constant value. A mathematical function was sought to describe this law. In this study, regression analysis was performed on them by exponential function and power function, respectively, and the curves with the best fitting effect are listed in Figure 7. The fitting effect is judged by the correlation coefficient R2.
Table 4 shows the correlation coefficients of various parameters in the curve fitting. The correlation coefficient R2 in the above fitting curve is greater than 0.98, which has a good fitting effect. This indicates that this method has better prediction accuracy for SWCC characteristic parameters after F–T cycles, and can provide a simple and reliable basis for the estimation of the equilibrium humidity in geotechnical engineering in the seasonally frozen area and the strength of design considering the unsaturated soil characteristics.

4. Conclusions

In this work, the matric suction test of unsaturated clay under different dry densities and different freeze–thaw cycles was carried out, and the change law of characteristic parameters of SWCC of unsaturated clay was analyzed. The variation characteristics of an SWCC is best explained when combined with a microstructure. The accurate prediction of the SWCC of unsaturated clay under the action of freeze–thaw cycles is realized by fitting the soil–water characteristic parameters. The following conclusions are drawn:
(1)
The results of the aspiration test of low-liquid-limit silty clay matric at different densities indicate that a SWCC with high density soil SWCC has higher AEV and residual water content and lower saturated moisture content. In the transition section, the high-density soil sample has a lower moisture-loss rate under the same suction than the low-density soil sample. The high-density soil samples have smaller pores and better water retention; while their porosity is lower than that of low-density soils, the water content in saturated pores is smaller than that in low-density soils.
(2)
The characteristic parameters of a SWCC are negatively correlated with the number of F–T cycles. With the increase in the number of F–T cycles, the saturated water content and desorption rate of the transition section began to gradually increase. For the test soil samples, the AEV, residual moisture content and water holding capacity began to decrease. The sensitivity of the water in the pores to suction is increased, and became more susceptible to suction and began to dissipate. The first F–T cycle has the most severe effect on the characteristic parameters and then gradually decreases. This change is no longer obvious between five to seven F–T cycles.
(3)
The results of the SEM revealed that the original pore structure of the soil sample became looser. The plate-like overall structure of the soil sample gradually ruptured, and the crack gradually developed in the soil sample. In detail, the F–T cycles increase the large and medium pores in the soil and reduce the small pores. Overall, the porosity and average pore size of the soil sample are increased. This result explains the mechanism of the SWCC changes after the F–T cycles.
(4)
The characteristic parameters of a SWCC under different F–T cycles were fitted by a mathematical formula. The relationship between the characteristic parameters and the number of F–T cycles was established to predict the SWCC after n F–T cycles. Taking the correlation coefficient as the criterion, R2 is all above 0.98, which indicates that the fitting accuracy is outstanding.
In summary, the variation characteristics of a SWCC of unsaturated clay considering the freezing–thawing cycles are studied in this paper, which provides a reference for the related application of soil-based engineering in seasonally frozen regions.

Author Contributions

Conceptualization, L.H. and X.L.; methodology, L.H. and X.L.; software, L.H.; validation, X.L.; formal analysis, L.H.; resources, L.H.; data curation, X.L.; writing—original draft preparation, X.L.; writing—review and editing, L.H. and X.L.; project administration, L.H.; funding acquisition, L.H. All authors have read and agreed to the published version of the manuscript.

Funding

This research was funded by the Science and Technology Project of Jilin Province Transportation Department, grant number 2017ZDGC6.

Institutional Review Board Statement

Not applicable.

Informed Consent Statement

Not applicable.

Data Availability Statement

Not applicable.

Acknowledgments

The authors express their appreciation for the financial support of the Science and Technology Project of Jilin Province Transportation Department, grant number 2017ZDGC6. Our thanks go to the editors and reviewers for their efficient work.

Conflicts of Interest

The authors declare no conflict of interest.

References

  1. Fredlund, D.G.; Rahardjo, H.; Fredlund, M.D. Unsaturated Soil Mechanics in Engineering Practice; Wiley & Sons: Hoboken, NJ, USA, 2012. [Google Scholar]
  2. Teng, J.; Kou, J.; Yan, X.; Zhang, S.; Sheng, D. Parameterization of soil freezing characteristic curve for unsaturated soils. Cold Reg. Sci. Technol. 2019, 170, 102928. [Google Scholar] [CrossRef]
  3. Ren, J.P.; Vanapalli, S.K.; Han, Z. Soil freezing process and different expressions for the soil-freezing characteristic curve. Sci. Cold Arid. Reg. 2017, 9, 43–50. [Google Scholar]
  4. Koopmans, R.W.R.; Miller, R.D. Soil freezing and soil water characteristic curves. Soil Sci. Soc. Am. J. 1966, 30, 680685. [Google Scholar] [CrossRef]
  5. Abraham, B.; Stoffels, S.M. Evaluation of Pavement Subgrade Long-Term Equilibrium Moisture with Suction Potential. KSCE J. Civ. Eng. 2019, 23, 147–159. [Google Scholar] [CrossRef]
  6. Chiu, C.F.; Yan, W.M.; Yuen, K.-V. Reliability Analysis of soil–water Characteristics Curve and its Application to Slope Stability Analysis. Engineering Geol. 2012, 135–136, 83–91. [Google Scholar] [CrossRef]
  7. Wijaya, M.; Leong, E.C.; Rahardjo, H. Effect of Shrinkage on Air-Entry Value of Soils. Soils Found. 2015, 55, 166–180. [Google Scholar] [CrossRef] [Green Version]
  8. Kristo, C.; Rahardjo, H.; Satyanaga, A. Effect of Hysteresis on the Stability of Residual Soil Slope. Int. Soil Water Conserv. Res. 2019, 7, 226–238. [Google Scholar] [CrossRef]
  9. Li, X.; Li, J.H.; Zhang, L.M. Predicting Bimodal soil–water Characteristic Curves and Permeability Functions using Physically Based Parameters. Comput. Geotech. 2014, 57, 85–96. [Google Scholar] [CrossRef]
  10. Fredlund, D.G.; Xing, A. Equations for the Soil-Water Characteristic Curve. Can. Geotech. J. 1994, 31, 521–532. [Google Scholar] [CrossRef]
  11. Fredlund, M.D.; Wilson, G.W.; Fredlund, D.G. Use of the Grain-Size Distribution for Estimation of the Soil-Water Characteristic Curve. Can. Geotech. J. 2002, 39, 1103–1117. [Google Scholar] [CrossRef] [Green Version]
  12. Gardner, W.R. Some Steady-State Solutions of the Unsaturated Moisture Flow Equation with Application to Evaporation from a Water Table. Soil Sci. 1958, 85, 228–232. [Google Scholar] [CrossRef]
  13. Van Genuchten, M.T. A Closed-Form Equation for Predicting the Hydraulic Conductivity of Unsaturated Soils. Soil Sci. Soc. Am. J. 1980, 44, 892–898. [Google Scholar] [CrossRef] [Green Version]
  14. Stange, C.F.; Horn, R. Modeling the Soil Water Retention Curve for Conditions of Variable Porosity. Vadose Zone J. 2005, 4, 602–613. [Google Scholar] [CrossRef]
  15. Zhou, A.-N.; Sheng, D.; Carter, J.P. Modelling the Effect of Initial Density on Soil-Water Characteristic Curves. Geotechnique 2012, 62, 669–680. [Google Scholar] [CrossRef] [Green Version]
  16. Liu, S.; Yu, J.; Yasufuku, N. Physically Based Soil Water Characteristic Curves Function for Soils with Inner Porosity. Arch. Agron. Soil Sci. 2019, 65, 537–548. [Google Scholar] [CrossRef]
  17. Satyanaga, A.; Rahardjo, H.; Leong, E.; Wang, J. Water Characteristic Curve of Soil with Bimodal Grain-Size Distribution. Comput. Geotech. 2013, 48, 51–61. [Google Scholar] [CrossRef]
  18. Raghuram, A.S.S.; Basha, B.M.; Raviteja, K.V.N.S. Variability Characterization of SWCC for Clay and Silt and its Application to Infinite Slope Reliability. J. Mater. Civ. Eng. 2021, 33, 4021180. [Google Scholar] [CrossRef]
  19. Zhou, J.; Ren, J.; Li, Z. An Improved Prediction Method of Soil-Water Characteristic Curve by Geometrical Derivation and Empirical Equation. Math. Probl. Eng. 2021, 2021, 9956824. [Google Scholar] [CrossRef]
  20. Zhai, Q.; Rahardjo, H. Determination of soil–water Characteristic Curve Variables. Comput. Geotech. 2012, 42, 37–43. [Google Scholar] [CrossRef]
  21. Tao, G.; Chen, Y.; Xiao, H.; Chen, Q.; Wan, J. Determining Soil-Water Characteristic Curves from Mercury Intrusion Porosimeter Test Data using Fractal Theory. Energies 2019, 12, 752. [Google Scholar] [CrossRef] [Green Version]
  22. Yan, W.; Birle, E.; Cudmani, R. A New Framework to Determine General Multimodal Soil Water Characteristic Curves. Acta Geotech. 2021, 16, 3187–3208. [Google Scholar] [CrossRef]
  23. Bharat, T.V.; Gapak, Y. Soil-Water Characteristic Curves of Bentonites in Isochoric Conditions during Wetting: Measurement and Prediction. Can. Geotech. J. 2021, 58, 711–721. [Google Scholar] [CrossRef]
  24. Ren, W.; Yang, T.; Huang, M.; Zhang, A.; Wei, H.; Mi, W.; Wang, Y.; Hu, J. Optimal Mixing Ratio and SWCC Fitting of Lightweight Soil with Cotton Stalk Fibres. Soils Found. 2021, 61, 453–464. [Google Scholar] [CrossRef]
  25. Fu, Y.P.; Liao, H.J.; Chai, X.Q.; Li, Y.; Lv, L.L. A Hysteretic Model Considering Contact Angle Hysteresis for Fitting Soil-Water Characteristic Curves. Water Resour. Res. 2021, 57, 4. [Google Scholar] [CrossRef]
  26. Fredlund, D.G.; Sheng, D.; Zhao, J. Estimation of Soil Suction from the Soil-Water Characteristic Curve. Can. Geotech. J. 2011, 48, 186–198. [Google Scholar] [CrossRef]
  27. Yang, H.; Rahardjo, H.; Leong, E.; Fredlund, D.G. Factors Affecting Drying and Wetting Soil-Water Characteristic Curves of Sandy Soils. Can. Geotech. J. 2004, 41, 908–920. [Google Scholar] [CrossRef]
  28. Ng, C.W.W.; Leung, A.K. Measurements of Drying and Wetting Permeability Functions using a New Stress-Controllable Soil Column. J. Geotech. Geoenviron. Eng. 2011, 138, 58–68. [Google Scholar] [CrossRef]
  29. Wang, T.; Lu, J.; Yue, C. Soil-Water Characteristic Curve for Unsaturated Loess Considering Temperature and Density Effect. Rock Soil Mech. 2008, 29, 1–5. [Google Scholar]
  30. Li, S.; Shi, L.; Pei, W.; Lai, Y.; Yu, W. Thermodynamic Responses of a Crushed-Rock Interlayer Embankment on Sloping Permafrost Ground under Traffic Loads. Appl. Therm. Eng. 2018, 144, 670–680. [Google Scholar] [CrossRef]
  31. Ma, T.; Wei, C.; Xia, X.; Zhou, J.; Chen, P. Soil Freezing and Soil Water Retention Characteristics: Connection and Solute Effects. J. Perform. Constr. Facil. 2017, 31, 1–8. [Google Scholar] [CrossRef]
  32. Institute of Highway Science, Ministry of Communications. Code of Geotechnical Test for Highway: JTG E40-2007; People’s Communications Publishing House: Beijing, China, 2007. [Google Scholar]
  33. Zhang, Y.; Zhao, W.; Ma, W.; Wang, H.; Wen, A.; Li, P. Effect of Different Freezing Modes on the Water-Heat-Vapor Behavior in Unsaturated Coarse-Grained Filling Exposed to Freezing and Thawing. Cold Reg. Sci. Tech. 2020, 174, 103038. [Google Scholar] [CrossRef]
  34. ASTM. Standard Test Method for Measurement of Soil Potential (Suction) Using Filter Paper; ASTM International: West Conshohocken, PA, USA, 2010; Volume ASTM D5298-10. [Google Scholar]
  35. Liu, F.; Zhang, Z.; Zhou, D.; Zhao, X.; Zhu, L. Effects of Initial Density and Drying-Wetting Cycle on Soil Water Characteristic Curve of Unsaturated Loess. Rock Soil Mech. 2011, 32, 132–142. [Google Scholar]
Figure 1. Particle analysis curve and soil sample appearance image. (a) Particle analysis curve; (b) Silty clay.
Applsci 12 10713 g001
Figure 2. The thermostatic chamber of constant humidity. (Shanghai Hengding Instrument & Equipment Factory, HDGDSJ-150).
Applsci 12 10713 g002
Figure 3. Specimen during matric suction test.
Applsci 12 10713 g003
Figure 4. (a) Typical SWCC in the semi-logarithmic coordinate diagram [20]. (b) SWCCs of low-liquid-limit silty clays at three densities without freeze–thaw cycles.
Applsci 12 10713 g004
Figure 5. SEM image of soil sample. (a) 0 F–T cycle; (b) 1 F–T cycle; (c) 5 F–T cycle.
Applsci 12 10713 g005
Figure 6. Changes in pore parameters and SWCC characteristic parameters after different F–T cycles. (a) AEV and mean diameter with F–T cycles; (b) Residual moisture and mean diameter with F–T cycles; (c) Saturation moisture and porosity with F–T cycles; (d) s1 and porosity with F–T cycles.
Applsci 12 10713 g006
Figure 7. Fit curves of SWCC characteristic parameters and F–T cycles. (a) Saturated moisture content and F–T cycles; (b) Residual moisture content and F–T cycles; (c) AEV and F–T cycles; (d) s1 and F–T cycles.
Applsci 12 10713 g007
Table 1. Physical properties of test soils.
Liquid Limit (%)Plastic Limit (%)Plasticity (%)Optimum Moisture (%)Maximum Density (g/cm3)
34.9621.1113.8515.381.8
Table 2. SWCC characteristic parameters table.
Density1.73 g/cm31.67 g/cm31.61 g/cm3
F–T Cycles013570135701357
ψ b 335.06304.23278.99259.25256.03182.34155.51136.34125.51125.08135.2106.7291.4981.4180.19
s 1 12.9612.981313.0513.0613.413.4413.513.5113.5113.5113.5813.6213.6313.63
θ s 40.1940.2340.2640.3140.340.4340.540.5740.6140.6140.4140.4540.4740.4940.5
θ r 13.0312.8612.6412.4912.4712.6512.3912.212.1512.1412.3412.2112.112.0312
Table 3. Pore parameters after F–T cycles.
F–T CyclesPorosity (%)Mean Diameter (mm)Small Pore (%)Medium Pore (%)Large Pore (%)
00.942.0483.5116.490
14.352.2873.2425.910.85
35.842.4972.4023.044.56
57.112.7166.5925.707.71
Table 4. Correlation coefficient of each parameter.
ρ1.73 g/cm31.67 g/cm31.61 g/cm3
θsθrψbs1θsθrψbs1θsθrψbs1
R20.9920.9890.9970.9870.9940.9910.9880.9930.9970.9910.9980.985
Publisher’s Note: MDPI stays neutral with regard to jurisdictional claims in published maps and institutional affiliations.