
The Quantification and Evolution of Particle Characteristics of Saturated Silt under Freeze–Thaw Cycles


Abstract
1. Introduction
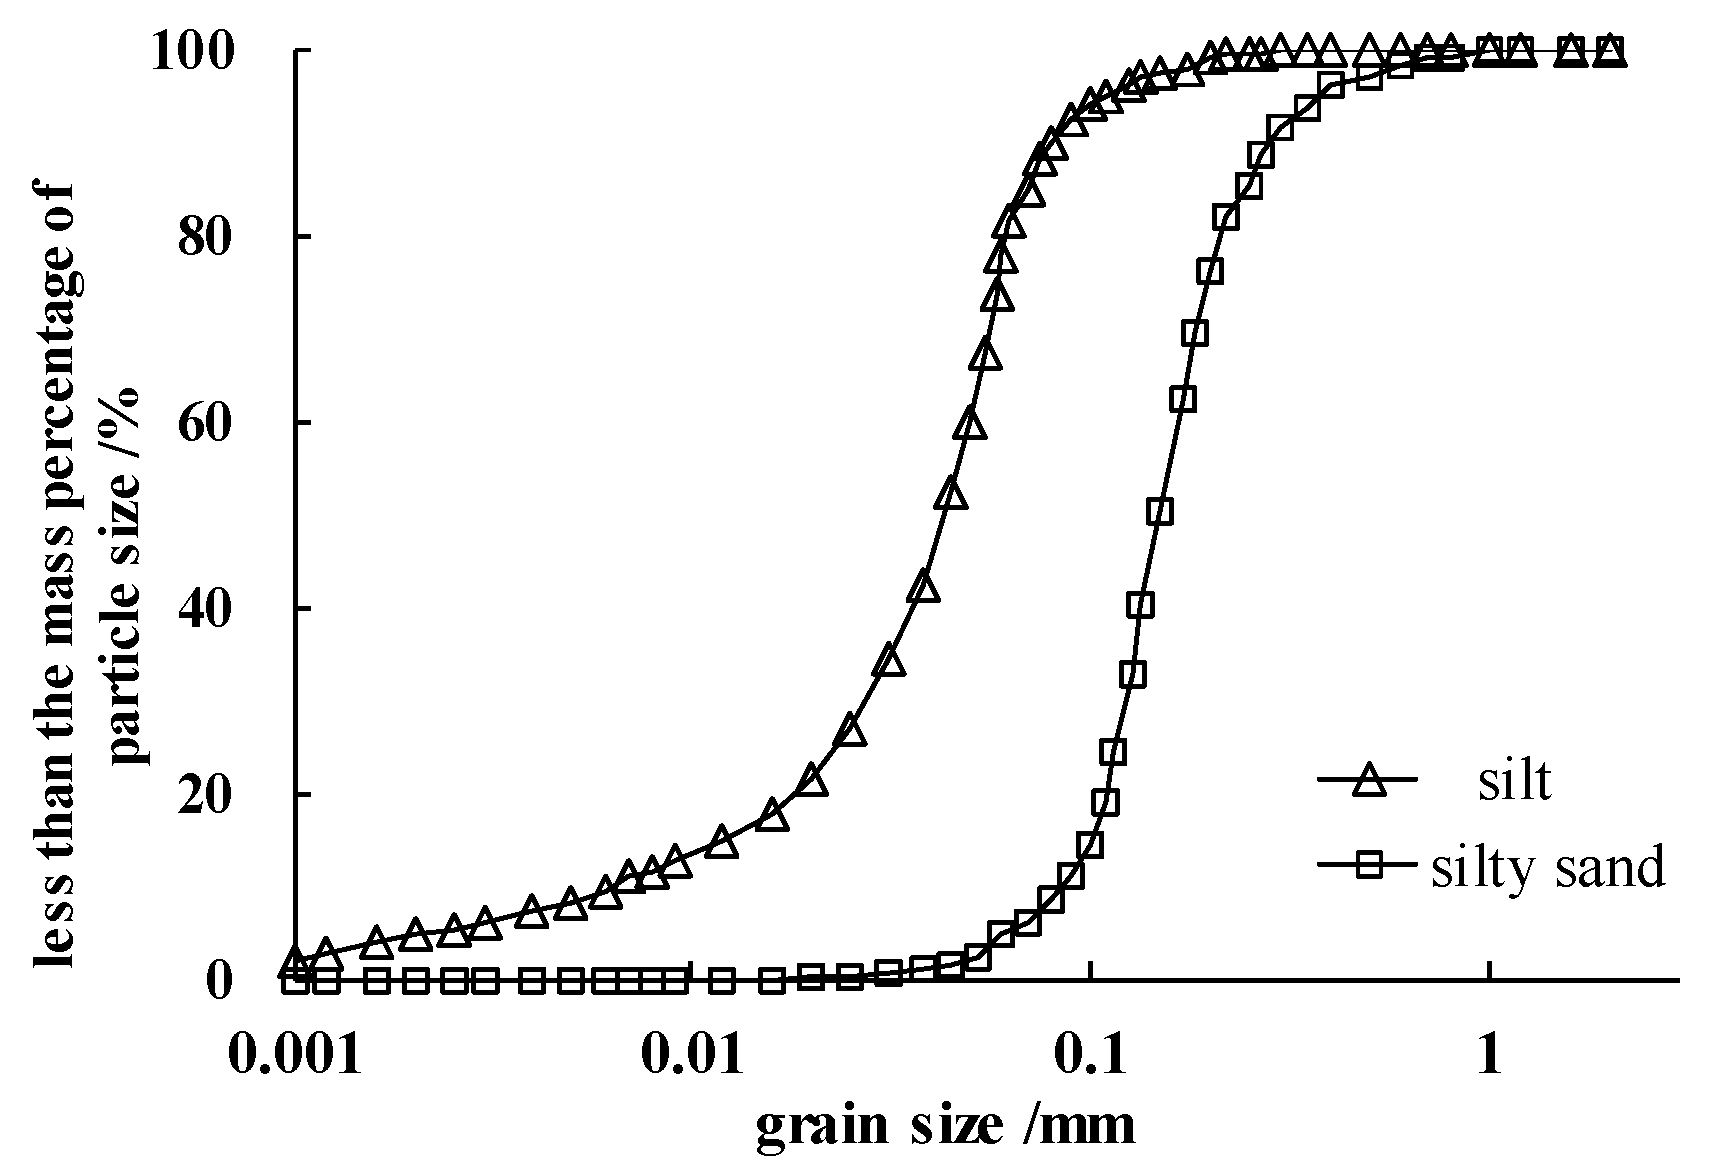
2. Test Materials
3. Experimental Program
- ➀
- Firstly, dry and smash the undisturbed soil into soil particles, and pass it through 2.0 mm fine sieve for particle separation;
- ➁
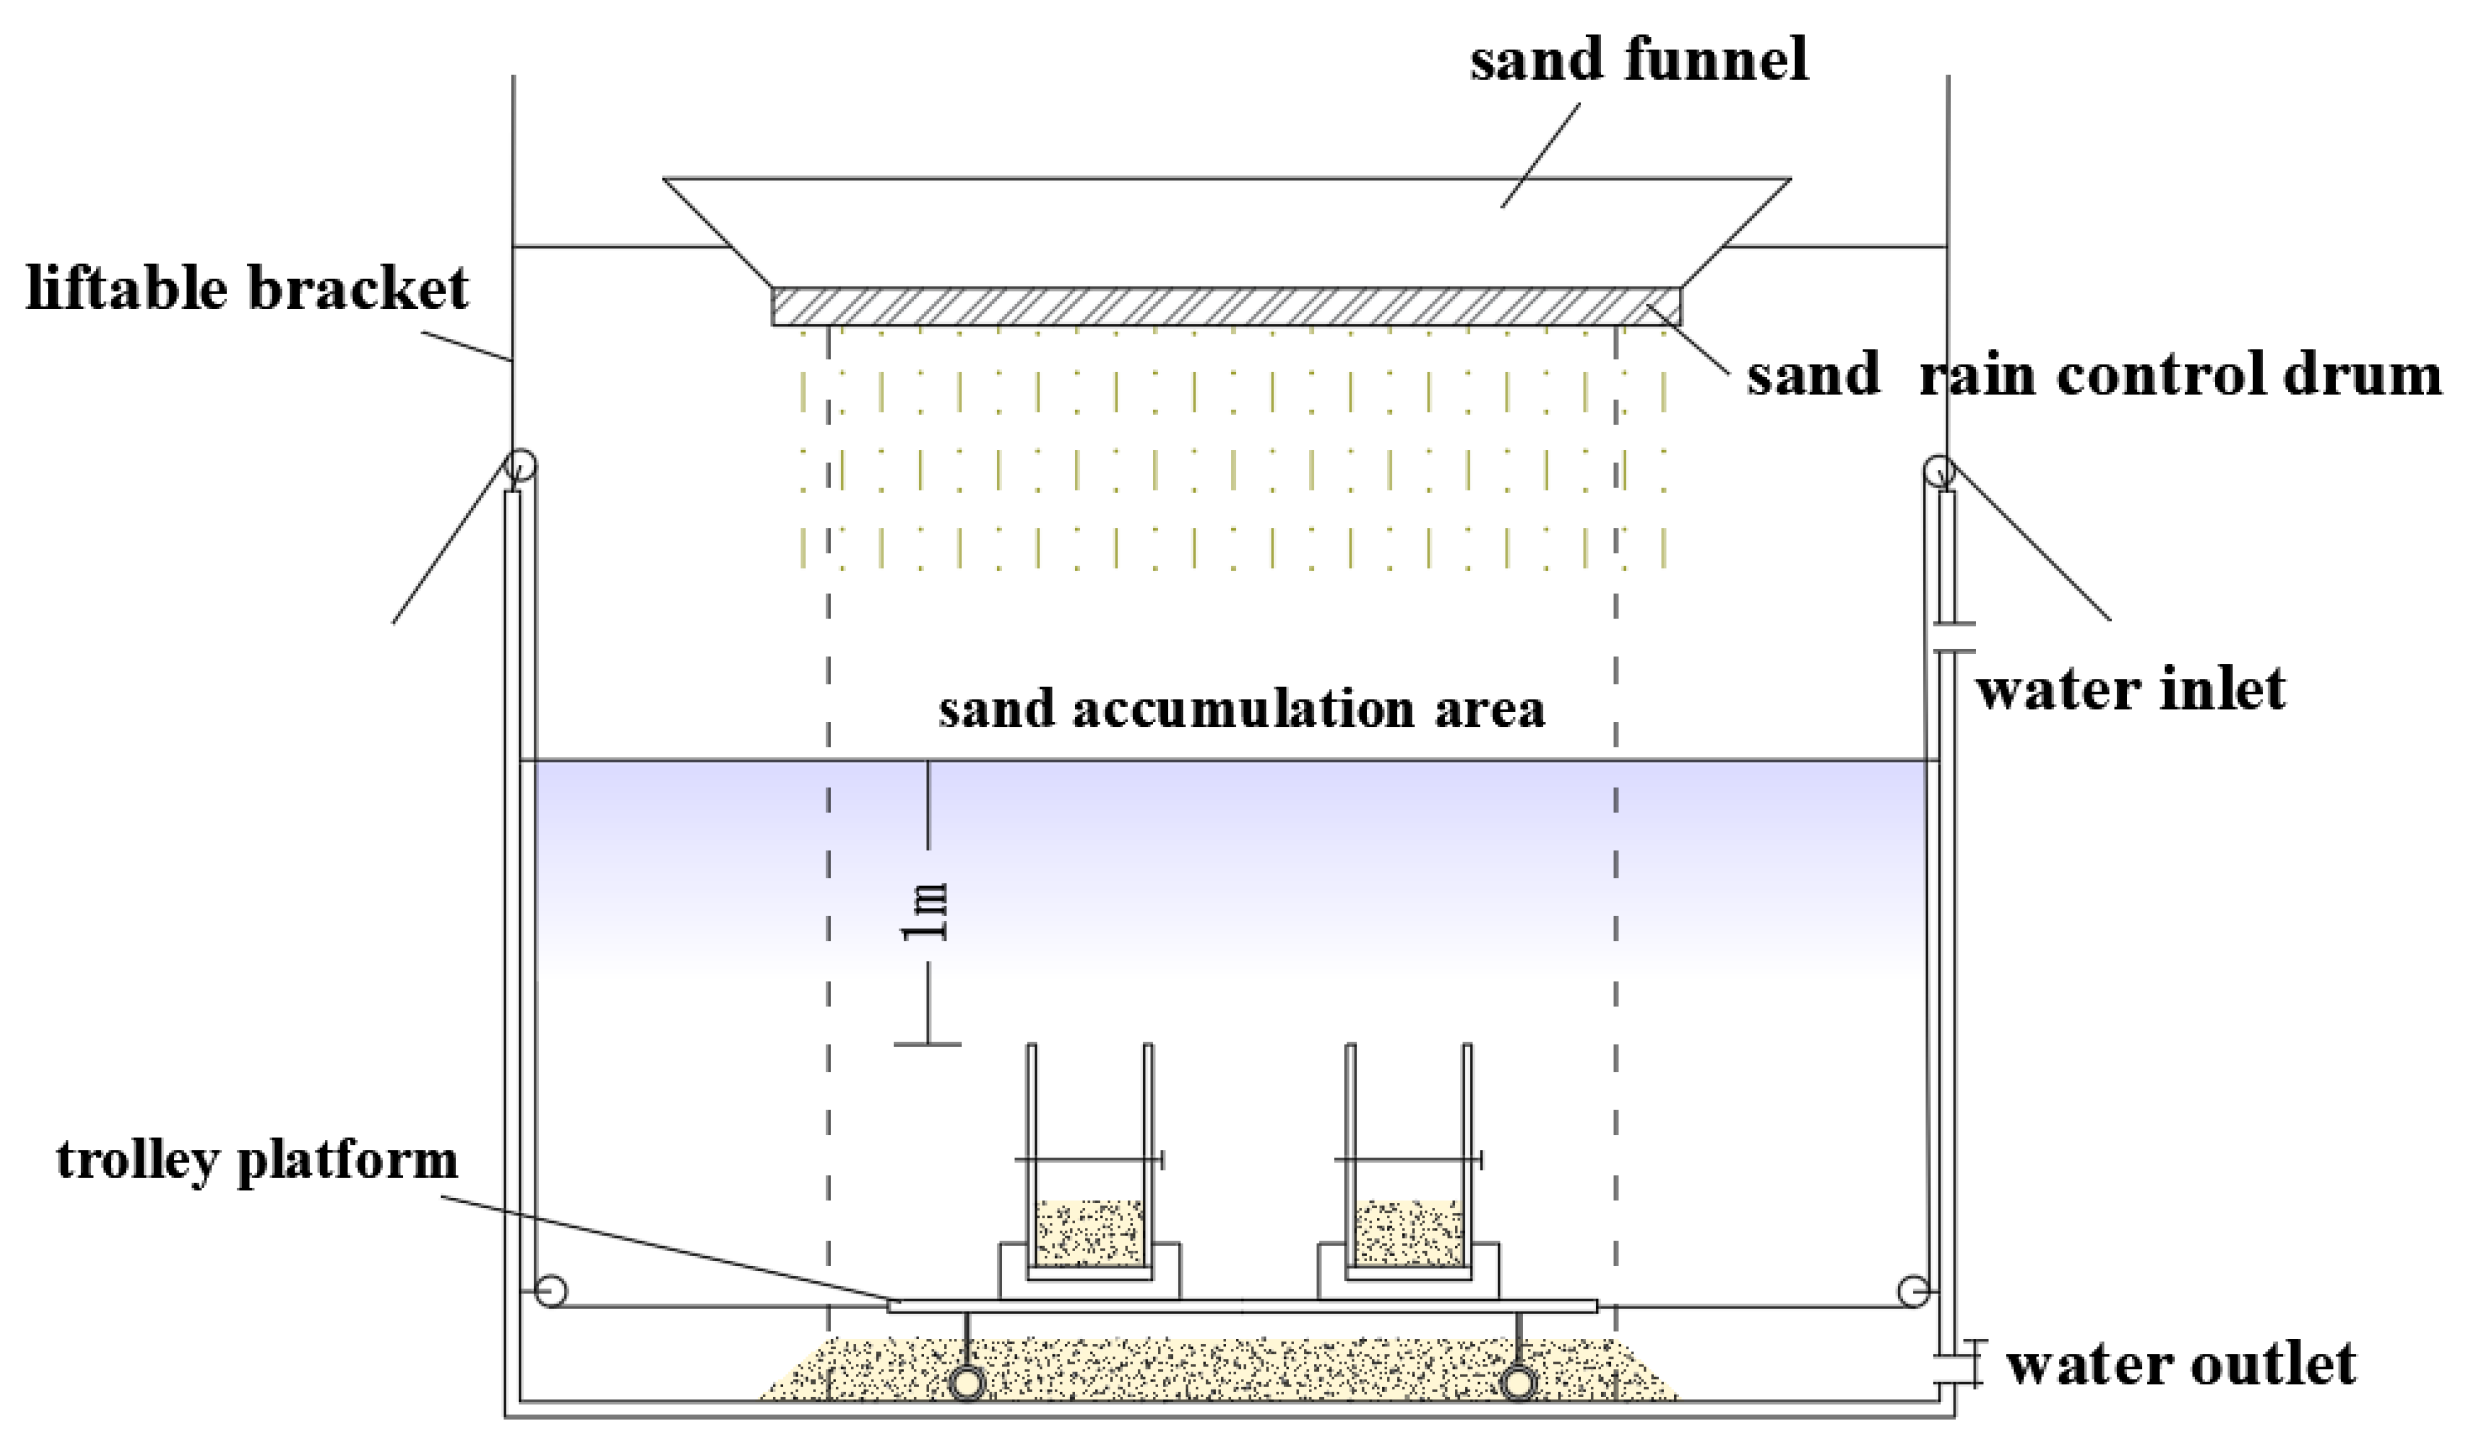
- Use the sample preparation device of sand pluviation method (as shown in Figure 4) for sample preparation:
- ➂
- Store the reconstituted samples in a vacuum saturator to saturate for 12 h;
- ➃
- Place the saturated samples on the freeze–thaw device (as shown in Figure 5) and set the preloading:
- ➄
- Put the freeze–thaw device with sample under a certain confining pressure of weights into a DW-40 type low temperature test chamber and freeze for 12 h. The freezing temperature matches the experimental program. After freezing, take it out to room temperature (constant temperature 20 °C by air conditioner) and thaw for 12 h. In this way, cycle the freeze–thaw operation until the design freeze–thaw cycles are reached.
- ➅
- Make the SEM sample and observe its microstructure:
- ➆
- Use LST to further determine the particle characteristics of soil:
4. Test Results
4.1. Qualitative Analysis of Particle Structure of Silt under Freeze–Thaw Cycles by SEM
4.2. Quantitative Analysis of Particle Structure of Silt under Freeze–Thaw Cycles by LST
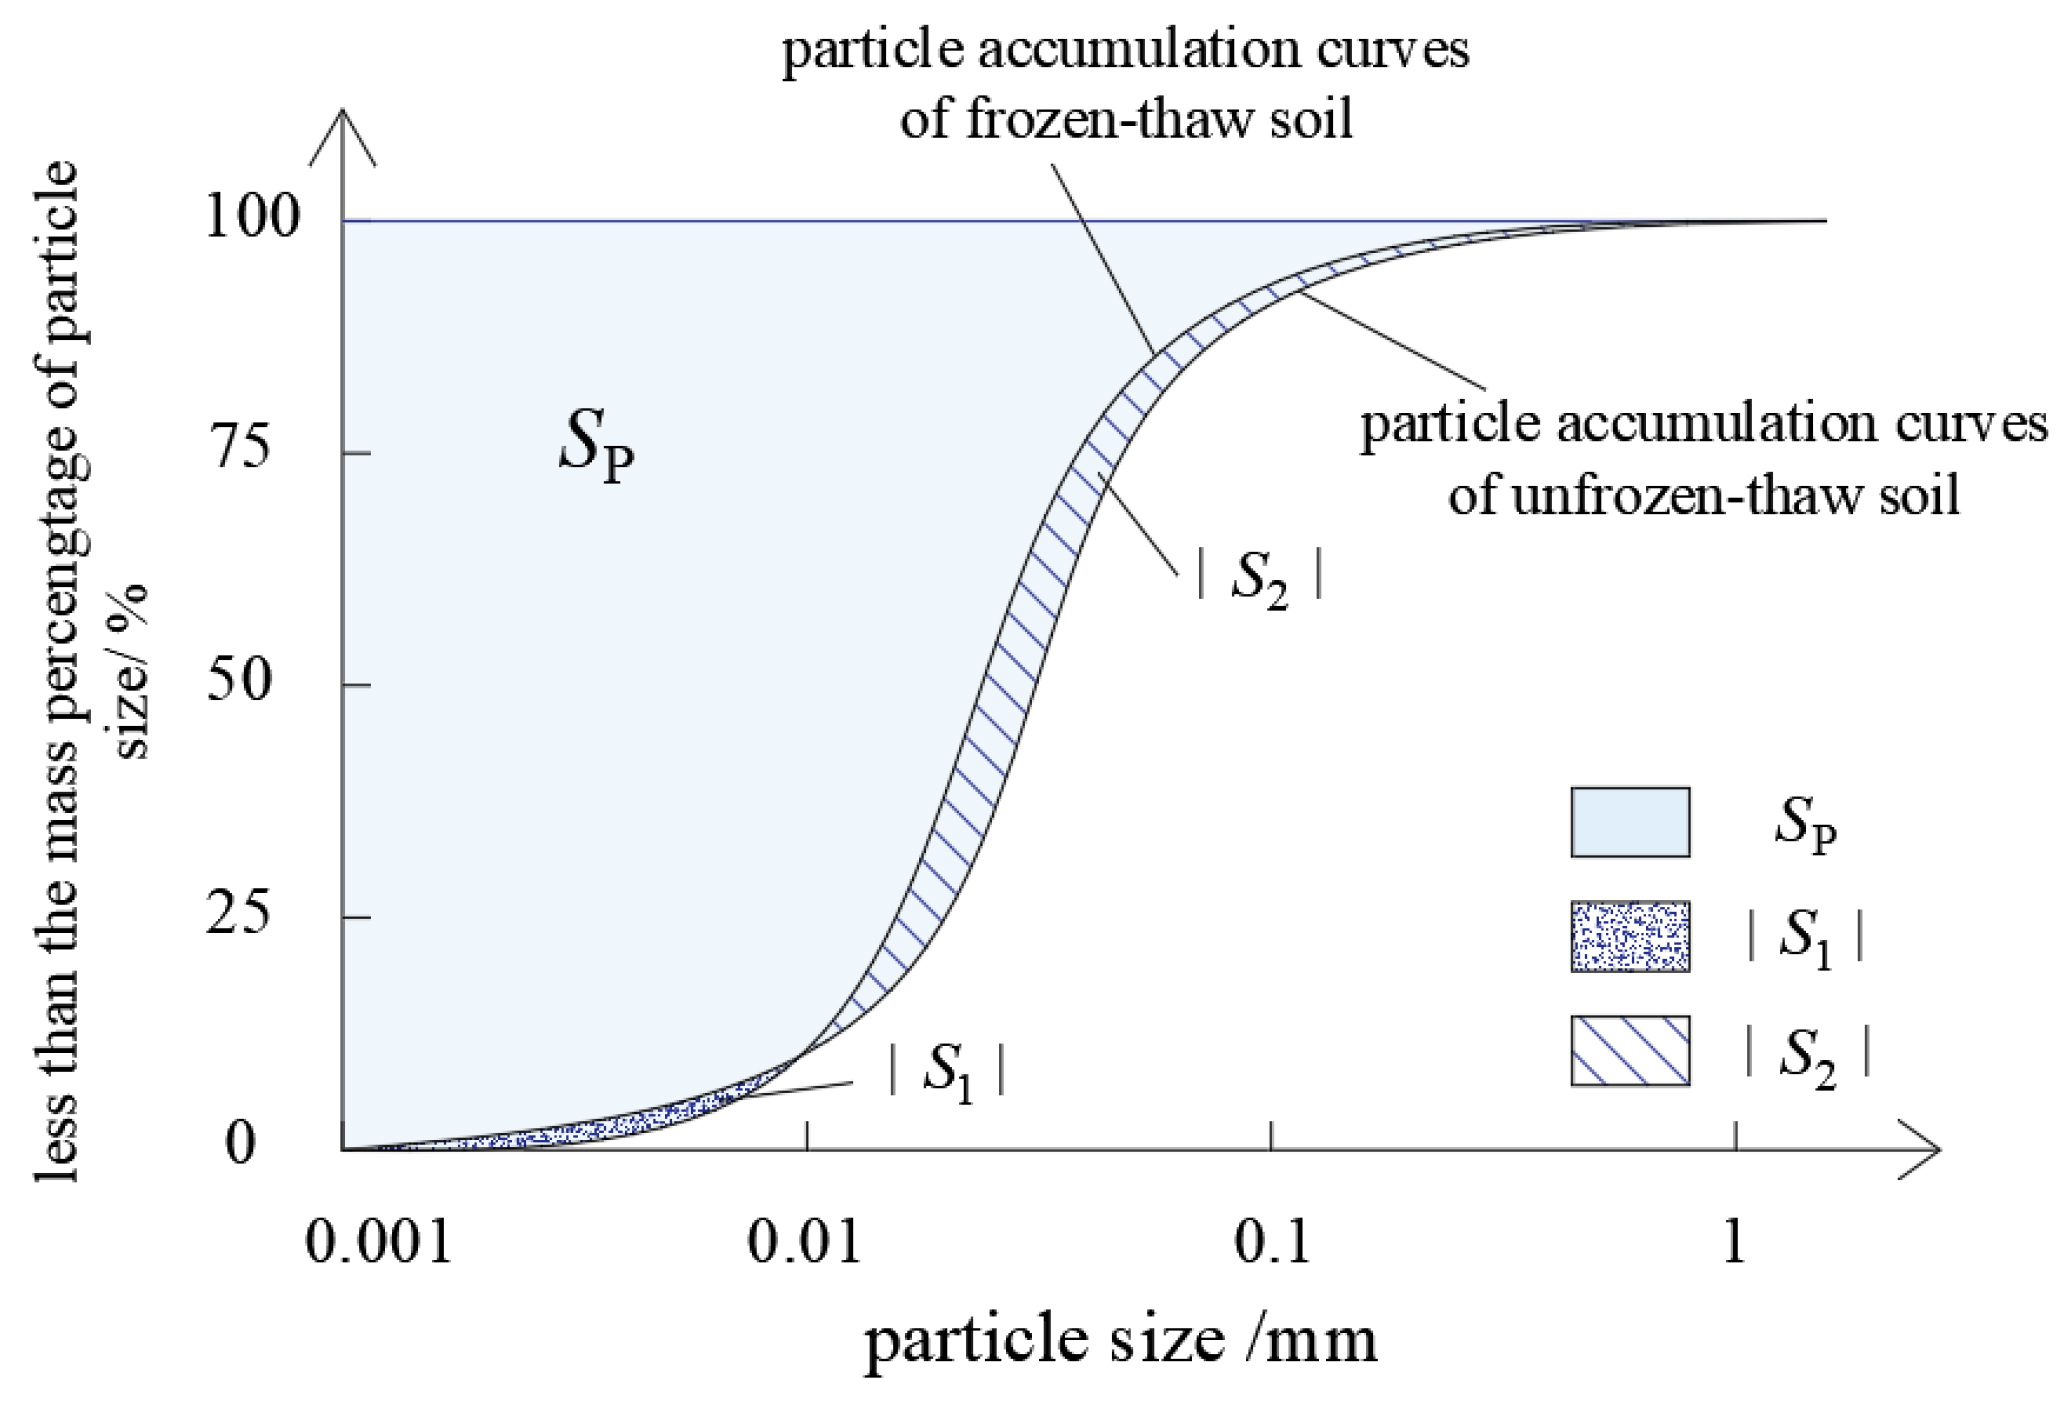
4.2.1. Particle Characteristic Evaluation Parameters Establishment
4.2.2. The Particle Characteristics of Silt under Freeze–Thaw Cycles
4.3. Particle Characteristics of Freeze–Thaw Effect under Different Impact Factors
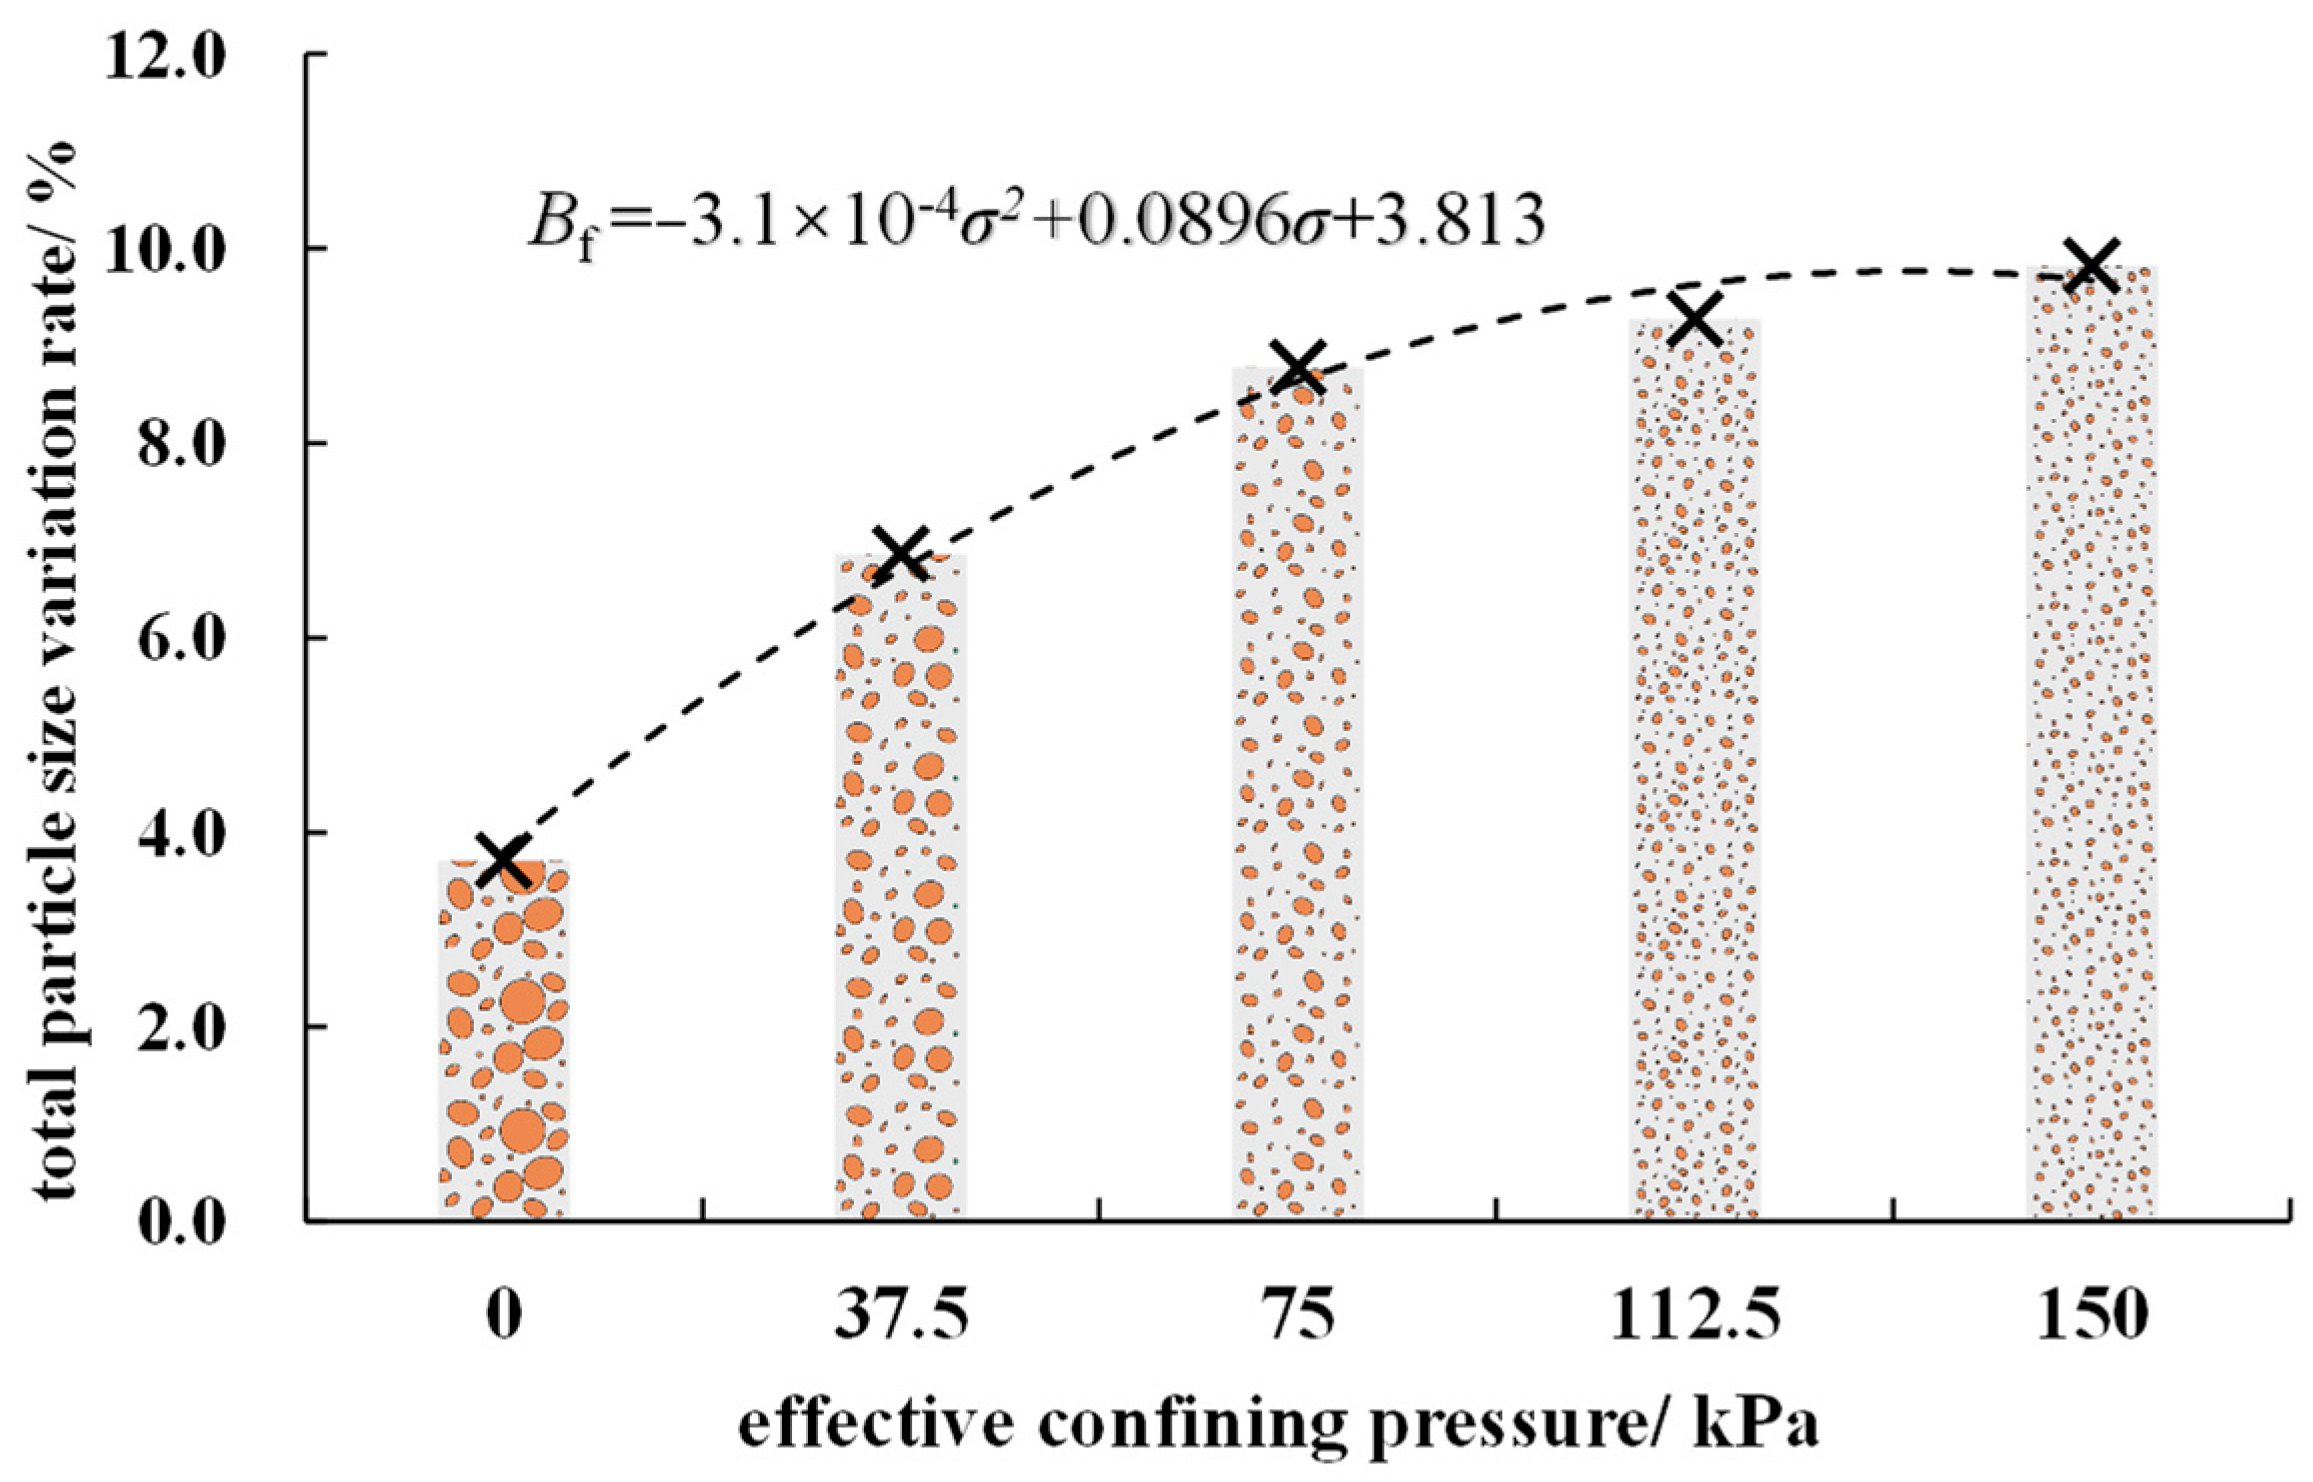
4.3.1. Confining Pressure
4.3.2. Freezing Temperature
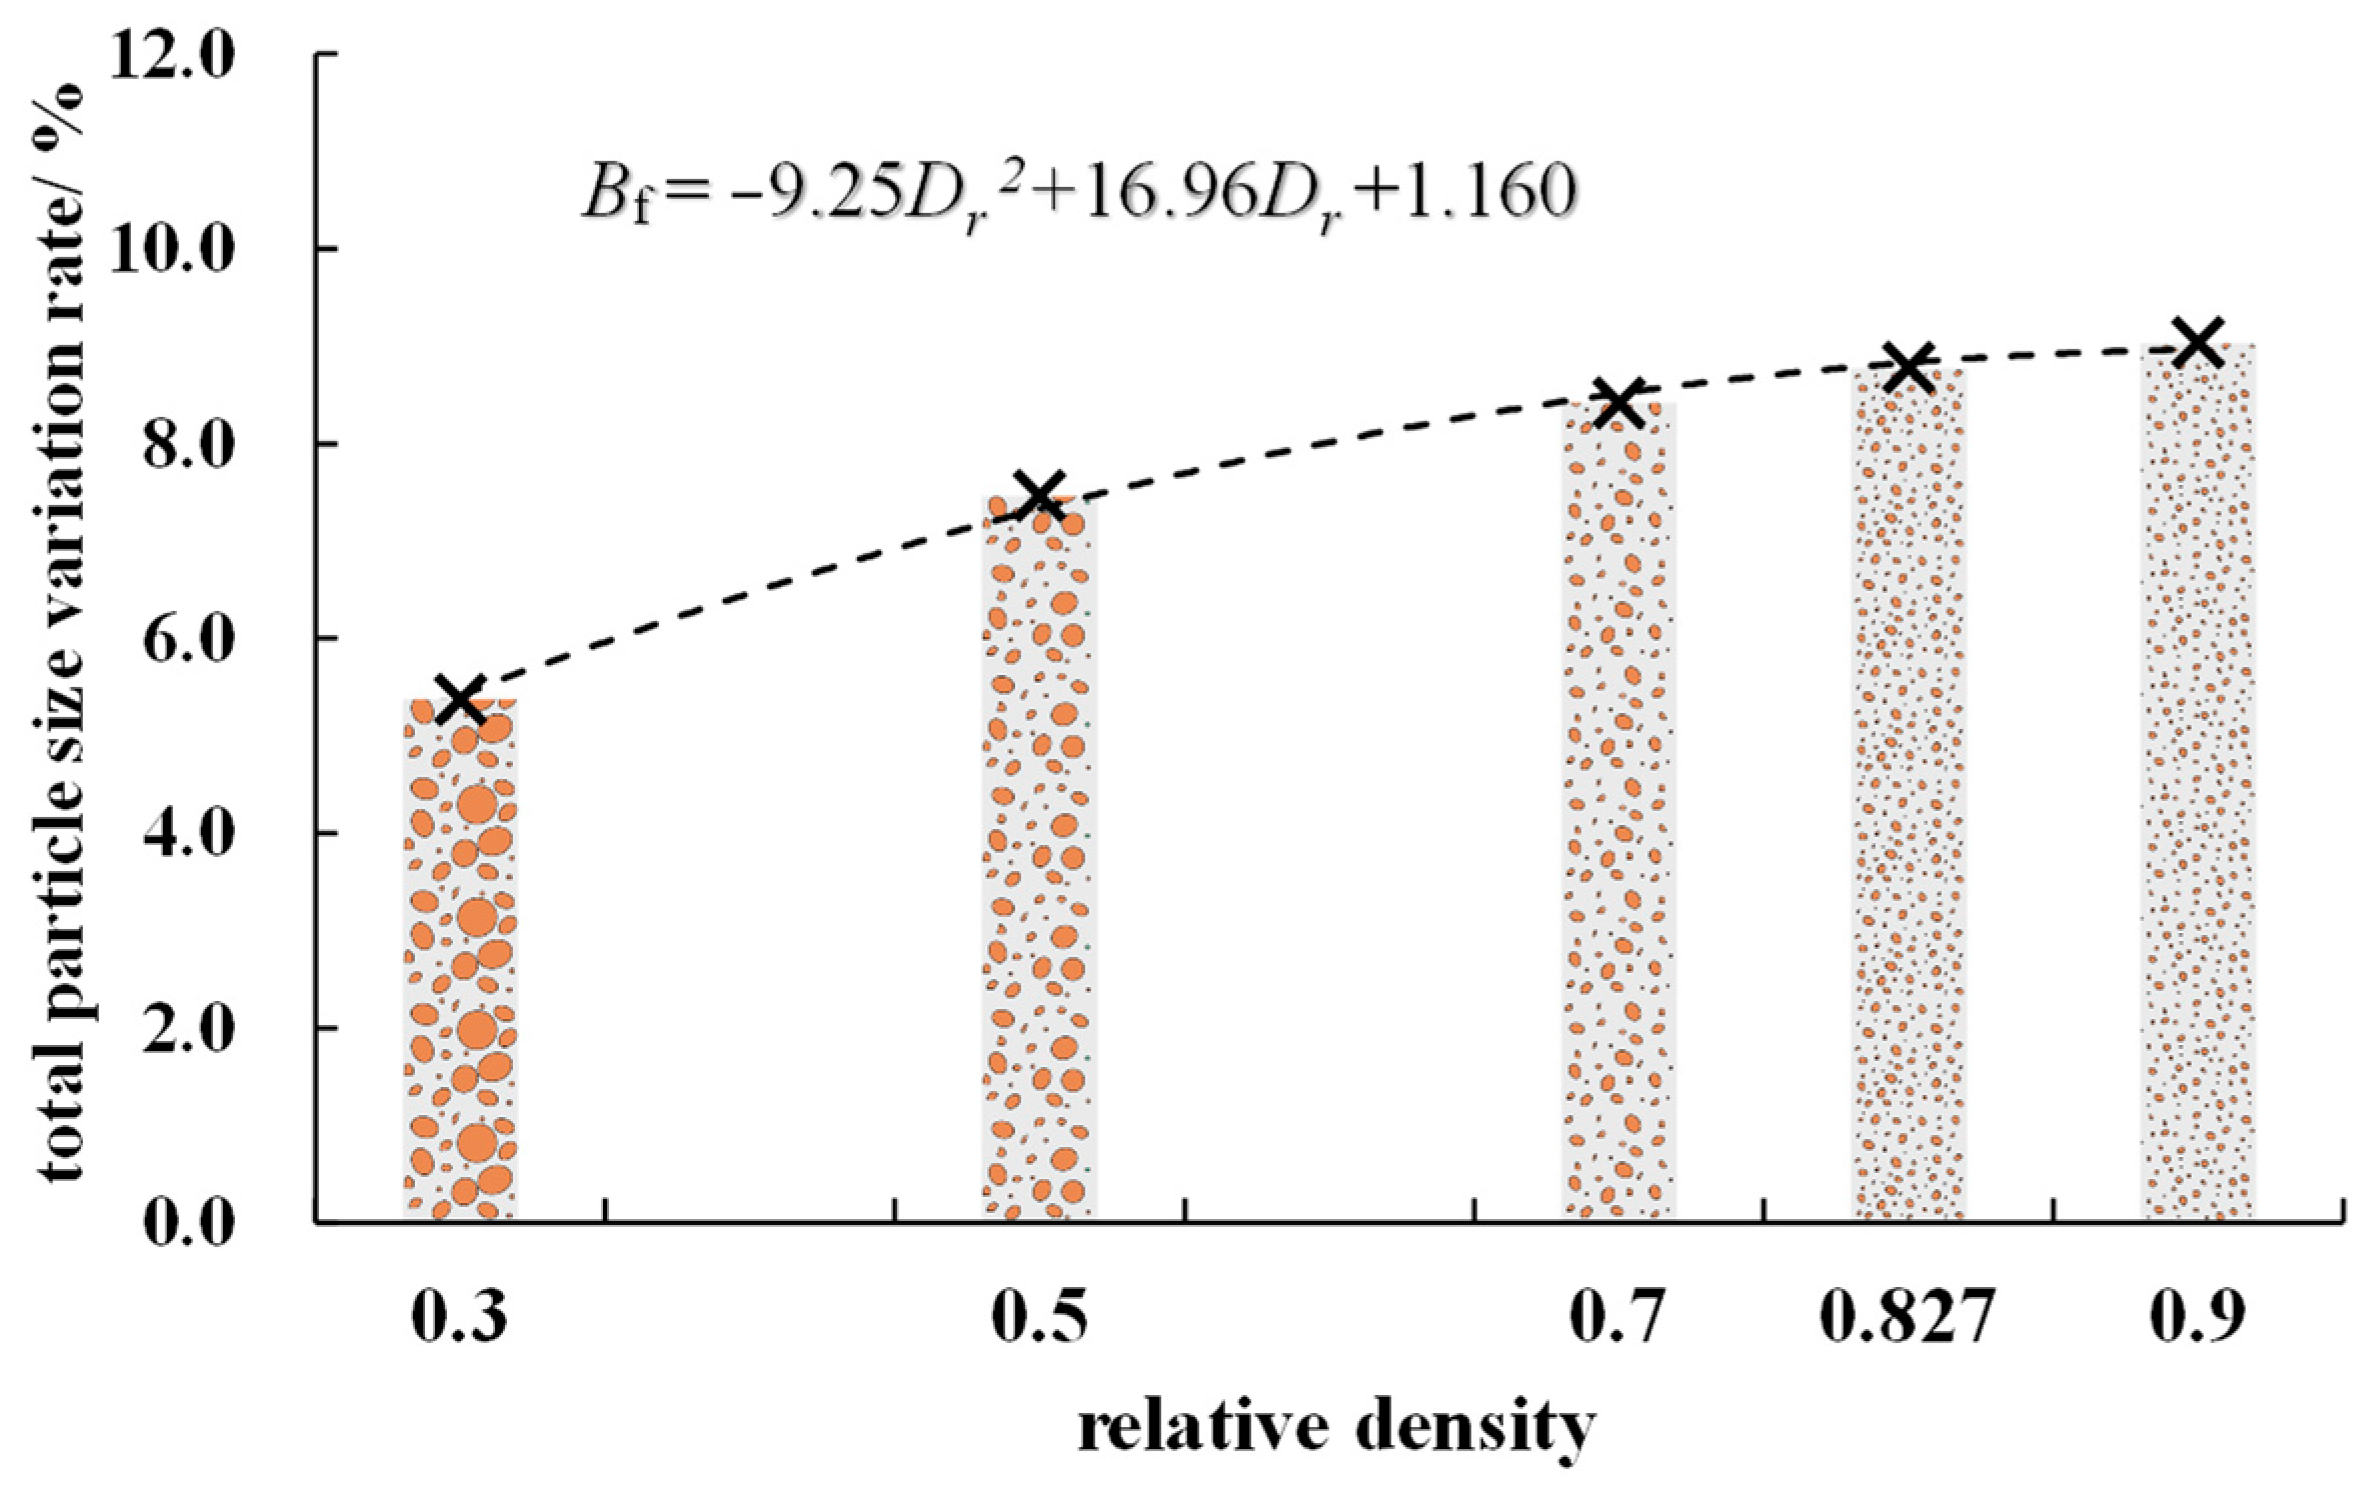
4.3.3. Compaction Degree
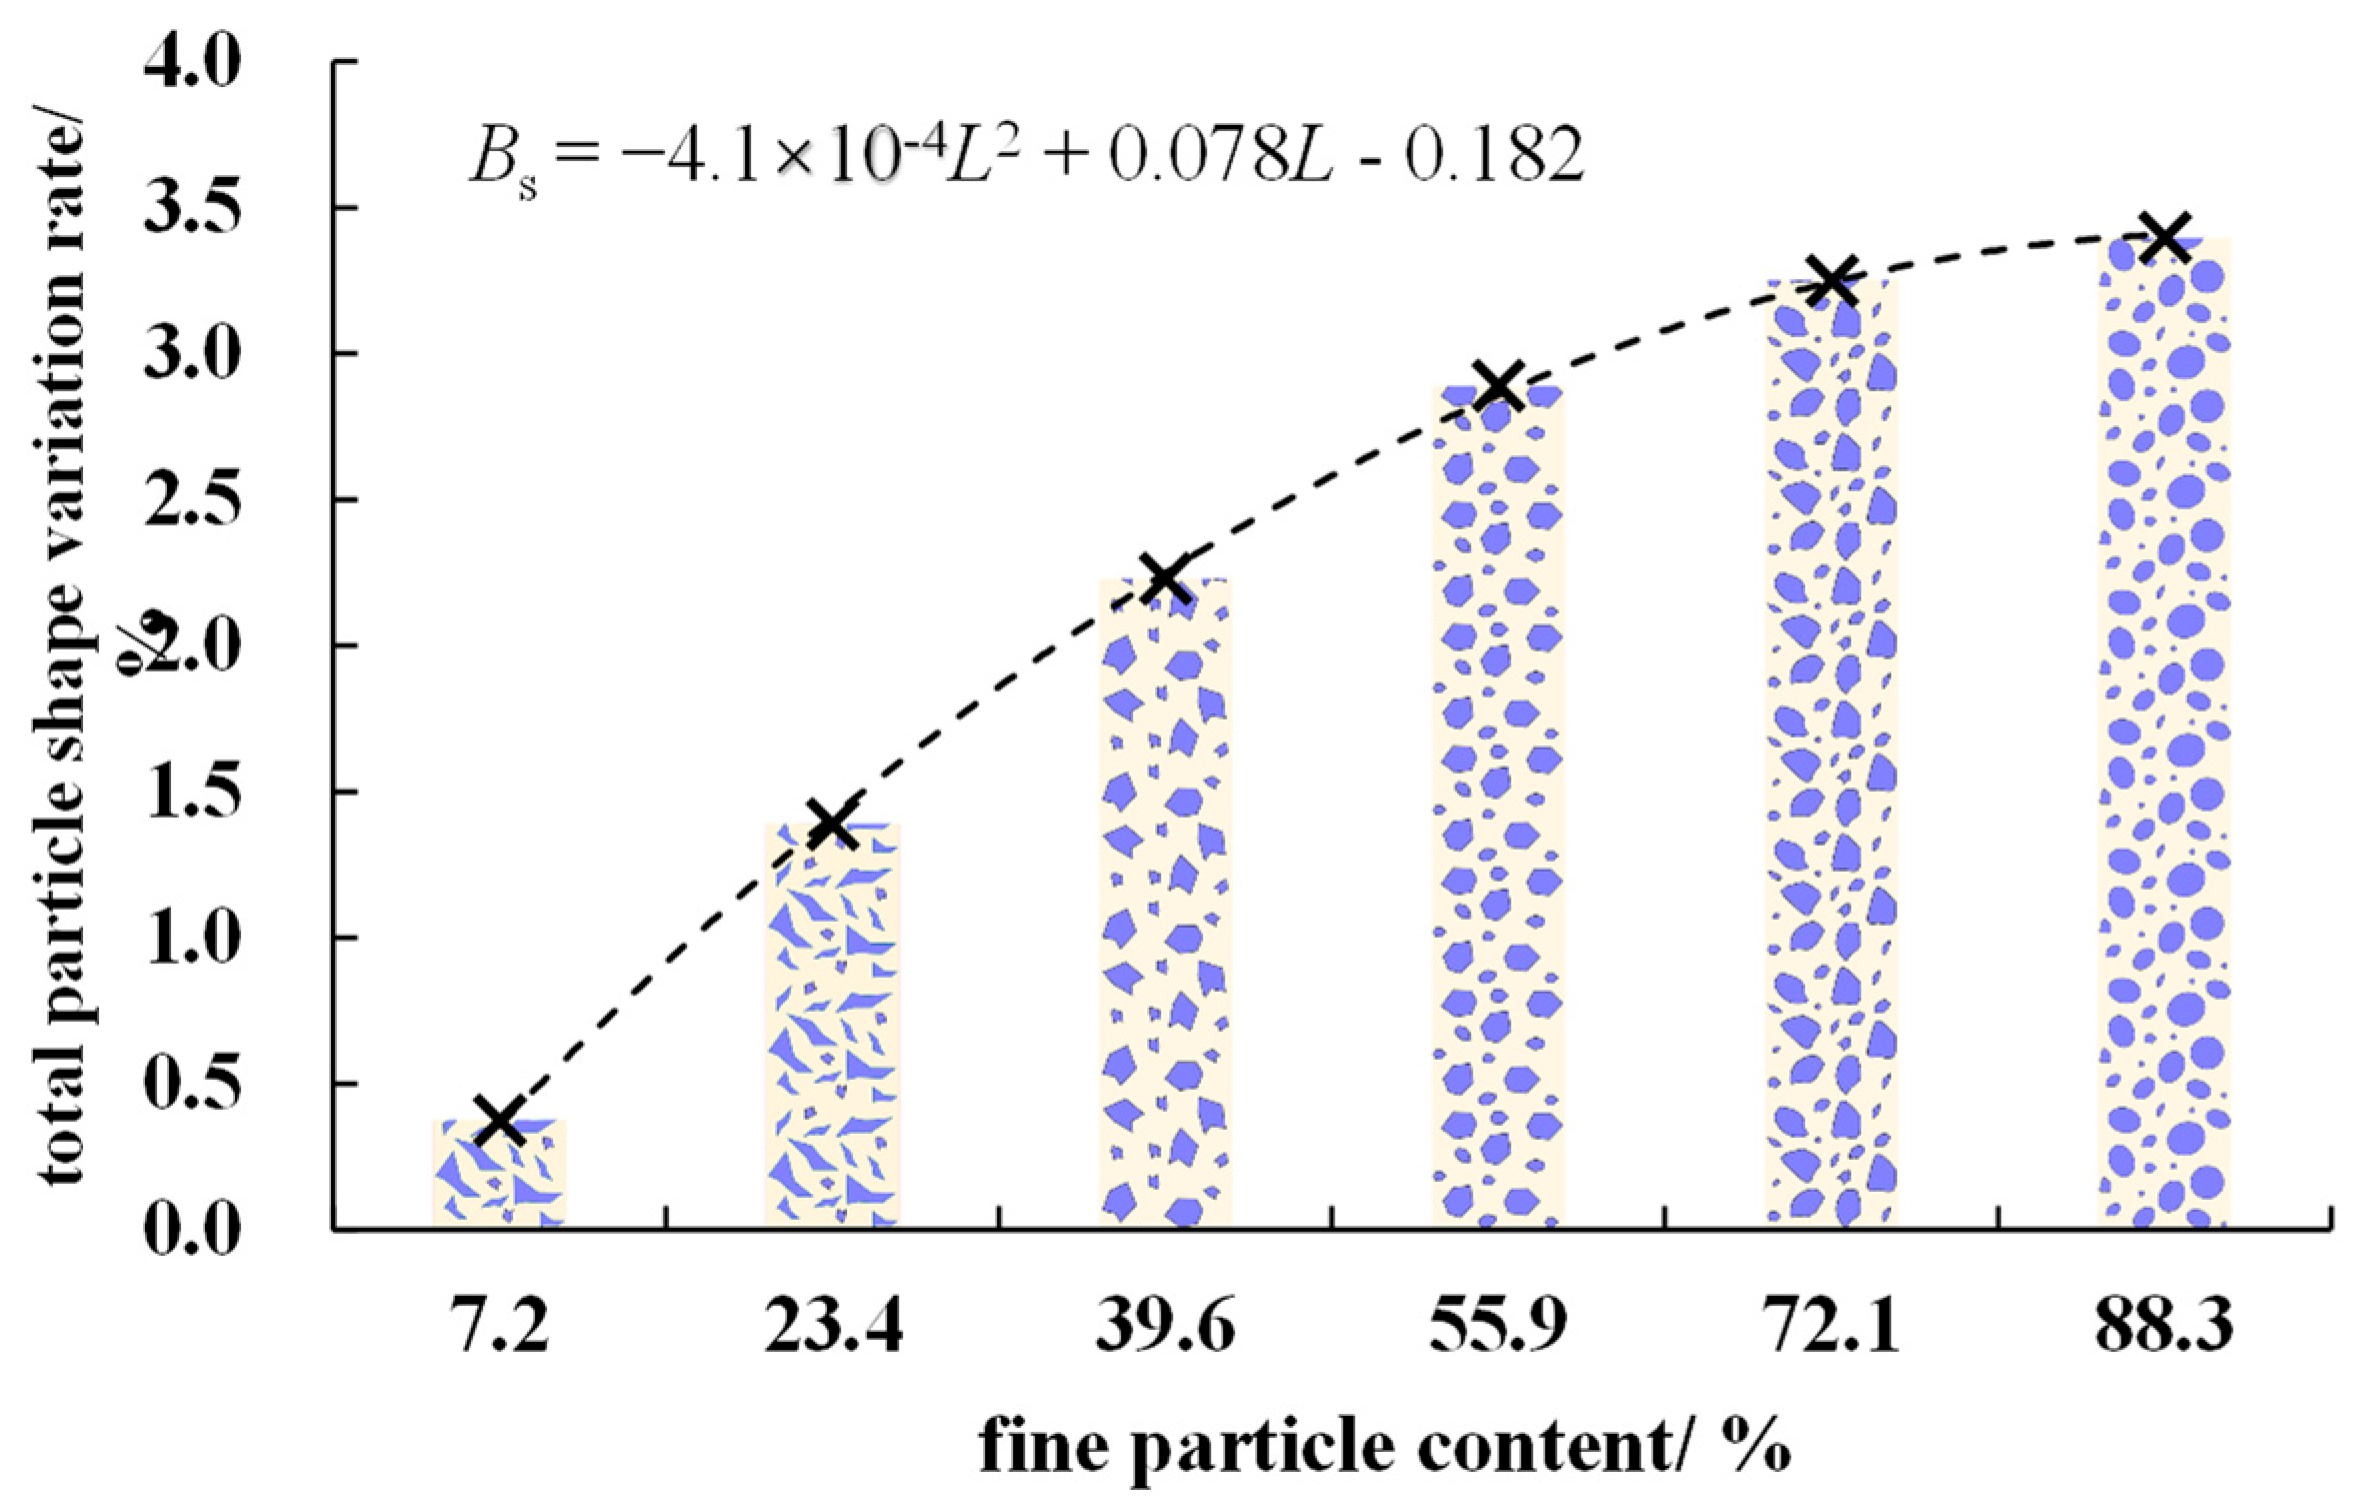
4.3.4. Fine Content
5. Mechanism and Discussion
6. Conclusions
- (1)
- Different for the only sand particle crushing in conventional soil shearing, freeze–thaw action could probably induce the particles’ (60–200 μm) breakage, and also affect the clay particles’ (less than 5 μm) aggregation and form flocculent structure. The diameters of flocculent structures and broken particles range from 5–60 μm. With continuous freeze–thaw cycles, this phenomenon could be more obvious. Freeze–thaw action could hardly influence the shape of particles smaller than 40 µm, and could make the shape of particles larger than 40 µm more spherical (especially larger than 100 µm).
- (2)
- Two parameters of particle size index and particle shape index are defined and specifically improved to quantitively evaluate the particle characteristics of silt under freeze–thaw action. They both hyperbolically increase with freeze–thaw cycles. Within 100 times, the influence degree of single freeze–thaw cycle on the particle size/shape of silt becomes smaller and gets more stable.
- (3)
- Greater effective confining pressure, lower freezing temperature, greater compaction degree, and higher fine content could aggravate the influence of freeze–thaw cycles on particles’ size and particles’ shape for silt to a certain extent. From another aspect, the durability of pavements under freeze–thaw cycles could be comprehensively evaluated and controlled by these impact factors.
- (4)
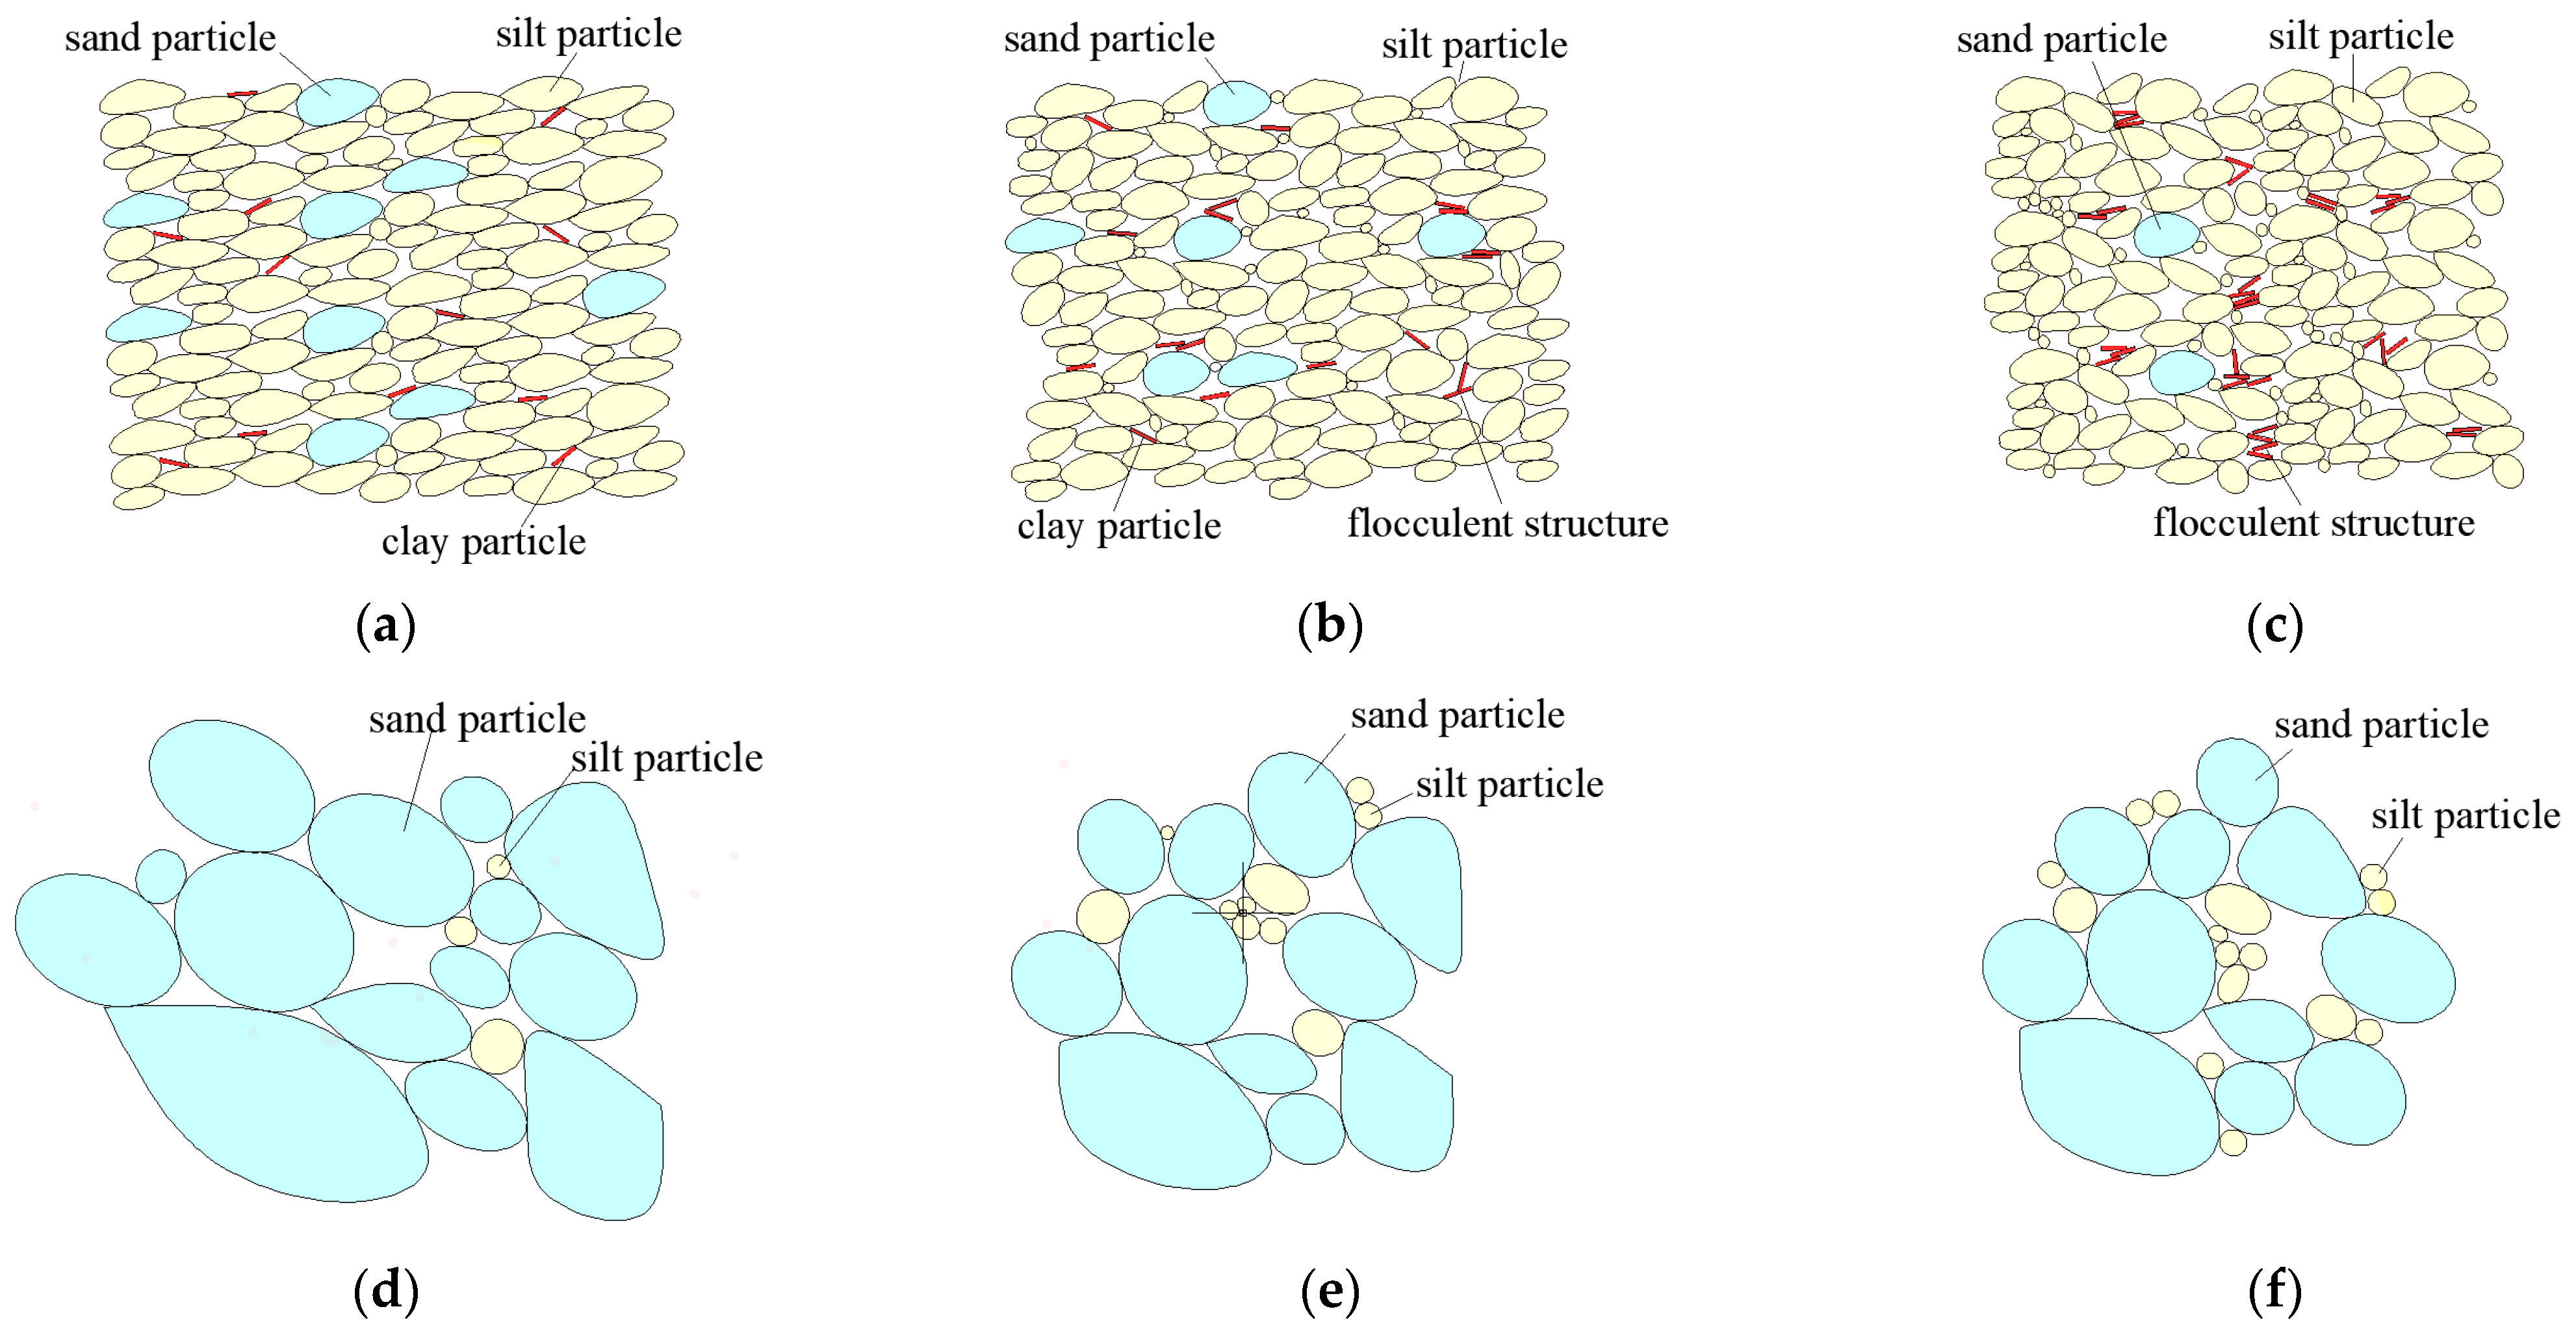
- From a perspective of freeze–thaw mechanism on different soil particles, two micro-structural evolution modes of particle characteristics under freeze–thaw action from initial freeze–thaw cycle to long-term freeze–thaw cycles have been inferred. The main distinction is the role of fine aggregate, especially for clay particles.
Author Contributions
Funding
Conflicts of Interest
References
- Arturo, E.C. The Frost Behavior of Soils. Part I: Vertical Sorting. In Highway Research Board Bulletin; U.S. Army Cold Regions Research and Engineering Laboratory: Hanover, NH, USA, 1962; pp. 9–34. [Google Scholar]
- Arturo, E.C. The Frost Behavior of Soils: Laboratory and Field Data for a New Concept. Part Ⅱ: Horizontal Sorting. In Highway Research Board Bulletin; U.S. Army Cold Regions Research and Engineering Laboratory: Hanover, NH, USA, 1962; pp. 46–64. [Google Scholar]
- Edwin, J.C.; Anthony, J.G. Effect of freezing and thawing on the permeability and structure of soils. Eng. Geol. 1979, 13, 73–92. [Google Scholar]
- Konrad, J.M. Physical processes during freeze-thaw cycles in clayey silts. Cold Reg. Sci. Technol. 1989, 16, 291–303. [Google Scholar] [CrossRef]
- Qi, J.L.; Zhang, J.M.; Zhu, Y.L. The significance of soil mechanics of the effects of freezing and thawing on soil structure. Chin. J. Rock Mech. Eng. 2003, S2, 2690–2694. [Google Scholar]
- Mu, Y.H.; Ma, W.; Li, G.Y.; Mao, Y.C. Quantitative analysis of impacts of freeze-thaw cycles upon microstructure of compacted loess. Chin. J. Geotech. Eng. 2011, 33, 1919–1925. [Google Scholar]
- Tan, Y.Z.; Wu, P.; Fu, W.; Wan Z, W.; Zhang, H.; Zhang, Z.H. Strength and micromechanism of improved silt under freeze-thaw cycle effect. Rock Soil Mech. 2013, 34, 2827–2834. [Google Scholar]
- Tang, Y.Q.; Li, J.Z. Test method and application for microstructures of undisturbed silty sand and sandy silt. Environ. Earth Sci. 2018, 77, 657. [Google Scholar] [CrossRef]
- Jin, Q.; Zheng, Y.J.; Cui, X.Z.; Cui, S.Q.; Qi, H.; Zhang, X.N.; Wang, S. Evaluation of dynamic characteristics of silt in Yellow River Flood Field after freeze-thaw cycles. J. Cent. South Univ. 2020, 27, 2113–2122. [Google Scholar] [CrossRef]
- Zheng, Y.J.; Jin, Q.; Cui, X.Z.; Zhang, H.; Liu, Z.Q.; Zhang, J. Dynamic behavior and meso-damage evolution of saturated saline silt from yellow river flooded area under freeze-thaw cycle. China J. Highw. Transp. 2020, 33, 32–44. [Google Scholar]
- Ren, J.; Vanapalli, S.K. Effect of freeze-thaw cycling on the soil-freezing characteristic curve of five Canadian soils. Vadose Zone J. 2020, 19, 1–8. [Google Scholar] [CrossRef]
- Leuther, F.; Schlüter, S. Impact of freeze-thaw cycles on soil structure and soil hydraulic properties. Soil 2021, 7, 179–191. [Google Scholar] [CrossRef]
- Zhou, J.; Li, Z.Y.; Tian, W.J.; Sun, J.W. Effects of Artificial Freezing on Liquefaction Characteristics of Nanjing Sand. China Railw. Sci. 2021, 42, 28–38. [Google Scholar]
- Hardin, B.O. Crushing of soil particles. J. Geotech. Eng. 1985, 111, 1177–1192. [Google Scholar] [CrossRef]
- Cavarretta, I.; Coop, M.R.; O’sullivan, C. The influence of particle characteristics on the behaviour of coarse grained soils. Géotechnique 2010, 60, 413–423. [Google Scholar] [CrossRef]
- Marsal, R.J. Large-scale testing of rockfill materials. ASCE J. Soil Mech. Found. Eng. 1967, 93, 27–43. [Google Scholar] [CrossRef]
- Zhang, S.; Tong, C.X.; Li, X.; Sheng, D. A new method for studying the evolution of particle breakage. Géotechnique 2015, 65, 911–922. [Google Scholar] [CrossRef]
- Miller, R.D. Freezing and heaving of saturated and unsaturated soils. Highw. Res. Rec. 1972, 399, 1–11. [Google Scholar]
- Christ, M.; Kim, Y.C. Experimental study on the physical-mechanical properties of frozen silt. KSCE J. Civ. Eng. 2009, 13, 317–324. [Google Scholar] [CrossRef]
- Kim, S.Y.; Hong, W.T.; Lee, J.S. Silt fraction effects of frozen soils on frozen water content, strength, and stiffness. Constr. Build. Mater. 2018, 183, 565–577. [Google Scholar] [CrossRef]
- Coop, M.R.; Sorensen, K.K.; Freitas, T.B.; Georgoutsos, G. Particle breakage during shearing of a carbonate sand. Géotechnique 2004, 54, 157–163. [Google Scholar] [CrossRef]
- Fan, W.; Yang, P. Ground temperature characteristics during artificial freezing around a subway cross passage. Transp. Geotech. 2019, 20, 100250. [Google Scholar] [CrossRef]


| Water Content/% | Unit Weight/(kN/m3) | Natural Void Ratio | Particles Specific Gravity | Maximum Void Ratio | Minimum Void Ratio | Cohesion/kPa | Internal Friction Angle/° | Compression Modulus/kPa | Uniformity Coefficient | Fine Particle Content/% | |
|---|---|---|---|---|---|---|---|---|---|---|---|
| silt | 27.3 | 18.9 | 0.797 | 2.69 | 1.31 | 0.69 | 7.2 * | 28.1 * | 10.27 | 6.09 | 88.3 |
| silty sand | 24.8 | 19.4 | 0.734 | 2.70 | 1.18 | 0.65 | 5.3 * | 30.6 * | 10.82 | 1.89 | 7.2 |
| Sample Label | Soil Type | Freeze–Thaw Cycles | Simulation Depth/m | Vertical Confining Pressure & Effective Confining Pressure/kPa | Freezing Temperature/℃ | Compaction Degree | Fine Particle Content/% | Remark |
|---|---|---|---|---|---|---|---|---|
| A0 | silt | 0 | 7.8 | 150&75 | / | 0.827 | 88.3 | |
| A1 | silt | 10 | 7.8 | 150&75 | −20 | 0.827 | 88.3 | |
| A2 | silt | 20 | 7.8 | 150&75 | −20 | 0.827 | 88.3 | Basic test |
| A3 | silt | 30 | 7.8 | 150&75 | −20 | 0.827 | 88.3 | |
| A4 | silt | 50 | 7.8 | 150&75 | −20 | 0.827 | 88.3 | |
| A5 | silt | 100 | 7.8 | 150&75 | −20 | 0.827 | 88.3 | |
| A6 | silt | 20 | 0.0 | 0&0.0 | −20 | 0.827 | 88.3 | |
| A7 | silt | 20 | 3.8 | 75&37.5 | −20 | 0.827 | 88.3 | |
| A8 | silt | 20 | 11.6 | 225&112.5 | −20 | 0.827 | 88.3 | |
| A9 | silt | 20 | 15.4 | 250&125 | −20 | 0.827 | 88.3 | |
| A10 | silt | 20 | 7.8 | 150&75 | −20 | 0.300 | 88.3 | |
| A11 | silt | 20 | 7.8 | 150&75 | −20 | 0.500 | 88.3 | |
| A12 | silt | 20 | 7.8 | 150&75 | −20 | 0.700 | 88.3 | |
| A13 | silt | 20 | 7.8 | 150&75 | −20 | 0.900 | 88.3 | |
| A14 | silt | 50 | 7.8 | 150&75 | −5 | 0.827 | 88.3 | |
| A15 | silt | 50 | 7.8 | 150&75 | −10 | 0.827 | 88.3 | |
| A16 | silt | 100 | 7.8 | 150&75 | −30 | 0.827 | 88.3 | |
| C1 | prepared soil | 20 | 7.8 | 150&75 | −20 | 0.830 | 23.4 | Silty sand |
| C2 | prepared soil | 20 | 7.8 | 150&75 | −20 | 0.833 | 39.6 | Silty sand |
| C3 | prepared soil | 20 | 7.8 | 150&75 | −20 | 0.836 | 55.9 | Silt |
| C4 | prepared soil | 20 | 7.8 | 150&75 | −20 | 0.839 | 72.1 | Silt |
Publisher’s Note: MDPI stays neutral with regard to jurisdictional claims in published maps and institutional affiliations. |
© 2022 by the authors. Licensee MDPI, Basel, Switzerland. This article is an open access article distributed under the terms and conditions of the Creative Commons Attribution (CC BY) license (https://creativecommons.org/licenses/by/4.0/).
Share and Cite
Zhou, J.; Li, Z.; Pei, W. The Quantification and Evolution of Particle Characteristics of Saturated Silt under Freeze–Thaw Cycles. Appl. Sci. 2022, 12, 10703. https://doi.org/10.3390/app122110703
Zhou J, Li Z, Pei W. The Quantification and Evolution of Particle Characteristics of Saturated Silt under Freeze–Thaw Cycles. Applied Sciences. 2022; 12(21):10703. https://doi.org/10.3390/app122110703
Chicago/Turabian StyleZhou, Jie, Zeyao Li, and Wansheng Pei. 2022. "The Quantification and Evolution of Particle Characteristics of Saturated Silt under Freeze–Thaw Cycles" Applied Sciences 12, no. 21: 10703. https://doi.org/10.3390/app122110703
APA StyleZhou, J., Li, Z., & Pei, W. (2022). The Quantification and Evolution of Particle Characteristics of Saturated Silt under Freeze–Thaw Cycles. Applied Sciences, 12(21), 10703. https://doi.org/10.3390/app122110703