Article

Pre-Inpainting Convolutional Skip Triple Attention Segmentation Network for AGV Lane Detection in Overexposure Environment

1
School of Computer Science and Technology, Zhejiang Sci-Tech University, Hangzhou 310018, China
2
Institute of Land Aviation, Beijing 101121, China
3
Institute of Optical Target Simulation and Test Technology, Harbin Institute of Technology, Harbin 150001, China
*
Authors to whom correspondence should be addressed.
Appl. Sci. 2022, 12(20), 10675; https://doi.org/10.3390/app122010675
Submission received: 12 September 2022 / Revised: 13 October 2022 / Accepted: 19 October 2022 / Published: 21 October 2022

Abstract

:
Visual navigation is an important guidance method for industrial automated guided vehicles (AGVs). In the actual guidance, the overexposure environment may be encountered by the AGV lane image, which seriously reduces the accuracy of lane detection. Although the image segmentation method based on deep learning is widely used in lane detection, it cannot solve the problem of overexposure of lane images. At the same time, the requirements of segmentation accuracy and inference speed cannot be met simultaneously by existing segmentation networks. Aiming at the problem of incomplete lane segmentation in an overexposure environment, a lane detection method combining image inpainting and image segmentation is proposed. In this method, the overexposed lane image is repaired and reconstructed by the MAE network, and then the image is input into the image segmentation network for lane segmentation. In addition, a convolutional skip triple attention (CSTA) image segmentation network is proposed. CSTA improves the inference speed of the model under the premise of ensuring high segmentation accuracy. Finally, the lane segmentation performance of the proposed method is evaluated in three image segmentation evaluation metrics (IoU, F1-score, and PA) and inference time. Experimental results show that the proposed CSTA network has higher segmentation accuracy and faster inference speed.

1. Introduction

Currently, AGVs are widely used in various industries such as automated production, modern logistics warehousing, and transportation [1,2,3]. The guidance methods of AGV include electromagnetic navigation, magnetic stripe navigation, laser navigation, and visual navigation [4,5]. Among them, electromagnetic navigation needs to embed the line into the ground in advance, which has high maintenance cost and is difficult to combine with other navigation methods for intelligent navigation. Magnetic stripe navigation has a similar problem. The equipment of laser navigation has a high manufacturing cost. Laser navigation is sensitive to external light, and has high working environment requirements. Visual navigation takes into account both low cost and high-precision navigation. Visual navigation is divided into traditional computer visual navigation and deep learning-based visual navigation.
Deep learning has been widely used in many fields, such as industry, intelligent manufacturing, medical imaging, and automotive [6,7,8,9]. In this context, deep learning has become one of the important components of AGV navigation [10]. The deep learning-based lane detection is usually formulated as the image segmentation problem [11]. That is, each pixel in the result of segmentation contains the label of its object class for each input. The lane detection based on deep learning image segmentation has been widely used in the field of unmanned vehicle driving. However, in the field of AGV vision line navigation, the deep learning-based image segmentation is not widely used. At present, most of the AGV lane detection methods are based on traditional computer vision lane segmentation and extraction algorithms [12,13,14], such as improved Hough transform [15] and improved Canny algorithm [16]. Although these traditional vision-based lane segmentation and extraction algorithms have made good progress, there is a large gap in real-time performance, accuracy and robustness compared with deep learning methods.
In addition, the requirements of segmentation accuracy and inference speed cannot be met simultaneously by existing image segmentation networks. These networks, such as ERFNet [17], improve the inference speed, but their segmentation accuracy is not satisfactory. PP-LiteSeg [18] and FLANet [19] have good segmentation accuracy, but their real-time performance is poor. Good memory resource-saving ability is possessed by CCNet [20], but its real-time performance is poor. CSTA segmentation network is proposed in this paper, which has fast segmentation speed on the premise of satisfying segmentation accuracy, and is suitable for a real-time AGV visual navigation system. However, when the image collected by AGV has overexposed areas in the lane, all the existing image segmentation methods cannot extract the lane completely. Aiming at the problem of image overexposure in AGV lane detection, recent research mainly focuses on image filtering algorithms and threshold adjustment algorithms [21,22]. When the overexposure degree is too heavy, the existing algorithms cannot reconstruct the lane image. However, the proposed method includes first inpainting the lane image based on deep learning, and then performs image segmentation. By this way to extract the lane trajectory, the proposed method achieved high accuracy in the experiment. The main objective of the work in this paper are as follows:
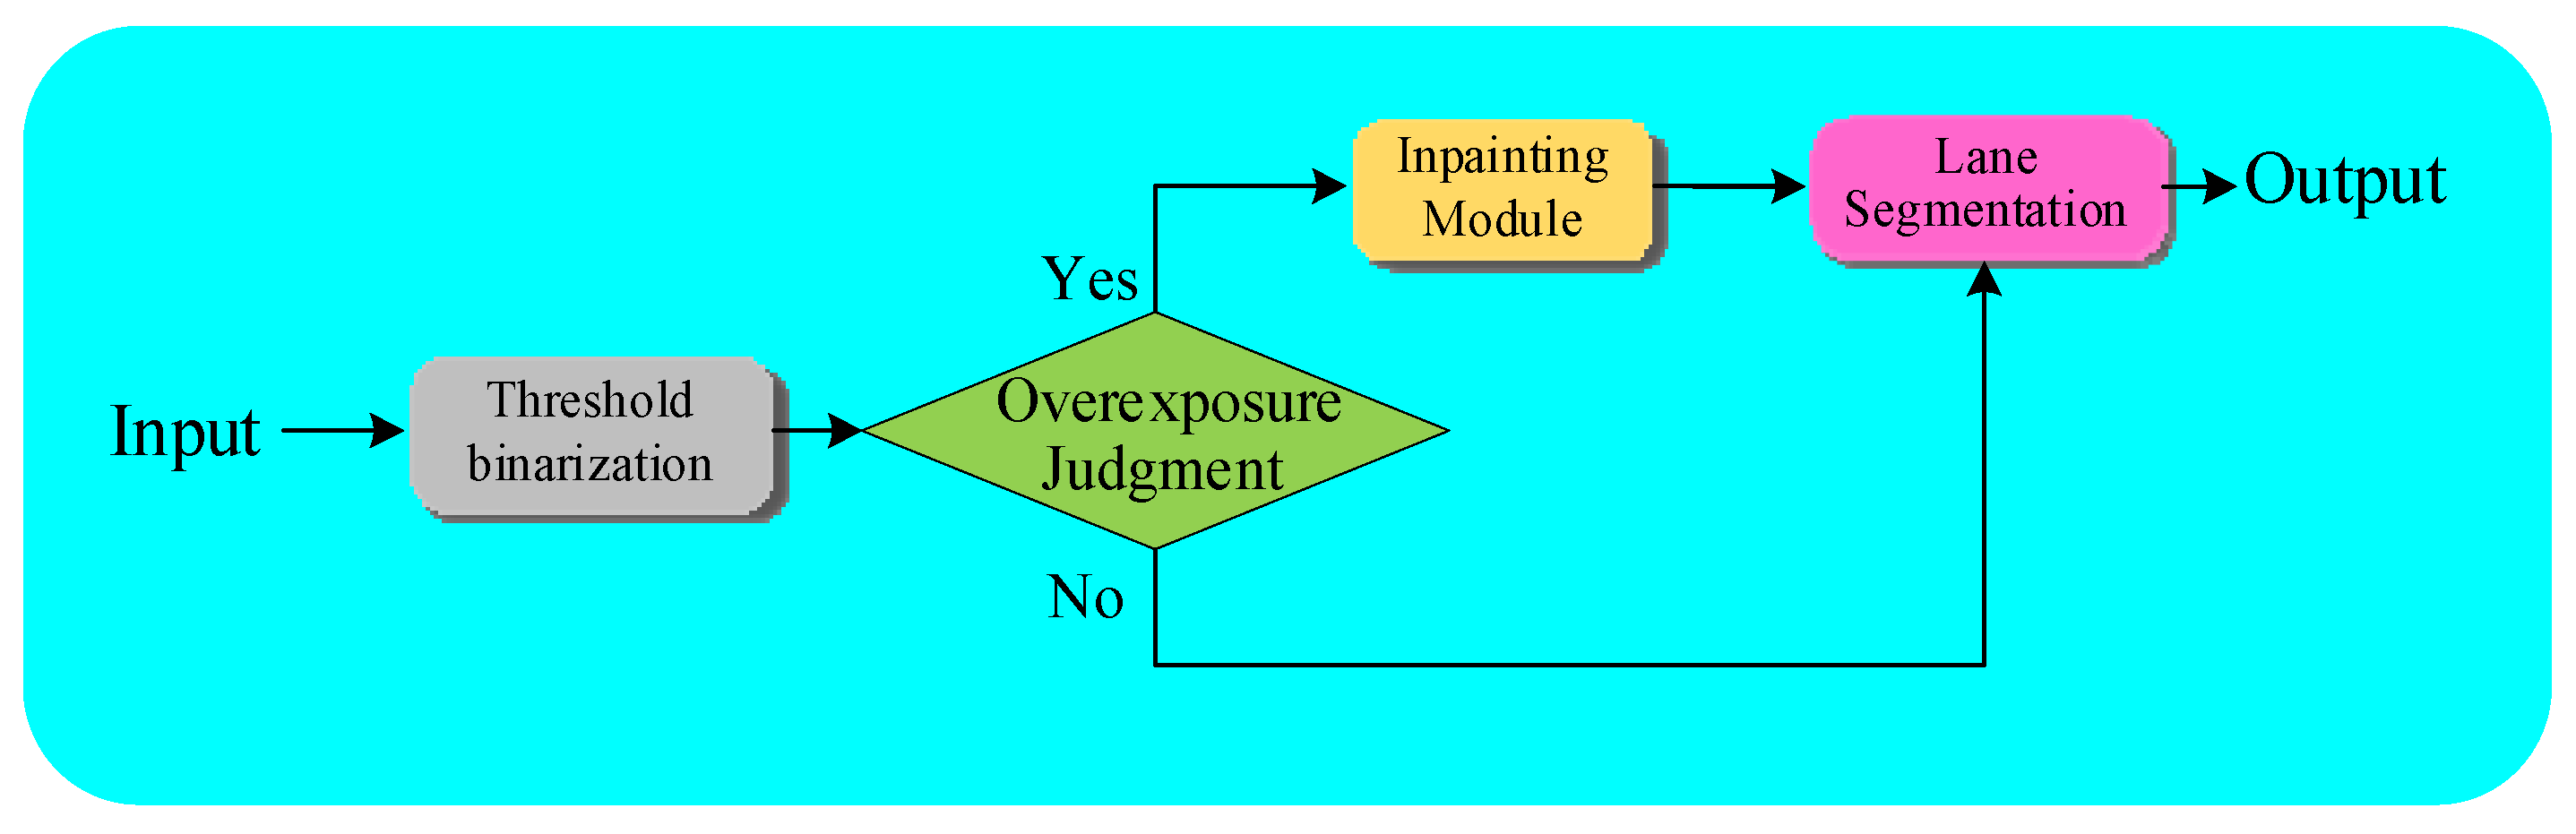
  • An AGV lane extraction method combining image inpainting and image segmentation network is proposed to improve the accuracy of AGV lane segmentation in overexposure conditions;
  • The network parameters of MAE are optimized, reduced, and verified by experiments. On the premise of ensuring the repair quality, the inference speed of MAE model is improved;
  • A convolutional skip triple attention network (CSTA) is designed. It meets the requirements of segmentation accuracy and segmentation speed at the same time. A lightweight backbone network is designed to improve the segmentation speed, and the triple attention module is designed to improve the segmentation accuracy.

2. Related Works

2.1. Image Inpainting

Currently, deep learning-based image inpainting methods have become the dominant approaches for image inpainting. Context encoders [23] is the first approach to employ an encoder–decoder to solve the image inpainting. Currently, more and more work attempts to use generative networks to solve the image inpainting problems. MNPS [24], based on contextual encoders, maintains the structure and details of the missing regions through joint optimization of content and texture networks. GL [25] ensures global and local consistency by introducing global and local contextual discriminators. In addition, some approaches introduce special modules to flexibly extract features. Shift-Net [26] introduces a shift-connected layer in U-Net [27] to fill missing regions of varied shapes with sharp structures and fine textures. SDCGN [28] adds a huge number of skip connections in a symmetric codec set to maximize the semantic extraction process. EdgeConnect [29] accomplishes image inpainting by dividing the problem into edge connection and image complementation. MAE [30] acquires information from the masked regions of the image and reconstructs the original signal based on that. Unlike ordinary self-encoders, MAE uses an asymmetric coding structure where the input to the encoder is only a small partially unmasked region. Moreover, the decoder reconstructs the original signal after adding the position information of the masked region. Some approaches, such as the contextual attention module [31], the multiscale attention module [32], the attention transfer network [33], and the learnable bidirectional attention mechanism [34], include varied attention modules, using features from the context as adaptive references.

2.2. Lane Detection

Due to the successful application of deep learning in computer vision, the research of lane detection has shifted from conventional CV methods to deep learning methods. There are two main deep learning-based methods: (1) row-wise classification method, (2) segmentation-based method.
Row-wise classification method: The row classification method for lane detection is based on the grid segmentation of the input image. The model predicts the cell that is most likely to contain a portion of the lane marks for each row. The approach was first proposed in E2E-LMD [35] and achieved more accurate results on two datasets. In UFAST [36], the row classification method can achieve a high speed only at a limited loss of accuracy. However, the result may be wrong in the cases of two lanes in the image while the method can only identify one cell in each row. In addition, the performance of the line classification method depends on the number of the subdivision of the lane. It is also difficult to determine the shape of the lane accurately.
Segmentation-based detection method: This approach is to classify each pixel, as lanes or background. SCNN [37] presented a segmentation scheme for long and continuous shapes and its effectiveness of segmentation in a real application. However, the complicated network structure leads to its slow inference, which makes it less applicable in practical scenarios. A self-attention refinement module is proposed in CNNs [38] to aggregate context, which uses a lightweight neural network to improve the real-time performance while ensuring segmentation performance. In CurveLane-NAS [39], a curved lane detection algorithm combined with NAS is proposed to capture the global coherence features. The local curvature features of lanes for long lanes are extracted to solve problems in the curved lane detection. Although curved lanes can be clearly identified, the computation time is too long. While ERF-Net [17] guarantees the segmentation accuracy, it also ensures the processing speed in real time. CCNet [20] proposes a crisscross attention module for high-density context acquirement, which can obtain the image context from each pixel. The complete inter-pixel dependency relationship of image can be finally obtained to improve CCNet to achieved good results in the segmentation task. FLANet [19] reformulates the self-attention mechanism into a fully attentional manner. FLANet can harvest feature responses from all other channel maps, and the associated spatial positions as well, through a novel fully attentional module. FLANet encodes both spatial and channel attentions in a single similarity map while maintaining high computational efficiency. It effectively solves the problem of lack of attention in the segmentation process.

3. Methods

3.1. Data Preprocessing

The image data preprocessing is shown in Figure 1. The overexposed region of the image should be marked and fed into the image inpainting module to conduct the restoration. Therefore, the overexposed region in the lane image needs to be obtained automatically from the input image. Due to the convenience and low computational complexity of threshold binarization, this method is utilized to label the overexposed region.
In this study, the lane image captured by the camera is converted to a grayscale image firstly. The converted grayscale image is compared with the preset threshold. Therefore, a 0–1 matrix with the same size of the original image can be obtained. Considering the influence of noise on binarization processing, the erosion and expansion [40] are used to filter the preliminary binarization result. The filtered binarization result is divided into 14 × 14 equal-size image patches. After the binarization, the output image should be judged whether it is an image with a unique value. Every patch is labeled as an overexposed patch and properly exposed patch according to the number of pixels with the value of 1. If the number of 1 s in some patch exceeds the threshold, the patch is labeled as overexposed patch. If the output image is an image with a unique value, there is no overexposed region existing in the image. Finally, the serial numbers of these overexposed mask patches are recorded in the Id Store matrix for subsequent image inpainting networks. Moreover, the binarized image should be sent into image inpainting module. Figure 2 shows an example of the marked overexposed region.

3.2. Image Inpainting Module

The image inpainting module is used to restore the overexposed region in the original image to improve the quality of lane segmentation. In the proposed method, MAE, which is a scalable self-supervised learning scheme applied to computer vision, is adopted as the network of image inpainting module. The architecture of MAE is shown in Figure 3.
As Figure 3 shows, the architecture of MAE is an asymmetric encoder–decoder structure [30]. To preserve position information, the encoder position embeddings and decoder position embeddings are initialized by the 2D sine–cosine method. The size of encoder position embeddings is m × e and the size of decoder position embeddings is m × d. The input image is divided into n × n patches in horizontally and vertically, m = n × n; e and d are the numbers of nodes of a single patch vector of encoder and decoder position embeddings. The input of the MAE encoder includes the original image, the encoder position embeddings, and the Id Store matrix. The image is reshaped and linearly transformed into an m × e sequence of patch vectors by the encoder. Then the sequence of patch vectors is added to the encoder position embeddings. The information of image and position are merged. The sequences set of unmasked patches in properly exposed regions can be obtained from the Id Store matrix. The properly exposed patch vectors in the merged embeddings are selected and input into the Transformer encoder blocks [41]. The encoded latent vectors are finally output by the MAE encoder. The size of encoded latent vectors is n × e, where n represents the number of unmasked patches.
The input of the MAE decoder includes encoded latent vectors, decoder position embeddings, and Id Store matrix. The encoded latent vectors are linearly transformed into n × d by the MAE decoder. Next, an (m − n) × d vector set of mask tokens is initialized by the MAE decoder, and each mask token is a learnable vector. Mask tokens and encoded latent vectors are concatenated by the decoder. The size of the concatenated sequence of vectors is m × d. The unmasked patches vectors are restored to their corresponding positions, and the complete set of tokens is output. The complete set of tokens and decoder position embeddings are added and input into Transformer decoder blocks. The masked patch vectors in the tokens set are reconstructed by Transformer decoder blocks. The m × d vector sequence is output by Transformer decoder blocks, containing n × n patch vectors. Then the vector sequence is linearly transformed and reshaped to obtain the reconstructed image.
In the basic MAE model, the number of layers in the Transformer encoder block is 12 and the number of layers in the Transformer decoder block is 8. Deeper network layers can make the model have better generalization ability and can adapt to a variety of application scenarios. However, the model parameters and inference time increase. The application scenario in the manuscript is relatively single, which is only used for the repair work of AGV lanes. The application scenarios do not require high generalization ability of the model. So too, deep network layers are not needed. Since the application scenario of the model is a real-time lane detection and navigation system, the real-time requirement of the model is high. Under the premise of meeting the segmentation requirements, the complexity of the network should be reduced as much as possible to speed up the model inference time. A comparative experiment was set up to verify the impact of different number of Transformer blocks on the inpainting effect.
The reduced model was compared with Transformer blocks 12-8. Transformer blocks were set to 6-4 and 3-2, respectively. The comparison results are shown in Figure 4. Experimental results show that the reduction in Transformer blocks from 12-8 to 6-4 has little impact on the inpainting effect. However, the reduction in Transformer blocks from 6-4 to 3-2 has a large impact on the repair results. As can be seen from Figure 4, the edges of the picture with Transformer blocks of 3-2 are too blurred and not clear enough, which affects the effect of image segmentation. The inpainting effect of Transformer blocks 6-4 is not significantly different from that of Transformer blocks 12-8. Transformer blocks 6-4 can simultaneously meet the requirements of inference speed and image segmentation. So, 6-4 Transformer blocks are selected for the proposed method. The average inference time of three Transformer blocks with a different number of layers was also calculated. The average inference time of Transformer blocks 12-8 is 17.80 ms; the average inference time for Transformer blocks 6-4 is 9.78 ms; the average inference time for Transformer blocks 3-2 is 5.48 ms. It can be concluded that 6-4 is the best choice for this study in order to balance inference time and repair quality.

3.3. CSTA Network Structure

The structure of the proposed CSTA is shown in Figure 5. The encoder consists of 4 convolution modules. The decoder consists of 4 deconvolution modules and 3 attention modules. The main function of the encoder is to down-sample the image to extract its features. The input is the lane image restored by MAE and the size is 3 × 224 × 224. The first two encoder modules have the same structure, consisting of one convolutional layer with a kernel size of 3 × 3, one nonlinear layer, and one max-pooling layer. The following two encoder modules consist of two convolutional layers, two nonlinear layers, and one max-pooling layer. The size of the convolution kernel is also 3 × 3. The convolutional layer is used to extract features. The function of the max-pooling layer is to retain the main features while reducing the size of the data. The network doubles the number of feature channels with each down-sampled module. The encoder finally outputs a 512 × 14 × 14 high-level feature map.
The decoder performs the up-sampling process, which compresses the number of feature map channels through the deconvolution layer and enlarges the size. The size of the kernel of the deconvolution layer is 3 × 3. After the feature image passes through the nonlinear layer and batch normalization (BN) layer, the corresponding feature layer in the down-sampling process is synchronously input into the attention module through skip connection.
There are two reasons for using skip connections here. First, as the network deepens, the image may lose some details, which are difficult to be recovered if only deconvolution is used in the up-sampling process. The feature maps transmitted through skip connections contain a lot of detailed information, which helps to improve the image quality during the up-sampling deconvolution process. Secondly, Skip connections can speed up model convergence and make network training easier when using gradient backpropagation. The feature maps are up-sampled by 4 deconvolution modules and 3 attention modules. After up-sampling, the size of the feature maps is changed to 32 × 224 × 224. Finally, the feature maps go through a 1 × 1 convolutional layer to output a 1 × 224 × 224 single-channel lane segmentation image.
The segmentation of narrow lanes in the far field of view is incomplete and the effect of general image segmentation is not ideal. Due to the better effect of the attention mechanism in the field of image processing and image enhancement, the triple attention module is designed to improve the segmentation ability of the proposed CSAT network. With the help of the attention module, the blurred edges in the image can be well-segmented and the noise can be effectively reduced. At the same time, more key features can be extracted for and the robustness of the network model can be enhanced. The proposed triple attention modules are Attention Gate (AG), Channel Attention (CA), and Spatial Attention (SA), respectively.
The schematic diagram of the triple attention module is shown in Figure 6. The AG module in the triple attention module first process the data. The AG module is used to analyze context and drive the network to pay more attention to local regions by scaling the attention coefficients. The down-sampled feature map is fed into the Attention Gate of the up-sampling process through skip connections, while the corresponding up-sampled feature map is used as another input of the Attention Gate. After the two feature maps undergo 1 × 1 convolution and one layer of BN, the size of image is changed from C × W × H to C/2 × W × H. Both results conduct the element-wise adding. The down-sampled and up-sampled feature maps are first fused to retain part of the features obtained by convolution. Then, the feature maps go through Relu, 1 × 1 convolution, and BN layers to output a feature vector of size 1 × W × H. The semantically enriched high-level image features obtained by the convolution is stored in the feature vector. The original down-sampled feature map and feature vector conduct the element-wise product. AG finally outputs a high-level feature map with attention weights.
There are different types of semantic features between the interior of the feature map. Moreover, the features have different weights on the effect of image segmentation. The feature map output by AG goes through a 3 × 3 convolutional layer, batch normalization layer, Relu, and is divided into two branches. One branch is fed to CA and the other branch is fed to SA. The CA and SA are combined with adaptive modulation feature representation to obtain more relevant semantic features. Element-wise product is conducted on the outputs of the CA and SA modules. The channel and spatial features of the feature map are fused to output the weights of spatial attention and channel attention. The element-wise product is conducted by the output feature map by AG and the output weights by CA and SA. The feature map with high correlation is obtained. The output high-level feature maps by AG and the output high-relevance feature maps by the two attention modules are fused. Finally, the sigmoid activation function is passed by the attention module, and the output result of the attention module of size C × W × H is obtained.
The structure of the CA module is shown in Figure 7a. The role of the CA module is to globally extract important features. The weights of each channel of the input image are calculated through the network, focusing on the channels containing key information. The input of the CA module is a feature map with the size of C × W × H. In order to assign different attentions to different types of feature maps, each feature channel of the feature map along with the spatial dimension H × W is adopted separately. For global max pooling and adaptive global average pooling operations, the specified output size is 1 × 1 and the number of channels remains the same. The feature vectors with the size of C × 1 × 1 are obtained. In the first layer of convolution, a ratio γ is adopted to change the number of channels (γC × 1 × 1). γ is a hyperparameter. Its value is set to 16. The number of convolution kernels of the second convolution is the original number of channels, and the size of the feature map is converted to the previous number of channels. Finally, through the sigmoid activation function, a vector of C × 1 × 1 is obtained.
The structure of the SA module is shown in Figure 7b. The information contained in the feature map varies depending on the spatial location. In order to better distinguish the foreground and background regions in the image, it is necessary for the network to distinguish different local regions and better suppress noise and redundant features. On this basis, the SA module is used to enhance the representation ability of the network, making full use of the global information and focusing on the regions of interest in the feature map. The input to the SA module is a feature map of size C × W × H. The mean and maximum value of the feature map are calculated based on dim = 1, and two 1 × W × H feature maps are obtained. The information is merged through the concatenation. After merging, a 7 × 7 convolution is used to compress and reconstruct the channels to complete the feature interaction. Finally, through the sigmoid activation function, the feature map of 1 × W × H spatial attention is obtained. In the spatial attention module, local features are combined with global features to help improve the network generation ability.

4. Experiments and Results

4.1. Dataset Construction

The dataset used for network training is the indoor lane dataset captured by the CMOS camera in varied illumination conditions. The camera is Sony IMX219 (pixel: 800, CMOS size: 1/4-inch, aperture: 2.0, focal length: 2.2 mm, size: 32 mm × 32 mm). The lane dataset contains a total of 6000 images. The colors of the lane are red, yellow, and blue. The background color is white. The ratio of lanes in colors is 1:1:1. The constructed lane dataset contains a variety of different illumination scenarios. The illumination scenarios are with the uniform natural light, uniform indoor illumination, strong sunlight, and strong flashlight. The resolution of all the images in the dataset is 224 × 224 and the lane images captured by the camera are manually labeled. The training dataset includes 15% overexposed images and 85% properly exposed images
The testing datasets are also collected in a variety of illuminating environments. There are two types of testing datasets in the experiment, which are properly exposed images and overexposed images. In addition, properly exposed images for the same camera and viewing field as the overexposed images are also collected. In the following experiments, two testing datasets are employed to verify the segmentation of the network. One contains only properly exposed images, and the other includes 15% overexposed images and 85% properly exposed images.
As shown in Figure 8, the images in the first column are properly exposed images, such lane images, which are clear and complete. Properly exposed images are used as a dataset in a properly exposed environment. The images in the second column are the lane images collected in the overexposed environment. The lane images of this kind are seriously defective, and the image cannot be completely extracted by the existing segmentation methods. All overexposed lane images have properly exposed images acquired with the same camera view. Labels of properly exposed lane images can be obtained by labeling all properly exposed images. These labels also apply to overexposed images from the same camera view. Labels are used to verify the lane segmentation results in the overexposed and properly exposed environments.

4.2. Loss Function

In the training process, the binary cross-entropy loss (BCE Loss) is used as the loss function of the network. The training Epoch is 800. The initial learning rate (LR) is 0.01. The weight decay is 10-4. The optimizer uses the SGD optimizer with momentum. The momentum value is 0.7. The loss function is used to estimate the difference between the training segmentation label and the actual segmentation result. When the value of the loss function decreases, the difference between the labels and actual segmentation results becomes smaller. The loss can be expressed as:
l o s s = 1 N n = 1 N l n
Here, represents the loss of a single sample, which is expressed as:
l n = w [ y n log x n + ( 1 y n ) log ( 1 x n ) ]
where xn represents the actual segmentation result of the nth sample, and yn represents the training segmentation label. w is set to 1 for single-label binary classification. The loss curve is used to explain the optimization process during the training process. The loss curve in the training process of CSTA is shown in Figure 9. As Figure 9 shows, with the increase in the epoch, the value of the loss function decreases. Moreover, when the epoch is more than 300, the loss function curve tends to be stable. The whole training process is relatively stable, which meets the requirements of training.
The network model proposed in this paper is implemented using the PyTorch1.8.1 framework, and the mobile version of NVIDIA GeForce RTX2070 is used for accelerated operations.

4.3. Experiment Result

The visual segmentation effects are shown in Figure 10 and Figure 11. The figures show almost all methods perform well in noise suppression. Compared with other segmentation methods, the proposed method has great advantages in terms of lane edges and details. The alleys in the field of view can become slender when the driveway tends to curve. The proposed method can completely segment the lane without distortion, which is superior to other methods in terms of accuracy and precision. This elongated part of the lane is the key to the navigation prediction when the vehicle makes a turn. Accurate prediction of the slender lane ahead endows the system with more reaction time.
As shown in Figure 11, the proposed network has clear advantages for overexposed images. The lanes in overexposed regions restored by other methods appear incomplete, disconnected, and severely distorted. The proposed method can accurately segment the lanes after MAE reconstruction, and maintain coherence when the distant lanes are thin and narrow.
Performance Evaluation Metrics: The performance of the CSTA network is evaluated by three common quantitative metrics for image segmentation:
(1)
Pixel Accuracy (PA) is used to evaluate the ratio of correctly predicted pixels to the total number of pixels, which can be expressed as:
P A = N p r e d N g t = T P + T N T P + T N + F P + F N
where Npred is the number of correctly predicted pixels, Ngt is the total number of pixels, TP is the number of positive samples to be predicted as positive, TN is the number of negative samples to be predicted as negative, FP is the number of negative samples to be predicted as positive, and FN is the number of positive samples to be predicted as negative;
(2)
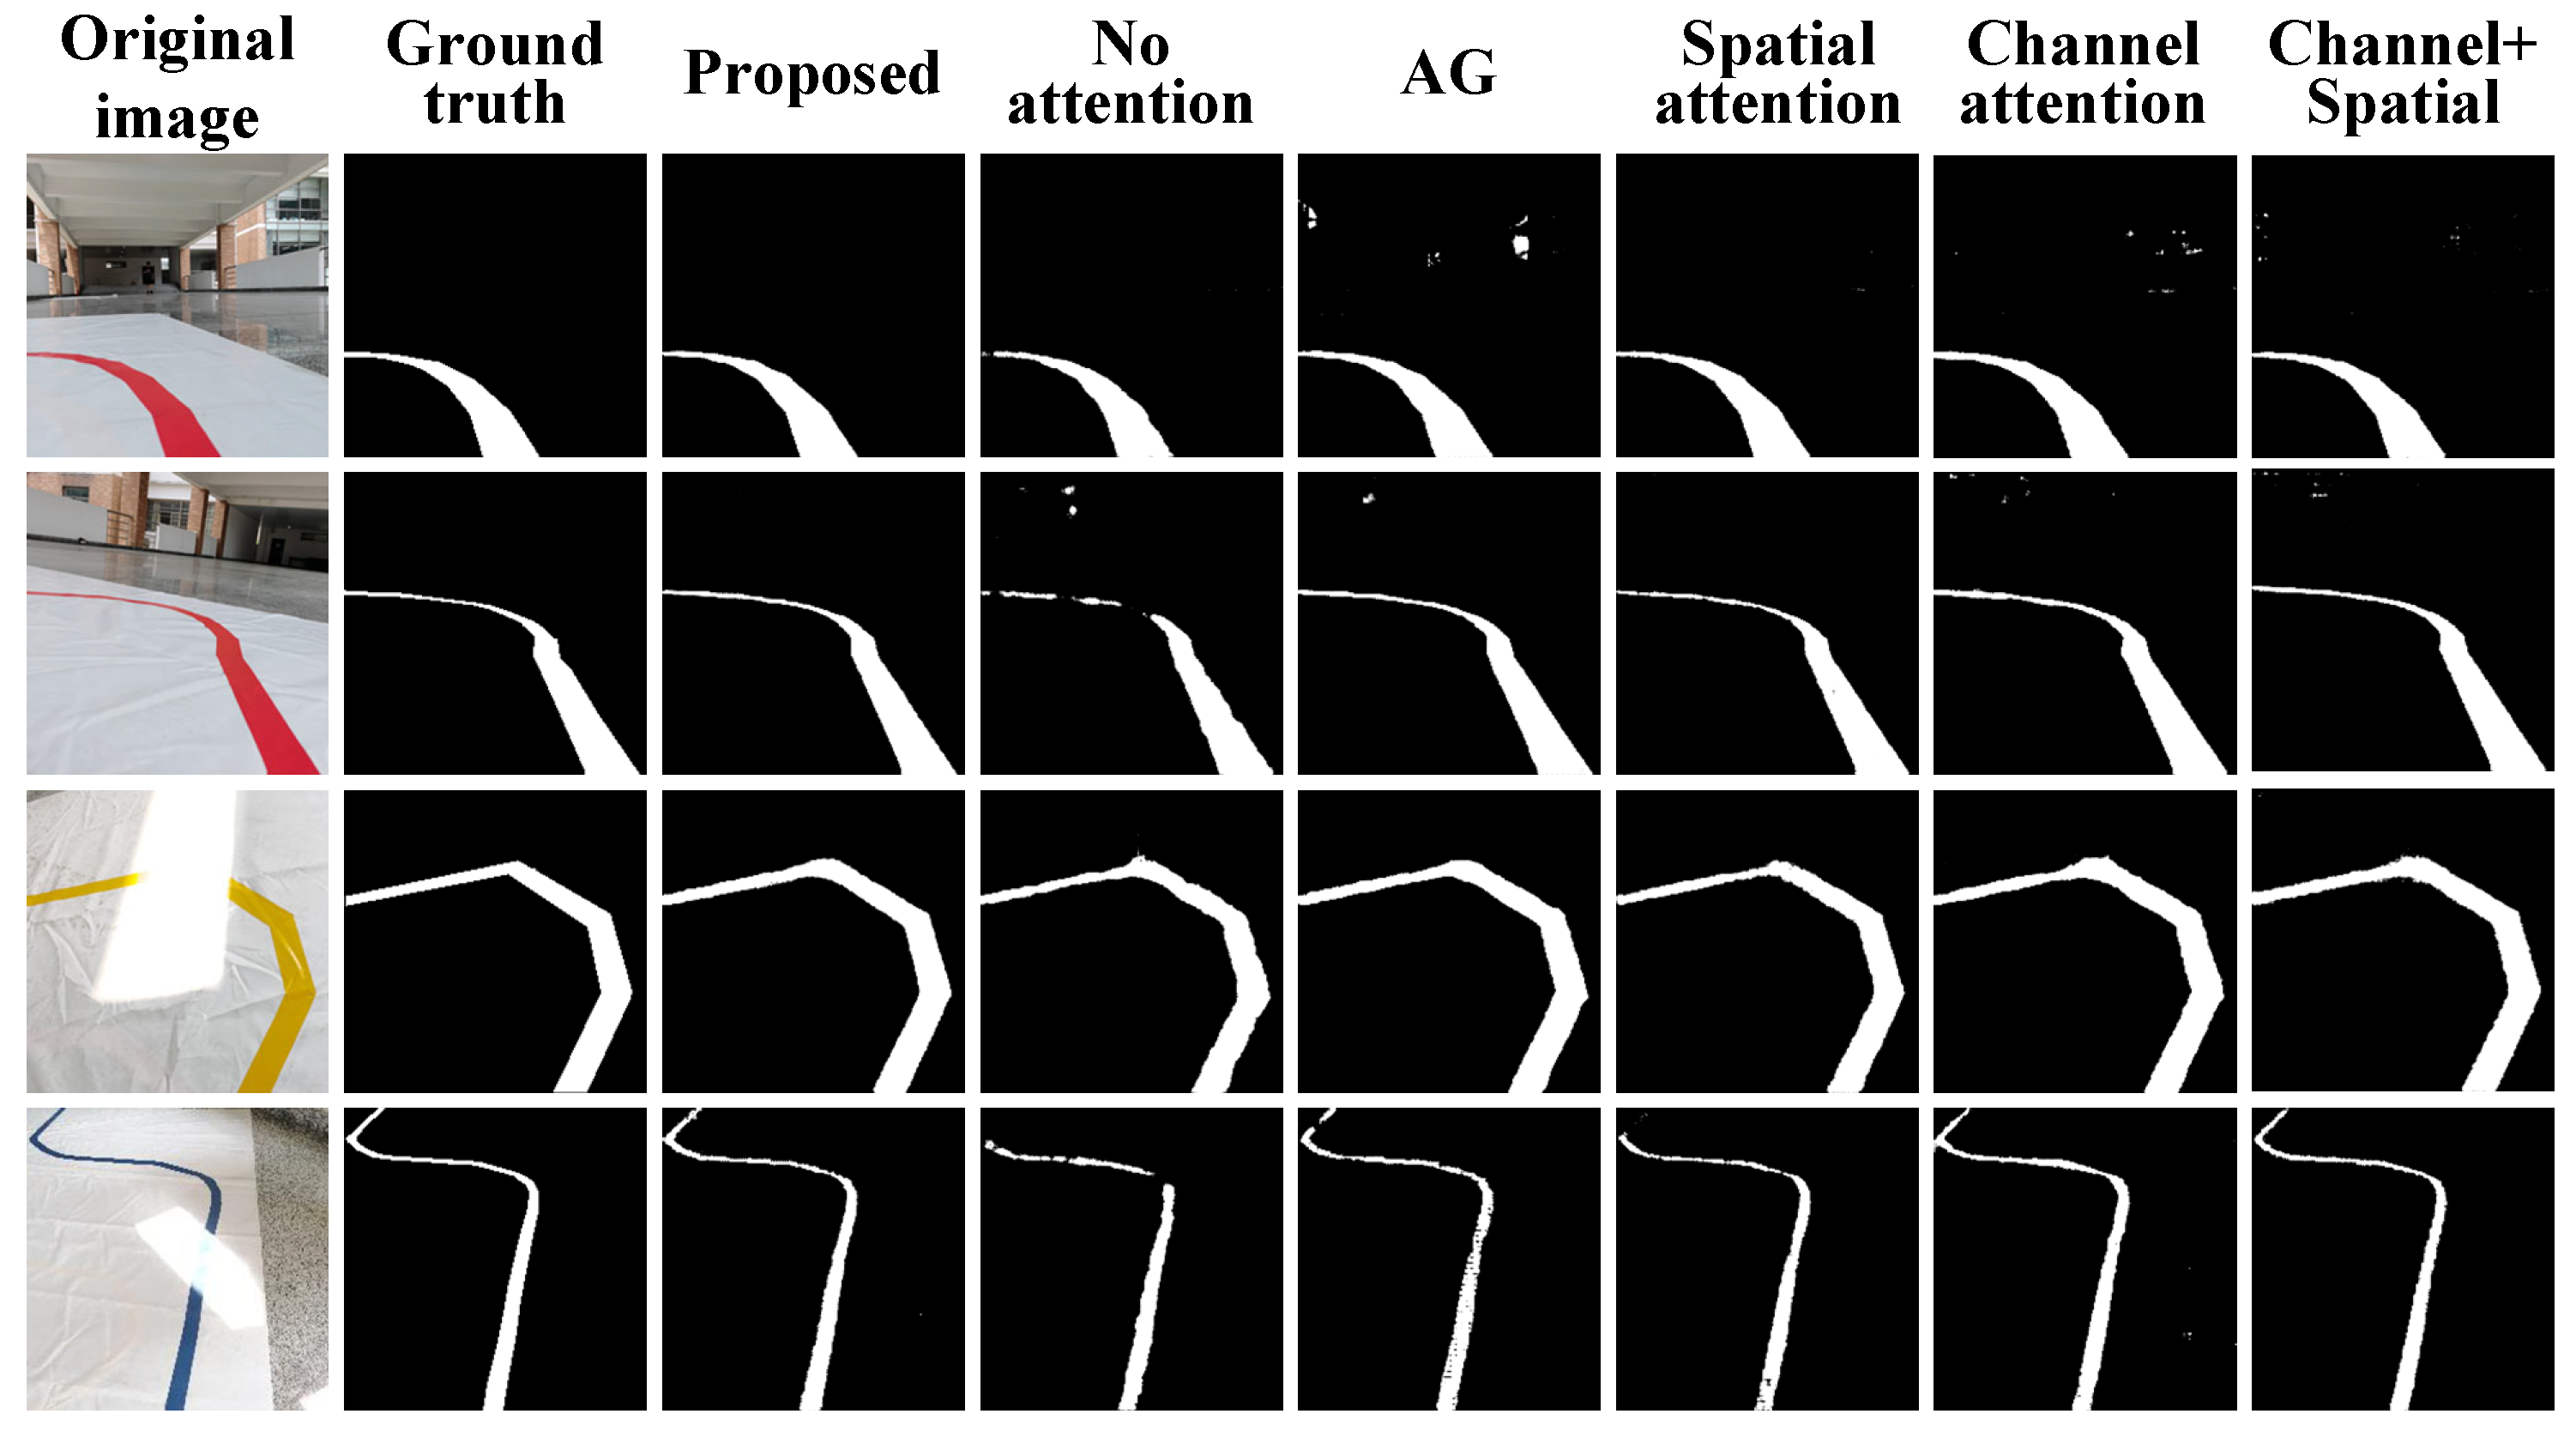
Since the boundaries of overexposed images are blurred after inpainting, F1-score is used to evaluate the quality of segmentation boundaries. F1-score refers to the average evaluation of Precision and Recall. The formula can be expressed as:
F 1 = 2 × P r e c i s i o n × R e c a l l P r e c i s i o n + R e c a l l
P r e c i s i o n = T P F P + T P
R e c a l l = T P F N + T P
(3)
Intersection over Union (IoU) is used to evaluate whether the lane region can be accurately segmented by the network. That is, the intersection ratio of the predicted samples and the actual samples, which can be expressed as:
I o U = T P T P + F P + F N
In addition, the inference speed indicator fwt is added to calculate the time it takes to output the final result from an image. The processing of properly exposed and overexposed images is different. There is no preprocessing for image inpainting for properly exposed images. Therefore, in the calculation of the fwt of overexposed images, only overexposed images are selected for testing, and the mean of their fwts is calculated. In practical applications, there are relatively few cases of overexposure. The average inference speed of the system is much faster and the average time cost is much smaller than this value.
The performance of the proposed method is quantitatively compared with ERF-Net [17], CCNet [20], PP-LiteSeg [18], and FLANet [19] on IoU, F1-score, PA, and fwt. Table 1 shows the comparison results for the testing dataset with properly exposed images. Table 2 shows the comparison results for the testing dataset with 15% of overexposed images.
Table 1 shows the quantitative comparison results between the proposed CSTA segmentation network and other segmentation networks on the proper exposure dataset. It can be seen from Table 1 that the proposed network achieves satisfactory results compared with other networks. Specifically, the proposed method has a significant improvement in the evaluation indicators IoU, F1-score, and PA compared with ERFNet and CCNet. Moreover, it is slightly improved compared with FLANet. Since PA represents the proportion of the number of correctly predicted pixels in the total number of pixels, the proportion of black background is high, so a small numerical fluctuation can reflect a large gap. The performance of PP-LiteSeg on IoU, F1-score, and PA is basically consistent with the proposed CSTA, and its F1-score and PA are slightly higher than CSTA. However, the proposed CSTA network is much faster than other networks in fwt. It is sufficient to show that the comprehensive performance improvement of the proposed network is significant compared with other networks. Although the proposed network is slightly inferior to PP-LiteSeg in some metrics, the huge improvement in inference speed makes CSTA more suitable for real-time application scenarios. Table 2 shows the results of quantitative comparison of segmentation performance between the proposed method and other methods in overexposure environment. In the overexposure environment, the proposed method combining image inpainting and image segmentation is compared with other segmentation methods. Quantitative comparisons are performed on IoU, F1-score, PA, and fwt. The quantitative comparison results of the proposed method have a huge improvement over ERFNet, CCNet, PP-LiteSeg, and FLANet. The results show that the performance of the proposed method in the overexposed environment is much better than the existing image segmentation methods. In addition, the fwt value of the proposed method is also the lowest, which indicates that the optimization of MAE network module is successful. It not only meets the requirements of improving segmentation quality, but also meets the requirements of improving processing speed. However, the inference time of the system is longer in the condition of overexposure. The reason is that the inpainting preprocessing of overexposed images adds extra time overhead. However, as far as the current level of GPU chip development [42,43,44,45] is concerned, it can fully meet the real-time requirements of embedded devices.

4.4. Ablation Experiment

Ablation experiments are set up to study the impact of individual sub-modules of the triple attention module on network performance. In ablation experiments, three attention modules are pruned and combined to verify the performance of each sub-module. An encoder–decoder backbone network with skip connections and without attention is employed as a baseline model. The networks with only AG, only spatial attention, only channel attention, and channel + spatial attention modules are designed respectively. The results of network segmentation for six different module combinations are shown in Figure 12.
It can be seen from Figure 12 that all segmentation results with the attention module are better than the results of the backbone network without the attention module. The AG attention module is used to analyze contextual information. It increases the sensitivity of the model to foreground pixels by scaling the attention coefficients to focus the network more on local regions. The effect on the network is shown in the segmentation results, where the lane thickness is more evenly contoured and smoother, with fewer burrs and bumps than other censored combinations. However, additional noise is added due to the increased pixel sensitivity.
The spatial attention module makes full use of global information and focuses on the regions of interest in the feature map, indicating the distribution of key information on individual channel feature maps. The performance of the spatial attention module in the segmentation results is shown by a significant reduction in noise. However, the segmentation integrity of the spatial attention module is inferior to the combination of AG, channel attention, and spatial + channel attention. The role of channel attention is similar to that of spatial attention. The weights of each channel of the input image are calculated through the network, and the channels containing key information are focused on spatial attention, which guarantees the integrity and continuity improvement of the narrow lines in the segmentation.
The spatial + channel attention combination combines the characteristics of both attentions to reduce noise while the segmentations maintain integrity. It can be seen from Figure 12, the combination of the three attention modules performs better overall, although a single attention or the combination of any two attentions performs well. The proposed method finally uses a combination of all three attentions. The advantages of each module are complementary. Finally, the proposed method obtains the minimum error of the segmentation to the ground truth. The segmentation evaluation results are shown in Table 3.
From the segmentation evaluation metrics, the combination with the added attention module significantly outperforms the networks without the attention module. The network with only the spatial attention module performs better than the networks with only one of the other modules. However, the overall segmentation of the triple attention module is better than other combinations. It is shown that the proposed CSTA network has the best segmentation performance.

5. Conclusions and Future Work

In summary, in order to solve the problem of inaccurate lane segmentation of indoor AGV in an overexposure environment, a lane detection method combining image inpainting and segmentation is proposed. In the proposed method, the overexposed lane image is repaired and reconstructed by the MAE network, and then input into the image segmentation network for lane segmentation and extraction. The optimal MAE parameters suitable for the proposed method are obtained by experiments. The reduction in the MAE network model parameters reduces the inference time of the proposed method in the overexposed environment. An image segmentation network CSTA is proposed, which uses a lightweight backbone network to improve inference speed. Moreover, the triple attention module is used to improve the segmentation quality, so as to obtain clearer lane contours. It is especially obvious when the lanes are narrow. Meanwhile, the proposed method has better noise suppression. The effect and quality of the segmentation of the network are significantly improved. Finally, the efficiency of the proposed lane extraction method is verified by three image segmentation evaluation metrics (IoU, F1-score, and PA) and inference time in the case of overexposure and proper exposure. Experimental results show that the proposed lane extraction method based on image inpainting and image segmentation has excellent segmentation performance and fast inference speed in an overexposure environment.
However, the proposed method has limitations. The experimental scenes of the proposed method are all set indoors, the lane lines used for collecting datasets are also clear and clean. The experiment was not carried out on the ground with debris and dirt. Therefore, in the future it is necessary to further study the treatment scheme of outdoor AGV lane overexposure or lane line defects and stains to further improve the practical application scope of this research. In the future, we will strive to achieve this goal in a more efficient manner.

Author Contributions

X.Y.: Conceptualization, Methodology, Writing—original draft. Z.Y.: Data curation, Software, Writing—original draft. J.H.: Supervision, Project administration. L.W.: Investigation, Conceptualization. B.Z.: Investigation, Conceptualization. Y.Z.: Resources, Investigation. J.Z.: Resources, Investigation. All authors have read and agreed to the published version of the manuscript.

Funding

This research received no external funding.

Institutional Review Board Statement

Not applicable.

Informed Consent Statement

Not applicable.

Data Availability Statement

Data sharing not applicable.

Acknowledgments

We are very grateful to the support from Zhongyang Yu.

Conflicts of Interest

The authors declare no conflict of interest.

References

  1. Javed, M.A.; Muram, F.U.; Punnekkat, S.; Hansson, H. Safe and secure platooning of Automated Guided Vehicles in Industry 4.0. J. Syst. Archit. 2021, 121, 102309. [Google Scholar] [CrossRef]
  2. Liu, J.; Liu, Z.; Zhang, H.; Yuan, H.; Manokaran, K.B.; Maheshwari, M. Multi-sensor information fusion for IoT in automated guided vehicle in smart city. Soft Comput. 2021, 25, 12017–12029. [Google Scholar] [CrossRef]
  3. Reis WP, N.; Couto, G.E.; Junior, O.M. Automated guided vehicles position control: A systematic literature review. J. Intell. Manuf. 2022, 1–63. [Google Scholar] [CrossRef]
  4. Zhou, S.; Cheng, G.; Meng, Q.; Lin, H.; Du, Z.; Wang, F. Development of multi-sensor information fusion and AGV navigation system. In Proceedings of the 2020 IEEE 4th Information Technology, Networking, Electronic and Automation Control Conference (ITNEC), Chongqing, China, 12–14 June 2020; pp. 2043–2046. [Google Scholar]
  5. Liu, S.; Xiong, M.; Zhong, W.; Xiong, H. Towards Industrial Scenario Lane Detection: Vision-Based AGV Navigation Methods. In Proceedings of the IEEE International Conference on Mechatronics and Automation (ICMA), Beijing, China, 13–16 October 2020; pp. 1101–1106. [Google Scholar]
  6. Ullah, I.; Liu, K.; Yamamoto, T.; Zahid, M.; Jamal, A. Prediction of electric vehicle charging duration time using ensemble machine learning algorithm and Shapley additive explanations. Int. J. Energy Res. 2022, 46, 15211–15230. [Google Scholar] [CrossRef]
  7. Ullah, I.; Liu, K.; Yamamoto, T.; Al Mamlook, R.E.; Jamal, A. A comparative performance of machine learning algorithm to predict electric vehicles energy consumption: A path towards sustainability. Energy Environ. 2021, 0958305X211044998. [Google Scholar] [CrossRef]
  8. Ullah, I.; Liu, K.; Yamamoto, T.; Shafiullah, M.; Jamal, A. Grey wolf optimizer-based machine learning algorithm to predict electric vehicle charging duration time. Transp. Lett. 2022, 1–18. [Google Scholar] [CrossRef]
  9. Sarker, I.H. Deep learning: A comprehensive overview on techniques, taxonomy, applications and research directions. SN Comput. Sci. 2021, 2, 420. [Google Scholar] [CrossRef] [PubMed]
  10. Tang, J.; Li, S.; Liu, P. A review of lane detection methods based on deep learning. Pattern Recognit. 2021, 111, 107623. [Google Scholar] [CrossRef]
  11. Ghosh, S.; Das, N.; Das, I.; Maulik, U. Understanding deep learning techniques for image segmentation. ACM Comput. Surv. (CSUR) 2019, 52, 1–35. [Google Scholar] [CrossRef] [Green Version]
  12. Mu, C.; Ma, X. Lane detection based on object segmentation and piecewise fitting. TELKOMNIKA Indones. J. Electr. Eng. 2014, 12, 3491–3500. [Google Scholar] [CrossRef]
  13. Haque, M.R.; Islam, M.M.; Alam, K.S.; Iqbal, H. A computer vision based lane detection approach. Int. J. Image Graph. Signal Process. 2019, 10, 27. [Google Scholar] [CrossRef] [Green Version]
  14. Mukhopadhyay, P.; Chaudhuri, B.B. A survey of Hough Transform. Pattern Recognit. 2015, 48, 993–1010. [Google Scholar] [CrossRef]
  15. Huang, Q.; Liu, J. Practical limitations of lane detection algorithm based on Hough transform in challenging scenarios. Int. J. Adv. Robot. Syst. 2021, 18, 17298814211008752. [Google Scholar] [CrossRef]
  16. Zhang, H.; Liang, J.; Jiang, H.; Cai, Y.; Xu, X. Lane line recognition based on improved 2D-gamma function and variable threshold Canny algorithm under complex environment. Meas. Control 2020, 53, 1694–1708. [Google Scholar] [CrossRef]
  17. Romera, E.; Alvarez, J.M.; Bergasa, L.M.; Arroyo, R. Erfnet: Efficient residual factorized convnet for real-time semantic segmentation. IEEE Trans. Intell. Transp. Syst. 2017, 19, 263–272. [Google Scholar] [CrossRef]
  18. Peng, J.; Liu, Y.; Tang, S.; Hao, Y.; Chu, L.; Chen, G.; Wu, Z.; Chen, Z.; Yu, Z.; Du, Y.; et al. PP-LiteSeg: A Superior Real-Time Semantic Segmentation Model. arXiv 2022, arXiv:2204.02681. [Google Scholar]
  19. Song, Q.; Li, J.; Li, C.; Guo, H.; Huang, R. Fully attentional network for semantic segmentation. In Proceedings of the AAAI Conference on Artificial Intelligence, Vancouver, BC, Canada, 28 February–1 March 2022; Volume 36, pp. 2280–2288. [Google Scholar]
  20. Huang, Z.; Wang, X.; Huang, L.; Huang, C.; Wei, Y.; Liu, W. Ccnet: Criss-cross attention for semantic segmentation. In Proceedings of the IEEE/CVF International Conference on Computer Vision, Seoul, Korea, 27 October–2 November 2019; pp. 603–612. [Google Scholar]
  21. Zhang, H.; Xu, L.; Liang, J.; Sun, X. Research on Guide Line Identification and Lateral Motion Control of AGV in Complex Environments. Machines 2022, 10, 121. [Google Scholar] [CrossRef]
  22. Zheng, J.; Zhang, Z. Research on AGV visual perception dynamic exposure algorithm based on gray entropy threshold difference value. In Proceedings of the 2022 4th International Conference on Advances in Computer Technology, Information Science and Communications (CTISC), Suzhou, China, 22–24 April 2022; pp. 1–6. [Google Scholar]
  23. Pathak, D.; Krahenbuhl, P.; Donahue, J.; Darrell, T.; Efros, A.A. Context encoders: Feature learning by inpainting. In Proceedings of the IEEE Conference on Computer Vision and Pattern Recognition, Las Vegas, NV, USA, 27–30 June 2016; pp. 2536–2544. [Google Scholar]
  24. Yang, C.; Lu, X.; Lin, Z.; Shechtman, E.; Wang, O.; Li, H. High-resolution image inpainting using multi-scale neural patch synthesis. In Proceedings of the IEEE Conference on Computer Vision and Pattern Recognition, Honolulu, HI, USA, 21–26 July 2017; pp. 6721–6729. [Google Scholar]
  25. Iizuka, S.; Simo-Serra, E.; Ishikawa, H. Globally and locally consistent image completion. ACM Trans. Graph. (ToG) 2017, 36, 1–14. [Google Scholar] [CrossRef]
  26. Yan, Z.; Li, X.; Li, M.; Zuo, W.; Shan, S. Shift-net: Image inpainting via deep feature rearrangement. In Proceedings of the European Conference on Computer Vision (ECCV), Munich, Germany, 8–14 September 2018; pp. 1–17. [Google Scholar]
  27. Ronneberger, O.; Fischer, P.; Brox, T. U-net: Convolutional networks for biomedical image segmentation. In Proceedings of the International Conference on Medical Image Computing and Computer-Assisted Intervention, Munich, Germany, 5–9 October 2015; pp. 234–241. [Google Scholar]
  28. Shen, L.; Hong, R.; Zhang, H.; Zhang, H.; Wang, M. Single-shot semantic image inpainting with densely connected generative networks. In Proceedings of the 27th ACM International Conference on Multimedia, Nice, France, 21–25 October 2019; pp. 1861–1869. [Google Scholar]
  29. Nazeri, K.; Ng, E.; Joseph, T.; Qureshi, F.; Ebrahimi, M. Edgeconnect: Structure guided image inpainting using edge prediction. In Proceedings of the IEEE/CVF International Conference on Computer Vision Workshops, Seoul, Korea, 27–28 October 2019. [Google Scholar]
  30. He, K.; Chen, X.; Xie, S.; Li, Y.; Dollár, P.; Girshick, R. Masked autoencoders are scalable vision learners. In Proceedings of the IEEE/CVF Conference on Computer Vision and Pattern Recognition, New Orleans, LA, USA, 19–20 June 2022; pp. 16000–16009. [Google Scholar]
  31. Yu, J.; Lin, Z.; Yang, J.; Shen, X.; Lu, X.; Huang, T.S. Generative image inpainting with contextual attention. In Proceedings of the IEEE Conference on Computer Vision and Pattern Recognition, Salt Lake City, UT, USA, 18–23 June 2018; pp. 5505–5514. [Google Scholar]
  32. Wang, N.; Li, J.; Zhang, L.; Du, B. MUSICAL: Multi-Scale Image Contextual Attention Learning for Inpainting. In Proceedings of the IJCAI, Macao, China, 10–16 August 2019; pp. 3748–3754. [Google Scholar]
  33. Shi, Y.; Fan, Y.; Zhang, N. A generative image inpainting network based on the attention transfer network across layer mechanism. Optik 2021, 242, 167101. [Google Scholar]
  34. Wang, D.; Xie, C.; Liu, S.; Niu, Z.; Zuo, W. Image inpainting with edge-guided learnable bidirectional attention maps. arXiv 2021, arXiv:2104.12087. [Google Scholar]
  35. Yoo, S.; Lee, H.S.; Myeong, H.; Yun, S.; Park, H.; Cho, J.; Kim, D.H. End-to-end lane marker detection via row-wise classification. In Proceedings of the IEEE/CVF Conference on Computer Vision and Pattern Recognition Workshops, Seattle, WA, USA, 14–19 June 2020; pp. 1006–1007. [Google Scholar]
  36. Qin, Z.; Wang, H.; Li, X. Ultra fast structure-aware deep lane detection. In Proceedings of the European Conference on Computer Vision, Virtual, 23–28 August 2020; pp. 276–291. [Google Scholar]
  37. Pan, X.; Shi, J.; Luo, P.; Wang, X.; Tang, X. Spatial as deep: Spatial cnn for traffic scene understanding. In Proceedings of the AAAI Conference on Artificial Intelligence, New Orleans, LA, USA, 2–7 February 2018; p. 32. [Google Scholar]
  38. Hou, Y.; Ma, Z.; Liu, C.; Loy, C.C. Learning lightweight lane detection cnns by self attention distillation. In Proceedings of the IEEE/CVF International Conference on Computer Vision, Seoul, Korea, 27 October–2 November 2019; pp. 1013–1021. [Google Scholar]
  39. Xu, H.; Wang, S.; Cai, X.; Zhang, W.; Liang, X.; Li, Z. Curvelane-nas: Unifying lane-sensitive architecture search and adaptive point blending. In Proceedings of the European Conference on Computer Vision, Virtual, 23–28 August 2020; pp. 689–704. [Google Scholar]
  40. Andreatos, A.; Leros, A. Contour Extraction Based on Adaptive Thresholding in Sonar Images. Information 2021, 12, 354. [Google Scholar] [CrossRef]
  41. Dosovitskiy, A.; Beyer, L.; Kolesnikov, A.; Weissenborn, D.; Zhai, X.; Unterthiner, T.; Dehghani, M.; Minderer, M.; Heigold, G.; Gelly, S.; et al. An image is worth 16x16 words: Transformers for image recognition at scale. arXiv 2020, arXiv:2010.11929. [Google Scholar]
  42. Ajani, T.S.; Imoize, A.L.; Atayero, A.A. An overview of machine learning within embedded and mobile devices–optimizations and applications. Sensors 2021, 21, 4412. [Google Scholar] [CrossRef]
  43. Trovao, J.P. Digital transformation, systemic design, and automotive electronics [automotive electronics]. IEEE Veh. Technol. Mag. 2020, 15, 149–159. [Google Scholar] [CrossRef]
  44. Khochare, A.; Kesanapalli, S.A.; Bhope, R.; Simmhan, Y. Don’t Miss the Train: A Case for Systems Research into Training on the Edge. In Proceedings of the 2022 IEEE International Parallel and Distributed Processing Symposium Workshops (IPDPSW), Lyon, France, 30 May–3 June 2022; pp. 985–986. [Google Scholar]
  45. Sipola, T.; Alatalo, J.; Kokkonen, T.; Rantonen, M. Artificial Intelligence in the IoT Era: A Review of Edge AI Hardware and Software. In Proceedings of the 2022 31st Conference of Open Innovations Association (FRUCT), Helsinki, Finland, 27–29 April 2022; pp. 320–331. [Google Scholar]
Figure 1. Data preprocessing procedure.
Applsci 12 10675 g001
Figure 2. The result of marked overexposed region.
Applsci 12 10675 g002
Figure 3. MAE architecture.
Applsci 12 10675 g003
Figure 4. Impact of different Transformer blocks on image inpainting results.
Applsci 12 10675 g004
Figure 5. CSTA network structure diagram.
Applsci 12 10675 g005
Figure 6. Schematic diagram of triple attention module structure.
Applsci 12 10675 g006
Figure 7. The structure schematic diagram of channel attention and spatial attention module. (a) The details of channel attention module; (b) the details of spatial attention module.
Applsci 12 10675 g007
Figure 8. Samples of the constructed lane dataset and the manual label.
Applsci 12 10675 g008
Figure 9. The loss curve of CSTA in the training process.
Applsci 12 10675 g009
Figure 10. Lane segmentation with proper exposure.
Applsci 12 10675 g010
Figure 11. Lane segmentation with overexposure.
Applsci 12 10675 g011
Figure 12. Visual segmentation results of different attention module combinations.
Applsci 12 10675 g012
Table 1. Comparison of segmentation evaluation results in proper exposure.
MethodIoUF1-ScorePAfwt (ms)
ERFNet0.80090.88510.979519.5816
CCNet0.79730.88140.9817108.8108
PP-LiteSeg0.90110.94740.991652.8683
FLANet0.89670.93840.990739.2761
Proposed0.90190.94610.99128.6956
Table 2. Comparison of segmentation evaluation results in overexposure.
MethodIoUF1-ScorePAfwt (ms)
ERFNet0.74630.84520.980519.5031
CCNet0.56460.71060.9674108.3623
PP-LiteSeg0.70520.81770.980353.0378
FLANet0.72680.83340.979739.4803
Proposed0.83550.90590.988918.5327
Table 3. Segmentation evaluation results for different combinations of attention modules.
Module CompositionPerformance Evaluation Metrics
AGSpatial
Attention
Channel AttentionIoUF1-ScorePA
×××0.79490.88060.9861
××0.81140.89050.9873
××0.81970.89540.9881
××0.80730.88810.9867
×0.80010.88410.9858
0.82930.90310.9885
Publisher’s Note: MDPI stays neutral with regard to jurisdictional claims in published maps and institutional affiliations.

