1. Introduction
The current research showed that “carbon peak and carbon neutralisation” (double carbon) is an effective way to deal with climate change and reduce carbon emissions [
1,
2,
3,
4]. In the general debate of the 70th session of the United Nations General Assembly, China proposed “dual carbon” construction goals and committed to reducing the adverse effects of carbon emissions. Enhancing the carbon storage potential of ecosystems is an important way to reduce carbon emissions [
5] and achieve the goal of “double carbon”. The Taihang Mountains are an essential ecological barrier in Eastern China, and their complex landforms and variable climatic conditions are of ecological importance [
6,
7]. The 14th Five-Year Plan proposed that the Yanshan-Taihang Mountains Ecological Containment Area is an important national functional area in China; its ecological significance includes water and ecological protection. However, in recent years, carbon emissions in the Taihang Mountains have increased sharply [
8], and the ecological environment is also relatively fragile [
9]. How to reduce emissions and rebuild the ecosystem scientifically is the primary task of ecological construction in Taihang Mountain. Tasks include quantitative assessment of the impact of driving factors on the spatial distribution of carbon stocks in the Taihang Mountains to explore scientific ways to improve the carbon stocks of regional ecosystems, which is of great significance for improving the Taihang Mountain ecosystem and reducing carbon emissions.
At present, the methods of studying carbon storage in ecosystems are mainly classified as field survey [
10], remote sensing inversion [
11], and model simulation [
12]. Field survey can be used to estimate carbon storage data accurately, but it has a smaller scope and can be disruptive to the research environment when collecting data [
13,
14]. Remote sensing inversion can be used for large-scale carbon storage research, mainly based on specific ecosystems and partial carbon data for research [
15,
16,
17]. Model simulation methods can effectively estimate, predict, and evaluate carbon storage at various scales by estimating regional carbon storage with the help of FORECAST, HASM, and other models. Currently, Integrated Valuation of Ecosystem Services and Trade-offs (InVEST) model is the most widely used model, which has less data, fast calculation speed, and accurate estimation results. Scholars estimate and evaluate carbon storage from different perspectives [
18,
19,
20] and scales [
21,
22] through the InVEST model. Scholars have used the InVEST model to study carbon storage assessment in different regions from different perspectives and scales [
23,
24]. Li analyzed the variation rules of carbon density and storage in the Taihang Mountains under different gradients of driving factors through the InVSET model [
25]. However, there are relatively few studies on the driving mechanism of the spatial distribution of carbon stocks in ecosystems. Studying the effect of driving factors on the spatial distribution of carbon storage in ecosystems is a new method to study its driving mechanism, which is more scientific and accurate.
In order to explore the spatio-temporal variation of carbon storage and its driving factors in the Taihang Mountains, based on the land use data of this region in 2005, 2010, 2015, and 2019, this paper analyzed the distribution of carbon storage in this region through the InVEST model, and identified the main driving factors causing the variation through Geodetector. This study can provide a basis for the policy making of ecological restoration and land use adjustment in the Taihang Mountains.
2. Materials and Methods
2.1. Overview of the Study Area
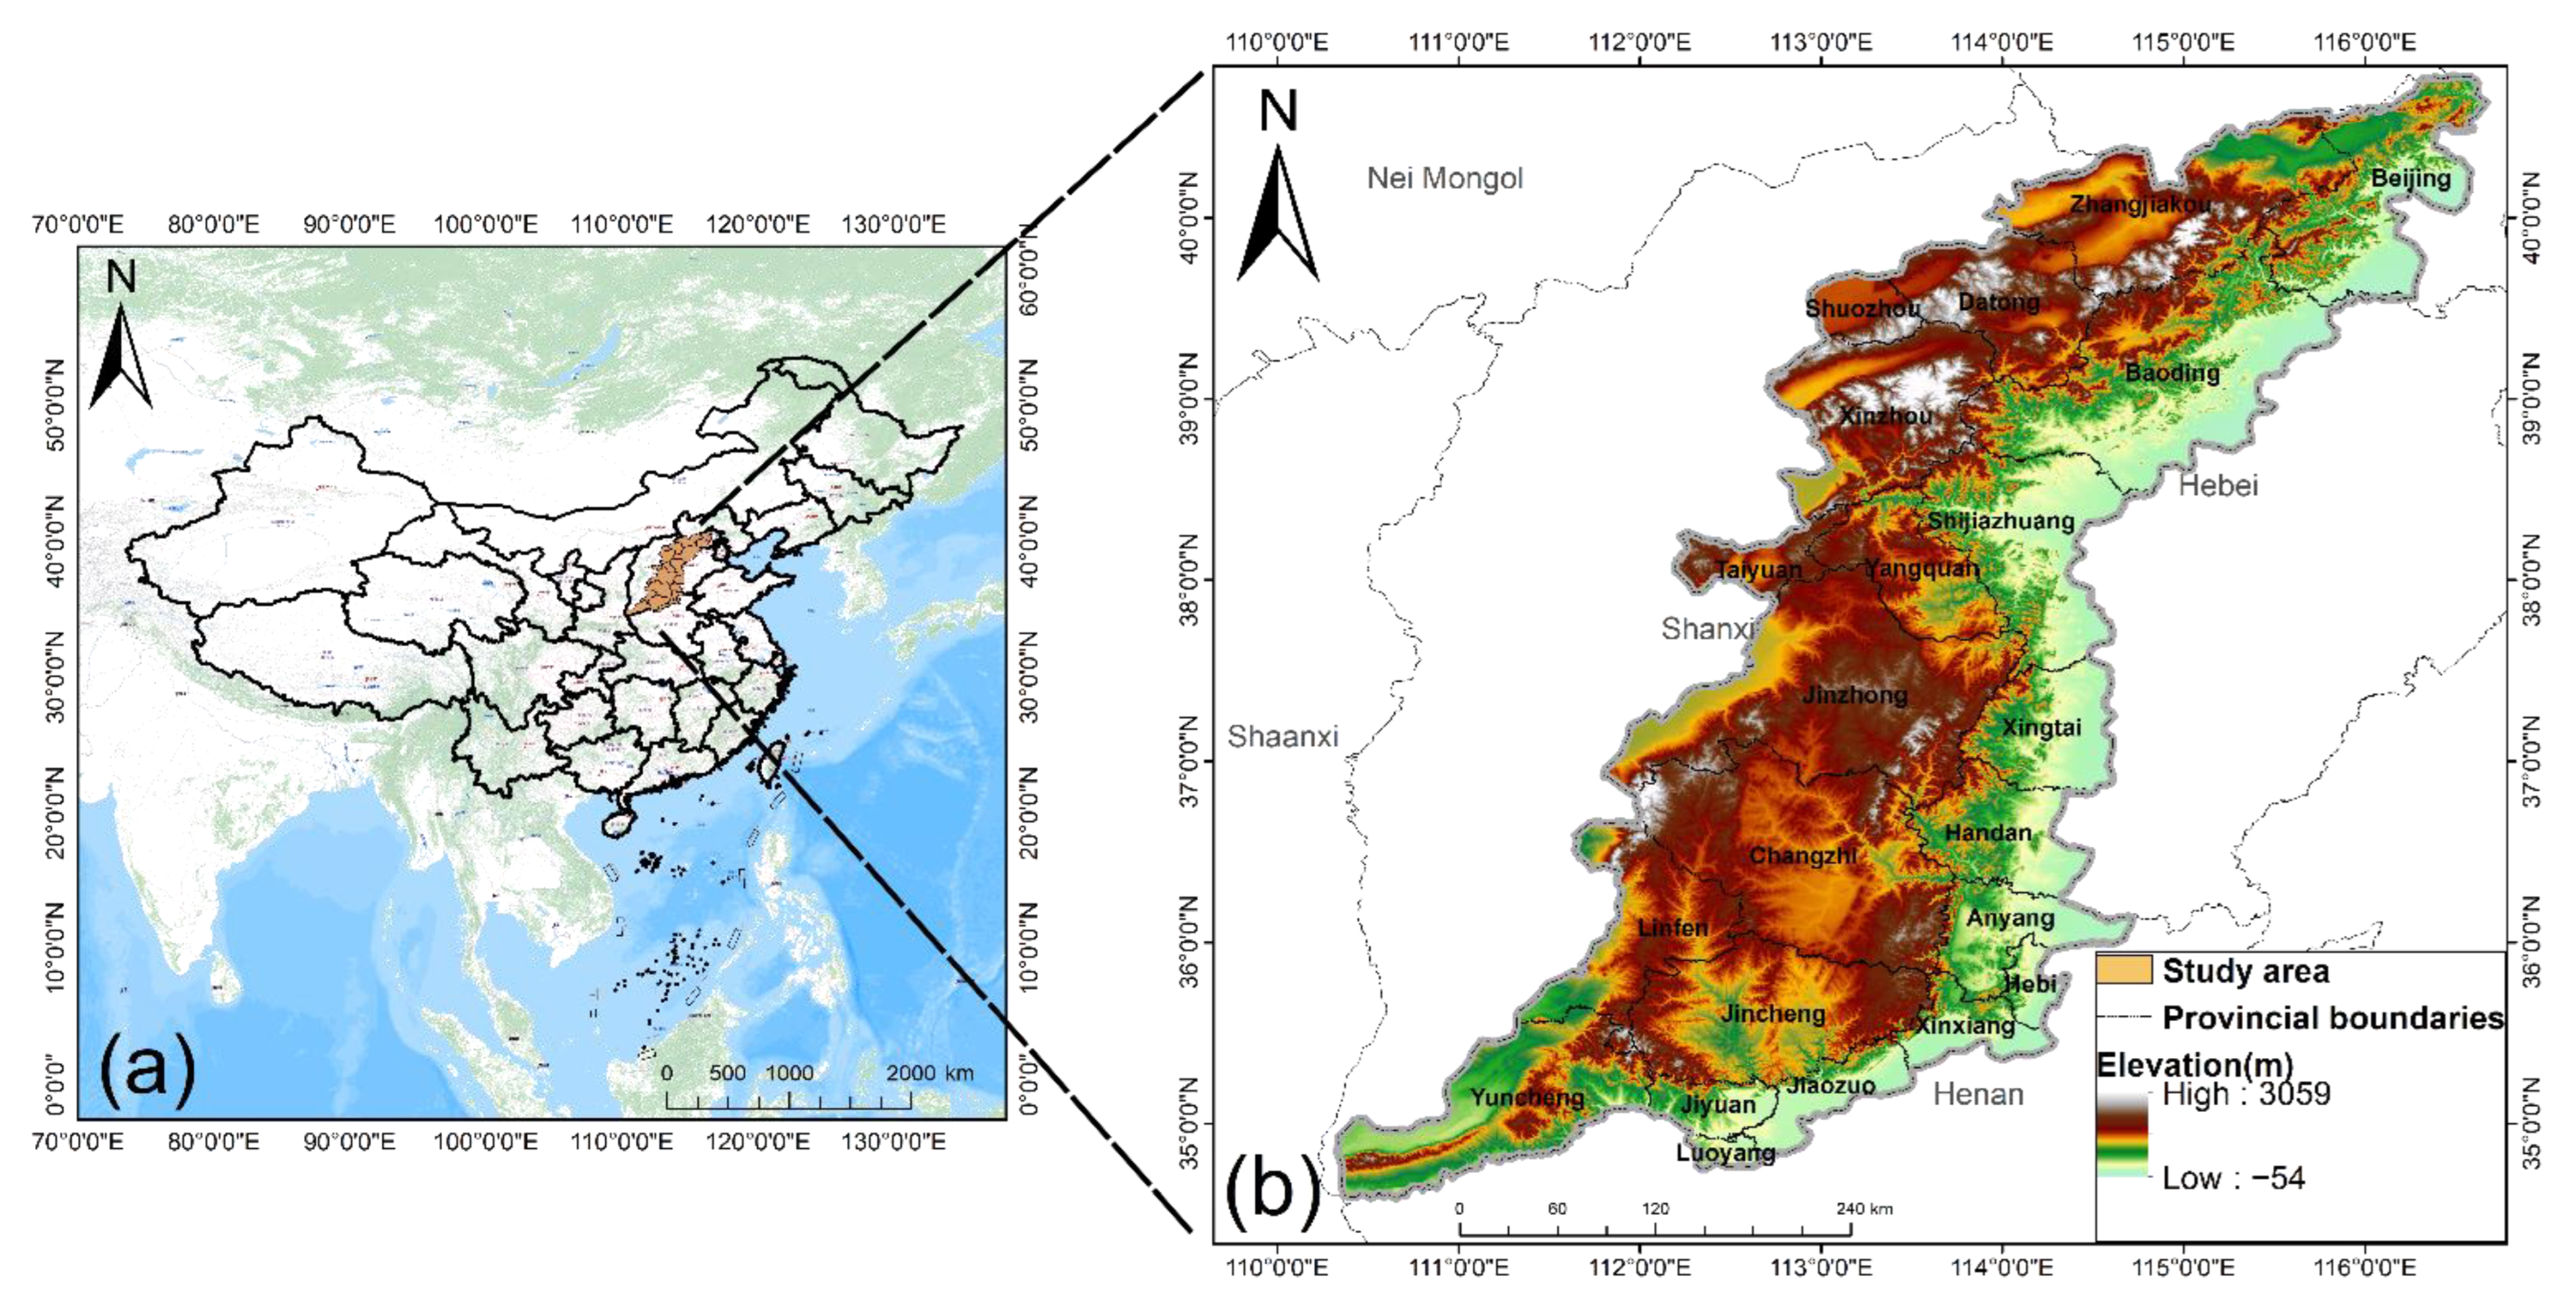
The Taihang Mountains are located 110°39’–116°55’ east longitude and 34°91’–40°65’ north latitude (
Figure 1), which spans the four administrative regions of Hebei, Beijing, Henan, and Shanxi, with a total area of about 13.58 × 10
4 km
2. The average annual temperature in the study area is 10.3 °C, and the average annual precipitation is 501.8 mm, which belongs to the warm temperate continental monsoon climate. The climate is characterized by shorter spring and autumn seasons, more precipitation in summer, and cold and dry winters [
26]. There are many types of land use in the Taihang Mountains. The eastern and southern parts are mainly cultivated land, the northern and western areas are mainly grassland and forest, and the construction land is mainly concentrated in the provincial capital and surrounding cities. Different land use types and vegetation structures have a great influence on ecosystem carbon storage and carbon sink capacity [
27]. The area in the Taihang Mountains is rich in vegetation resources such as forest and grassland, with good ecological functions, and is the primary source of carbon storage in North China.
2.2. Data Sources
At the annual scale, the spatial and temporal changes of ecosystem carbon storage are relatively weak. Therefore, this paper takes five years as the time interval to select the data of the study area and selects the land use image data of the four time points of 2005, 2010, 2015 and 2019. The land use data of the areas in the Taihang Mountains in 2005, 2010, 2015, and 2019 were obtained from the Resource and Environment Science and Data Center (
https://www.resdc.cn/ (accessed on 28 January 2022)). According to the research needs, this paper took satellite remote sensing images as the data source. It classified the land use types into six types: arable land, grassland, forest, water, construction land, and unused land through visual interpretation. The carbon density data of this study came from relevant data of existing references [
22,
25], and the data were revised according to the research needs to obtain the carbon density of various land use in the Taihang Mountains (
Table 1).
Considering the natural conditions of the Taihang Mountains and referring to relevant literature [
28,
29,
30,
31,
32,
33,
34], this paper selects elevation, slope, Normalized Difference Vegetation Index (NDVI), temperature, precipitation, soil texture, population density, and GDP as driving factors for spatial differentiation of regional carbon storage. Elevation data were obtained from the geospatial data cloud platform (
https://www.gscloud.cn/ (accessed on 18 March 2022)) with a resolution of 90 m. Slope data were calculated and extracted by ArcGIS software. The NDVI of each period was obtained from the Resource and Environment Science and Data Center (
https://www.resdc.cn/ (accessed on 20 March 2022)), which was transformed by Mosaic, Projection, with a resolution of 1 km. The annual average temperature and precipitation data of the Taihang Mountains were collected from 390 meteorological stations in various periods, all of which were obtained from the National Meteorological Science Data Center (
http://data.cma.cn/ (accessed on 18 March 2022)). These data were interpolated separately using ANUSPLIN software to obtain the spatially interpolated data of annual mean temperature and annual precipitation for each period. The soil data were compiled according to the 1:1 million soil types map and the second soil census data. The data included three types: sand, silt, and clay, and the value was the percentage. Population density data were downloaded from WorldPop (
https://www.worldpop.org/ (accessed on 31 March 2022)) and released by the world map of population density. The population density datasets for each period were extracted from these downloaded population data by ArcGIS software with a resolution of 30 m. The GDP data came from the “China GDP Spatial Distribution Kilometer Grid Dataset” product under the Resources and Environment Data Center (
https://www.resdc.cn/ (accessed on 20 March 2022)) of the Chinese Academy of Sciences, with a resolution of 30 m.
2.3. Research Methods
2.3.1. InVEST Model
The InVEST model, jointly developed by Stanford University, the Nature Conservancy, and the World Wide Fund for Nature, is an open source ecosystem service function assessment model, which can be well used to assess regional carbon storage and its value [
35]. This paper uses the carbon storage module in the InVEST model to analyze the carbon storage changes in terrestrial ecosystems in the Taihang Mountains between 2005 and 2019, which classified the carbon density of each land use type as four primary carbon pools: (1) Aboveground living biomass(C
above): All living organisms above the soil. (2) Belowground living biomass(C
below): All living organisms below the soil. (3) Soil carbon(C
soil): the organic carbon of mineral soils. (4) Dead organic matter: dead organic matter on the soil, includes litterfall, fallen or standing dead wood. According to the distribution of land use types in the Taihang Mountains, the InVEST model analyzes and calculates the average carbon density (C
total) of various land use types. The specific formulas are as follows:
i is the type of land use in type i; Ci is the total carbon density of i land use type(t·hm−2); Ci,above ground carbon density (t·hm−2) of i land use type; Ci,below is the subsurface carbon density of i land use type (t·hm−2); Ci,dead is the carbon density of dead organic matter of i land use type (t·hm−2); Si is the area of i land use type(m2); Ctotal is the total carbon storage of terrestrial ecosystems (t).
2.3.2. Random Forest
The principle of random forest method is to use the importance evaluation method of random forest to analyze the importance of each driving factor and screen out the driving factors with the strong influence on the spatial differentiation of carbon storage. The random forest method [
36] was used to further screen environmental factors (slope, DEM, NDVI), climate factors (precipitation, temperature), soil factors (clay, sand, and silty soil content), and human disturbance factors (population density, GDP). After random forest calculation, the importance ranking results of driving factors are shown in
Figure 2. Further, the driving factors with less than 30% importance (clay content, silt soil content, GDP) were removed, and the driving factors with higher importance (slope, NDVI, population density, air temperature, precipitation, DEM, sand soil content) were screened.
2.3.3. Geodetector
Geodetector is a new statistical method proposed by Prof. Jinfeng Wang, which is used to detect the spatial differentiation among geographical objects and analyze the driving factors of their spatial [
37]. Geodetector can be used not only to detect the spatial differentiation of driving factors, but also to detect the degree of interaction between two factors on dependent variables. In this paper, factor detection and interaction detection of Geodetector are used to analyze the driving factors and their interactions affecting the spatial differentiation of carbon storage in the Taihang Mountains.
(1) Factor detector: Factor detector is used to detect the spatial differentiation of Y; and to detect how much a specific factor X explains the spatial differentiation of attribute Y. Factor detection results are measured by q value, whose expression is:
q is the explanation intensity of driving factor X to Y, and the range is (0–1). i is the amount of carbon storage in the study area; ni and n are the number of samples in type i research area and the total number of samples in the research area, respectively. δi2 and δ2 are the variances of carbon storage in type I study area and the variance of overall carbon storage in the study area, respectively.
(2) Interaction detector: interaction detector can analyze whether there is an interaction among the driving factors and the intensity of the interaction. It can analyze the joint effect between different driving factors on the dependent variable Y. The interaction between driving factors is shown in
Table 2.
3. Results
3.1. Land Use Change Results
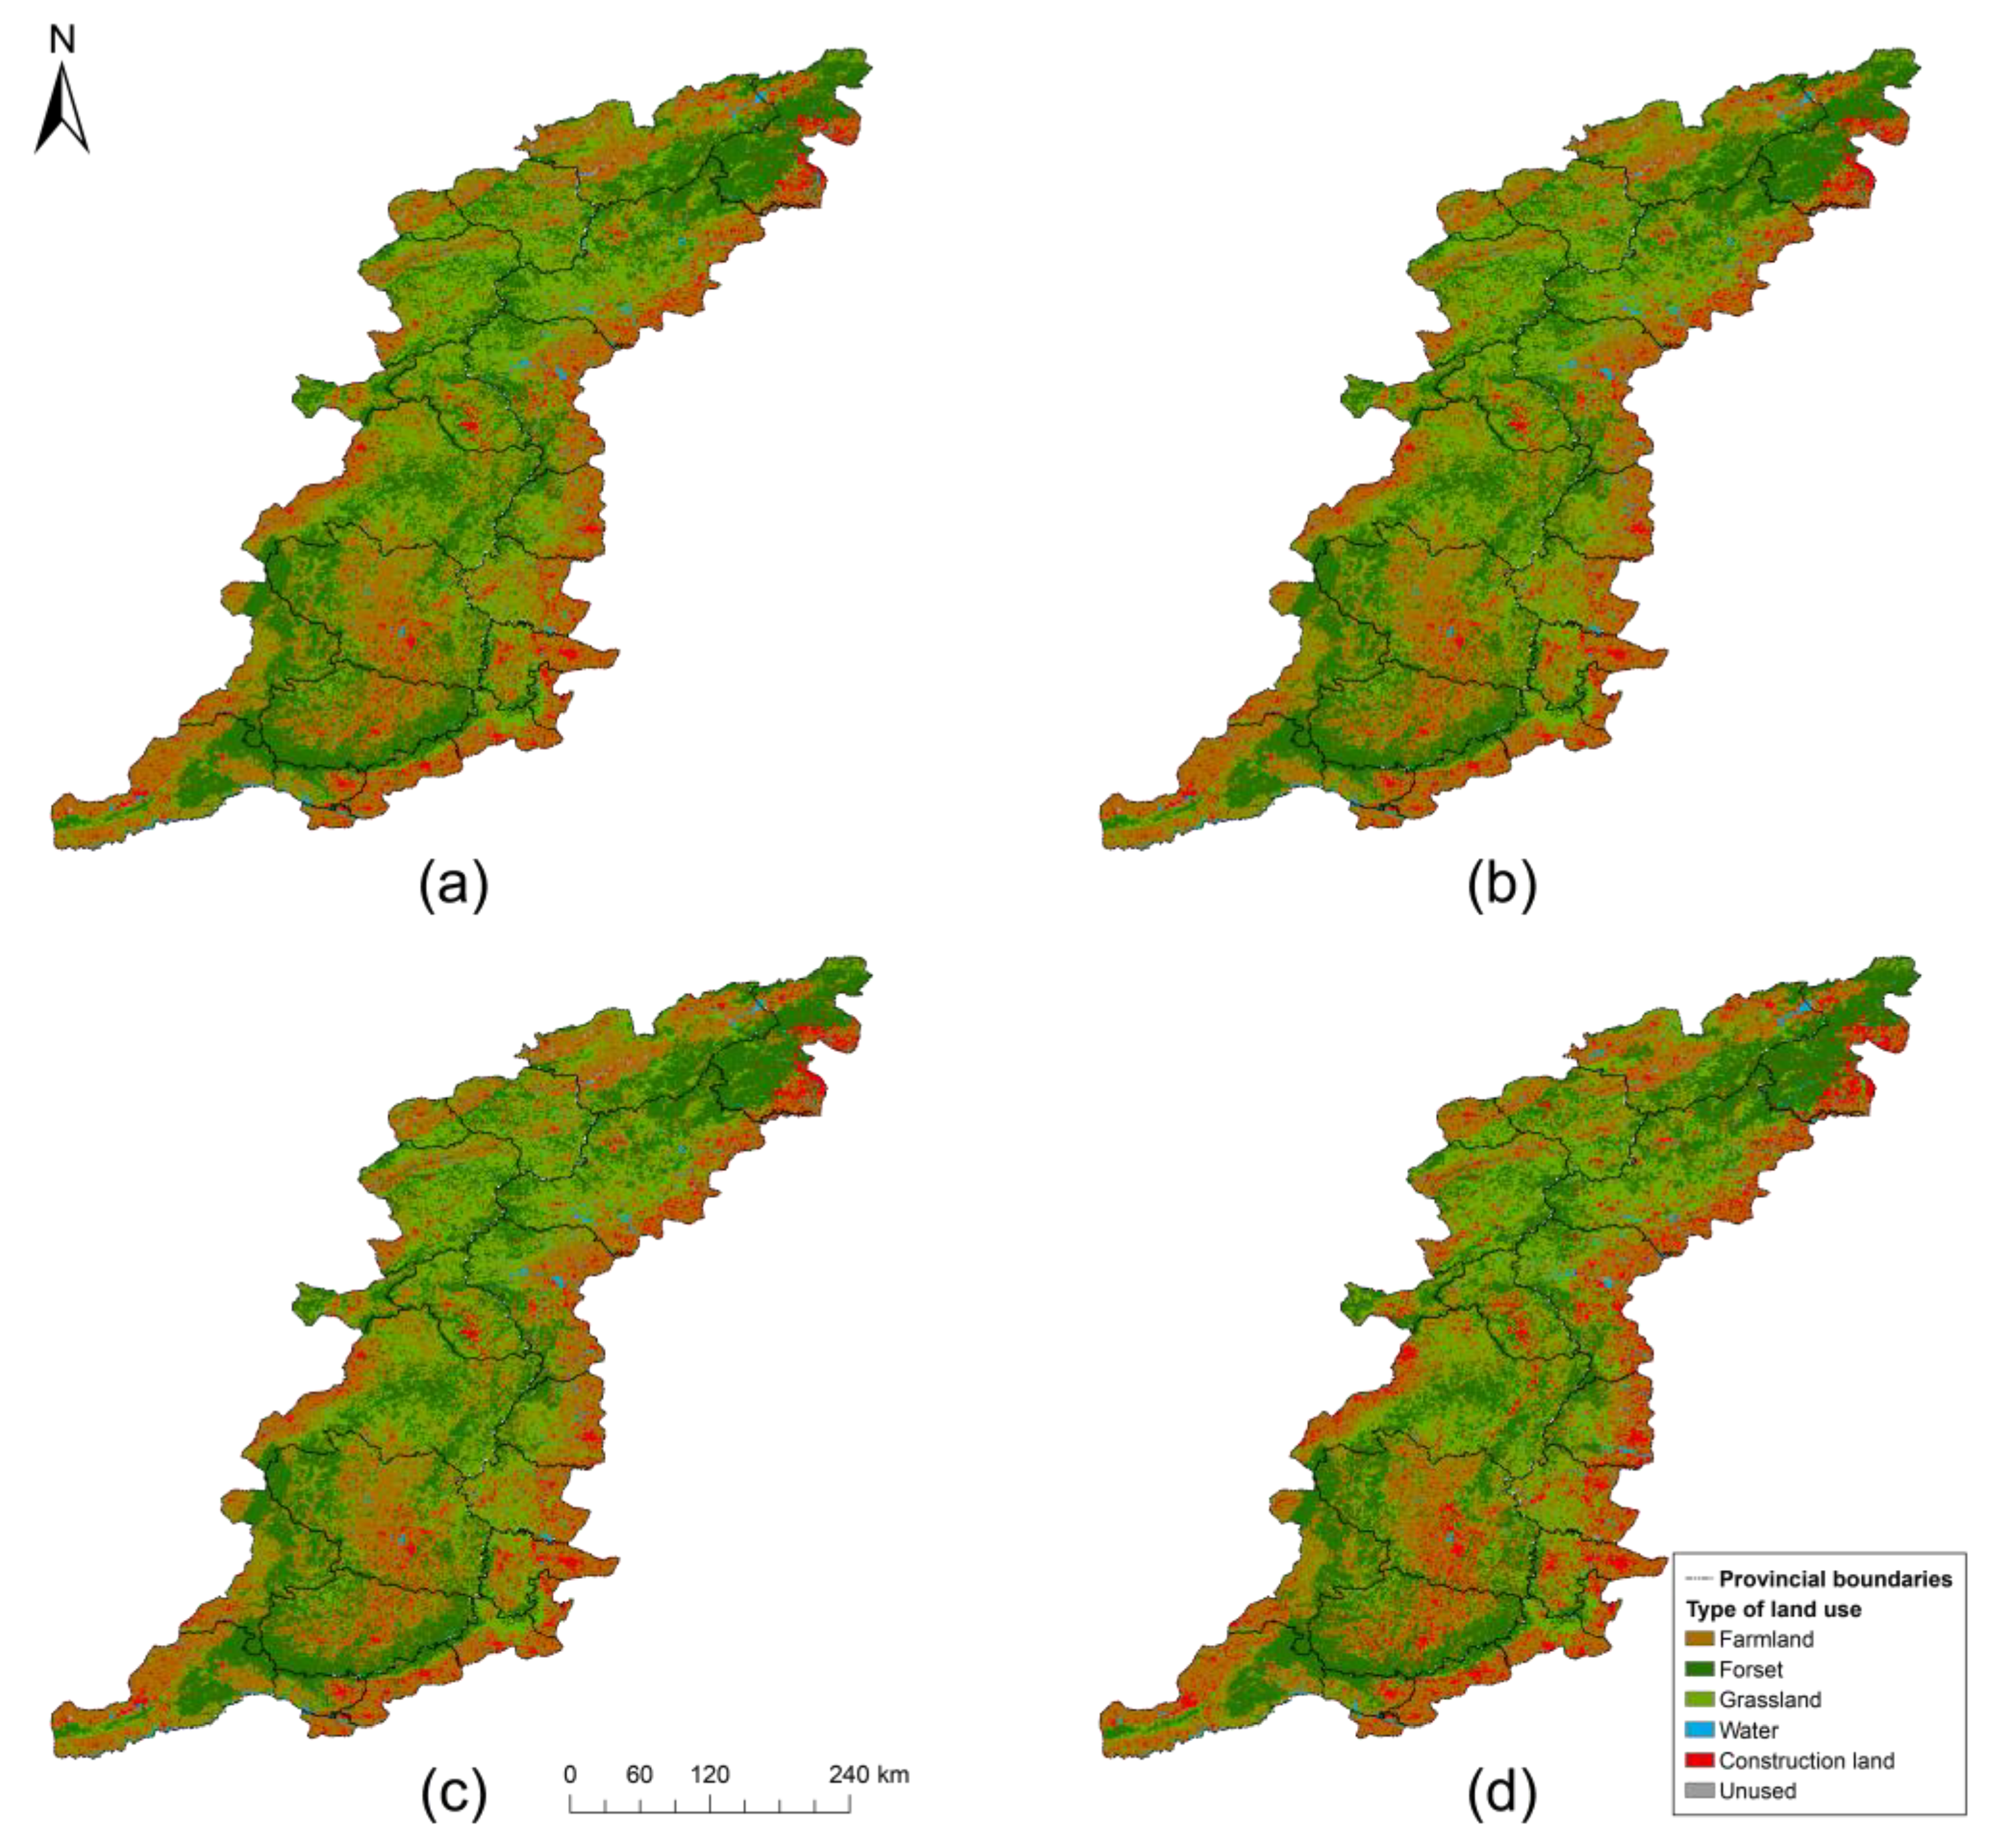
By analyzing the spatial distribution and changes of land use in the Taihang Mountains from 2005 to 2019 (
Figure 3,
Table 3), it can be seen that the types of land use in the region have evident spatial heterogeneity on the whole, and the variation range of land area of each land use type is small during the monitoring time.
In terms of spatial distribution, the land use types were classified as farmland, forest, grassland, water, construction land, and unused land in the Taihang Mountains. Farmland was the largest land use type, between 34.81% and 37.26% in the Taihang Mountains, mainly distributed in the low altitude areas of the Taihang Mountains, distributed in small amounts in the mid-altitude areas such as Jincheng and Changzhi. It was followed by forest and grassland which occupy the second and third place, respectively, in the region, mainly distributed in the higher altitude mountain and hilly areas of the Taihang Mountains. Construction land was located in the fourth place with a relatively low percentage between 4.56% and 7.91%, mainly distributed in the central cities of the provinces and larger cities. Water and unused land were the two types with the lowest proportion of all land use types. Water was distributed in the mid and low elevation areas of the Taihang Mountains, such as larger lakes and rivers. Unused land was mainly bare land and saline land with a small amount distributed in the Taihang Mountains.
From the perspective of the time change, there was a small range change in land use types in different periods in the Taihang Mountains. Between 2005 and 2019, the area of forest and construction land increased slightly. Among them, construction land showed the largest increase, mainly in cities and surrounding areas. The water area change showed a characteristic of decreasing first and then increasing. At the same time, the land use area of arable land, grassland, and unused land showed a feature of decreasing year by year, among which the most decreased was arable land.
3.2. Spatial and Temporal Distribution of Carbon Storage
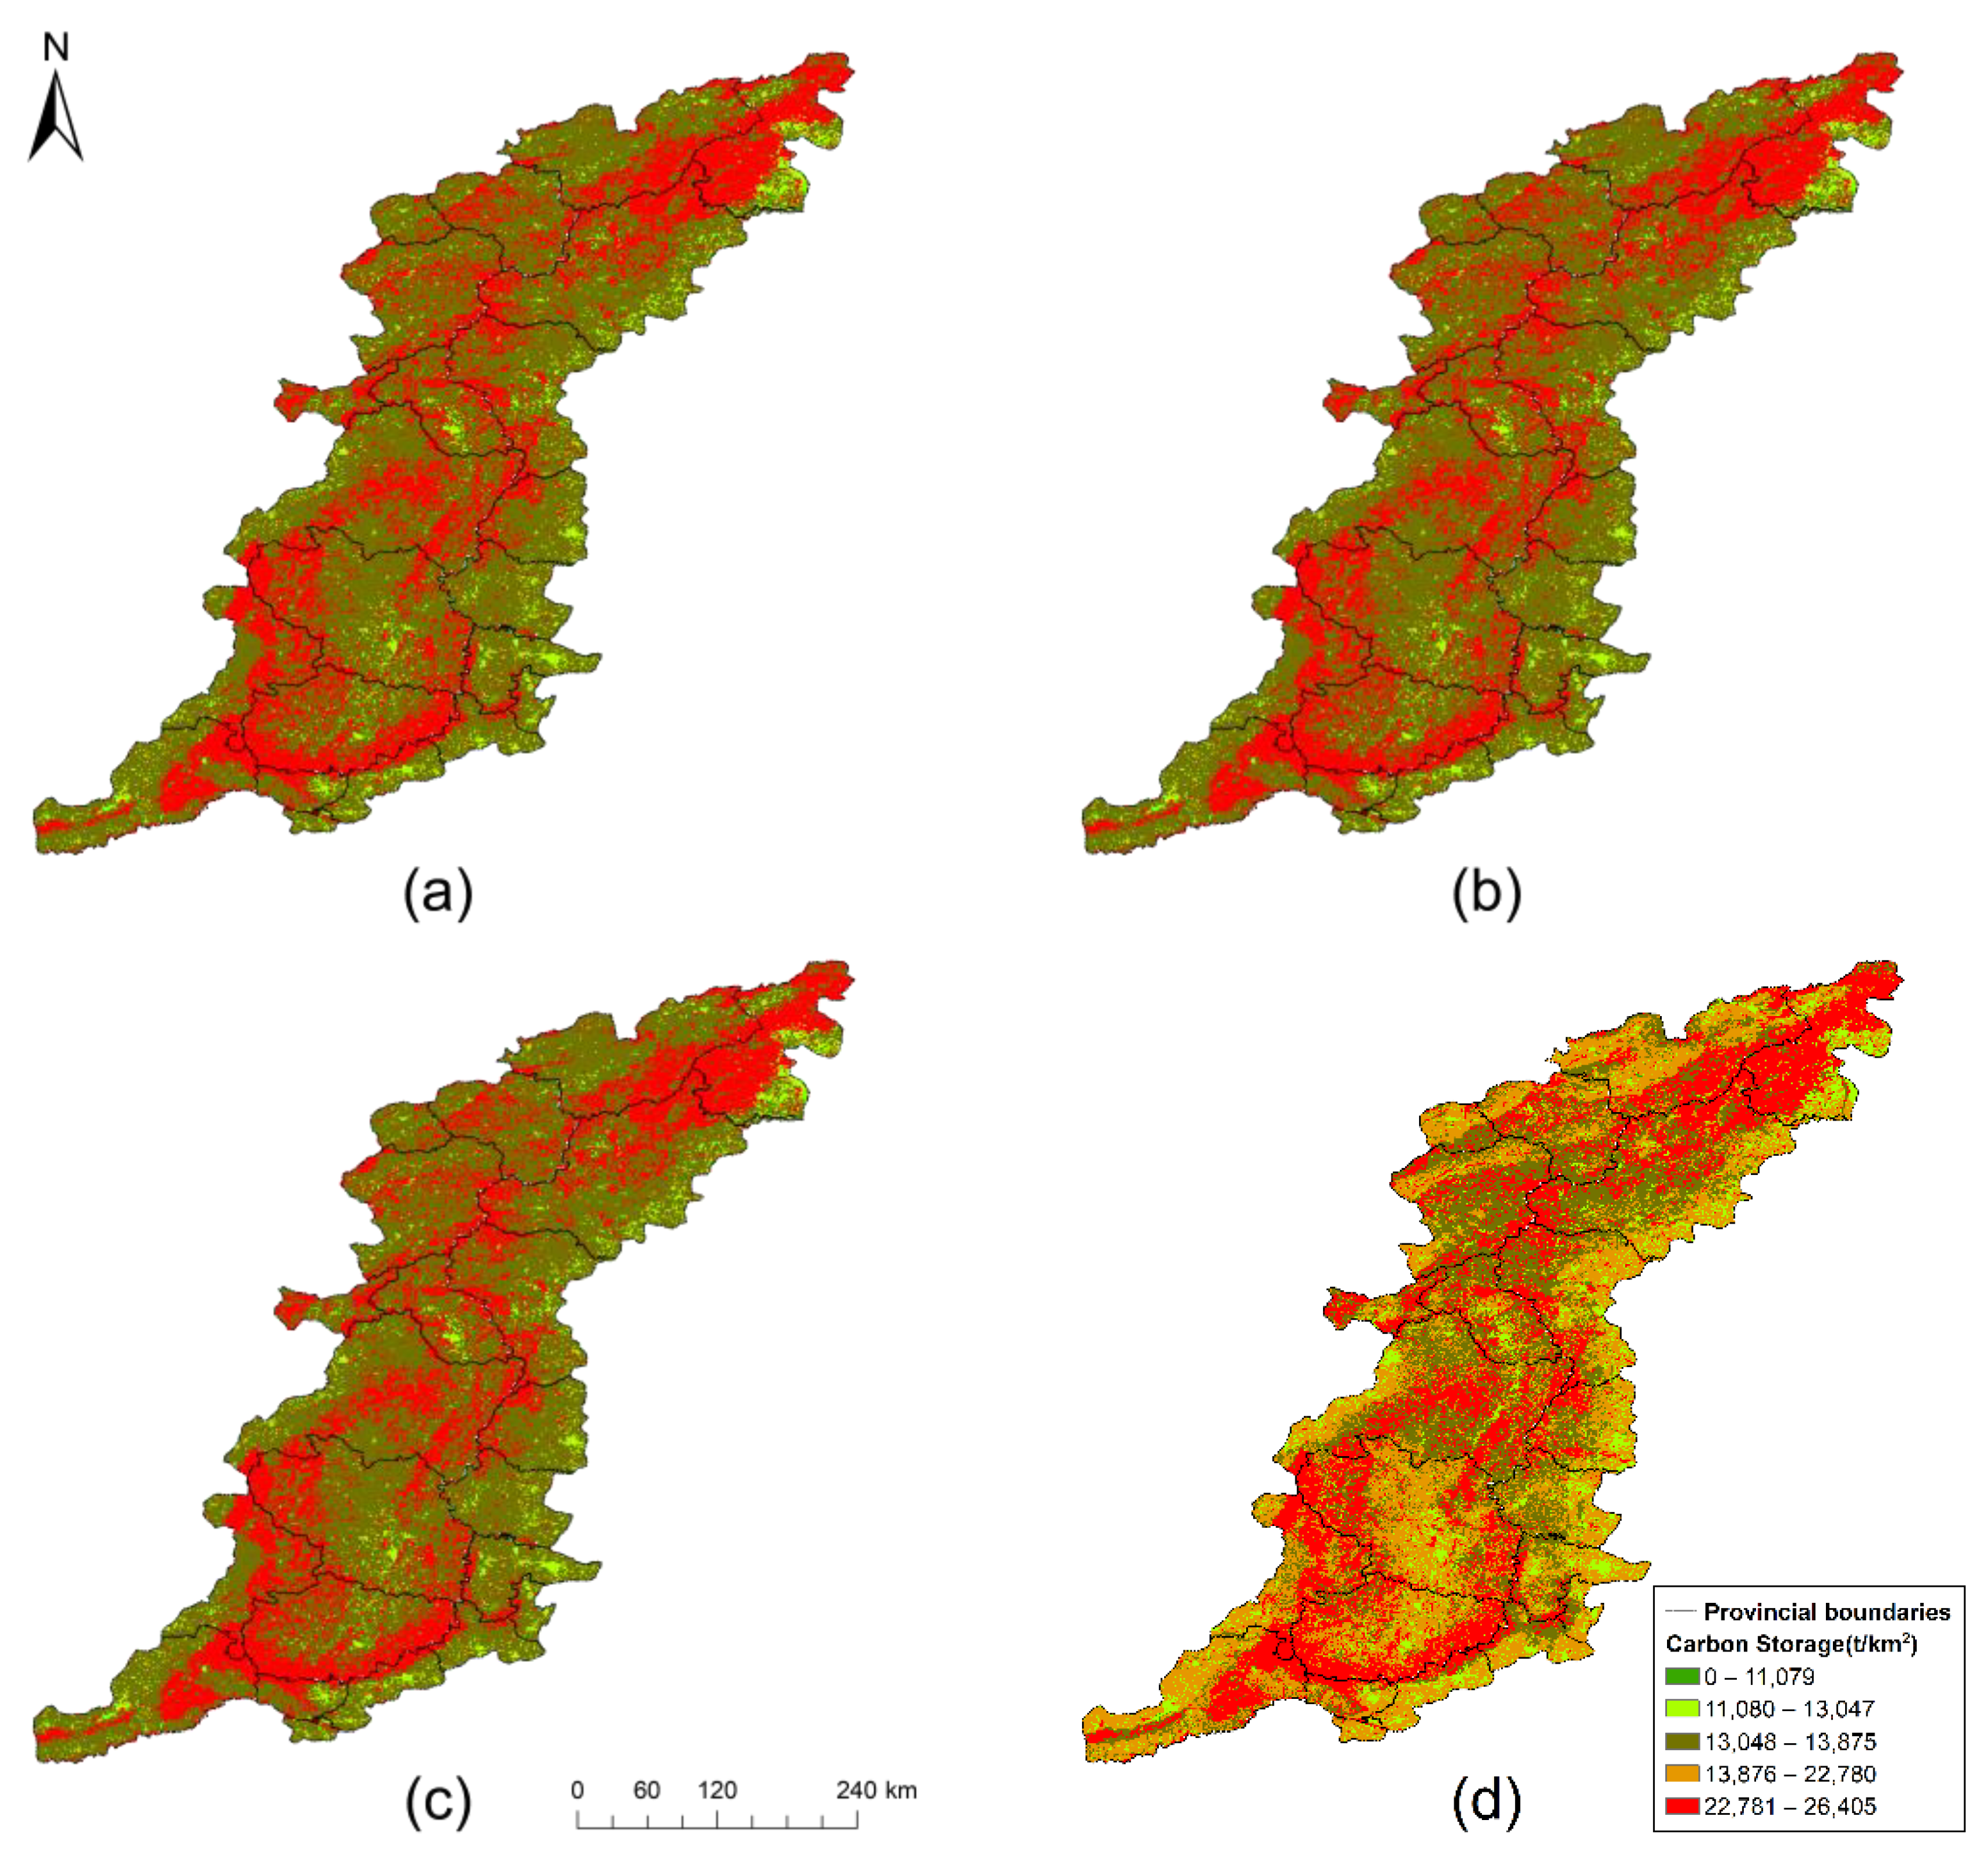
According to the spatial distribution of carbon storage (
Figure 4), there was apparent spatial heterogeneity of carbon storage in the Taihang Mountains. Combined with the analysis in
Figure 2, the overall distribution of carbon storage was closely related to land use types, which showed that the high-value areas were mainly located in the areas with high vegetation covers, such as forest and grassland, while the low-value areas were mainly in the areas with weak carbon sink capacities such as arable land and construction land. The specific distribution position of carbon storage was mainly high in the northeast and southwest and scattered in other regions.
From the changes in carbon storage of land use types (
Table 4), the carbon storage in the Taihang Mountains showed a decreasing trend year by period. From 2005 to 2019, the carbon storage in the Taihang Mountains decreased by −5.26 × 10
6 t overall, with the most significant decrease of −3.95 × 10
6 t in 2015–2019. In terms of land use types, farmland and grassland decreased by −30.87 × 10
6 t and −14.24 × 10
6 t during the whole period, respectively. Arable land was the main land use type with reduced carbon storage. Forest and construction land increased by 8.27 × 10
6 t and 33.84 × 10
6 t, respectively. Construction land was the land use type with the most significant increase in carbon storage.
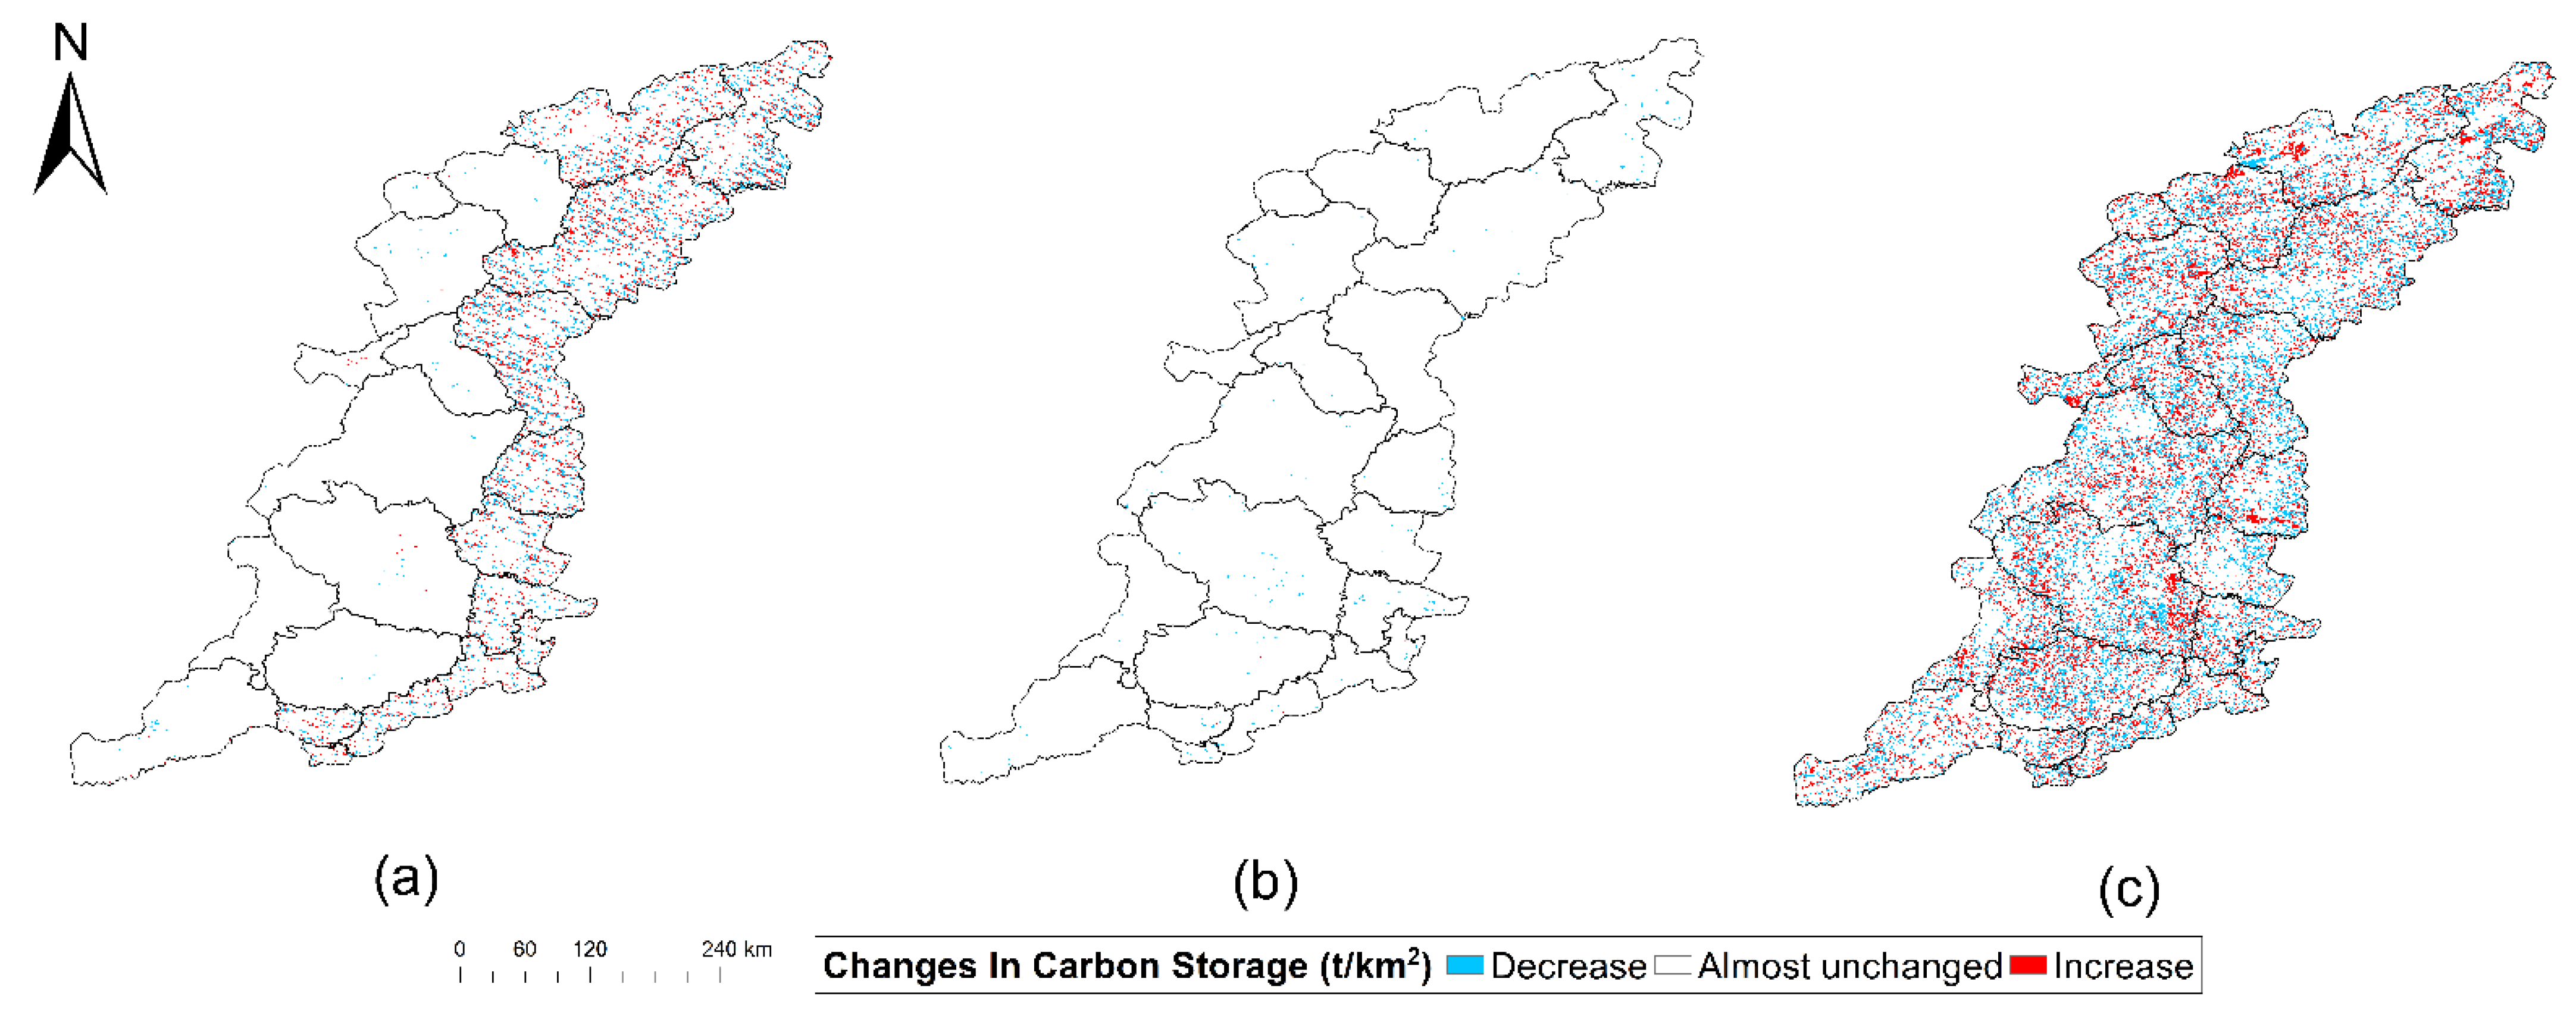
From the spatial distribution of carbon storage in different periods (
Figure 5), the changes from 2005 to 2009 were mainly in most areas of Hebei, Henan, and Beijing, with weak changes and random distributions. Carbon storage in Shanxi remained unchanged. From 2010 to 2014, carbon storage mainly showed a slight decrease. From 2015 to 2019, the changes in carbon stocks were relatively noticeable, but those changes were randomly distributed and had no apparent regularity.
3.3. Spatial and Temporal Variation Drivers of Carbon Storage
The factor detection results of the Geodetector (
Figure 6) showed that altitude, slope, NDVI, temperature, and other factors have different degrees of influence on the spatial distribution of carbon storage in ecosystems of the Taihang Mountains.
Figure 6 showed that slope and NDVI were the main driving factors affecting the spatial differentiation of carbon storage in ecosystems. Their explanatory power was significantly greater than that of other factors. This indicated that during this period, the change in the geographical environment and the dense degree of vegetation dominated the change in carbon storage in the region to a certain extent. The influence of other driving factors on the spatial variation of carbon storage in the Taihang Mountains was relatively stable. Except for the driving factor of sand content, the q values of all factors were greater than 0.05, and the explanatory power was more than 5%, indicating that these factors also played a certain role in the spatial differentiation of carbon storage. The factor of sand content had little explanatory power for the spatial variation of carbon storage in the region. The q value was less than 0.05, and the explanatory power was less than 5%, indicating that it had little influence on the spatial distribution of carbon storage in the Taihang Mountains.
Table 5 showed the detection results of the pairwise interactions of seven factors for the spatial differentiation of ecosystem carbon storage. The pairwise interaction relationship of these factors was nonlinear enhanced or bivariate enhanced, indicating that any factor combined with other factors can enhance the influence on the spatial differentiation of carbon storage. In each period, the explanatory power of slope combined with NDVI type ranged from 0.2610 to 0.2950. This type had the most explanatory power among the synergistic types of the spatial differentiation of carbon storage in each ecosystem, indicating that the regions with good slope and NDVI values may have more carbon storage. Most of the synergistic types between NDVI and other factors were nonlinear enhancement types, which further proves that NDVI was the main driving factor affecting the spatial differentiation of carbon storage. There was a nonlinear enhancement type between sand content factor and other factors in all years, indicating that the effect of sand content factor combined with other factors was far better than that of the effect alone. In short, the synergistic effect among these driving factors was not a simple superposition relationship, which significantly impacted the spatial differentiation of carbon storage.
4. Discussion
4.1. Changes of Carbon Storage
The total carbon storage in the overall ecosystem of the Taihang Mountains decreased year by year during 2005–2019. Specifically, the carbon storage of all land use types showed slight changes in different periods, with the rate of change ranging from 0.06% to 3%. In terms of land types, the area of grassland and arable land dramatically reduced, while the area of construction land significantly increased. This indicates that the policy of “returning farmland to the forest” [
38] implemented in the Taihang Mountains area in this period achieved a good effect, and also indicates that the urbanization development in this period has generated a greater demand for construction land [
39]. Therefore, the increase of construction land area and arable land area, and the decrease of grassland area and forest area will weaken the carbon sequestration capacity of the ecosystem in the region, which is consistent with the research results of spatio-temporal changes in carbon storage in other regions [
40,
41,
42].
4.2. Driver Factors of Spatial Differentiation of Carbon Storage
The analysis results of Geodetector showed that slope and NDVI are the main influencing factors in the spatial differentiation of carbon storage in the Taihang Mountains. This result is consistent with Miaoyu Liet al.’s [
43] conclusion that NDVI is the dominant factor affecting the spatial distribution of ecosystem carbon storage in the Loess Plateau region through path analysis. However, compared with Geodetector, the path analysis method is simple in calculation and straightforward in results, but it requires that the degree of collinearity between independent variables not be too high. Olorunfemi [
44] studied carbon storage in different land use types in Ekiti State, Southwestern Nigeria, and found that about 50% of the carbon storage is contained in natural forests with high vegetation coverage; Eid [
45] studied the effect of different vegetation cover on soil organic carbon stocks, which showed that areas with vegetation cover > 75–100% have higher carbon storage. Compared with other land types (such as arable land and construction land), high-coverage vegetation (such as forest and grassland) has better carbon sequestration capacity. Therefore, priority can be given to increasing regional vegetation coverage for an effective carbon sink. In addition, Buraka [
46] studied that the land use type along the slope has an obvious effect on carbon density; Cheng [
47] established the soil database of Anhui Province through GIS technology and found that the carbon density increased with the increase of slope; Hamere [
48] studied the change in carbon storage along the gradient of the slope in the Geduo forest and concluded that the slope has a significant impact on litter carbon storage. These studies illustrate that slope is an important factor which greatly affects the spatial distribution of vegetation and soil carbon density. Based on the interaction detection results of Geodetector, it can be found that the combination of different driving factors can enhance the influence on the spatial differentiation of carbon storage, and the effect of slope and NDVI type was the strongest. Therefore, it is necessary to consider the impact of different geographical conditions and environmental factors on regional carbon sequestration and strengthen the vegetation coverage in higher altitude areas when implementing the “dual carbon” construction in the future. For example, in the measures to improve the carbon storage of the regional ecosystem in the Taihang Mountains, priority should be given to the role of slope and vegetation coverage, focusing on strengthening the surface vegetation in the high elevation area, increasing the forest area on the whole, and controlling the expansion of construction land in the area with high vegetation coverage.
4.3. Deficiencies and Prospects
At present, scholars’ research methods for influencing factors of carbon storage spatial differentiation [
49,
50,
51,
52,
53] mainly adopt qualitative analysis, while this paper attempts to quantitatively study the driving factors of carbon storage using Geodetector, which provides a new idea for the study of carbon sinks in ecosystems. It is certain that this paper also has the following shortcomings: (1) The number of some driving factors is insufficient. For example, only sand, clay, and silt content were selected as soil texture factors. However, the driving mechanism of soil factors for carbon sequestration in the ecosystem is very complex, so it may be necessary to select more comprehensive soil factors. (2) The results obtained from calculating driving factors using Geodetector do not pay attention to the direction of action of driving factors. Therefore, it is necessary to strengthen further the influence of soil factors on ecosystem carbon sink and study driving factors using spatial statistical analysis methods in future studies.
5. Conclusions
The carbon storage in the Taihang Mountains has changed from 2000 to 2019, mainly due to the changes in land use types; environmental factors such as slope and NDVI dominated the spatial distribution of carbon storage in the region. The concrete conclusions are as follows:
(1) From 2005 to 2019, the land use types in the Taihang Mountains changed to a relatively small extent. During the whole study period, the land area of forest and construction land increased slightly, and the land use area of cultivated land and grassland decreased by period.
(2) From 2005 to 2019, the total value of carbon storage in the Taihang Mountains area ranged from 1472.91 × 106 t to 1478.17 × 106 t, showing a decreasing trend. From the perspective of spatial distribution, the carbon storage mainly decreased from the high altitude and lush vegetation areas to the surrounding areas. From the perspective of land use type, forest accounted for the largest proportion of carbon storage in the region, followed by farmland, grassland, construction land, water area, and unused land. Combined with land use change, the decrease of forest land and the increase of construction land are the main reasons for the decrease in carbon storage in the Taihang Mountains.
(3) According to the factor detection results, the spatial variation of ecosystem carbon storage in the Taihang Mountains is mainly affected by topographic and environmental factors. Slope and NDVI have a significantly greater impact on the spatial variation of carbon storage in the region than other factors, which were the main driving factors affecting the spatial variation of carbon storage in the Taihang Mountains ecosystems. Other factors (e.g., temperature, sand content, etc.) also played a role in the region’s spatial variation of carbon storage. According to the interaction detection results, the interactions among the drivers are more robust than those of a single factor on the spatial variation of carbon storage. Among them, the NDVI synergistic slope type had the most potent synergistic effect, indicating that the area under the synergistic effect of slope and NDVI have more abundant carbon storage.
Author Contributions
Conceptualization, C.W., J.L. and Y.T.; methodology, C.W. and F.Q.; software, J.L. and F.Q.; validation, J.L.; formal analysis, C.W. and J.L.; resources, J.L.; writing—original draft preparation, J.L.; writing—review and editing, J.L. and Y.W.; visualization, J.L.; supervision, C.W.; project administration, C.W.; funding acquisition, C.W. All authors have read and agreed to the published version of the manuscript.
Funding
This research was funded by National Key R&D Program of China, grant number 2020YFF0414359.
Institutional Review Board Statement
Not applicable.
Informed Consent Statement
Not applicable.
Data Availability Statement
The data presented in this study are available on request from the corresponding author.
Acknowledgments
This research was partially funded by the National Key R&D Program of China under grant number: 2020YFF0414359. We would like to thank Honghu Tang for his help with the partial data for this study. All authors have read and agreed to the published version of the manuscript.
Conflicts of Interest
The authors declare no conflict of interest.
References
- Gao, Q. Green innovation empowered by “Dual carbon” achievements of leading companies. Big Data Time 2022, 1, 60–76. [Google Scholar]
- Yadi, G. Analysis on Emission Reduction Strategies of Chinese Airlines Under the Dual Carbon Goals. J. Glob. Econ. Bus. Financ. 2022. [Google Scholar] [CrossRef]
- Liu, F.; Jiang, J.J.; Zhang, S.W. Government Environmental Governance and Enterprise Coordinated Green Development under the Goal of “Dual Carbon”. J. Environ. Public Health 2022, 2022. [Google Scholar] [CrossRef]
- Japan Chemical Daily Grpup. Column: China’s “Dual Carbon” Target Creates Waves in Chemical Sector. Available online: https://www.japanchemicaldaily.com/2022/02/25/column-chinas-dual-carbon-target-creates-waves-in-chemical-sector/ (accessed on 5 May 2022).
- Yang, Y.H.; Shi, Y.; Sun, W.J.; Chang, J.F.; Zhu, J.X.; Chen, L.Y.; Wang, X.; Guo, Y.; Zhang, H.; Yu, L.; et al. Terrestrial carbon sinks in China and around the world and their contribution to carbon neutrality. Sci. China Life Sci. 2022, 65, 861–895. [Google Scholar] [CrossRef]
- Gao, H.; Liu, J.T.; Zhu, J.J.; Li, X.R. Ecosystem services management based on vertical variation for sustainable development of Taihang Mountains. Chin. J. Nat. 2018, 40, 47–54. [Google Scholar]
- Qiao, F.; Liu, X.Y.; Wang, W. Problems and Countermeasures in the Construction of Taihang Mountain Ecological Conservation Area. Stat. Manag. 2018, 4, 17–20. [Google Scholar]
- Liu, H.Y.; Wen, L.H.; Song, J.G. Study of Carbon Storage under change in land use patterns in Taihang mountain area of Hebei province. Environ. Eng. 2014, 12, 133–135+142. [Google Scholar]
- Wang, Z.Y.; Cao, J.S. Study on Land Reclamation and Ecological Restoration Technology in Taihang Mountain Area of Hebei Province. J. Hebei For. Sci. Technol. 2018, 3, 50–53. [Google Scholar]
- Dangulla, M.; Abd Manaf, L.; Ramli, M.F.; Yacob, M.R.; Namadi, S. Exploring urban tree diversity and carbon stocks in Zaria Metropolis, North Western Nigeria. Appl. Geogr. 2021, 127, 102385. [Google Scholar] [CrossRef]
- Wu, H.; Xu, H. Remote Sensing Retrieval and Calibration of Forest Vegetation Carbon Density Based on Time-series Data. For. Resour. Manag. 2021, 6, 43–51. [Google Scholar]
- Chen, P.F.; Wang, J.L.; Wang, X.M.; Xu, S. Research Progress in Estimating Carbon Storage of Forest Ecosystem. For. Inventory Plan. 2009, 34, 39–45. [Google Scholar]
- Zhang, Z.T. Carbon Sequestration Estimation of Typical Urban Green Land in Shanghai. J. Green Sci. Technol. 2017, 15, 60–62. [Google Scholar]
- Ying, T.Y.; Li, M.Z.; Fan, W.Y. Estimation of Carbon Storage of Urban Forests in Harbin. J. Northeast. For. Univ. 2009, 9, 33–35. [Google Scholar]
- Zhang, G.L. Spatial Distribution Characteristics of Carbon Storage of Urban Forests in Shanghai Based on Remote Sensing Estimation. Ecol. Environ. Sci. 2021, 30, 1777–1786. [Google Scholar]
- Schedlbauer, J.L.; Polohovich, S. Current and Future Carbon Storage Capacity in a Southeastern Pennsylvania Forest. Nat. Areas J. 2020, 40, 300–308. [Google Scholar] [CrossRef]
- Lipatov, D.N.; Shcheglov, A.I.; Manakhov, D.V.; Brekhov, P.T. Spatial Variation of Organic Carbon Stocks in Peat Soils and Gleyzems in the Northeast of Sakhalin Island. Eurasian Soil Sci. 2021, 54, 226–237. [Google Scholar] [CrossRef]
- Hu, S.; Zhang, X.R.; Guan, D.J. Analysis on Carbon Storage Change of Construction Land Expansion in Chongqing Based on InVEST Model. Res. Soil Water Conserv. 2018, 25, 323–331. [Google Scholar]
- Liu, M.Z.; Wang, Y.F.; Pei, H.W. The changes of land use and carbon storage in the northern farming-pastoral ecotone under the background of returning farmland to forest(grass). J. Desert Res. 2021, 41, 174–182. [Google Scholar]
- Liu, X.J.; Li, X.; Liang, X.; Shi, H.; Ou, J.P. Simulating the Change of Terrestrial Carbon Storage in China Based on the FLUS-InVEST Model. Trop. Geogr. 2019, 39, 397–409. [Google Scholar]
- Cong, W.C.; Sun, X.Y. A Study on Carbon Sequestration Capacity Based on GIS and InVEST Model in Rizhao City. Bull. Soil Water Conserv. 2018, 38, 200–205. [Google Scholar]
- Alam, S.A.; Starr, M.; Clark, B.J. Tree biomass and soil organic carbon densities across the Sudanese woodland savannah: A regional carbon sequestration study. J. Arid. Environ. 2013, 89, 67–76. [Google Scholar] [CrossRef]
- Shen, H.T.; Wang, X.X.; Zhao, Y.X.; Liu, X. Organic Carbon and Nitrogen Storage in a 10-Year-Old Juglans regia Ecosystem in the Taihang Mountain Area of Hebei Province. J. Sichuan Agric. Univ. 2017, 35, 208–212. [Google Scholar]
- Zhang, H.Z.; Lu, G.Q.; Yuan, Z.G.; Zhang, S.C.; Wu, H.X. Estimation of carbon cycling of natural secondary forest in the Taihang Mountains. Hebei J. For. Orchard. Res. 2005, 20, 11–13. [Google Scholar]
- Li, M.J.; Li, T.Q.; Zhu, W.B.; Zhu, L.Q. Multidimensional Changes of Carbon Storage in the Taihang Mountain Ecosystem Based on InVEST Model. J. Henan Univ. Nat. Sci. 2021, 51, 631–642684. [Google Scholar]
- Fan, C.Y.; Jing, H.T.; Wang, L.; Cheng, J.; Li, X.Y.; Yu, X. Spatial-Temporal Change of Climate and Its Relationship with Vegetation Coverage in the Taihang Mountainous Areas. Res. Soil Water Conserv. 2020, 27, 146–152+158. [Google Scholar]
- Wang, T.F.; Gong, Z.W.; Deng, Y.J. Identification of priority areas for improving quality and efficiency of vegetation carbon sinks in Shaanxi province based on land use change. J. Nat. Resour. 2022, 37, 1214–1232. [Google Scholar] [CrossRef]
- Xu, L.; He, N.P.; Yu, G.R. A dataset of carbon density in Chinese terrestrial ecosystems (2010s). China Sci. Data 2019, 4, 86–92. [Google Scholar]
- Zheng, S.F.; Wang, L.P.; Zang, S.Y. The Change of Ecosystem Services of Natural Forest Protection Project Regions in the Da Hinggan Mountains. Sci. Geogr. Sin. 2021, 41, 1295–1302. [Google Scholar]
- Zhang, W.H.; Jia, Z.B.; Zuo, Y.; Te, G.S.; Jiang, X.Y. Applicability research on carbon storage in the Xilin Gol Grassland by In VEST Model. J. Earth Environ. 2016, 7, 87–96. [Google Scholar]
- Shi, T.T.; Chen, Z.H.; Wang, N.T.; Jin, X.W. Spatial correlation analysis on soil organic carbon and the influencing factors in the Xiangxi River Basin. Carsologica Sin. 2011, 30, 422–431. [Google Scholar]
- Li, R.W.; Ye, C.C.; Wang, Y.; Han, G.D.; Sun, J. Carbon Storage Estimation and its Drivering Force Analysis Based on InVEST Model in the Tibetan Plateau. Acta Agrestia Sin. 2021, 29, 43–51. [Google Scholar]
- Ren, X.N.; Dong, Y.X.; Wang, Q.X. Temporal and Spatial Variation of Soil Organic Carbon Storage in the Core Area of Pearl River Delta and Identification of Influencing Factors. Trop. Geogr. 2018, 38, 668–677. [Google Scholar]
- Liu, R.; Zhu, D.L. Methods for Detecting Land Use Changes Based on the Land Use Transition Matrix. Resour. Sci. 2010, 32, 1544–1550. [Google Scholar]
- Tang, Y.; Zhu, W.P.; Zhang, H.; Song, Y. A review on principle and application of the InVEST model. Ecol. Sci. 2015, 3, 204–208. [Google Scholar]
- Cao, T.Y. Study on the Importance of Variables Based on Random Forest. Stat. Decis. 2022, 4, 60–63. [Google Scholar]
- Wang, J.F.; Xu, C.D. Geodetector: Principle and prospective. Acta Geogr. Sin. 2017, 72, 116–134. [Google Scholar]
- Liu, Q. Study on the Effect and Follow up Policy of Converting Farmland to Forest in Shanxi Province. For. Shanxi 2016, 5, 6–7. [Google Scholar]
- Wei, J.; Liu, L.L.; Wang, H.Y.; Zhang, Y.X.; Wang, C.L.; Liu, J.T.; Fu, T.G.; Gao, H.; Liang, H.Z.; Liu, Y.C. Spatiotemporal patterns of land-use change in the Taihang Mountain (1990−2020). Chin. J. Eco-Agric. 2022, 30, 1123–1133. [Google Scholar]
- Liu, Y.; Zhang, J.; Zhou, D.M.; Ma, J.; Dang, R.; Ma, J.J.; Zhu, X.Y. Temporal and spatial variation of carbon storage in the Shule River Basin based on InVEST model. Acta Ecol. Sin. 2021, 41, 4052–4065. [Google Scholar]
- Zhu, L.Y.; Hu, K.; Sun, S.; Liu, Y.; Liang, J.X. Research on the Spatiotemporal Variation of Carbon Storage in the Coastal Zone of Liaoning Province Based on InVEST Model. Geoscience 2022, 36, 96–104. [Google Scholar]
- Li, J.P.; Xia, S.X.; Yu, X.B.; Li, S.X.; Xu, C.; Zhao, N.; Wang, S.T. Evaluation of Carbon Storage on Terrestrial Ecosystem in Hebei Province Based on InVEST Model. J. Ecol. Rural. Environ. 2020, 36, 854–861. [Google Scholar]
- Li, M.Y.; Shangguan, Z.T.; Deng, L. Spatial distribution of carbon storages in the terrestrial ecosystems and its influencing factors on the Loess Plateau. Acta Ecol. Sin. 2021, 41, 6786–6799. [Google Scholar]
- Olorunfemi, I.E.; Komolafe, A.A.; Olufayo, A.A. Biomass carbon stocks of different land use management in the forest vegetative zone of Nigeria. Acta Oecologica-Int. J. Ecol. 2019, 95, 45–46. [Google Scholar] [CrossRef]
- Eid, E.M.; Arshad, M.; Alrumman, S.A.; Al-Bakre, D.A.; Ahmed, M.T.; Almahasheer, H.; Keshta, A.E. Evaluation of Soil Organic Carbon Stock in Coastal Sabkhas under Different Vegetation Covers. J. Mar. Sci. Eng. 2022, 10, 1234. [Google Scholar] [CrossRef]
- Buraka, T.; Elias, E.; Lelago, A. Soil organic carbon and its’ stock potential in different land-use types along slope position in Coka watershed, Southern Ethiopia. Heliyon 2022, 8, e10261. [Google Scholar] [CrossRef]
- Cheng, X.F.; Xie, F. Spatial Distribution of Soil Organic Carbon Density in Anhui Province Based on GIS. Sci. Geogr. Sin. 2009, 29, 540–544. [Google Scholar]
- Hamere, Y.; Teshome, S.; Mekuria, A. Carbon Stock Analysis along Slope and Slope Aspect Gradient in Gedo Forest: Implications for Climate Change Mitigation. J. Earth Sci. Clim. Chang. 2015, 6, 305. [Google Scholar]
- Li, T.T.; Ji, H.B.; Sun, Y.Y.; Luo, J.M.; Jiang, Y.B.; Wang, L.X. Advances in Researches on Soil Organic Carbon Storages and Affecting Factors in China. J. Cap. Norm. Univ. 2007, 28, 93–97. [Google Scholar]
- Yang, X.W.; Zhang, L.J.; Qin, Y.C.; Zhang, M.M.; Tian, M.N.; Liu, X.F.; Qiu, C.M. Temporal and Spatial Variation and Driving Factors of Carbon Storage in the Lower Yellow River Since 1995. J. Henan Univ. Nat. Sci. 2022, 52, 20–33. [Google Scholar]
- Du, Z.L.; Su, T.; Ge, J.M.; Wang, X. Towards the Carbon Neutrality: The Role of Carbon Sink and Its Spatial Spillover Effects. Econ. Res. J. 2021, 56, 187–202. [Google Scholar]
- Zhang, Z.G.; Ban, G.H. Temporal and spatial variation of ecosystem carbon storage based on land use change in Luoyang City. Jiangsu Agric. Sci. 2021, 49, 226–230. [Google Scholar]
- Sun, Y.B. Research on Influencing Factors of Soil Carbon in Forest Ecosystem. For. Investig. Des. 2021, 50, 73–75. [Google Scholar]
| Publisher’s Note: MDPI stays neutral with regard to jurisdictional claims in published maps and institutional affiliations. |
© 2022 by the authors. Licensee MDPI, Basel, Switzerland. This article is an open access article distributed under the terms and conditions of the Creative Commons Attribution (CC BY) license (https://creativecommons.org/licenses/by/4.0/).


 Enhance, nonlinear
  Enhance, bi-.