Brief Report

Contact Lens-Based Microchannel Rings for Detecting Ocular Hypertension

1
College of Engineering, Shaqra University, Shaqra 11911, Saudi Arabia
2
Department of Mechanical Engineering, Khalifa University, Abu Dhabi 127788, United Arab Emirates
3
Istituto Italiano di Tecnologia, 16163 Genova, Italy
4
Warwick Manufacturing Group, University of Warwick, Coventry CV7 7AL, UK
5
Jaguar Land Rover Gaydon, Warwick CV35 0BJ, UK
6
School of Engineering, University of Birmingham, Birmingham B15 2TT, UK
*
Authors to whom correspondence should be addressed.
Appl. Sci. 2022, 12(20), 10661; https://doi.org/10.3390/app122010661
Submission received: 11 July 2022 / Revised: 12 October 2022 / Accepted: 14 October 2022 / Published: 21 October 2022
(This article belongs to the Special Issue Recent Advances in Pathogenesis and Management of Eye Diseases)

Abstract

:
Glaucoma is a major cause of irreversible blindness worldwide. The most acknowledged biomarker to diagnose and monitor glaucoma progression is intraocular pressure (IOP). Gold standard techniques for IOP monitoring are invasive, uncomfortable, and require visiting a clinic. In addition, most methods only provide a single snapshot on widely varying parameters. On the other hand, contact lenses have attracted particular interest to be used as continuous monitoring platforms to incorporate sensors, drugs, and more. Here, commercial contact lenses were laser-processed to be capable of detecting IOP variations in the physiological range. Three ring-couples with interspaces of 1.0, 1.5, and 2.0 mm were engraved on three soft contact lenses separately by using a carbon dioxide laser. The IOP/pressure variations induced repeatable changes in the ring-couple interspace which acted as a smartphone-readable pressure sensor. The processed contact lenses may be a potential candidate toward IOP monitoring at point-of-care settings.

1. Introduction

Glaucoma is one of the main causes of permanent blindness, affecting over 65 million people globally. Almost half of the patients suffering from glaucoma do not recognize that they have this disease in the early stages [1,2]. Increasing of intraocular pressure (IOP) is the main risk factor for developing glaucoma. In these cases, IOP exceeds 21 mmHg, and the individual is considered at risk of developing glaucoma disease [3]. Although the IOP fluctuates during the day in glaucoma patients, most of the eye-care clinicians depend mainly on one time or few IOP assessments within regular office hours. Recent studies have indicated that glaucoma patients experience the peak level of IOP at night, during out of office hours [3,4,5]. IOP was found to fluctuate over a 24-h period, recording average and maximum peaks of 4.9 and 12 mmHg, respectively [6,7,8,9,10]. Therefore, continuous detection of IOP is essential to monitor glaucoma progression, which is quite beneficial for prescribing the ideal treatment. In addition, continuous monitoring may assist opticians to evaluate the effectiveness of the medication.
Goldmann applanation tonometry (GAT) has been the most known standard test for measuring intraocular pressure (IOP) since 1940 [11]. GAT measurements are based on law of Imbert-Fick. The law assumes that the eyeball is an ideal sphere and the cornea is thin and elastic [5,12]. GAT works by flattening the cornea over a defined area with a diameter of 3.06 mm and IOP estimation is provided by the applanation pressure. However, the central thickness of the cornea, scleral rigidity, and mechanical properties of the cornea affect GAT performance [13,14]. Currently, the most popular method for 24 h monitoring of IOP fluctuations is the diurnal tension curve (DTC), which records several IOP measurements at different times during working hours or in a sleep laboratory [15,16]. Both GAT and DTC offer limited IOP values and are inconvenient and expensive. Patients are required to be awake during both approaches, which may cause stress issues [17]. In recent years, self-tonometry has been recommended; however, its use is a challenge for elderly patients and does not provide IOP measurements during sleep time [18]. In order to tackle these issues, the Swiss company SENSIMED Triggerfish® has developed a contact lens sensor to continuously detect IOP changes [19]. The sensor is designed based on the idea of that IOP fluctuations induce changes in the cornea’s curvature [20]. The sensor involves a soft silicone contact lens embedded with two pressure gauges, antenna, and a microprocessor. The gauges monitor the modifications in the cornea’s shape to record IOP values. It is a safe and well-tolerated device for 24 h measuring of IOP for healthy and glaucomatous users. Although the device is minimally invasive, safe, and has limited incompliance, it has some side effects such as blurry vision as the contact lens has no vision correction option [19,21]. Other reported side effects include dry eye, eye irritation, and the eye-feels scratchy.
Here, commercial contact lenses were laser-processed to allow for detecting the intraocular pressure (IOP). A ring-couple was engraved on the surface of commercial contact lenses (ACUVUE TrueEye) using a carbon dioxide laser. Fabrication of the rings on the contact lenses was carried out by using a simple, easy, rapid, cost-effective, and applicable mass-production method. The interspace between the ring-couples changed upon IOP fluctuations and was detected by a smartphone camera.

2. Materials and Methods

Daily disposal contact lenses (ACUVUE TrueEye) were purchased from Johnson & Johnson, Jacksonville, FL, USA. All lenses have a base curve of 9.0 mm and a diameter of 14.2 mm. The lenses were taken from their original packaging and stored in 46% H2O in buffered saline with methyl ether cellulose. Micro-channel rings were engraved on contact lens surfaces using a Rayject CO2 laser (Mississauga, ON, Canada). The laser beam had a wavelength of 10.6 µm, a variable output power with a maximum of 80 W, and a diameter of 20 µm. The ablation process was carried out on the outer edges of the lenses to avoid vision obstruction during wear. The distance between the contact lens and the outlet of the laser beam was kept constant at 50 mm throughout all processes. Other parameters such as laser power and the scanning speed were validated and optimised using Rayjet software to avoid damaging the contact lenses. A schematic illustrating the laser system and the fabrication process is shown in Figure 1A. Two circular channels (rings) were created on the surface of the contact lens at different laser operation settings (power and scanning speed) to identify the optimum conditions. The geometry of the micro-channels and the processed contact lens are displayed in Figure 1B,C.
An optical microscopic (ZEISS, Jena, Germany, Zen software: Saint-Louis, MO, USA) was used to image the modified surface of the laser-treated lenses. The performance of the contact lens was determined by measuring the change in the interspace for the ring-couple upon exposing the lens to different surface curvatures, corresponding to ocular pressure variations in the range 12–22 mmHg. The measurements were performed using an automatic calliper and a microscope (Figure 2A). The interspace between the laser-engraved rings was measured in flat and curved conditions for both the inner side and outer side of the lenses. Firstly, measurements were performed when the lens was fixed on a flat plastic sheet. Secondly, measurements were recorded when a force was applied on the sides of the plastic sheet to bend the lens, and the distance between the top of the lens and its bottom edge was 7.7 mm, which is the typical cornea radius of curvature. Furthermore, measurements were taken at a curvature of 15 mm, which represents the extreme risk of the cornea for developing glaucoma [2]. The distance between the two rings was measured by using the microscope’s built-in software (Zen Software: Saint-Louis, MO, USA).
Another test was carried out to check the performance of the lenses. The contact lenses were fixed directly on a balloon surface to examine the effect of increasing the balloon’s internal pressure and the balloon surface curvature on the interspace of the ring-couples, which was measured by a calliper and a smartphone (Figure 2B). The photos of the tested lenses were captured by a smartphone camera, and then ImageJ software was used to analyse the images measuring the interspace changes. The usage of a balloon assisted in simulating the change of the curvature for the eye cornea resulting from increasing of the IOP. The curvature of the balloon surface changed with the internal pressure of the balloon. As a result, the interspace between the engraved rings on the contact lens fixed on the balloon shifted. The contact lenses were examined at two conditions; at pressures of 12 mmHg and 22 mmHg, which represent the normal and the risk levels of intraocular pressure toward developing glaucoma [2].

3. Results and Discussion

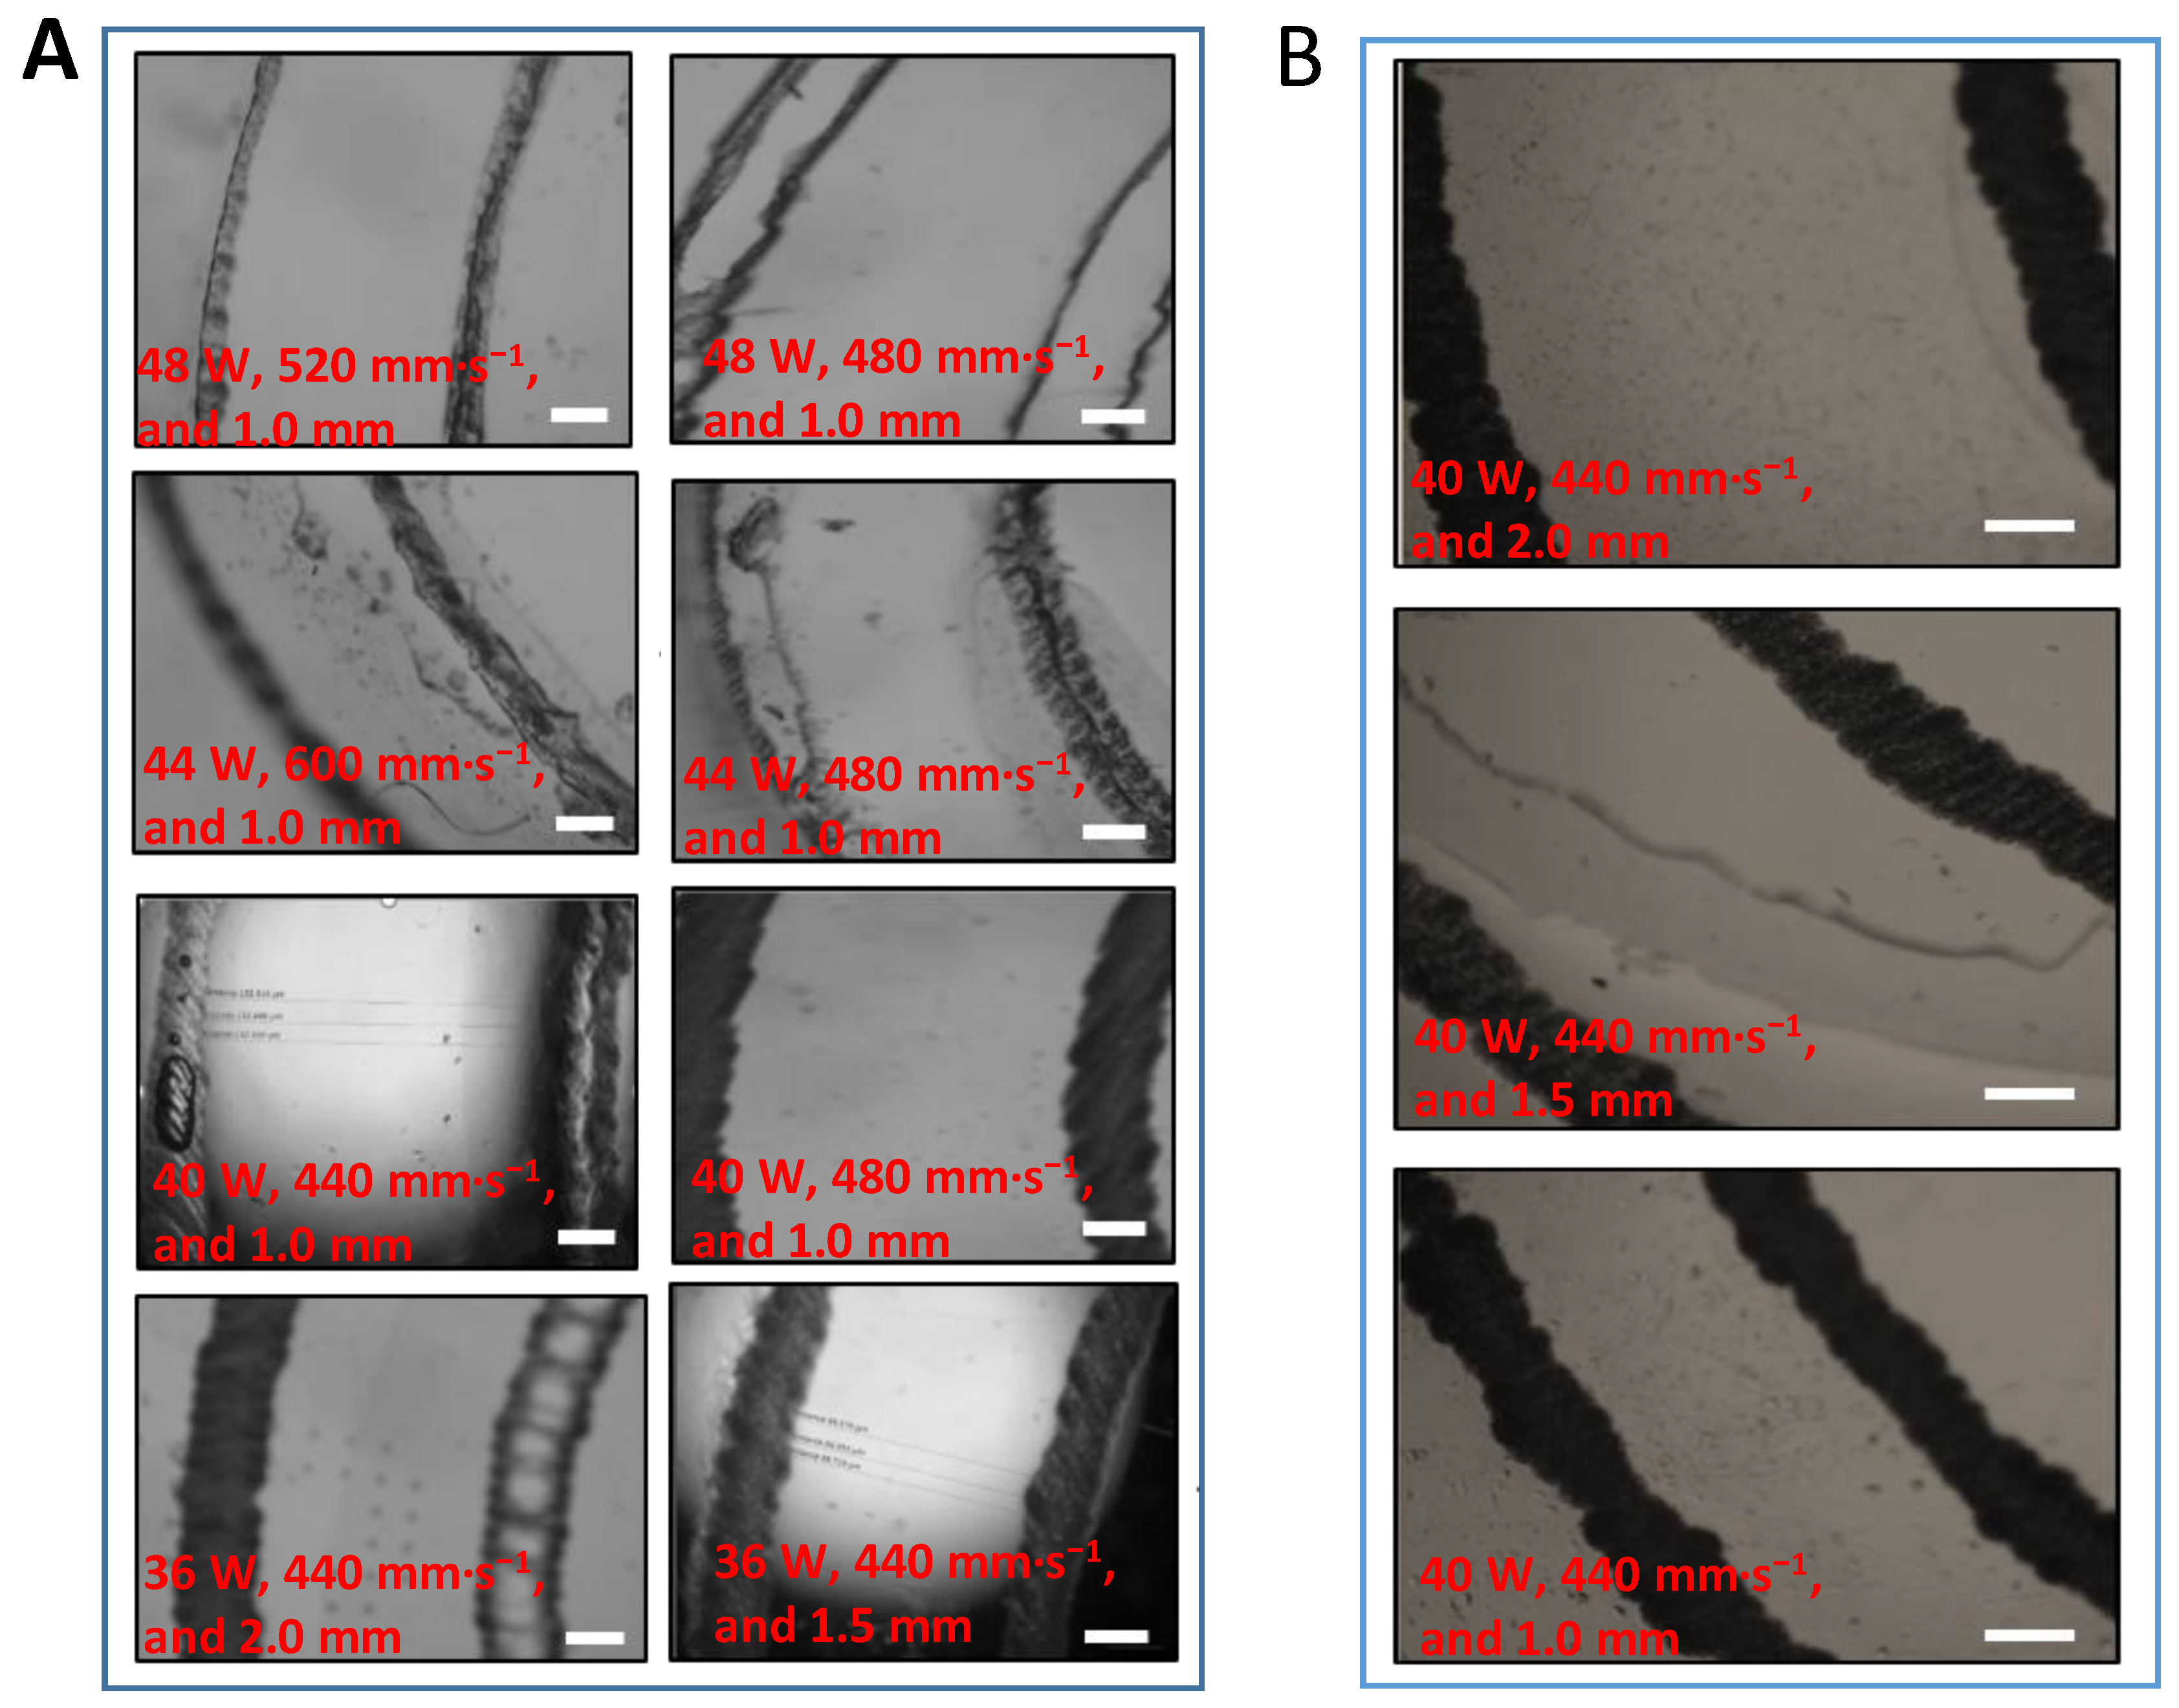
The CO2 laser parameters were optimized to yield microchannels with a depth of 20 µm on surfaces of soft contact lenses. The laser power swung from 36 up to 48 W while the scanning speed was changed in the range of 440–520 mm·s−1. The distance between the laser outlet and the contact lens was kept fixed at 50 mm. Table 1 summarizes the laser system operation conditions and the geometry of the fabricated ring-couples on each contact lens.
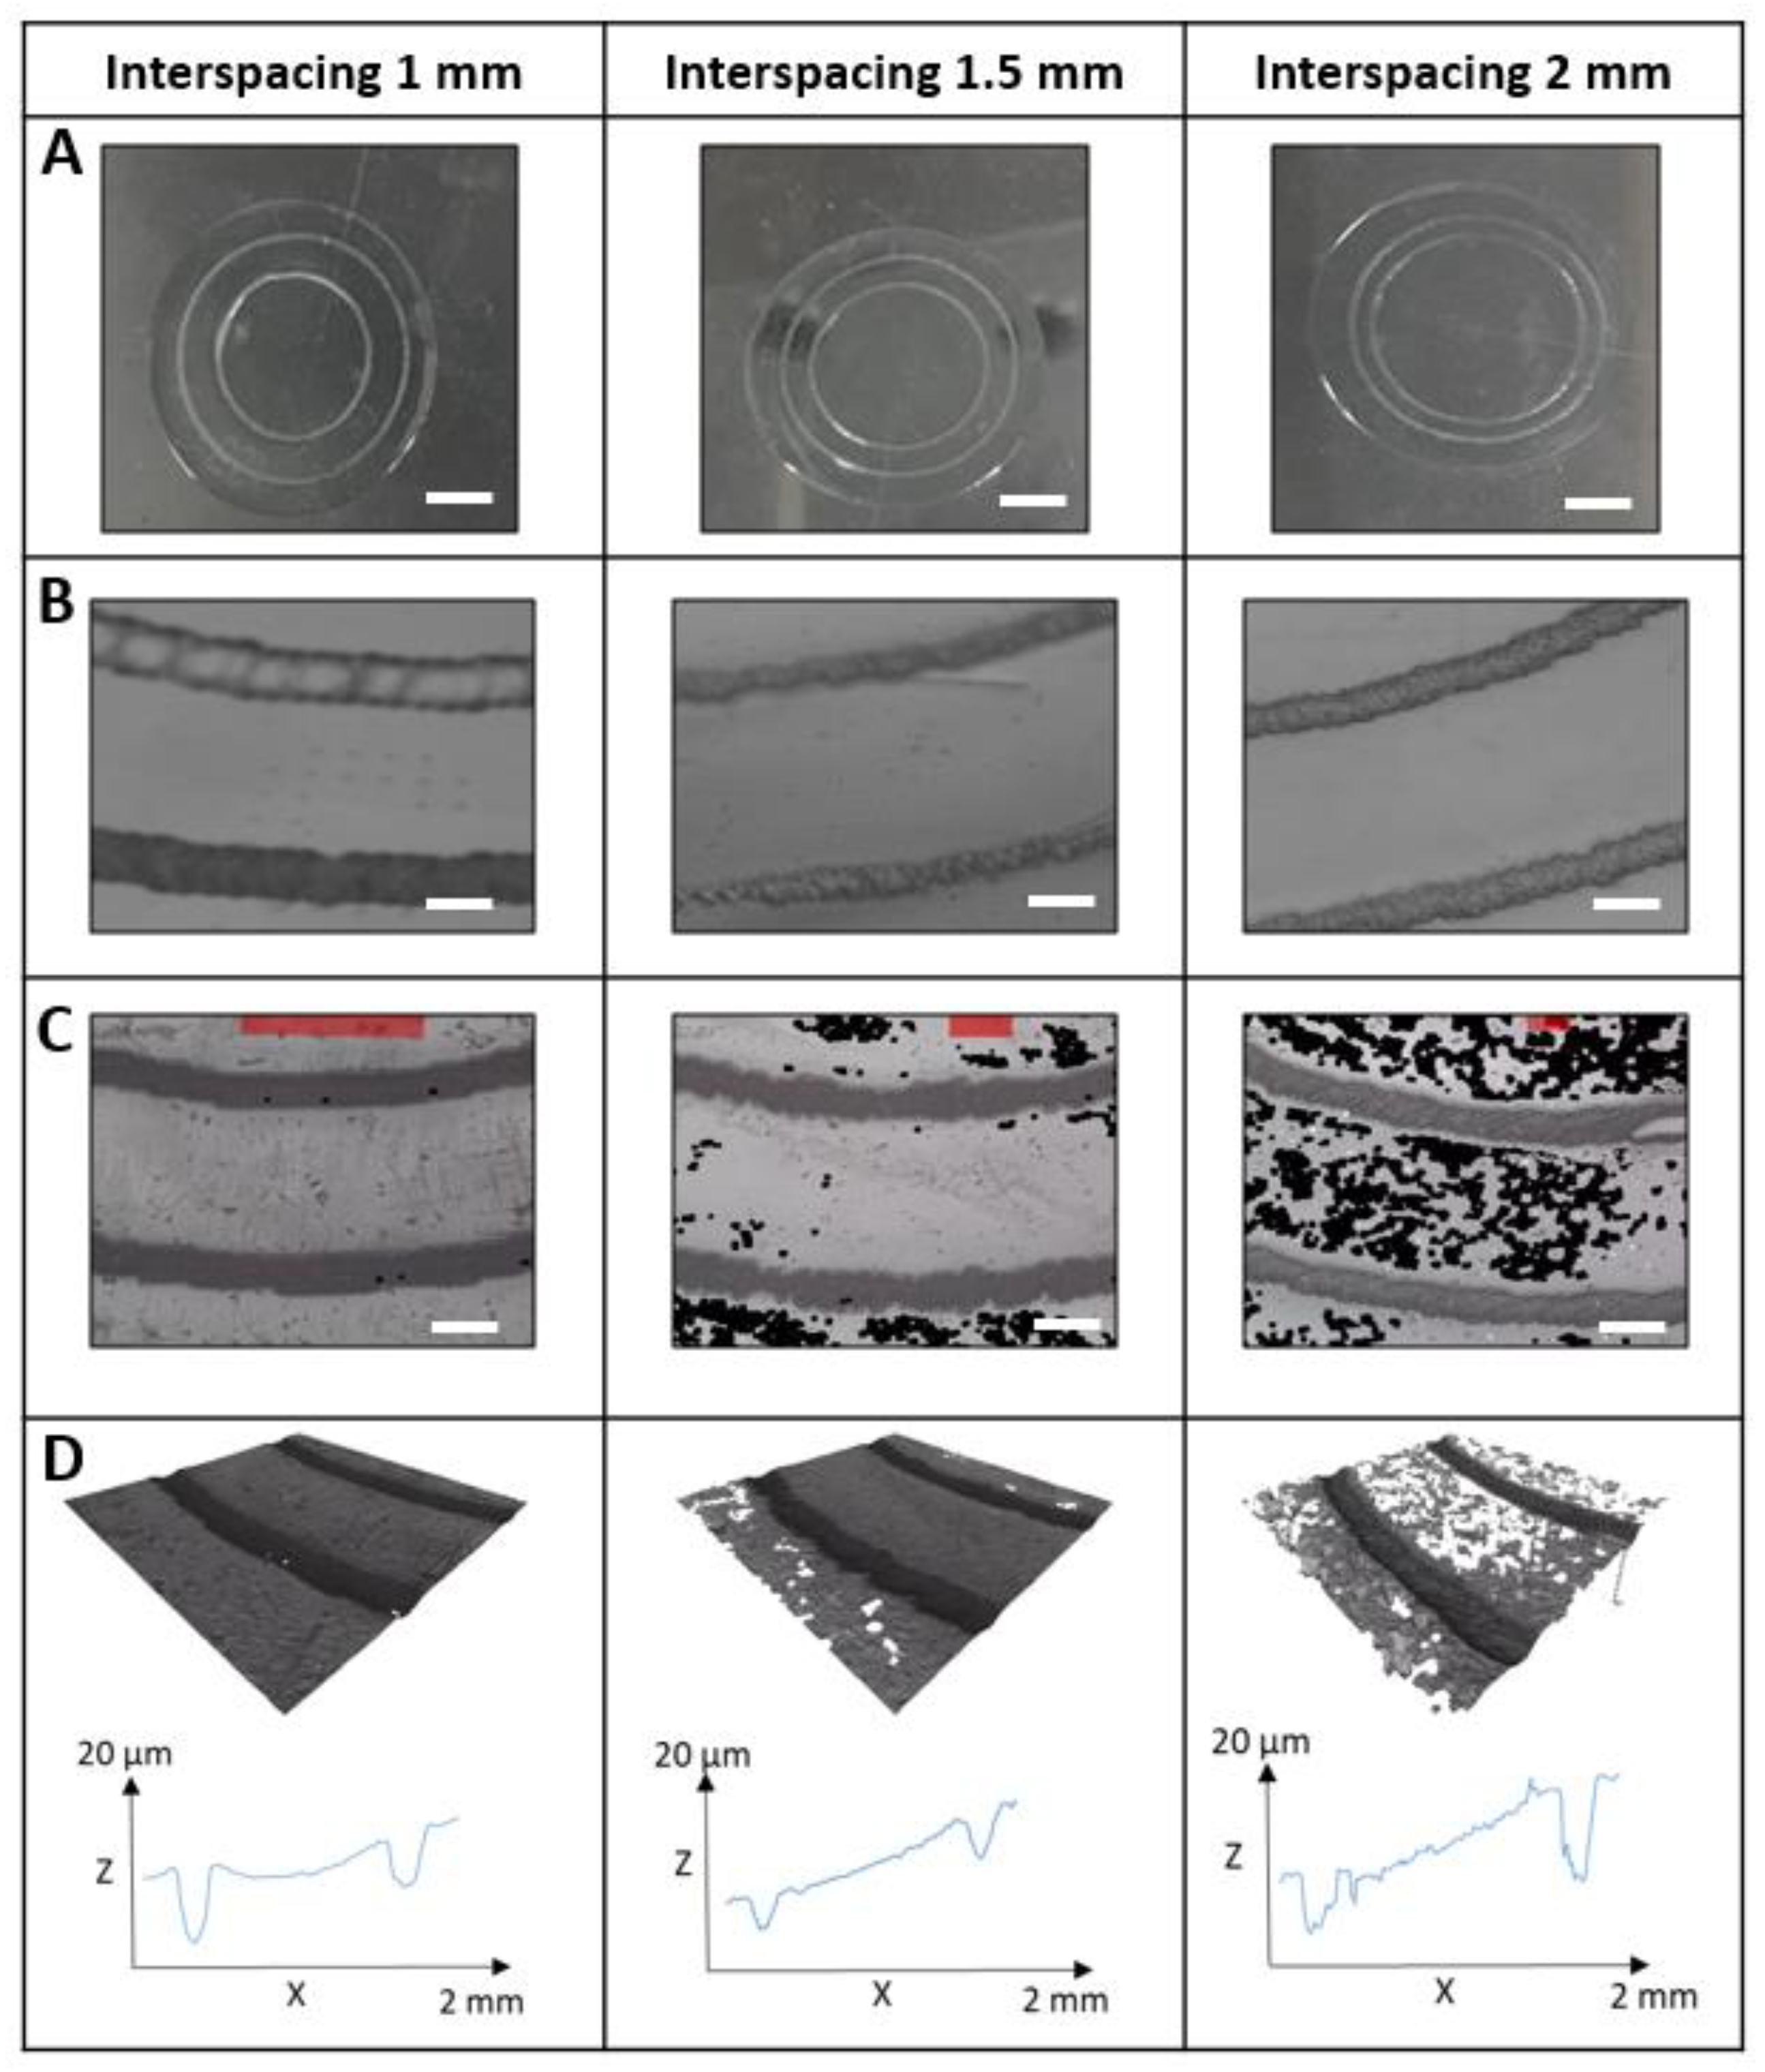
Microscope images of all laser-processed contact lenses are presented in Figure 3. The best results were achieved at the conditions of laser power 40 W and scanning speed 440 mm·s−1. Higher applied powers led cracks in the lens’s surface, and lower input powers could not engrave convenient channels. The quality of the produced micro-channels was examined by the optical microscope. Three ring-couples with interspaces of 1, 1.5, and 2.0 mm, were engraved where the inner rings have diameters of 10, 9, and 8 mm, respectively, and the outer rings have diameters of 12 mm (Figure 4). An optical microscope was used to analyse the channels’ depth obtained at optimum operation conditions of the laser system.
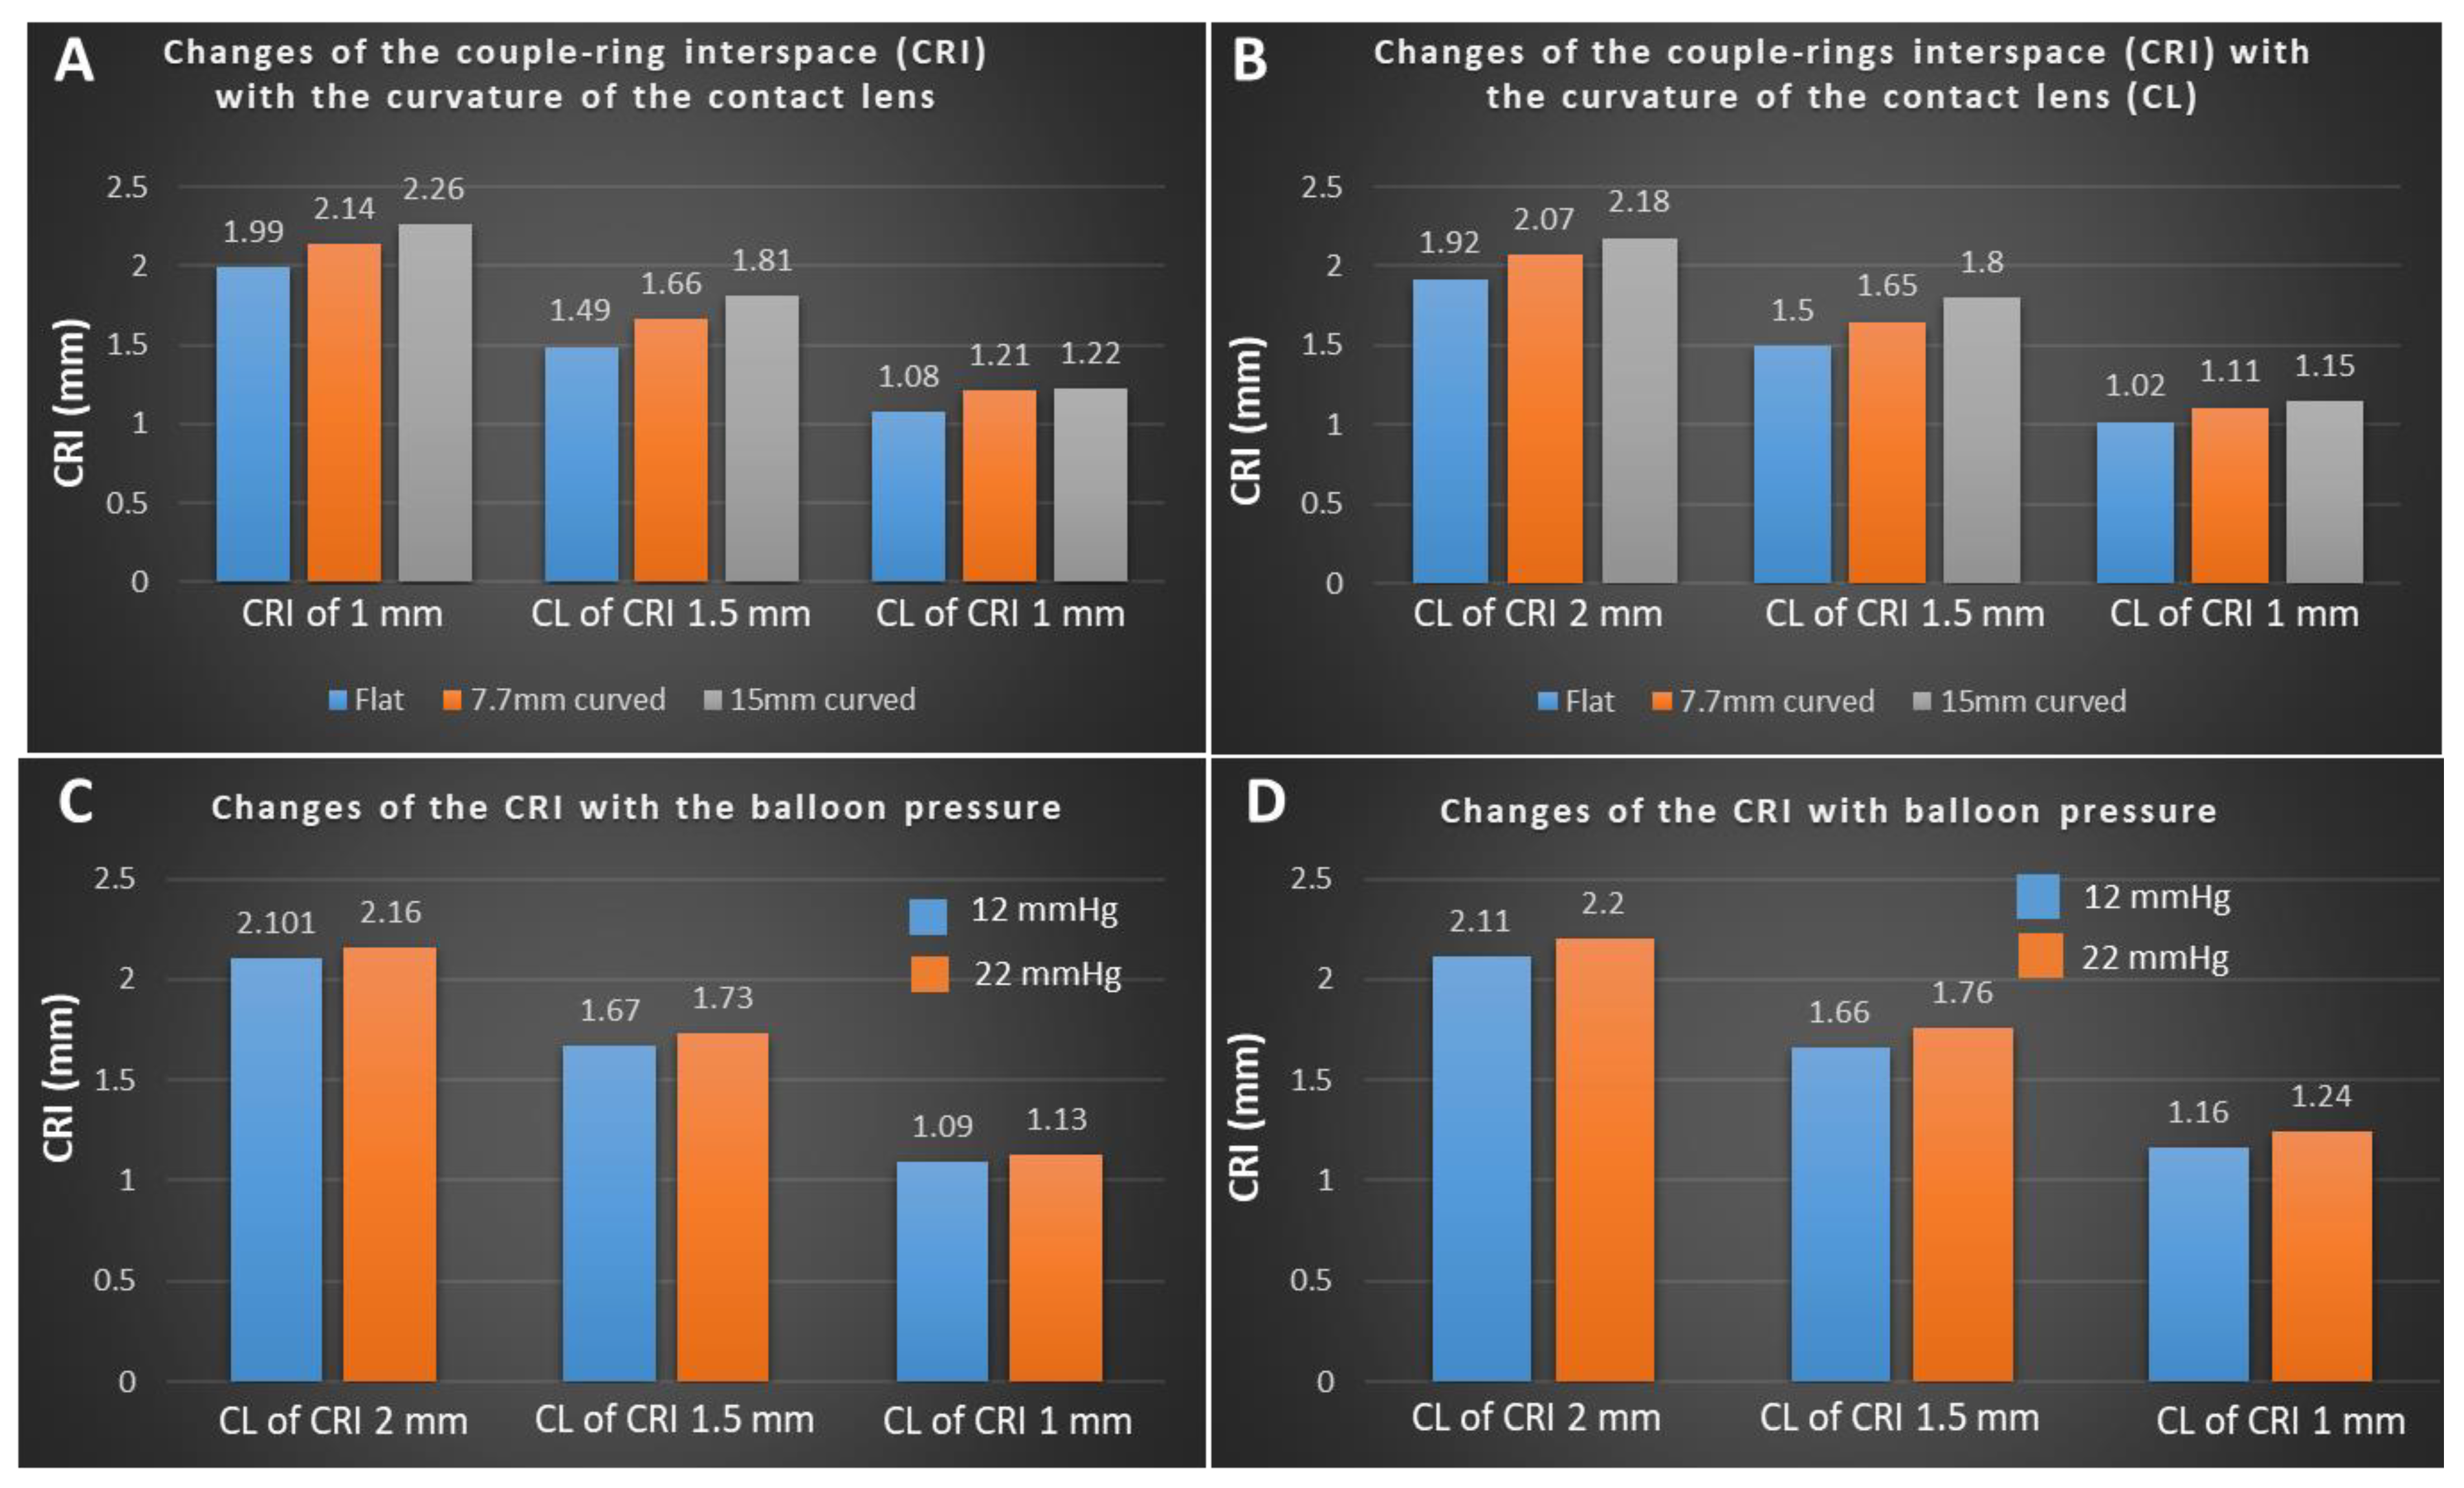
To examine the performance of the processed contact lenses in determining the surface curvature, the lenses were fixed on plastic flexible sheets and the interspaces between the ring-couples were measured under the microscope (Figure 5A,B). The interspace measurements were repeated while the lens was curved at different radii of curvatures. Changing the curvature of the lens affected the interspacing between the engraved rings. The interspaces of the ring-couples in all examined lenses showed an increase with changing the lens conditions from flat to curved. Changing the conditions of the lens surface from flat to curved with a radius of curvature 7.7 mm led to increasing the interspace between the channels by up to ≈12%. For the lens having the ring-couple of interspacing 1.5 mm, increasing the radius of curvature to 15 mm resulted in an increase in the interspace by ≈20% (Figure 5A,B). The interspace readings were recorded by examining either the engraved surface of the contact lens or the intact surface. Figure 5B illustrates that the readings taken from the intact lens’s surface are relatively similar to the results taken from the laser-treated side. The interspacing increased up to ≈10% and ≈20% at radii of curvatures 7.7 mm and 15 mm, respectively.
The performances of the laser-treated lenses were confirmed by using the balloon method. The lens was fixed on a balloon surface and the interspace between the ring-couple was measured using a smartphone. This test was carried out at the normal IOP value, 12 mmHg, and in the glaucoma condition, 22 mmHg. It was found that the interspacing distance increases with pressure (Figure 5C,D). The interspace distance increased up to 4%, 10%, and 6% for the contact lenses having the ring-couples of interspacing distances 1, 1.5, and 2.0 mm, respectively, due to increasing the balloon internal pressure.
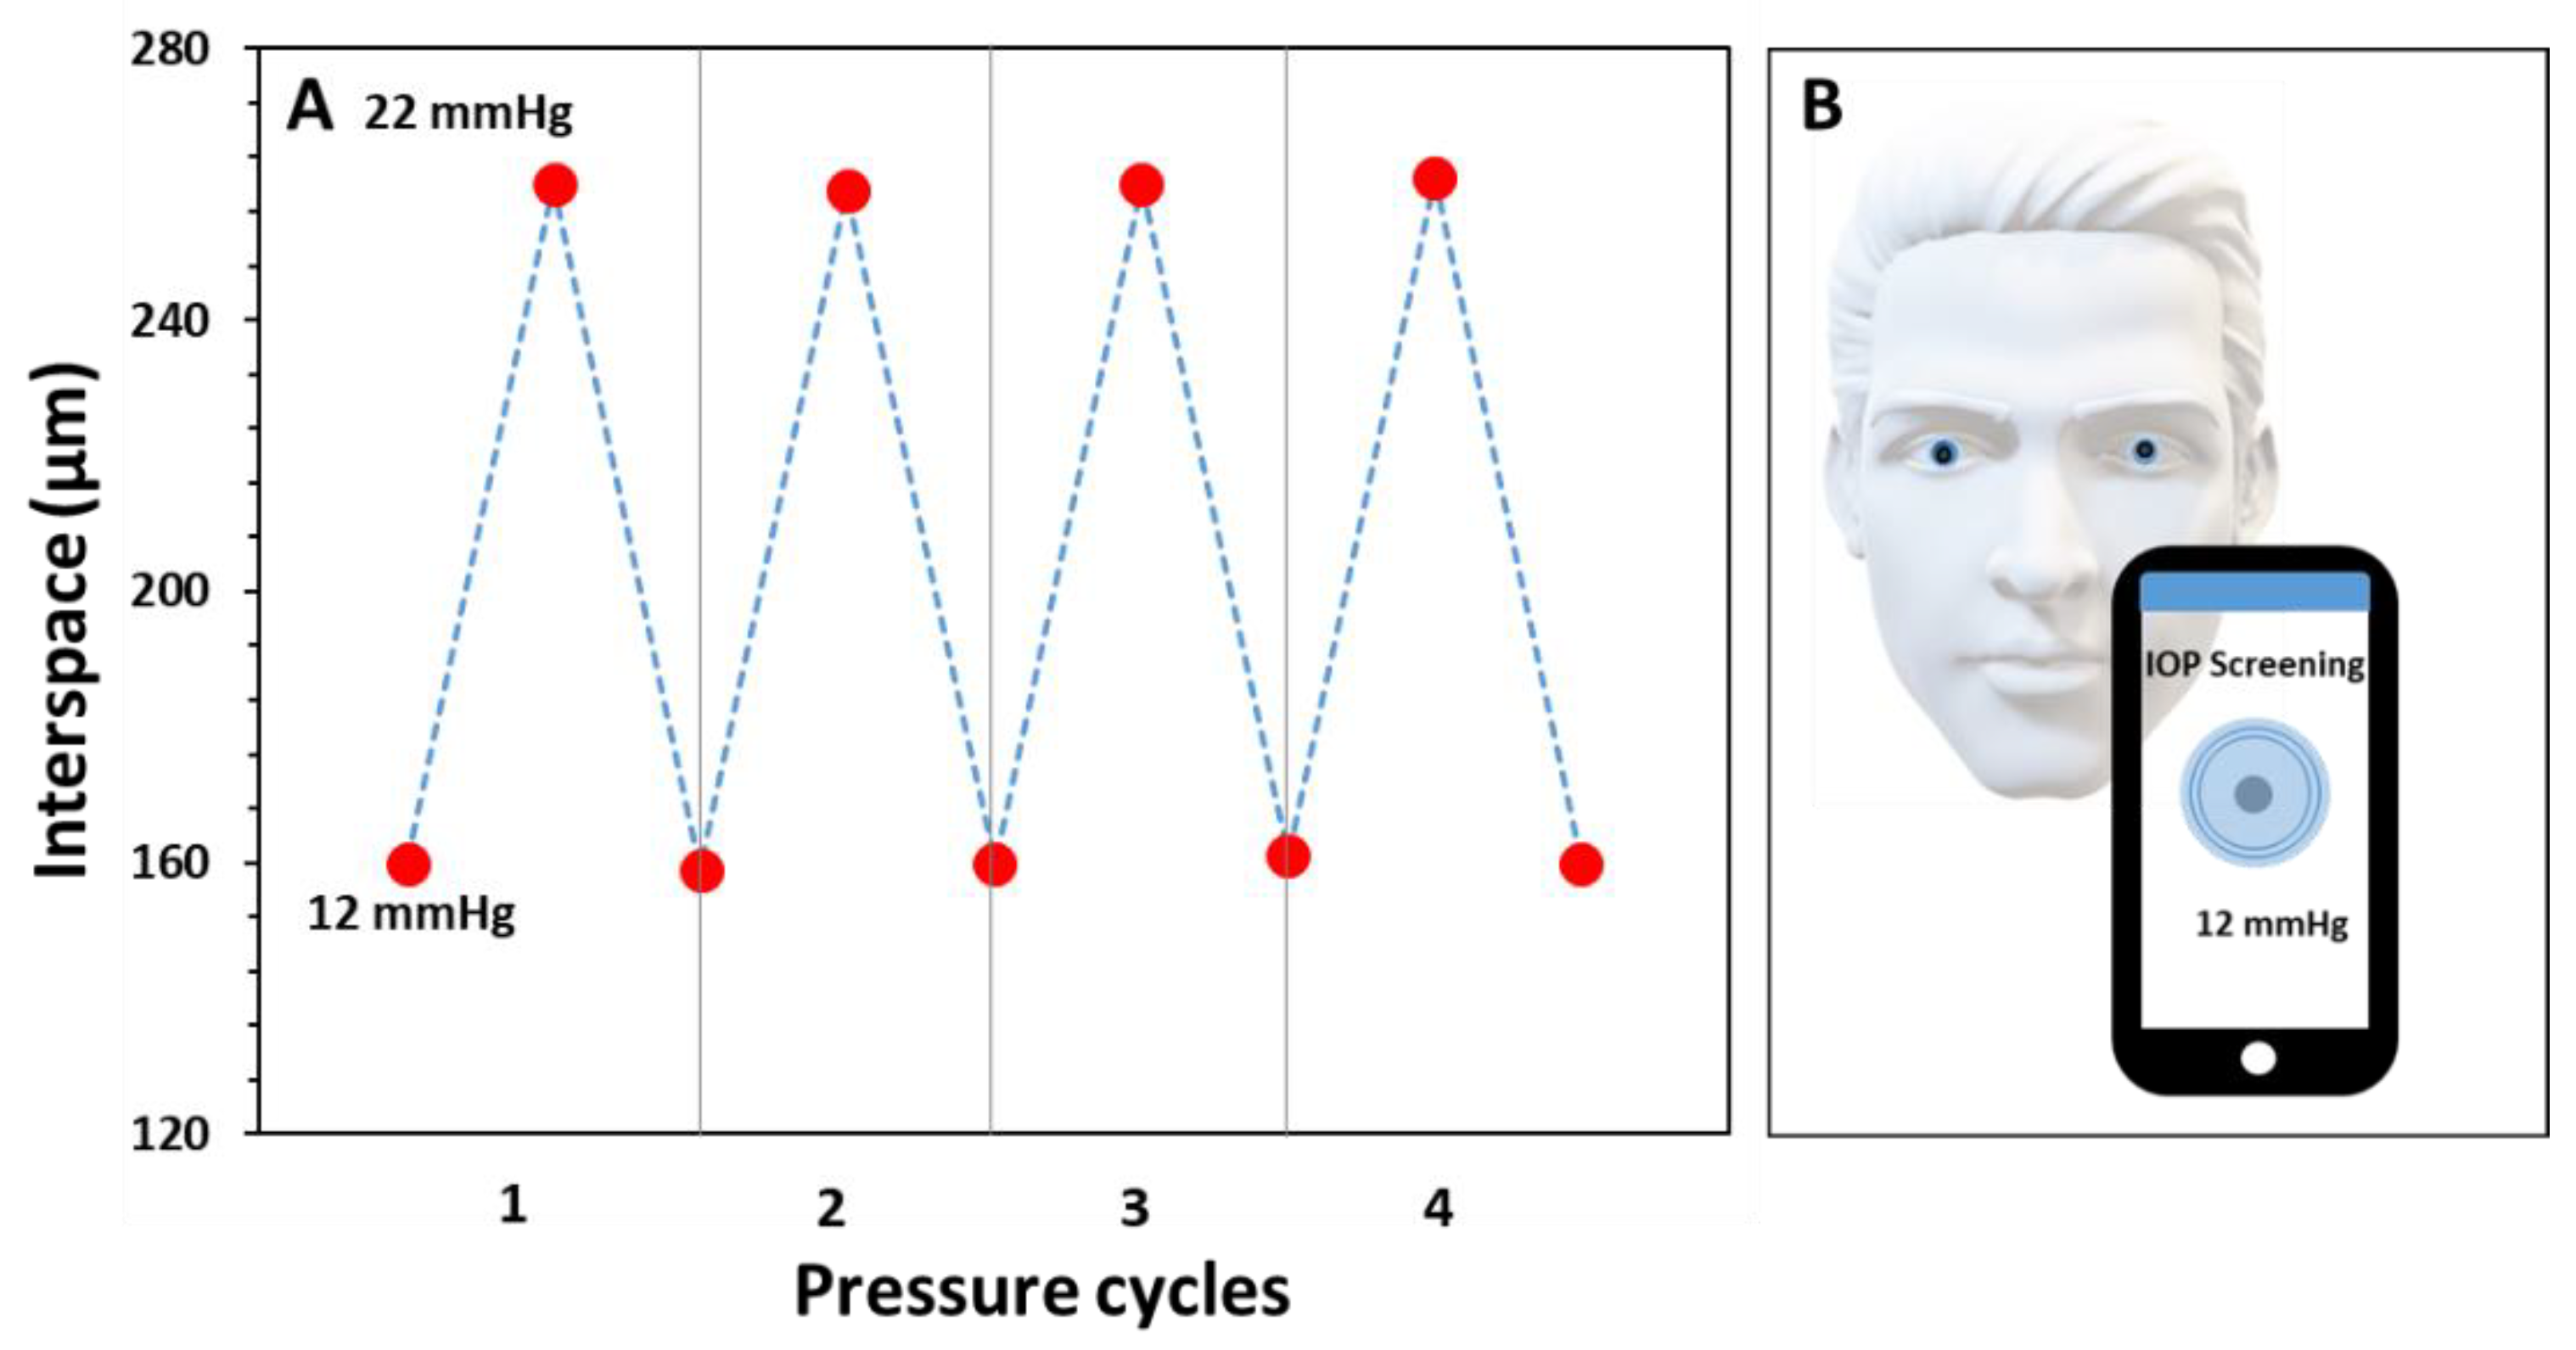
To investigate the repeatability and signal drift for the developed sensor, its response for low and high pressure was recorded for four cycles (Figure 6A). The contact was attached to a balloon with internal pressures of 12 mmHg and 22 mmHg, and its interspace changes were measured. The interspace increased with pressure from 160 ± 1 μm to 260 ± 1 μm for each cycle without hysteresis. Reading the developed contact lenses could be practically achieved by a smartphone through exploiting its camera and an installed software to analyse the captured photo (Figure 6B).
Limitations of the developed IOP monitoring system could be represented in the need for the individuals to capture a photo themselves, so the software can analyse and provide the IOP level. Futhermore, the patient has to wake up at night to read his/her IOP level, which could be considered as a kind of stress. In addition, the system provides intermittent readings for IOP, and a continuous IOP reading system would be preferable. Finally, it is worth noting that the systolic and diastolic blood pressures are correlated with the IOP. Fortunately, their influence on IOP is not huge as IOP increases by approximately 0.21 mmHg and 0.43 mmHg when systolic and diastolic pressures increase by 10 mmHg, respectively.

4. Conclusions

We have developed a cost-effective and minimally invasive method toward discriminating between healthy and unhealthy intraocular pressure values. Commercial contact lenses were laser-treated to obtain a concentric pair of rings on their surfaces, in the form of microchannels with depths of 20 µm. The fabricated lenses showed the ability to change the interspacing distance with changing of their curvature. The fabricated rings demonstrated a good response to the changes of the surface curvature levels as the interspace between the ring-couple changed up to 20% upon increasing the pressure from 12 to 22 mmHg. The developed contact lenses are reusable and it could be used as a continuous non-invasive technique to detect unhealthy IOP values in glaucoma patients. Smartphones can be used as readers to capture the interspacing changes, providing the opportunity to obtain rapid results at the point-of-care.

Author Contributions

Data curation, Y.A.; Funding acquisition, H.B.; Investigation, H.D.; Methodology, M.C.; Resources, K.E.; Supervision, M.C.; Visualization, H.B.; Writing—original draft, Y.A. and H.D.; Writing—review & editing, M.E., R.M. and K.E. All authors have read and agreed to the published version of the manuscript.

Funding

This research was funded by KU-KAIST Joint Research Center (8474000220-KKJRC-2019-Health1) and Sandooq Al Watan LLC jointly with Aldar properties (SWARD-F19-008).

Institutional Review Board Statement

Not applicable.

Informed Consent Statement

Not applicable.

Data Availability Statement

The data presented in this study are available on request from the corresponding author.

Conflicts of Interest

The authors declare no conflict of interest.

References

  1. Liu, J.; Roberts, C.J. Influence of corneal biomechanical properties on intraocular pressure measurement: Quantitative analysis. J. Cataract. Refract. Surg. 2005, 31, 146–155. [Google Scholar] [CrossRef] [PubMed]
  2. Moreddu, R.; Mahmoodi, N.; Kassanos, P.; Vigolo, D.; Mendes, P.M.; Yetisen, A.K. Stretchable Nanostructures as Optomechanical Strain Sensors for Ophthalmic Applications. ACS Appl. Polym. Mater. 2021, 3, 5416–5424. [Google Scholar] [CrossRef]
  3. Realini, T.; Weinreb, R.N.; Wisniewski, S. Short-term repeatability of diurnal intraocular pressure patterns in glaucomatous individuals. Ophthalmology 2011, 118, 47–51. [Google Scholar] [CrossRef] [PubMed]
  4. Barkana, Y.; Anis, S.; Liebmann, J.; Tello, C.; Ritch, R. Clinical utility of intraocular pressure monitoring outside of normal office hours in patients with glaucoma. Arch. Ophthalmol. 2006, 124, 793–797. [Google Scholar] [CrossRef] [Green Version]
  5. Mansouri, K.; Medeiros, F.A.; Tafreshi, A.; Weinreb, R.N. Continuous 24-hour monitoring of intraocular pressure patterns with a contact lens sensor: Safety, tolerability, and reproducibility in patients with glaucoma. Arch. Ophthalmol. 2012, 130, 1534–1539. [Google Scholar] [CrossRef] [PubMed] [Green Version]
  6. Liu, J.H.; Zhang, X.; Kripke, D.F.; Weinreb, R.N. Twenty-four-hour intraocular pressure pattern associated with early glaucomatous changes. Investig. Ophthalmol. Vis. Sci. 2003, 44, 1586–1590. [Google Scholar] [CrossRef] [Green Version]
  7. Kida, T.; Liu, J.H.; Weinreb, R.N. Effect of 24-hour corneal biomechanical changes on intraocular pressure measurement. Investig. Ophthalmol. Vis. Sci. 2006, 47, 4422–4426. [Google Scholar] [CrossRef] [Green Version]
  8. Liu, J.H.; Weinreb, R.N. Monitoring intraocular pressure for 24 h. Br. J. Ophthalmol. 2011, 95, 599–600. [Google Scholar] [CrossRef]
  9. Hughes, E.; Spry, P.; Diamond, J. 24-hour monitoring of intraocular pressure in glaucoma management: A retrospective review. J. Glaucoma 2003, 12, 232–236. [Google Scholar] [CrossRef]
  10. Renard, E.; Palombi, K.; Gronfier, C.; Pepin, J.L.; Noel, C.; Chiquet, C.; Romanet, J.P. Twenty-four hour (Nyctohemeral) rhythm of intraocular pressure and ocular perfusion pressure in normal-tension glaucoma. Investig. Ophthalmol. Vis. Sci. 2010, 51, 882–889. [Google Scholar] [CrossRef]
  11. Lee, Y.H.; Kim, C.S.; Hong, S.P. Rate of visual field progression in primary open-angle glaucoma and primary angle-closure glaucoma. Korean J. Ophthalmol. 2004, 18, 106–115. [Google Scholar] [CrossRef] [PubMed] [Green Version]
  12. Ehlers, N.; Bramsen, T.; Sperling, S. Applanation tonometry and central corneal thickness. Acta Ophthalmol. 1975, 53, 34–43. [Google Scholar] [CrossRef]
  13. Leonardi, M.; Leuenberger, P.; Bertrand, D.; Bertsch, A.; Renaud, P. First steps toward noninvasive intraocular pressure monitoring with a sensing contact lens. Investig. Ophthalmol. Vis. Sci. 2004, 45, 3113–3117. [Google Scholar] [CrossRef] [PubMed]
  14. Lin, M.C.; Soliman, G.N.; Lim, V.A.; Giese, M.L.; Wofford, L.E.; Marmo, C.; Radke, C.; Polse, K.A. Scalloped channels enhance tear mixing under hydrogel contact lenses. Optom. Vis. Sci. 2006, 83, 874–878. [Google Scholar] [CrossRef] [PubMed] [Green Version]
  15. Creech, J.L.; Chauhan, A.; Radke, C.J. Dispersive Mixing in the Posterior Tear Film Under a Soft Contact Lens. Ind. Eng. Chem. Res. 2001, 40, 3015–3026. [Google Scholar] [CrossRef]
  16. Monticelli, M.V.; Chauhan, A.; Radke, C.J. The effect of water hydraulic permeability on the settling of a soft contact lens on the eye. Curr. Eye Res. 2005, 30, 329–336. [Google Scholar] [CrossRef]
  17. Weinreb, R.N.; Liu, J.H. Nocturnal rhythms of intraocular pressure. Arch. Ophthalmol. 2006, 124, 269–270. [Google Scholar] [CrossRef]
  18. Liu, J.H.; Medeiros, F.A.; Slight, J.R.; Weinreb, R.N. Diurnal and nocturnal effects of brimonidine monotherapy on intraocular pressure. Ophthalmology 2010, 117, 2075–2079. [Google Scholar] [CrossRef]
  19. Dunbar, G.E.; Shen, B.Y.; Aref, A.A. The Sensimed Triggerfish contact lens sensor: Efficacy, safety, and patient perspectives. Clin. Ophthalmol. 2017, 11, 875–882. [Google Scholar] [CrossRef] [Green Version]
  20. Liu, J.H.; Mansouri, K.; Weinreb, R.N. Estimation of 24-Hour Intraocular Pressure Peak Timing and Variation Using a Contact Lens Sensor. PLoS ONE 2015, 10, e0129529. [Google Scholar] [CrossRef]
  21. Chauhan, A.; Radke, C.J. Settling and deformation of a thin elastic shell on a thin fluid layer lying on a solid surface. J. Colloid Interface Sci. 2002, 245, 187–197. [Google Scholar] [CrossRef] [PubMed]
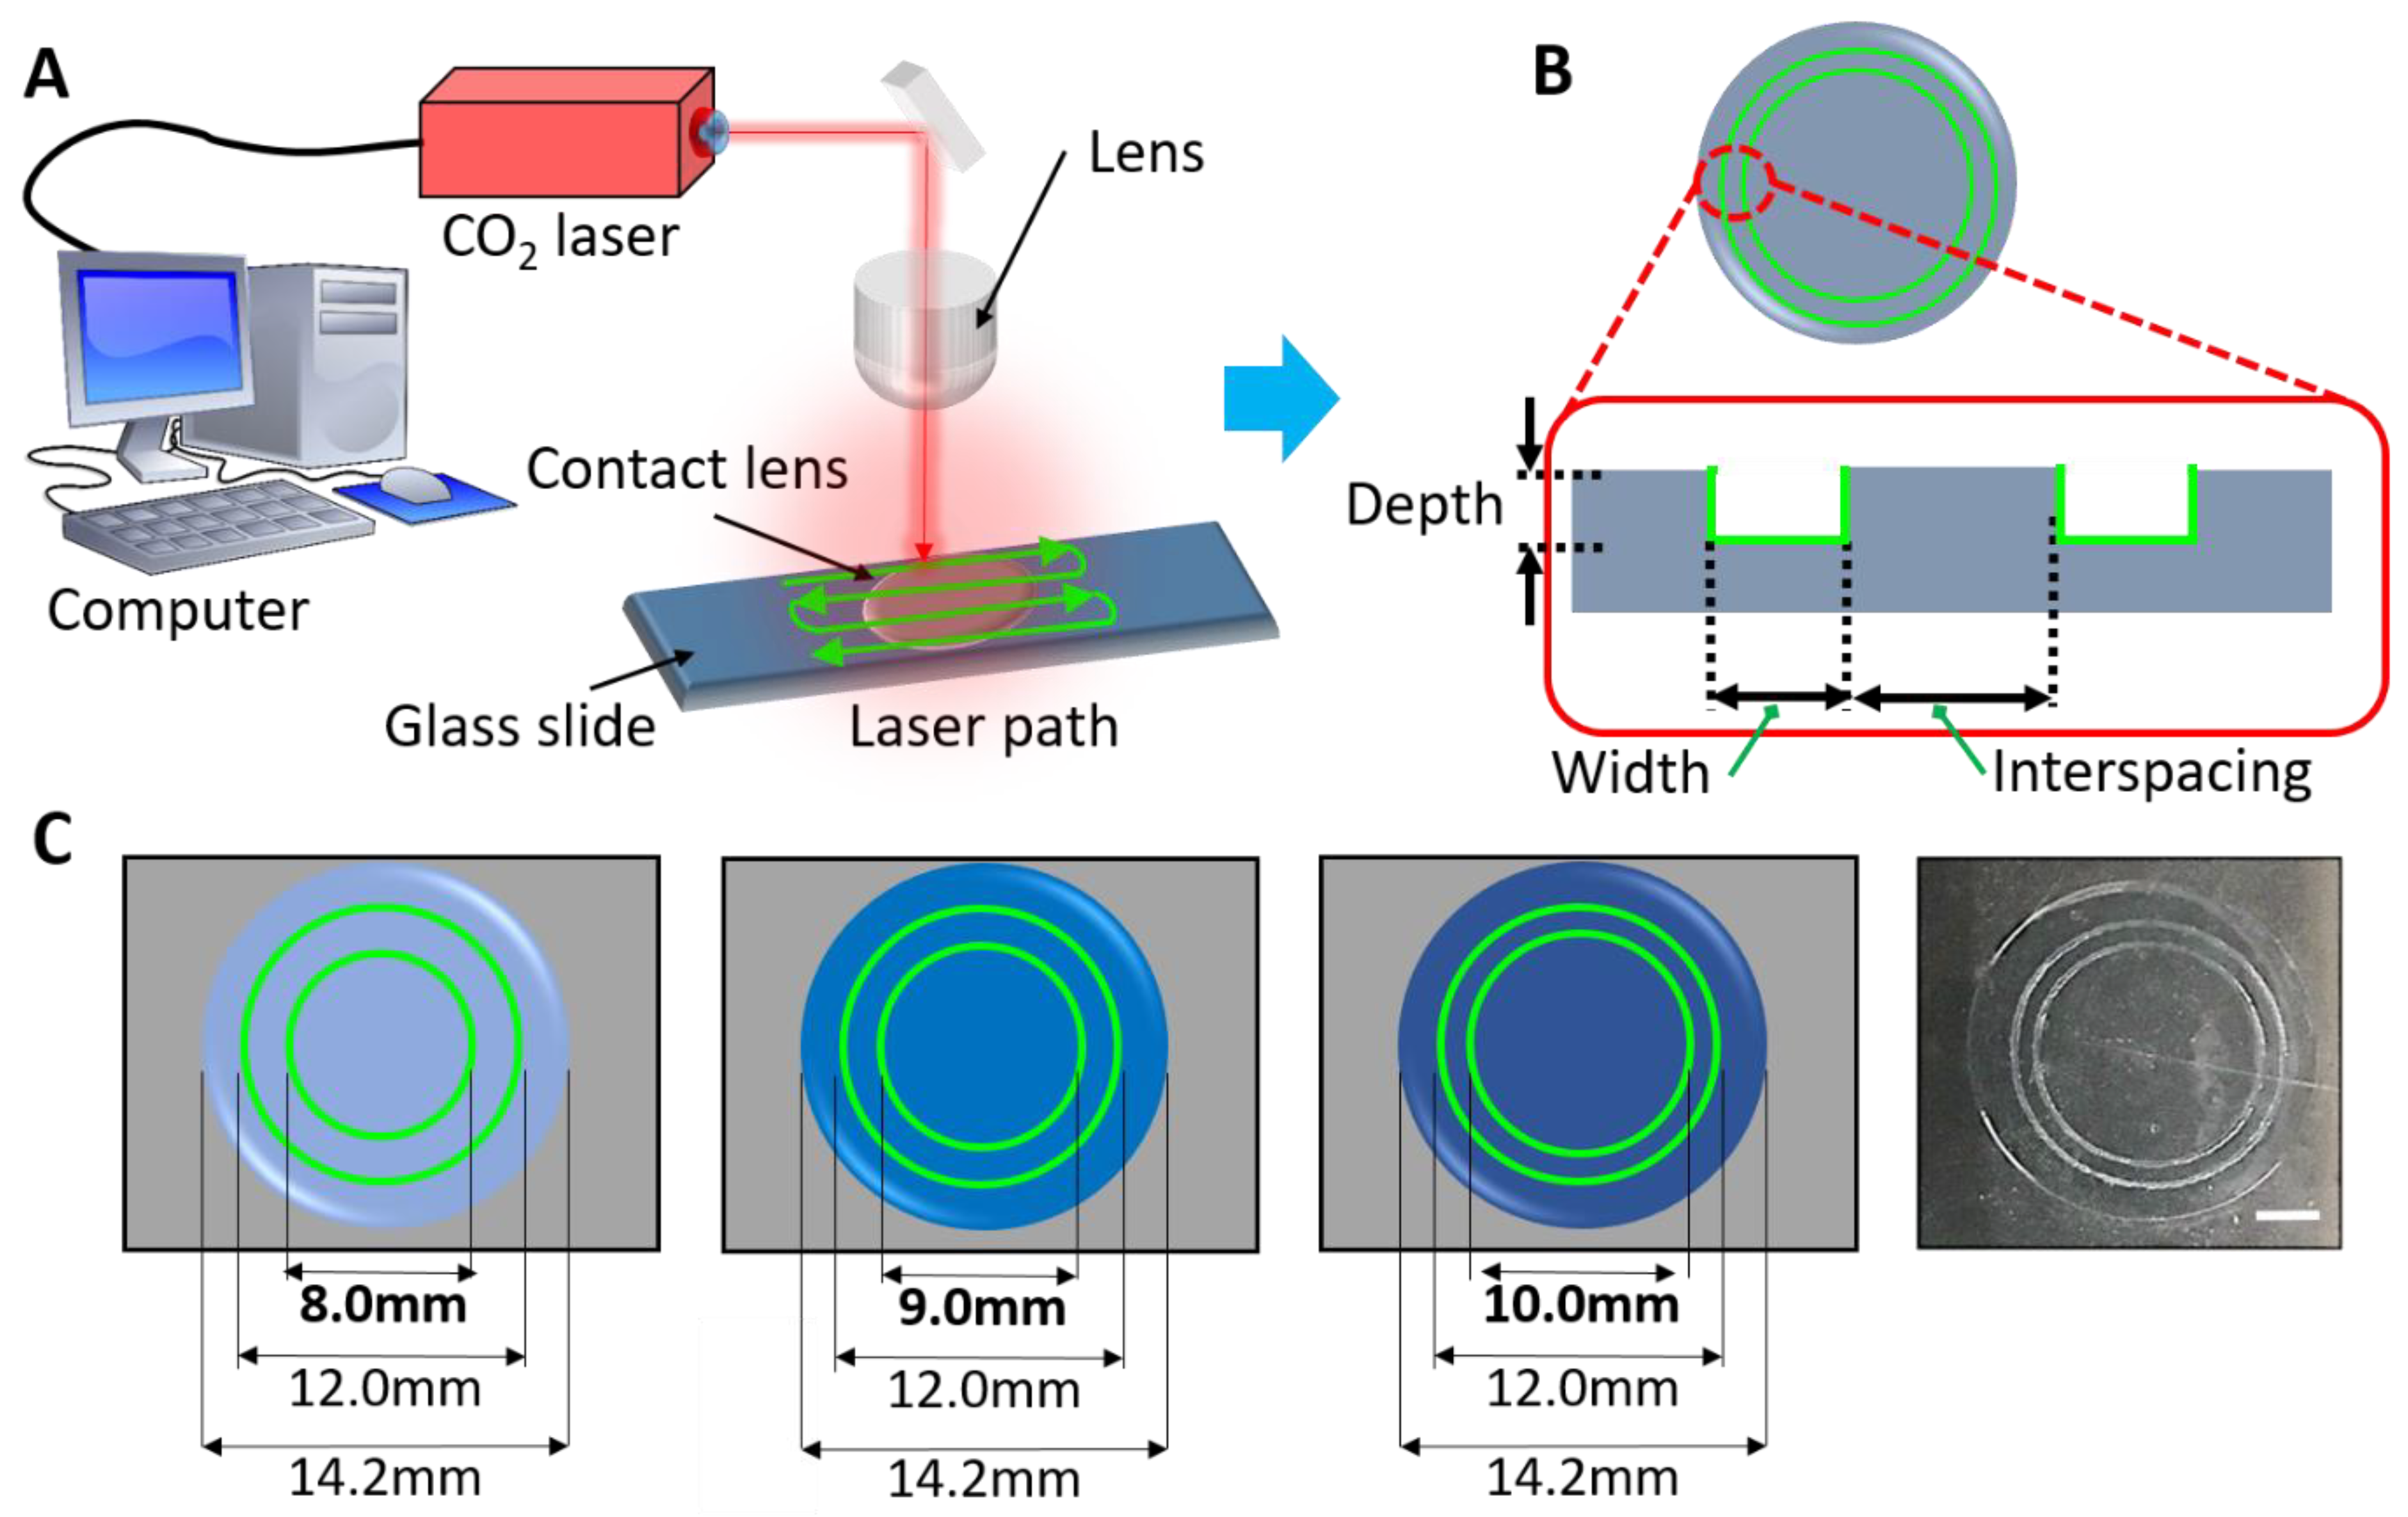
Figure 1. Fabrication of concentric rings on contact lenses. (A) Schematic of the laser setup; (B) Illustration of the top and side views of the contact lens after the laser-treatment; (C) Geometrical features of the couple-rings with an interspace of 2 mm (for the couple-ring of diameters 8 and 12 mm), 1.5 mm (for the couple-ring of diameters 9 and 12 mm), and 1 mm (for the couple-ring of diameters 10 and 12 mm), and a photograph of the processed contact lens, scale bar 3 mm.
Applsci 12 10661 g001
Figure 2. Experimental setup to apply different curvatures to the contact lens and record the corresponding variations in the ring interspace. (A) Microscope stages: flat, curved at 7.7 mm, curved at 15 mm; (B) the balloon method: illustration for effect of the internal pressure on the surface curvature of the balloon.
Applsci 12 10661 g002
Figure 3. Images of the laser-treated contact lenses captured by an optical microscope. (A) images of all the laser-treated lenses at different laser operation conditions; (B) images of the contact lenses having different spacing gaps between the microchannel and were operated under the same conditions.
Applsci 12 10661 g003
Figure 4. Pictures of the laser-treated contact lenses. (A) Photographs of the CO2 laser-engraved rings on the lenses produced at laser power of 40 W and scanning speed of 440 mm·s−1, scale bar 3 mm; (B,C) Microscopic images of the laser-modified contact lenses; (D) 3D microscopic images of the channels and related surface profiles.
Applsci 12 10661 g004
Figure 5. The response of the three processed contact lenses to the changes in their surfaces curvatures. (A) the ring-couple interspaces for the three processed contact lenses at different bending conditions; the measurements were carried out on the photos captured from the side where the couple-rings were engraved; (B) the ring-couple interspaces for the three processed contact lenses at different bending conditions; the measurements were carried out on the photos captured from the intact sides of the processed contact lenses; (C) the ring-couple interspaces for the three processed contact lenses at low and high balloon pressures (12 and 22 mmHg); the measurements were carried out on the photos capture from the side where the couple-rings were engraved; (D) the couple-ring interspaces for the three processed contact lenses at low and high balloon pressures (12 and 22 mmHg); the measurements were carried out on the photos captured from the intact sides of the contact lenses.
Applsci 12 10661 g005
Figure 6. (A) The contact lens with a ring-couple interspace of 1.5 mm exposed to low and high pressure for four cycles; (B) A schematic representation of the developed sensor when read by the smartphone.
Applsci 12 10661 g006
Table 1. Contact lenses processed under different laser conditions to engrave the couple-rings.
TRIAL NUMBERINTERSPACING (mm)LASER POWER (W)SCANNING SPEED (mm·s−1)
1148520
248480
344520
444480
540600
640440
71.5 40440
8240440
9236440
Publisher’s Note: MDPI stays neutral with regard to jurisdictional claims in published maps and institutional affiliations.