1. Introduction
Learning analytics, understood as the use of data about students to improve their learning, is an approach through which teachers can understand education, help them to be student conscious and better capitalize teaching resources [
1]. In particular, the search to provide adaptive learning environments that offer students with alternative learning options, such as various types of resources, interactive activities, and personalized services, begins with the challenge of knowing their academic backgrounds, needs, and profiles. Throughout history, educational institutions have been concerned about improving the skills and learning outcomes of students to provide society with well-prepared professionals, who are ready to work out solutions and enroll in the labor market. However, one of the main issues has been the determination of the key factors that influence academic performance in a given learning environment. In this context, education has benefited recently from powerful data analysis tools, such as data mining and learning analytics [
2,
3].
Educational data mining, such as learning analytics, may guide educational institutions in providing suitable learning environments that promote academic success [
4,
5,
6]. Therefore, institutions have started using learning analytics tools to improve services and student outcomes and promote life-long learning [
7,
8]. Learning analytics denotes the collection and analysis of data about learners and their instructional and learning contexts to improve learning and learning environments. Therefore, learning analytics is near the top of the priority list for many institutions in higher education. Furthermore, new and evolving technologies are creating more and greater opportunities for the personalization of education. However, poor academic performance and decline in student retention in higher education continue to drive the need for more personalized, engaging student experiences to maintain enrollment. Therefore, current technologies are reaching into the education ecosystem and creating opportunities to bring the personalization of education to real environments [
9]. This can benefit: (i) students in their learning process along with the outcomes, (ii) designers of specific programs and courses focused on personalizing learning, (iii) instructors in their performance, and (iv) researchers. All of them can apply Learning Analytics more effectively to improve teaching as well as learning in higher education [
10].
The benefits of learning analytics typically take one of three forms: (a) early alert warning or reminder systems, so that teachers or institutions can intervene with academic support for students, (b) predictive analytics platforms, so that institutions can monitor students regarding the evolution of their learning, and (c) course planning and navigation systems to support course designers by providing relevant data-driven insights. Frequently, these systems obtain data from the scholar services systems of institutions to identify, for example, students at risk of failing courses or dropping out, student behavior patterns, or points of failure within the system [
11,
12]. However, for learning environments that are only partially digitized, teachers are required to use their pedagogy and transmission of knowledge to enable students to acquire knowledge and develop their skills. This conjunction is transformed by the connection of specific characteristics between teachers and students. This meeting point helps in the discovery of how teachers and their teaching methods influence the manner in which students feel, think, and act. This aspect is one that is not always intentionally planned during the teaching process [
13].
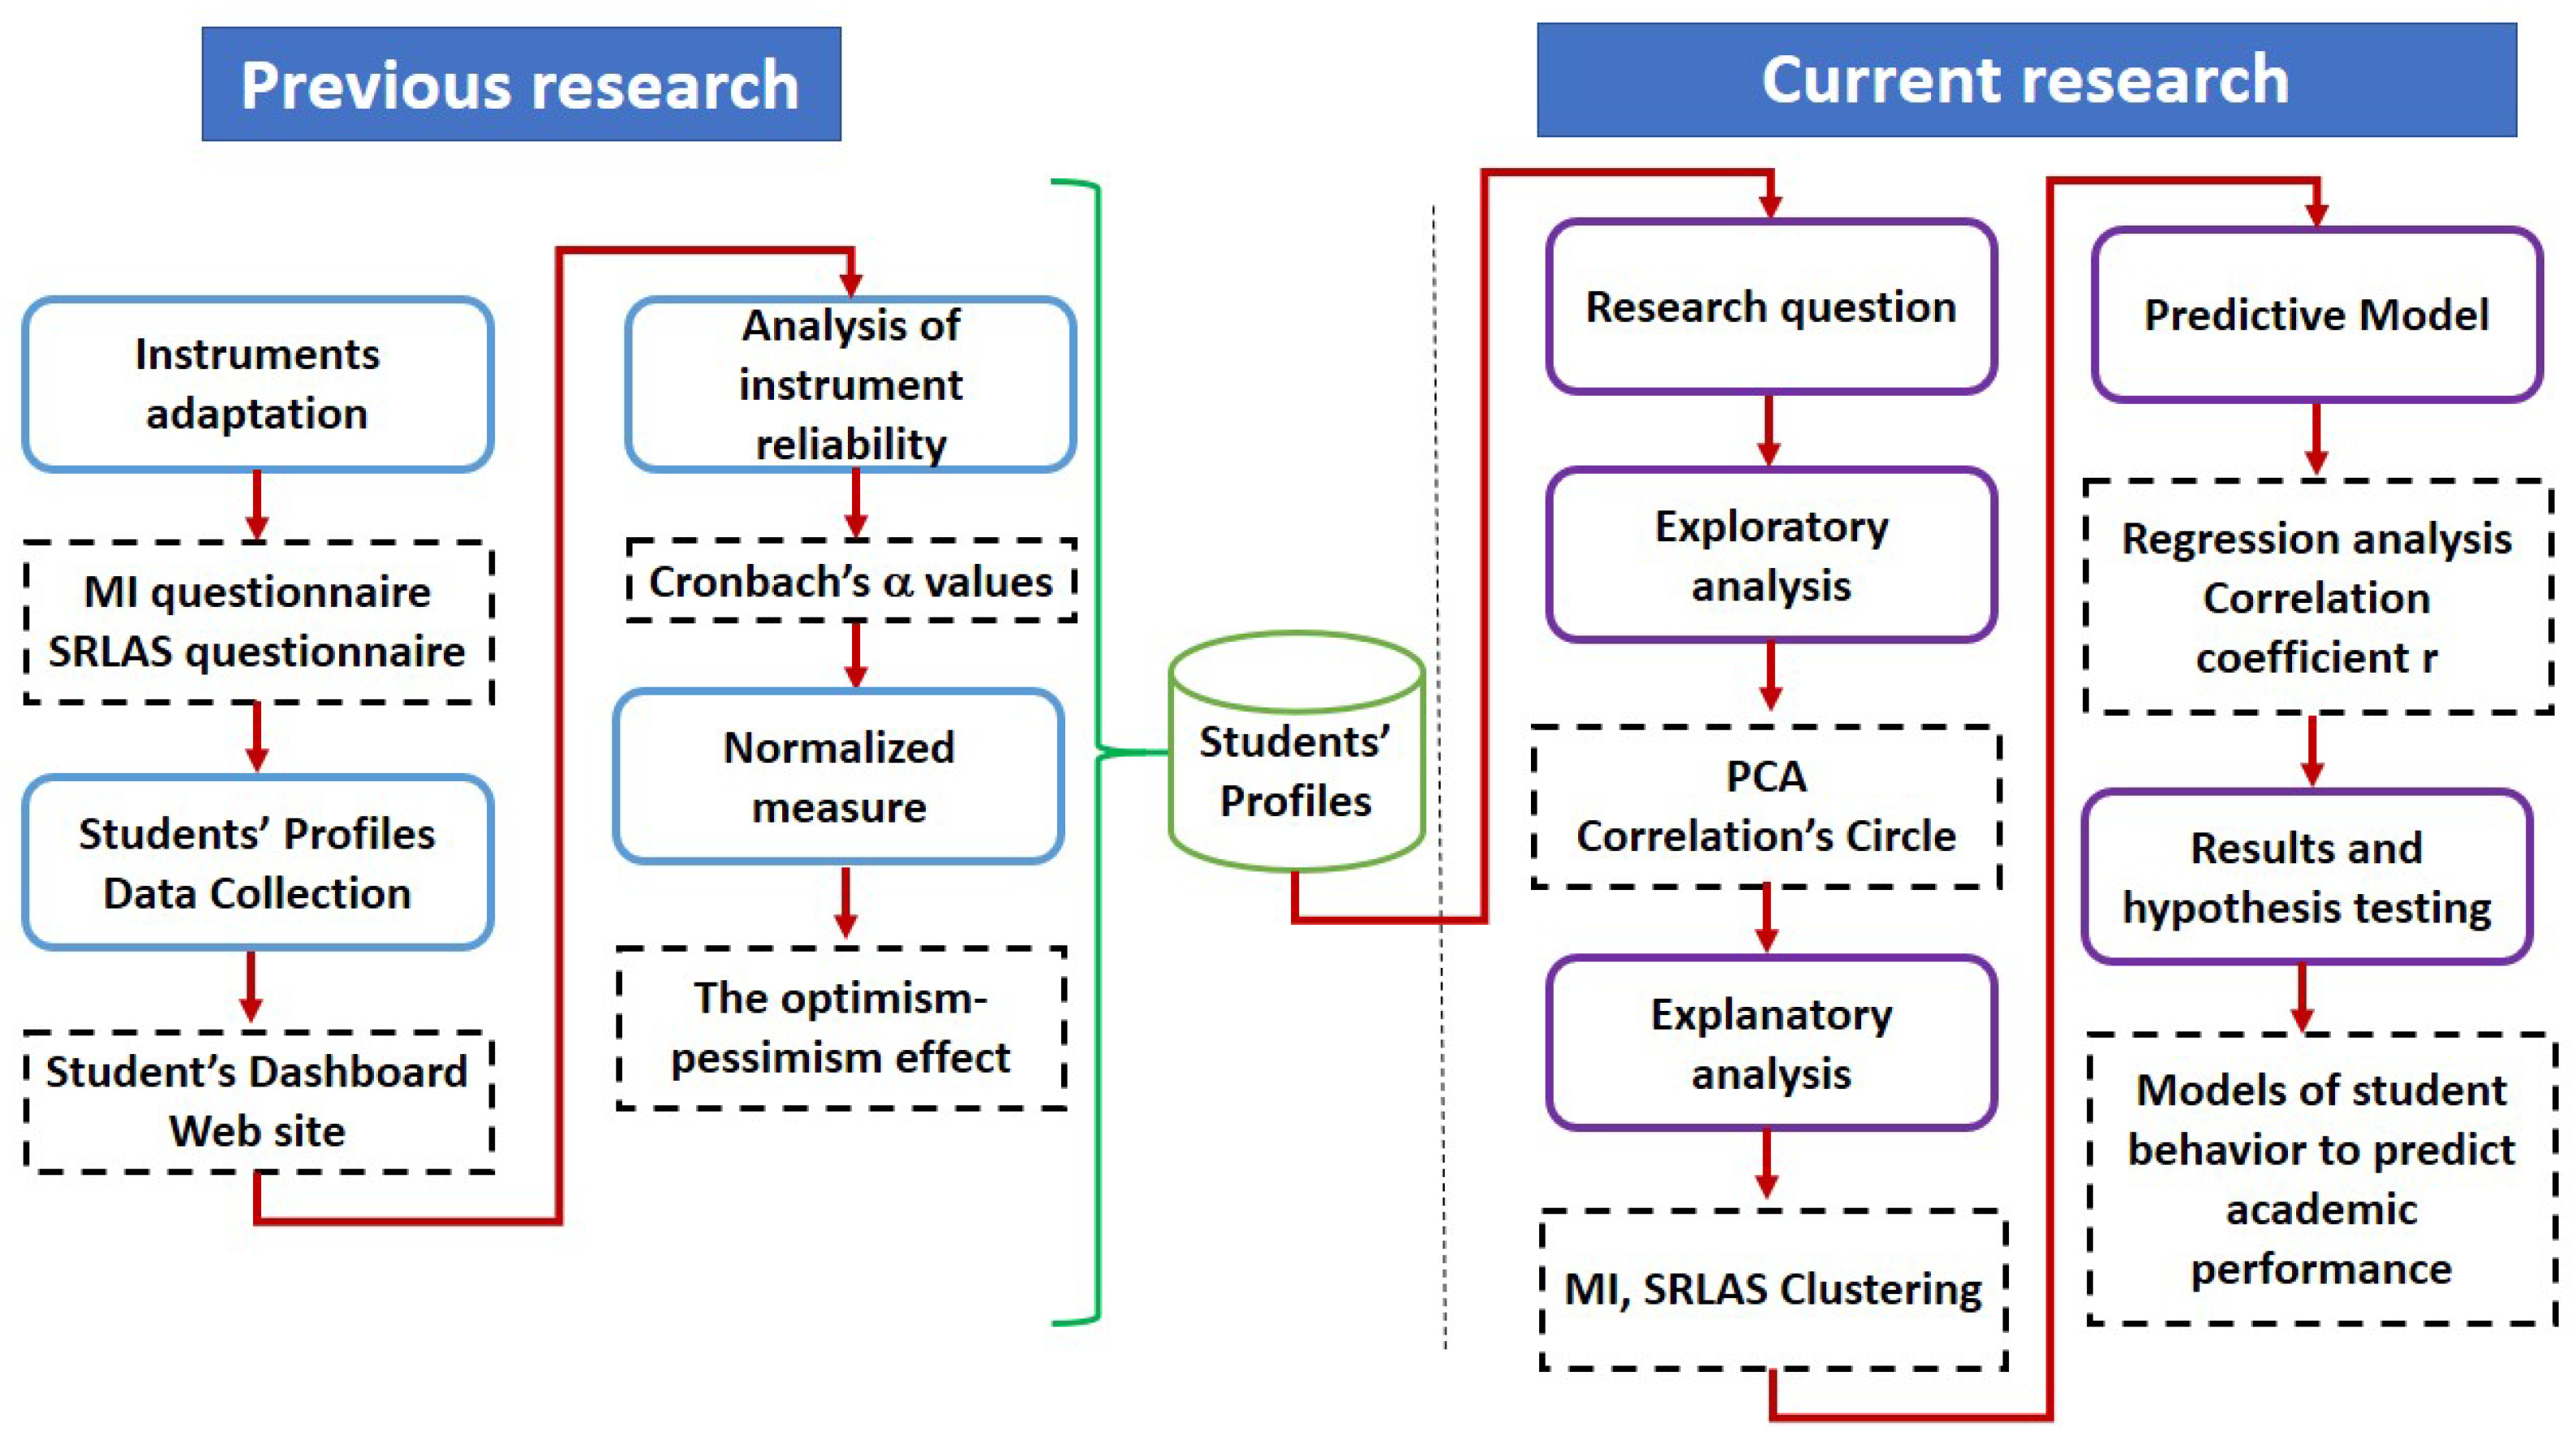
In previous research, the authors of the current study defined student profiles on the basis of the constructs of multiple intelligences (MI) and self-regulated learning and affective strategies (SRLAS) to identify the most important characteristics related to the academic success of engineering students [
14]. In that work, the authors proposed three alternative measures to handle the 16 different dimensions associated with both constructs. The study found that biases due to intrinsic student optimism or pessimism can be significantly reduced in the proposed average measure by considering a normalized measure (NM). Furthermore, the study identified that students with high levels of logical-mathematical intelligence, improved self-regulation, and low levels of anxiety exhibited better academic performance. To complete and extend these previous findings, and to take advantage of new tools for data analysis, the current study presents a formal learning analytics study of the data, including clustering, correlation, regression, and principal component analyses, to examine the relationships among the above-mentioned dimensions and student academic performance.
We present a novel solution that combines student profiles with learning analytics techniques to build predictive academic performance models. We use learning analytics tools to identify the most important dimensions of the MI and SRLAS constructs associated with academic performance. For this reason, the appropriate instruments for determining student profiles according to the MI and SRLAS dimensions were first selected [
14]. Then, learning analytics techniques were applied to determine the main profile dimensions associated with academic performance.
The present study addresses the following research question:
Is it possible to identify the impact of the students’ profile dimensions on their academic performance using predictive models based on MI and SRLAS?
Furthermore, we present the following research hypothesis:
The timely determination of students’ profiles based on their MI and SRLAS dimensions to enhance their academic performance can be achieved through learning analytics.
The remainder of the paper is structured as follows:
Section 2 discusses related work.
Section 3 introduces the MI and SRLAS constructs as adapted from our previous study [
14]. The methodology of this research is outlined in
Section 4.
Section 5 provides the selected learning analytics techniques and shows the main results.
Section 6 offers a discussion of the findings and compares them with those of previous studies. Finally,
Section 7 concludes and outlines future work.
2. Related Work
Recently, learning analytics has been used to disclose patterns that exert an impact on student learning. Specifically, Van Leeuwen et al. [
15] have used learning analytics tools in a computer-supported collaborative learning environment to motivate and guide teachers in providing better interventions and in supporting collaborative groups of students faced with problems regarding cognitive activities. Moreover, the search for successful patterns for timely interventions led Sousa-Vieira et al. [
16] to conduct an in-depth examination of student activities on the SocialWire platform. Particularly, this platform programs three types of online activities: (a) pre-class activities, (b) questionnaires before partial exams, and (c) the use of forums for collaborative learning. Comparing the results obtained through various success/failure classifiers, the authors concluded that the student final course grades are best predicted with the pace of the activities in which they participated, that is, the number of events per unit of time, instead of the type of initial activity. Moreover, Teo et al. [
17] demonstrated the usefulness of learning analytics methods in analyzing knowledge creation and collaboration in an online electric and electronics engineering course, whereas Kim et al. [
18] used learning analytics to support self-regulated learning in asynchronous online courses.
Undoubtedly, technological advances have improved the design and development processes of educational applications. In addition, interest in the use of ICT to enhance and predict academic performance has emerged [
19,
20,
21]. Some studies have focused on identifying hidden knowledge and patterns using data mining techniques [
22]. As such, applications and systems have experienced exponential growth in recent years in this field.
Pandey and Taruna [
23] developed multiple classifiers using K-nearest neighbor, and decision trees to predict academic performance. The authors used a data-set on academic information as well as demographic information from a university in India to predict the academic performance of undergraduate engineering students. The authors mentioned that the proposed method can also be used for the development of decision support systems.
Hasan et al. [
24] used decision tree algorithms to achieve the prediction of academic performance. To test their methodology, records from 22 students that contained academic information and activities in Moodle were used. A mining tool, named the Waikato Environment for Knowledge Analysis and developed at the University of Waikato, New Zealand, was used to evaluate the decision tree algorithm along with access time in Moodle. The authors found that the random forest tree approach obtained better results in this task than comparative decision tree algorithms. Similarly, Hamsa et al. [
25] also used decision trees along with their implemented genetic fuzzy systems and Fuzzy Fitness Finder. The authors reported that the results obtained from the decision tree classifier enabled the lecturers to take better care of students. Alternatively, the fuzzy logic approach provided friendlier results, which provided students with mental satisfaction, whereas lecturers could attend them indirectly.
In the same area, Bravo-Agapito et al. [
26] examined the use of exploratory factor analysis, multiple linear regressions, cluster analysis, and correlation to determine whether students are engaged in the course and to predict their academic performance. The authors used data from Moodle interaction, characteristics, and grades of 802 undergraduate students and found that the prediction of academic performance is principally based on four factors, namely, access (variables related to student access to Moodle, including visits to forums and glossaries), questionnaires (visits to and attempts to complete questionnaires), tasks (variables related to consulted and submitted tasks), and age. Moreover, the authors reported that the age factor predicts that academic performance is inversely related to age.
Trujillo-Torres et al. [
27] focused on mathematical competence. They proposed that the perception of students, the relationship between teacher and students, the classroom, gender, teaching-learning methods, and motivation are crucial factors for achieving optimal academic performance. The study intended to determine the optimal algorithm model for predicting the maximum learning gain of students. They employed a 14-item questionnaire, which was validated using the Kaiser–Guttman criterion and Tucker–Lewis Index. The cross-sectional study recruited a total of 2018 high-school students. The results indicated that the role of the classroom and the teacher–student relationship exerted a large influence on mathematics scores. Along a similar research line, Sharabiani et al. [
28] designed a prediction model using Bayesian networks to forecast the grades of engineering students in three courses. The study examined the records of 300 students to test the proposed model and used 10 variables, such as demographic data and scores obtained from previous courses. The accuracy exhibited by their approach was compared with other models, such as decision trees, K-nearest neighbors, and naive Bayes. In this direction, D’Uggento et al. [
29] also identified the usefulness of adopting a periodic monitoring system, which considers statistical techniques, such as logistic regression, survival analysis, and Cox regression model. These techniques enabled the early detection and modification of factors to achieve optimal results regarding students’ expectations and quality of higher education. The authors used data from 7485 freshmen students enrolled in an academic year.
In the search for factors that exert various impacts on learning, Akhtar et al. [
30] used a computer support collaborative learning environment in a computer laboratory course to monitor student participation and to predict student success. The authors found that achievement was positively correlated with course attendance, grouping with peers, and time allocation for task, whereas it was negatively correlated with the seating distance of students relative to the position of the lecturer. Using the linear regression approach, the authors suggested that learning analytics can be used to predict academic performance and to identify students at risk of course failure. Similarly, Atkinson [
31] investigated the relationship of learning style, gender, and prior experience in design and technology among trainee teachers in their degree program. Although the results from the learning style groupings (verbal-visual and holistic-analytic) did not meet expectations and, although the conclusions about gender differences lacked a consensus, the study observed a positive relationship between achievement and past experience.
Regarding the role of anxiety on the learning outcomes of students, Chapell et al. [
32] investigated the relationship between test anxiety and academic performance on a large sample composed of 4000 undergraduate and 1414 graduate students enrolled in public universities in the USA enrolled in different majors. Using descriptive statistics, the authors observed a small but significant inverse relationship between these two variables. Moreover, Vitasari et al. [
33] investigated the relationship between study anxiety and academic performance on a large sample of engineering students in Malaysia. The results demonstrated a significant correlation between high levels of anxiety and low levels of academic performance. Furthermore, the study concluded that anxiety during studying is a major predictor of academic performance and exerts a detrimental effect on student academic achievement. In similar research, Balogun et al. [
34] scrutinized the moderating role of achievement motivation in the relationship between test anxiety and academic performance among undergraduate students in Nigeria. The results indicated that, although test anxiety and achievement motivation exerted negative and positive effects on academic performance, respectively, achievement motivation significantly moderated these relationships. Therefore, the authors concluded that universities should design appropriate psycho-educational interventions to enhance the achievement motivation of students.
Nowadays, evaluation should be aligned with specific competencies, such that students can exhibit their understanding and abilities through examinations so that teachers can improve their teaching [
35]. Empirical evidence illustrates that an active learning environment encourages students to be more open and committed. When evaluation considers class participation, quizzes, lab experiments, and presentations, in addition to written exams, then students obtain a better well-rounded view of their capabilities. In
Table 1, we summarized and categorized the references mentioned above regarding their main attributes, methods, together with contribution to the field.
5. Results and Analysis Using Learning Analytics Techniques
To test our research question, a descriptive analysis of the sample using learning analytics techniques was performed to generalize the results observed in the target population. The selected tools were as follows: (a) Principal Component Analysis (PCA), (b) Clustering, and (c) Correlation and Regression Analysis. Through PCA, a graphical visualization of the relationships between the different variables or dimensions is sought. This analysis tool shows a visual perspective that provides important details of the relationships among the variables. As a complementary tool, clustering allows groups of students with similar characteristics to be formed, which can be subsequently analyzed in terms of their academic performance. The analysis of the structure of these clusters provides relevant information for our goal. In addition, correlation and regression analysis provide generalizable regularities to the target population. However, as discussed below, highly correlated explanatory variables cannot be present in the same regression model due to the multicollinearity effect, which distorts the regression coefficients and the significance of the observed relations. Consequently, it is important to complement the regression analysis with correlation analysis to better understand the dynamics through which the various regression models are being formed.
Once the NM was chosen as the best way to characterize students’ profiles in a more objective manner, the selected learning analytical techniques were applied to identify those dimensions that could be related to academic performance. These analyses are presented and discussed next.
5.1. Principal Component Analysis (PCA) and Correlation’s Circle
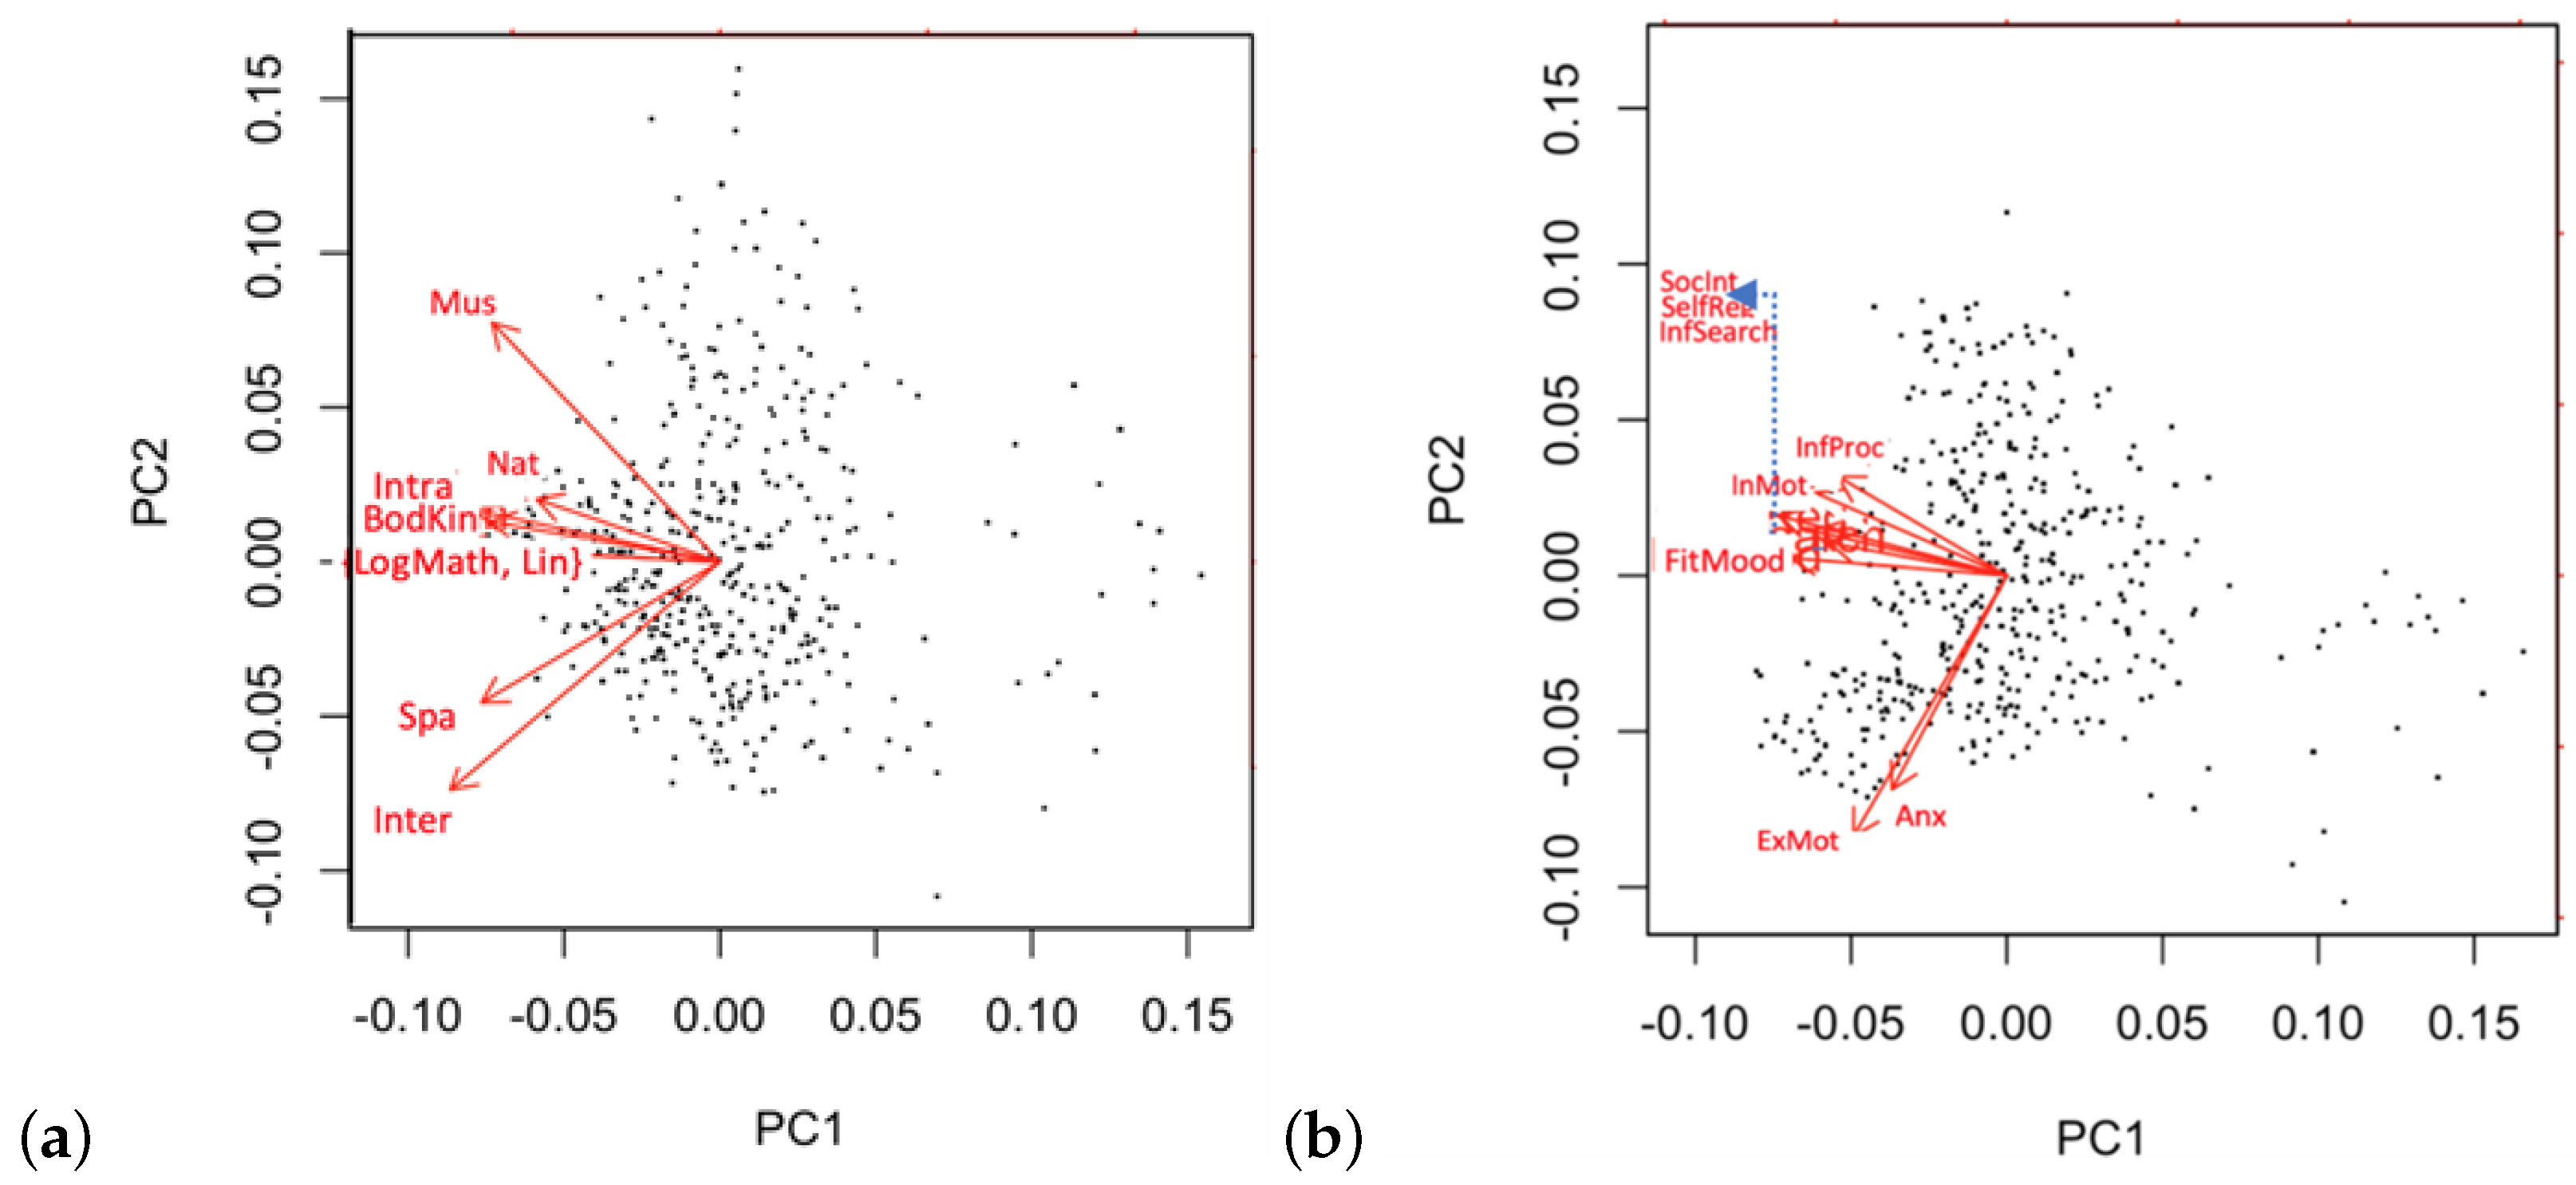
Considering all the student profiles obtained in our sample, biplot diagrams of principal components for MI and SRLAS were built. In
Figure 3a,b, the principal planes containing the largest amount of possible information with only two axes are presented for the MI and SRLAS dimensions, respectively. These axes are named PC1 and PC2 for convenience. In these plots, each dot represents the profile of a given student. Each dimension is represented with an arrow, and the angle between any two arrows corresponds to the degree of correlation between these two dimensions. Therefore, a small angle corresponds to a strong correlation between these two dimensions, a 90° angle implies zero correlation, and a 180° angle indicates total anti-correlation. Moreover, points close to a specific arrow represent students with preponderance in the corresponding dimension. Large arrows or far points from the center indicate dimensions or students best represented in this plot, respectively.
In
Figure 3a, it is observed that
LogMath,
Lin,
BodKin, and
Intra are quite correlated, while the remaining dimensions are less correlated with them, with
Mus being almost independent of
Spa and
Inter. Overall, the PCA biplots show relative independence among the MI dimensions, which was one of Gardner’s hypotheses when he proposed his multiple intelligences’ scheme [
37].
Regarding the SRLAS biplot (
Figure 3b), they form two distinct groups. On one hand,
Anx and
ExtMot are highly correlated, while the remaining dimensions are correlated among them, but not with
Anx and
ExtMot. The numerical values of the correlations indicate that
IntMot and
SelfReg present the highest correlation within the SRLAS dimensions.
5.2. Clustering
In this section, the formation of clusters of students having similar student profiles according to their MI and/or SRLAS dimensions is presented. The clustering processes were programmed with R using the hierarchical classification algorithm coupled with the Ward method. Several trials were tested with varying cluster sizes. After an analysis of the study, four clusters presenting the derived information more clearly were determined. For each formed cluster, the average grades for the courses in which the students were enrolled as registered in our database were included to compare academic performance among the different clusters.
5.2.1. MI Clustering
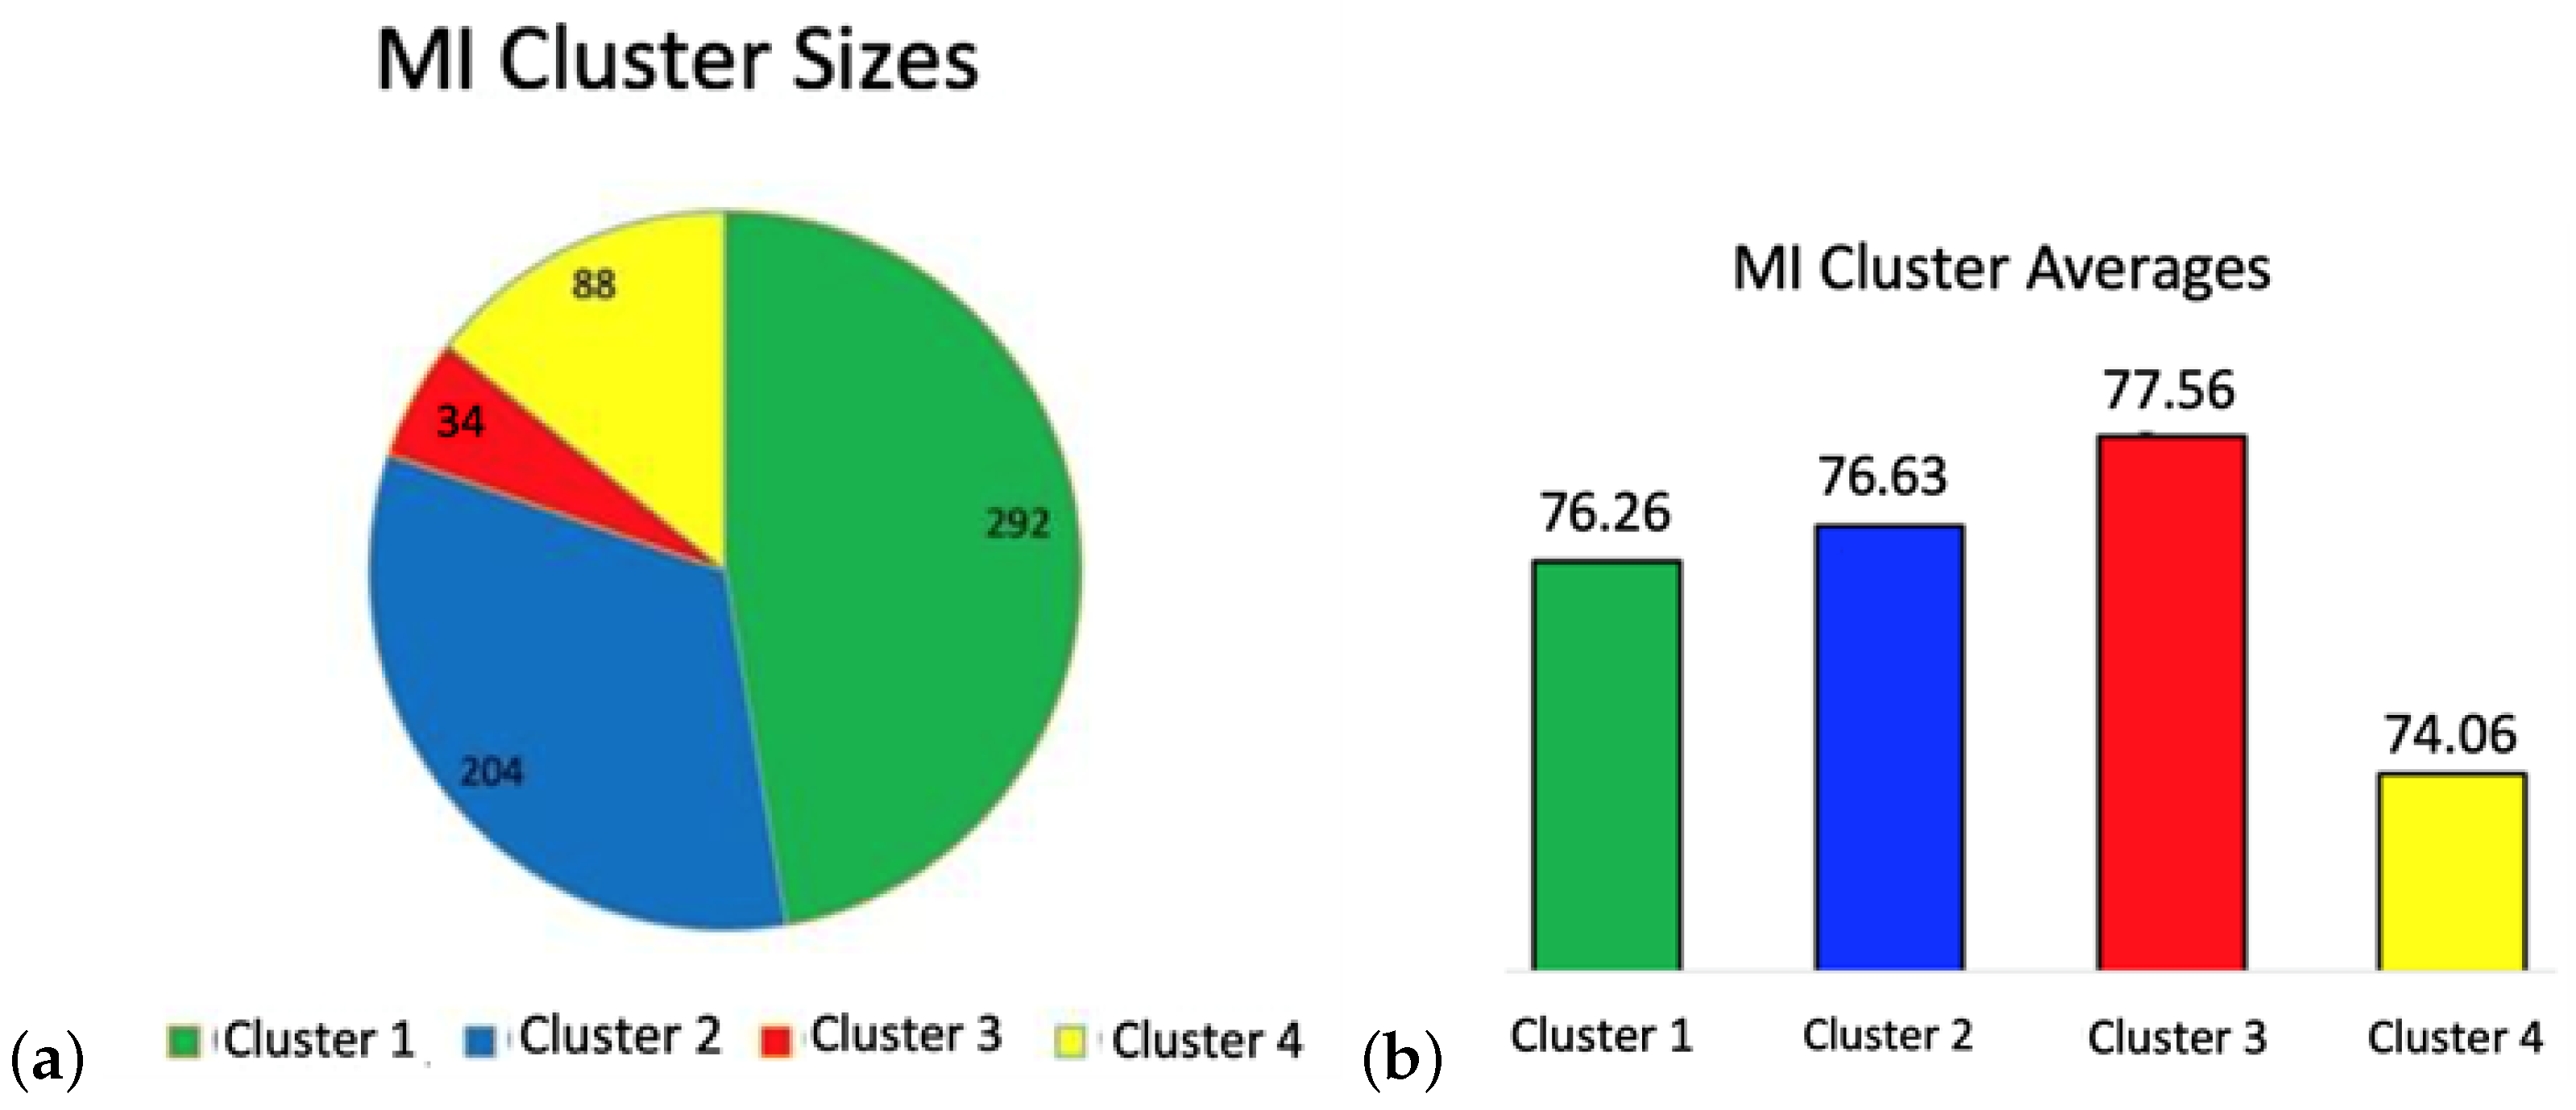
In
Figure 4a,b, the populations of the four MI clusters and their corresponding average grades are presented, in the pie chart and the bar diagram, respectively.
Table 3 also presents these values, along with the average grades and their standard deviations. The populations of the four MI clusters and their corresponding average grades are presented, in the pie chart and the bar diagram, respectively.
Table 2 also presents these values, along with the standard deviation of the average grades.
From
Table 3, it is observed that the average grades for Clusters 1, 2, and 3 are similar but relatively different from that of Cluster 4. Therefore, paired one-tail
t-tests between the clusters were performed to validate these results. It was found that there was no statistical difference among the average grades of Clusters 1, 2, and 3. On the other hand, Cluster 4 was compared with the union of Clusters 1, 2, and 3. The following hypotheses were used:
It was observed that the average grade for Clusters 1, 2, and 3 is statistically higher than the average grade for Cluster 4 with a
p-value = 0.0580 (
Table 4).
To investigate the possible differences among MI clusters in more detail, a bar-plot in a 1–5 scale, with the average values obtained for each MI dimension, was constructed (
Figure 5a). Cluster 3, consisting of 34 students and having a slightly higher average grade, presents the smaller values of all MI dimensions, as compared with the other clusters. To emphasize the differences among clusters and to facilitate the analysis of the data, in
Figure 5b, a normalized radar is formed by setting the difference between the maximum and minimum values of the sample equal to 1 and interpolating the remaining values of the sample.
As previously mentioned above, it is seen that Cluster 3 (red line in
Figure 5) has the lowest values for all MI dimensions, despite exhibiting (slightly) the highest average grade. Cluster 1 shows the highest value for almost all dimensions, while Clusters 2 and 3 present intermediate values. The results indicate that Cluster 4, composed of 88 students with the lowest average grade, presents a very high value of the intrapersonal dimension but a relatively low value of the interpersonal dimension. These results suggest that MI dimensions alone are not useful enough to categorically explain the differences between students’ grades.
Consequently, in this study, the information derived from MI is complemented with that provided by SRLAS to determine the combination of dimensions that could better explain the academic performance of undergraduate engineering students.
5.2.2. SRLAS Clustering
A similar clustering analysis for the SRLAS dimensions was performed, where four clusters were also determined after an analysis of the results derived from different number of clusters.
Figure 6a,b present the populations of the four clusters formed based on the SRLAS dimensions and their corresponding average grades using pie chart and bar diagrams, respectively. These values are also included in
Table 5 along with the average final grades and their standard deviations.
It was found that the average grade for Cluster 1 is higher than those for Clusters 2, 3, and 4. Similar to the MI dimensions, one-tail
t-tests between clusters were performed to determine whether the differences in the average final grades are statistically different. The study observed no statistically significant differences among Clusters 2, 3, and 4. Therefore, we opted to compare the average grade for Cluster 1 with those for Clusters 2, 3, and 4 combined (
Table 6). The following hypotheses were used:
Table 6 conclusively indicates that the difference between the average grades for Cluster 1 and the union of Clusters 2, 3, and 4 is statistically significant with a very small
p-value (less than 1 ×
).
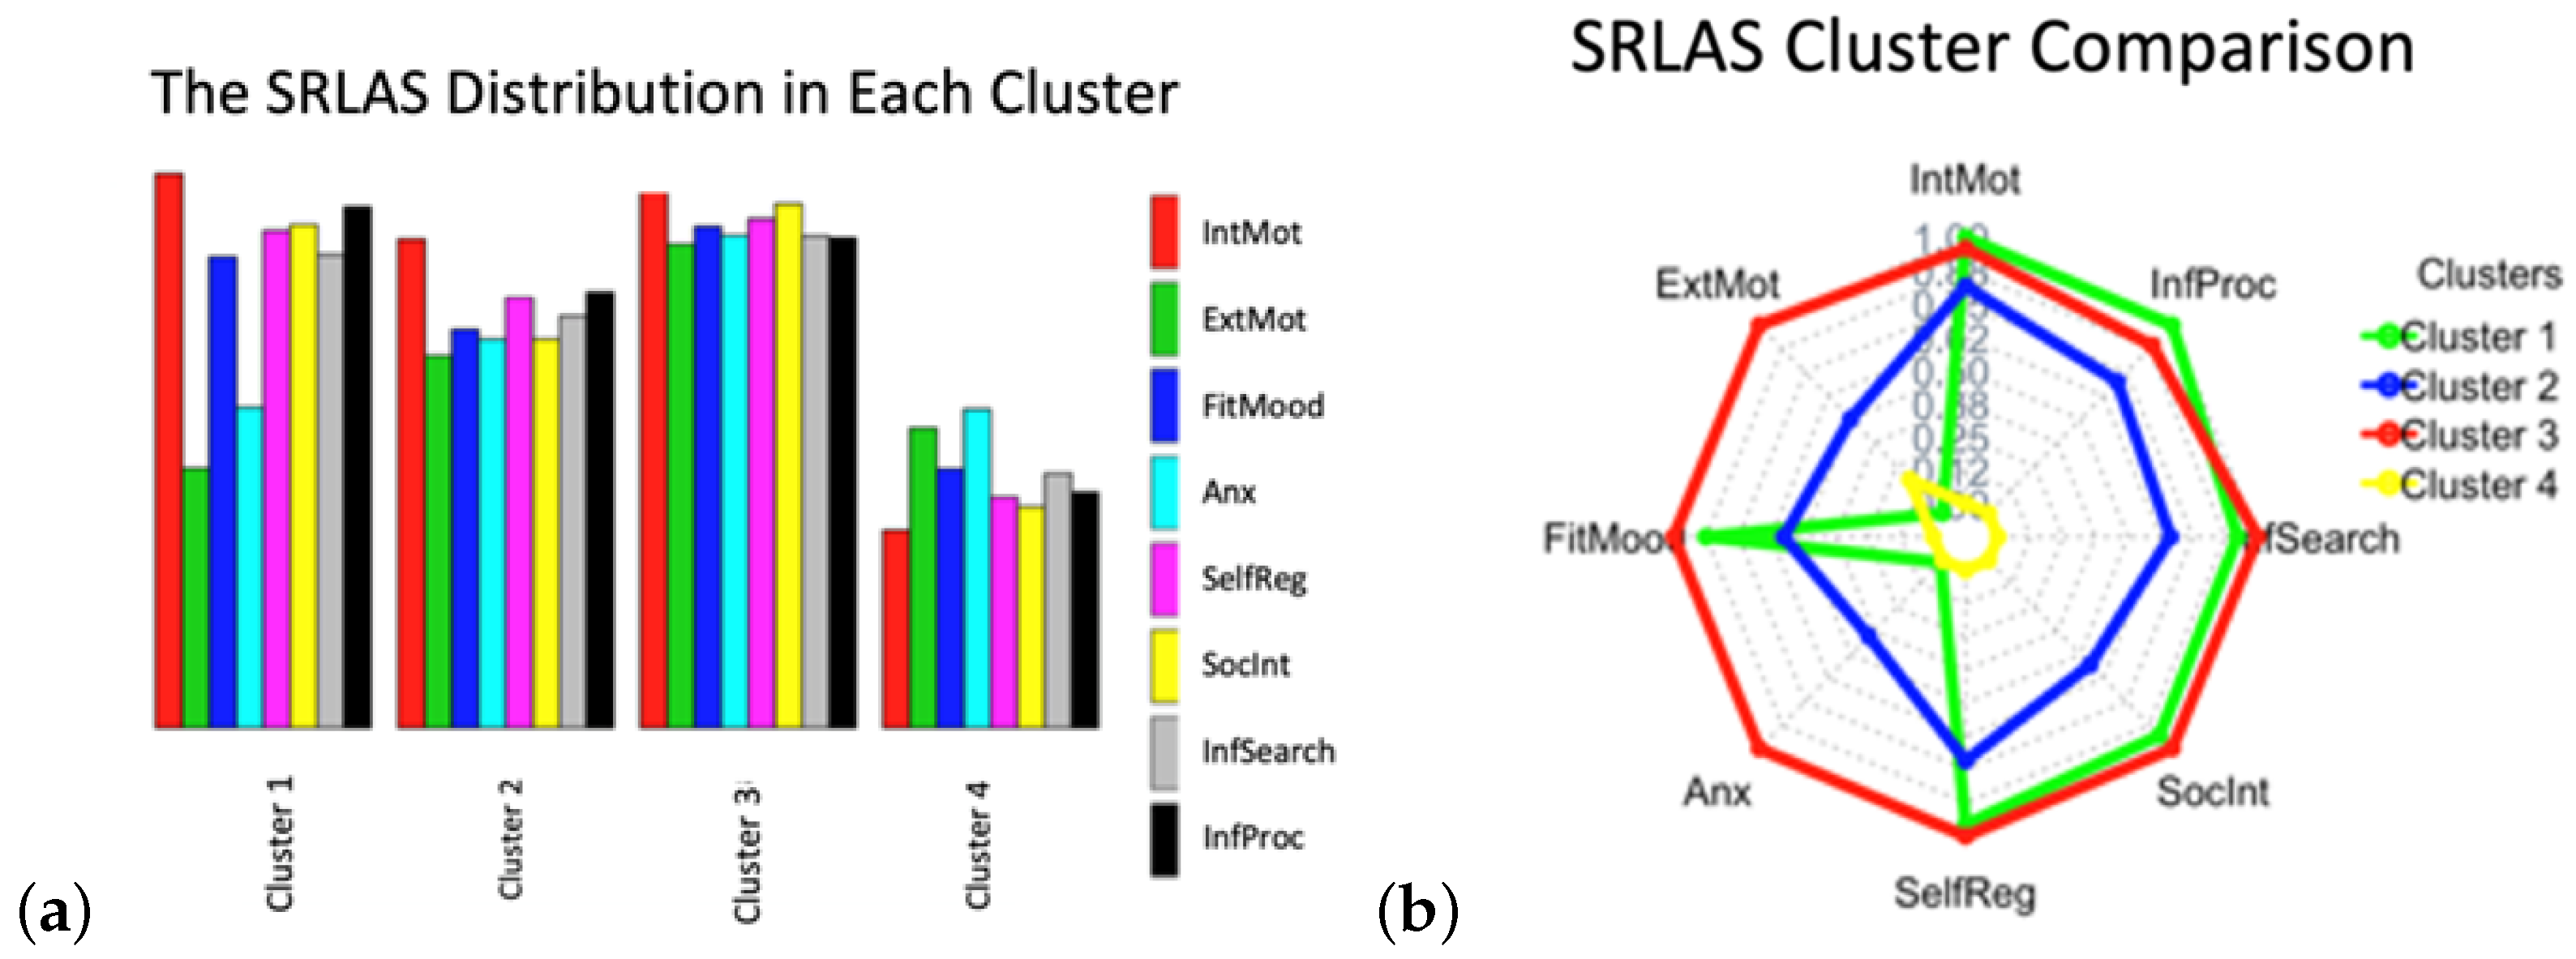
To study the difference among clusters in more detail, a bar-plot in a 1–5 scale was constructed, with the average values obtained for each of the SRLAS dimensions (
Figure 7a), similarly to how it was done for the MI dimensions. The corresponding radar diagram, emphasizing the differences among the clusters’ dimensions, is presented in
Figure 7b.
As can be seen in
Figure 7b, Cluster 1, which has the best academic performance, is the cluster with the lowest anxiety values and the lowest need for extrinsic motivation.
It is important to mention that, although the MI and SRLAS constructs were combined in preliminary analyses, this integration is not recommended due to the information overload produced by the 16 dimensions involved. No additional benefits were obtained, so it was decided to study these two constructs separately in this work.
5.3. Regression Analysis and Correlations
Although the clustering analysis may provide insight on dimensions that have a greater impact on academic performance, the conclusions emerging from this analysis are not conclusive yet. Regression analysis provides a generalization of the results on a probabilistic basis, which considers a sample of the data to conduct hypothesis testing to provide conclusions about the entire population. To verify the statistical rigor of the relationships between academic performance and students’ MI and SRLAS profiles, regressions were performed between students’ final grades and the dimensions of the following: (a) MI, (b) SRLAS, and (c) a combination of both. Minitab was used to select the best set of explanatory variables using a stepwise method, and the best regressions obtained by least-squares were determined. The coefficients in the equations below represent the relative weight of the dimensions that appear in the regression equation, and the figures in parentheses indicate their statistical significance, given by their corresponding p-values. Positive coefficient values indicate dimensions that have a favorable impact on the final grades, while negative values have the opposite effect.
- 1.
Regression 1 (Final grade vs. MI dimensions)
- 2.
Regression 2 (Final grade vs. SRLAS dimensions)
- 3.
Regression 3 (Final grade vs. MI ∪ SRLAS dimensions)
Based on the regression equations, the following conclusions can be derived: (a) the logical-mathematical intelligence exerts an important positive impact on students’ final grades, (b) the self-regulation dimension also has a positive influence on the final grade, whereas the anxiety and external motivation dimensions have a negative relationship, and (c) considering both MI and SRLAS constructs together, the most important dimensions that present a positive relationship with academic performance are the logical-mathematical and self-regulation dimensions, whereas anxiety most negatively influences academic performance. In multiple regression, the correlated explanatory variables interact by competing to reach a place in the regression in such a manner that the significance of the present variables is modified when a new variable is introduced.
Consequently, a correlation analysis is essential to perceive the dynamics of the stepwise algorithm to obtain an appropriate regression analysis.
Table 7,
Table 8 and
Table 9 present correlation matrices, which enable a better understanding of the three regressions mentioned above. The entries illustrate the correlation coefficient
r between the corresponding dimensions, as well as the correlations of the final grade with each of the MI and/or SRLAS dimensions.
In
Table 7, it is observed that all intelligences are positively correlated, where the highest correlation observed is between
LogMath and
Intra (
r = 0.74). This means that, on average, the higher a student’s
LogMath dimension is, the higher their
Intra dimension, and vice versa. Moreover, it is found that the
LogMath dimension is the most correlated with the remaining ones. The average of the correlations among
LogMath and the remaining intelligences is
r = 0.57. On the contrary, the lowest correlation is found for
Mus and
Inter (
r = 0.15). This means that, if a student has a high
Mus dimension, it does not provide much information about their
Inter dimension. Finally, the
Mus dimension is the least correlated with the remaining seven dimensions with an average correlation of
r = 0.36.
On the other hand,
Table 8 indicates that the SRLAS dimensions are also positively correlated. Notably,
Anx and
ExtMot are the least correlated with all the other dimensions; however, they possess a high correlation between them (
r = 0.50, as discussed in
Section 5.1). The average correlation for
Anx with the remaining variables is
r = 0.19 and for
ExtMot, it is
r = 0.23. This means that
Anx and
ExtMot have a low linear association concerning the other dimensions. The SRLAS dimension that presents the higher correlation with the remaining seven dimensions is
SelfReg, with an average correlation of
r = 0.54. Consequently, it is found that the dimension that best represents the SRLAS construct as a whole is
SelfReg. Individually, the highest correlation is found between
SelfReg and
IntMot, with
r = 0.75. In other words, on average, the more intrinsically motivated the students are, the more self-regulated they are and vice versa. The lowest correlation coefficient is found between
ExtMot and
InfProc, with
r = 0.019, which is an indicator of the level of independence between the students’ information processing capacity and their extrinsic motivation. All these findings agree reasonably well with the results obtained with the PCA presented in
Section 5.1.
Finally,
Table 9 presents the main cross-correlations between MI and SRLAS dimensions. In general, we observed low correlations, which can be interpreted as evidence of the level of independence between the MI and SRLAS constructs.
6. Discussion
The PCA biplots demonstrate the relative independence of several of the MI (
Figure 3a) and SRLAS (
Figure 3b) dimensions, which may help to interpret the characteristics of students of a given section. However, it is important to emphasize that each construct is composed of eight dimensions, whereas the 2D biplot only enables the visualization of two composite dimensions (i.e., principal components). The two corresponding principal components for MI and SRLAS constitute 49% and 60%, respectively, of their total inertia. In other words, the main planes of the MI and SRLAS contain 49% and 60%, respectively, of the total information that can be obtained from the eight dimensions of each construct. Therefore, using only the distribution of students on the biplots to interpret the dimensions of the entire sample does not provide yet by itself enough information for teachers to implement the most appropriate pedagogical actions for their students.
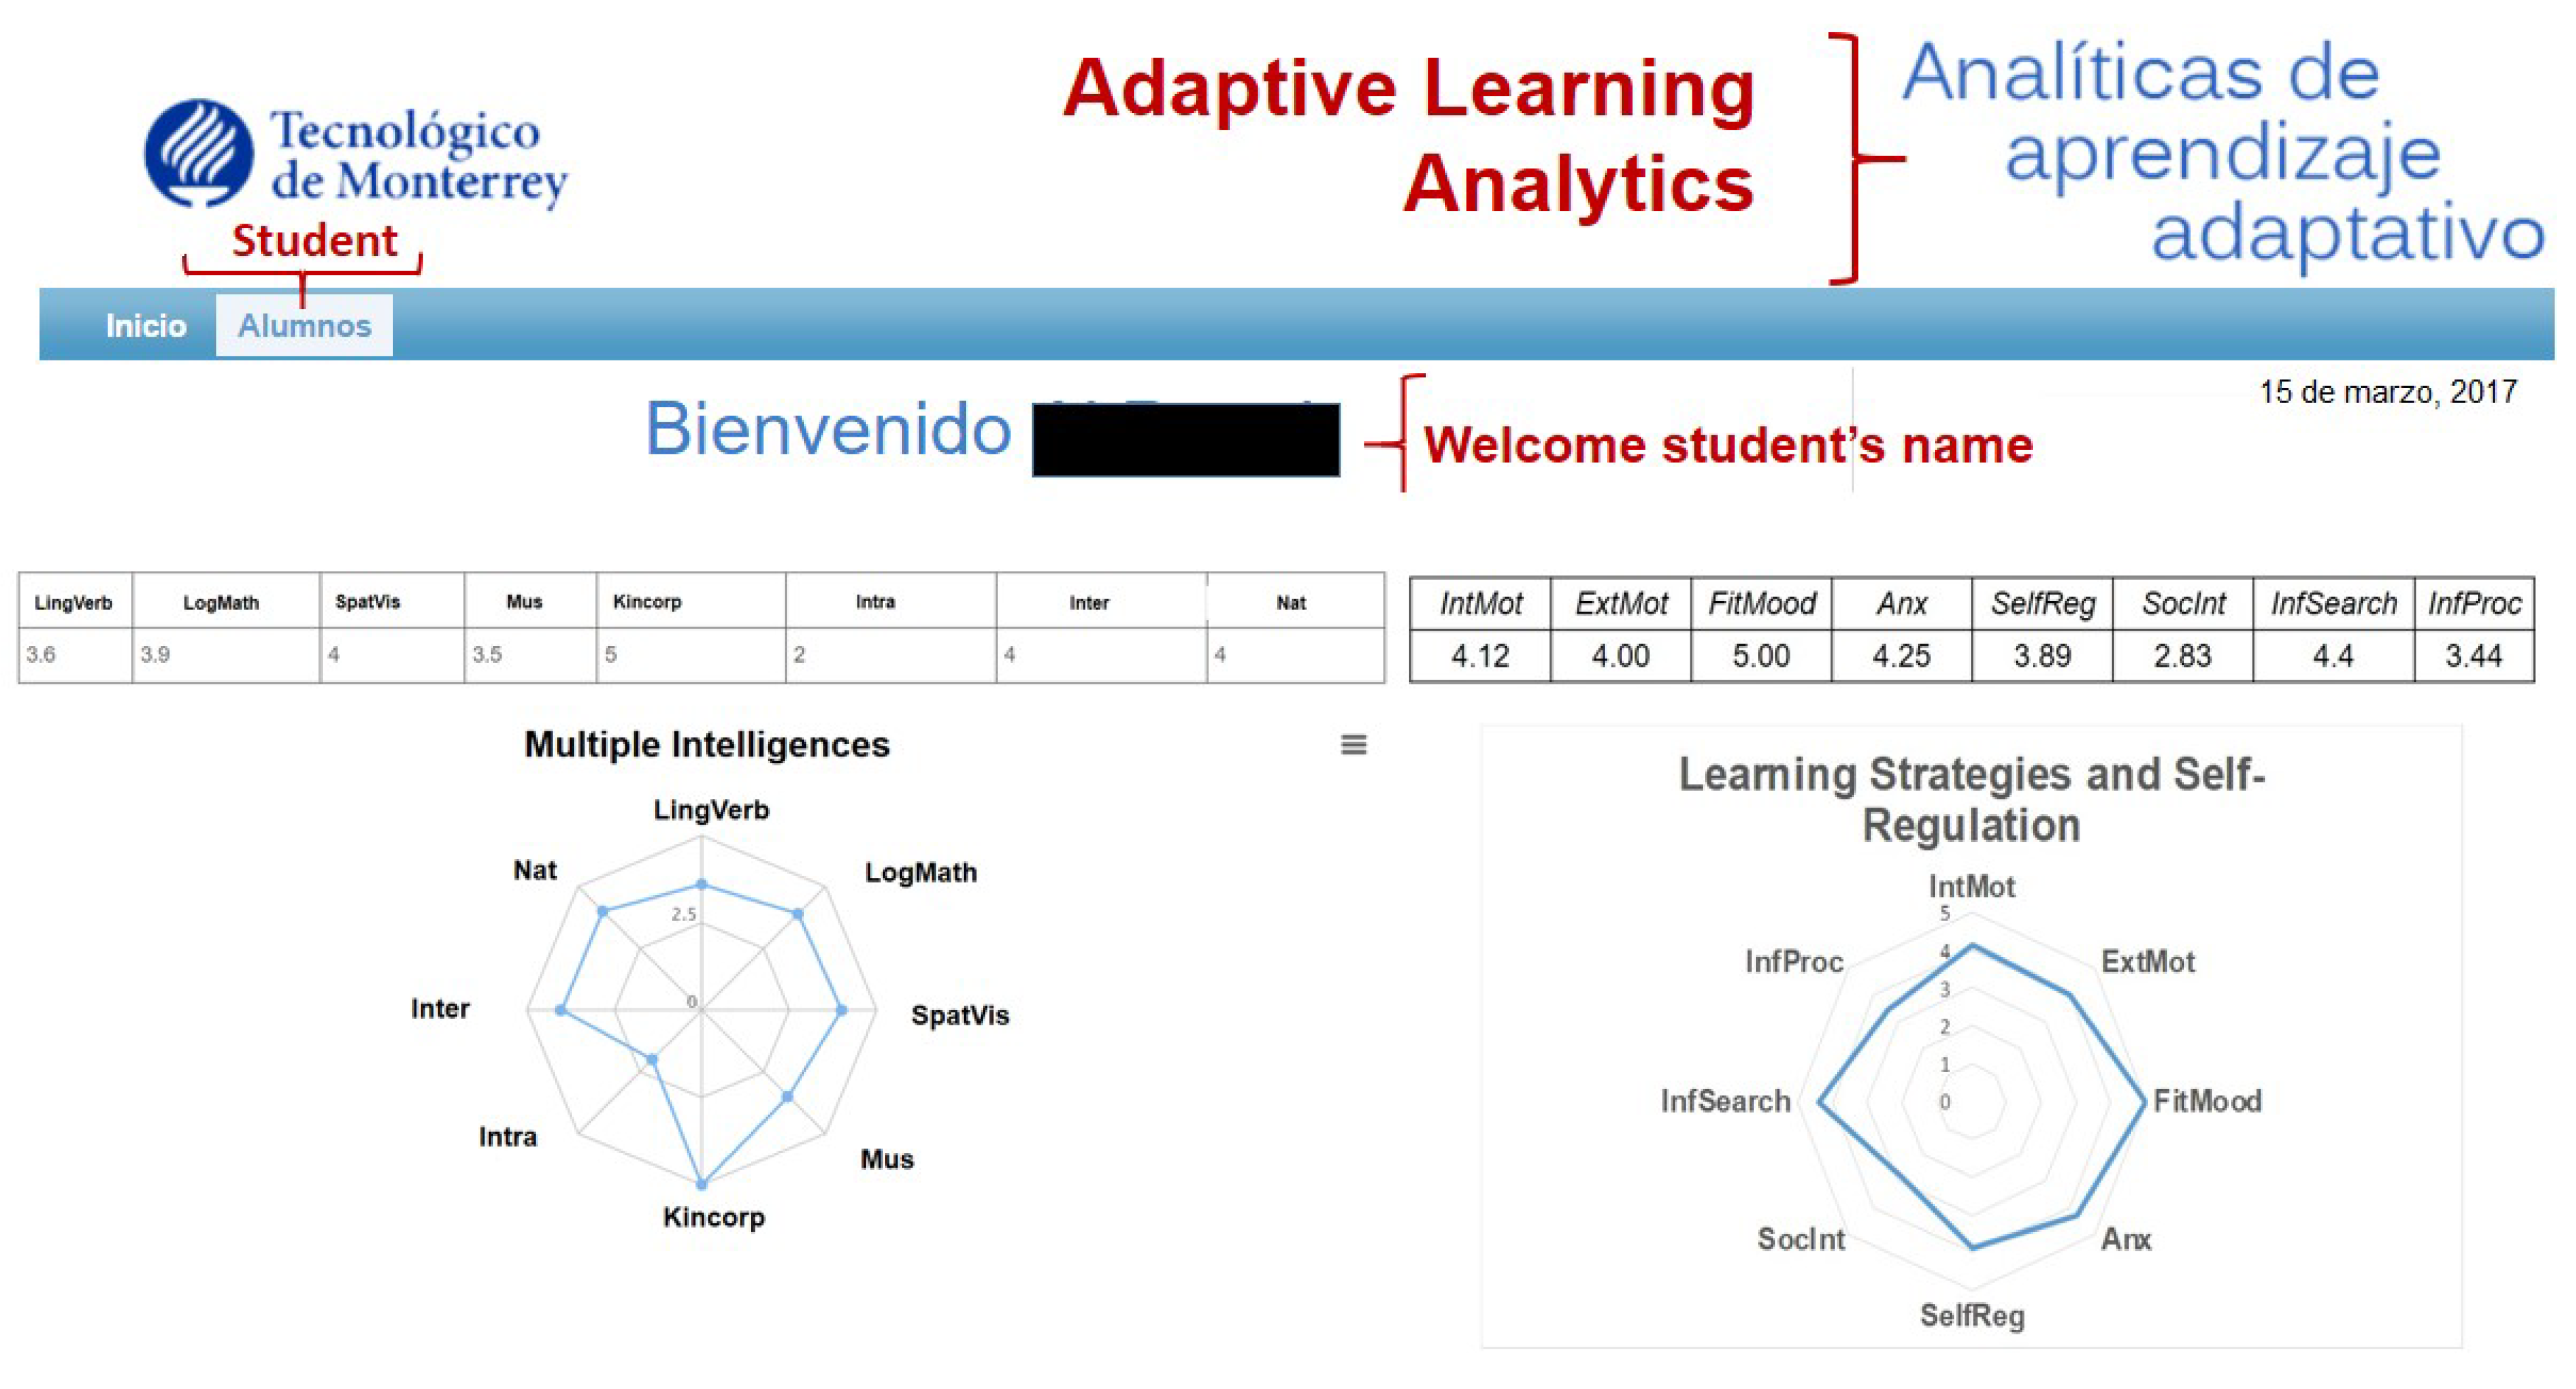
Even though MI dimensions may be considered more related to cognitive indicators, and SRLAS dimensions to behavioral aspects of the student, our results are not meant to provide an elaborated dashboard to monitor and evaluate the actual performance of a given student regarding a particular task. We do not yet have documented interventions derived from this basic dashboard (
Figure 2). It provides only a first “picture” of the student profile regarding the 16 considered dimensions. To measure the actual effect of the MI and SRLAS profiles on the academic performance of the student separately is a complicated task, since actual learning is not limited to the learning process, and the final academic performance is also influenced by other complex factors, such as family environment, personal feelings and student personality.
To better track the effect of cognitive and behavioral learning analytics (LA), several authors have worked out cognitive and/or behavioral dashboards to assist in the learning process [
50,
51,
52]. According to Yousef and Khatirty (2021) [
51], the key objective of a behavioral LA dashboard is to gather data in a single repository, from multiple channels and networks, used to generate context models to provide students with customized input and personal recommendations. In the case of cognitive LA dashboard, four levels are considered: (a) Description: Observing events and other data to obtain a detailed picture of a student’s activity; (b) Diagnosis: Descriptive elements needed to evaluate an outcome; (c) Prediction: Set likely outcome based on certain elements; and (d) Recommendations: Set how to achieve a desired learning outcome result from a specific element.
Sedrakyan et al. [
50] implemented a system of dashboards that allow the student and the teacher to continuously monitor the academic and behavioral status of the students, as well as the evolution of their academic performance regarding a given task. They consider the regulatory mechanisms underlying the learning processes to provide the student with an effective feedback (epistemic, corrective and/or suggestive) to advance efficiently and effectively in the learning cycle, including aspects of self-regulation controlled by the student. The most comprehensive feedback includes both cognitive and conceptual aspects. However, the detailed mechanisms for user intervention in feedback remains challenging. In this sense, Wiggins and McTighe (1998)’s [
53] “backward instructional design” provides richer opportunities for tracking the whole learning processes. In addition, recent research shows increased interest in exploring biofeedback opportunities based on multi-modal data collected from various wearable sensors and audio/video streams [
54].
Considering the MI clustering process alone, it is difficult to clearly identify the dimensions that exerted an important influence on academic performance. Cluster 3, with a slightly better average final grade, is also the group with the lowest values in all dimensions, whereas Cluster 4, with the lowest average grade, did not provide a suitable pattern leading to sound conclusions for its MI dimensions (
Table 3 and
Table 4, and
Figure 5). This is partially due to the fact that the differences in grades among the clusters obtained were rather small and statistically insignificant. Therefore, the results of this research suggest that the MI construct alone lacked sufficient strength to clearly explain the differences between the grades. This conclusion is consistent with findings of other authors in the sense that there is not a simple correlation between MI dimensions and student academic performance. In fact, in the past decades, the relationship between MI dimensions and academic performance has been considered a field of research among educators from various areas at different academic levels. It has been argued that a simple correlation is lacking among these variables [
55,
56,
57,
58]. Notably, Lee [
59] suggests that, apart from clearly defining the MI in the surveys, it is also a good idea to ask senior students to participate in the study, since they have gone through the entire academic engineering spectrum. Lee’s work indicates that most students had some level of mixed MI, except the musical one. Whereas the logical-mathematical and linguistic skills were found as the most influential dimensions, musical and body-kinesthetic intelligences were the ones perceived with the least applicability to predict academic performance.
Regarding the results of the SRLAS clustering, it can be appreciated that Cluster 1, with a significant highest average grade (
Table 5), has the highest
IntMot and
InfProc values, relatively high values for
SelfReg,
SocInt,
FitMood, and
InfSearch, but the smallest
Anx and
ExtMot values (
Figure 6b). On the other hand, Cluster 3, with the lowest average grade, has high values for all dimensions, including
Anx and
ExtMot. Cluster 4, with an intermediate average grade, presents relatively small values for all dimensions. Finally, Cluster 2, with an intermediate average grade, reveals intermediate values for all the dimensions. Therefore, it is suggested that a combination of relatively high values of
IntMot,
InfProc,
InfSearch,
SocInt,
SelfReg, and
FitMood, on the one hand, combined with low values of
ExtMot, and
Anx, on the other hand, can promote better academic performance. Likewise, students presenting high levels of anxiety (
Anx) and the need for external motivation (
ExtMot) may face difficulties in achieving appropriate learning outcomes. This assertion is somehow validated by the teaching experience of the authors and the expectations from such student behavior.
To reinforce and complement the information obtained from the clustering analysis, a regression analysis was performed. From the regression equation obtained from the MI dimensions (Equation (
2)), it was found that logical-mathematical intelligence had a critically positive impact on the student’s final grades, as expected, the sample being comprised mostly of engineering students. In addition, from the regression equation for the SRLAS construct (Equation (
3)), it was identified that students’ self-regulation also had an important positive impact on their final grades, while students’ anxiety and the need for external motivation shared a negative impact on students’ outcomes. Overall, taking the MI and SRLS constructs together in the regression analysis (Equation (
4)), it can be concluded that the most important dimensions that presented a positive relationship with academic performance are the logical-mathematical and self-regulation, while the students’ anxiety has the most negative impact on academic performance.
There have been multiple efforts to predict student academic outcomes in order to improve their academic performance. The contexts, the variables used, the analytical techniques used, and the objectives pursued have all been diverse. For example, Akhtar et al. [
30], through analysis of variance, correlation, and regression, found that academic performance was positively correlated with course attendance, grouping with peers in the collaborative learning environment, and the time spent on learning tasks. However, it was negatively correlated with the distance from the students’ seat to the position of the teacher. They consider their findings to be important in detecting students who are at risk of failing a course. In contrast, the present study rather focuses in considering variables regarding MI and SRLAS dimensions.
To examine academic performance in detail, Matzavela et al. [
60] suggest that, apart from pedagogical efforts, complementing the analysis with a specific student profile may be helpful in analyzing student performance. Information on gender, level of education of parents, their income, birth order in the family, and the current working conditions of the students, among others, may be useful. Along this idea, Aman et al. [
61] believe that socioeconomic factors, academic history, and personal interests also play a crucial role in predicting academic performance in developing countries.
During the present research, it was found that MI multiple intelligences, which may be considered similar to learning styles, were less effective than SRLAS to predict academic performance. These results are similar to those reported by Atkinson [
31], who observed that learning styles are not decisive for predicting student academic performance. However, Atkinson’s work shows that students’ achievements are positively correlated with previous experience.
The learning analytics techniques applied in this work were similar to those used by Bravo-Agapito et al. [
26]. In their research, Bravo-Agapito et al. used main components analysis, correlation analysis, factor analysis, and clustering as exploratory techniques. They used multiple regression for their predictive analysis and did not require the Exploratory Factor Analysis because the used instruments have already been validated. The input data used by them are different than ours, since they analyzed student interaction data from Moodle, such as accesses, questionnaires, tasks, and student’s age, while our database uses student profiles based on MI and SRLAS constructs.
The effect of self-regulation learning on academic performance was also studied by Kim et al. [
18], who analyzed student statistics in asynchronous online courses using classification techniques, such as Decision Trees and Random Forests. These authors used clustering to identify groups of self-regulated, partially self-regulated, and non-self-regulated students. When observing a better academic performance of self-regulated students, they used the Random Forest classifier to deduce rules for the development of student self-regulation. The present research’s findings are in line with these authors in the sense that self-regulation is an important aspect of academic success. However, unlike their work, this study included mostly engineering students, while self-regulation learning was estimated through one of the SRLAS dimensions.
Another important aspect to consider in learning prediction models is the management of student anxiety. The relationship between test anxiety and academic performance has been investigated by several authors. Chapell et al. [
32] found a small but significant inverse relationship between these two variables through basic statistics in students from different careers and universities in the United States. Similarly, Vitasari et al. [
33] reported a significant positive correlation between anxiety level and low academic performance of a large sample of engineering students in Malaysia, concluding that anxiety is an important predictor generating a detrimental effect on student academic performance. These findings are consistent with the results obtained in this study, where anxiety is one of the eight dimensions of our SRLAS construct with a significant effect on academic performance. The negative relationship between anxiety and academic performance is found in the clustering analysis, where the clusters characterized by a low level of anxiety had a significantly higher performance than the other clusters. In addition, in the regression analysis, it was identified that anxiety is a variable with a very significant negative effect on the prediction of academic performance. Furthermore, in the present study, a high correlation between students’ anxiety and their extrinsic motivation needs was also found.
The detrimental role of anxiety on student academic outcomes is also noticed in the work of Garg et al. [
21], who uses a machine learning-based model for predicting students’ performance in higher education. They also used visualizations and classification techniques to find significant factors to build a predictive model. They found that support vector machine, random forest, and naive Bayes techniques may effectively train limited samples to generate appropriate prediction performance.
With regard to motivation, Trujillo-Torres et al. [
27] investigated mathematical competence in middle schools using a 14-item questionnaire. They found that the teacher–student relationship and motivation were crucial factors to achieve optimal academic performance. In addition, Balogun et al. [
34] found that, although anxiety and motivation had a negative and a positive effect in academic performance, respectively, it was possible to moderate anxiety through motivation. Therefore, they concluded that universities should design adequate psychoeducational interventions to improve motivation and increase the performance of the students. In this regard, in the present research, two types of motivation, intrinsic and extrinsic, were included in the SRLAS construct with undergraduate students. It was identified that the intrinsic motivation was positively related to students’ academic performance, while extrinsic motivation, defined as the need of students to have external motivation, presented an inverse relationship with students’ academic outcomes.
Consequently, the methodology proposed in this research will allow instructors to propose mechanisms to design tools for two main types of support actions. First, it will be possible to: (a) provide early warnings to increase student success, (b) build models of student behavior to predict academic performance, (c) increase self-reflection and self-awareness of responsibilities and roles in the teaching-learning process, and (d) design applications to improve on time feedback and evaluation processes. Secondly, it will also be possible to offer course recommendations in adaptive systems, providing tools to predict dropouts, thus increasing student retention, as well as making suggestions on the optimal use of educational resources. The contributions of the predictive values of the constructs used in the present work to define the students’ profiles may also be combined with the results of diagnostic tests applied at the beginning of the courses to offer personalized and adaptive learning environments, both in face-to-face or online modes. Furthermore, in a next phase, we plan to determine individualized predictions by means of classification algorithms, in order to know if each student has a risk profile of failure and take the appropriate help actions at the appropriate time.


 ,
, 


