Article

VAPPD: Visual Analysis of Protein Pocket Dynamics

1
School of Information Science and Engineering, Yanshan University, Qinhuangdao 066004, China
2
The Key Laboratory for Software Engineering of Hebei Province, Qinhuangdao 066004, China
3
Engineering Training Center, Yanshan University, Qinhuangdao 066004, China
4
School of Medicine and Pharmacy, Ocean University of China, Qingdao 066004, China
*
Author to whom correspondence should be addressed.
Appl. Sci. 2022, 12(20), 10465; https://doi.org/10.3390/app122010465
Submission received: 10 August 2022 / Revised: 23 September 2022 / Accepted: 10 October 2022 / Published: 17 October 2022
(This article belongs to the Special Issue Multidimensional Data Visualization: Methods and Applications)

Abstract

:
Analyzing the intrinsic dynamic characteristics of protein pockets is a key aspect to understanding the functional mechanism of proteins, which is conducive to the discovery and development of drugs. At present, the research on the dynamic characteristics of pockets mainly focuses on pocket stability, similarity, and physicochemical properties. However, due to the high complexity and diversity of high-dimensional pocket data in dynamic processes, this work is challenging. In this paper, we explore the dynamic characteristics of protein pockets based on molecular dynamics (MD) simulation trajectories. First, a dynamic pocket shape representation method combining topological feature data is proposed to improve the accuracy of pocket similarity calculation. Secondly, a novel high-dimensional pocket similarity calculation method based on pocket to vector dynamic time warp (P2V-DTW) is proposed to solve the correlation calculation problem of unequal length sequences. Thirdly, a visual analysis system of protein dynamics (VAPPD) is proposed to help experts study the characteristics of high-dimensional dynamic pockets in detail. Finally, the efficiency of our approach is demonstrated in case studies of GPX4 and ACE2. By observing the characteristic changes of pockets under different spatiotemporal scales, especially the motion correlation between pockets, we can find the allosteric pockets. Experts in the field of biomolecules who cooperated with us confirm that our method is efficient and reliable, and has potential for high-dimensional dynamic pocket data analysis.

1. Introduction

A cavity on the surface of a protein that possesses suitable properties for binding a ligand is usually referred to as a protein binding pocket [1]. In structure-based drug design, the identification of protein binding pockets (orthosteric pockets) is critically important [2]. Different from the crystalline state, the protein structure in the organism is always moving and changing. The geometric and physicochemical properties of protein pockets may be affected by protein movement [3]. The dynamic characteristics of protein pockets include stability, continuity, and correlation. The stability and continuity of the pocket can be used to track the changes of the pocket, and a stable pocket can ensure the stability of the local structure of the protein. Drugs developed on allosteric pockets with high stability can ensure their stable function. EPOS B P [4] and Epock [5] track some pocket properties along the MD trajectory (as volume). It is difficult to show the stability and continuity of the pockets as a whole and intuitively in the long-term pocket simulation, and to compare the stability of the pockets more conveniently. The correlation of pockets is mainly used to identify potential allosteric pockets that are highly related to the movement of orthosteric pockets. However, allosteric site discovery is mainly verified by experimental random discovery [6]. In recent years, with the development of technology and the deepening of allosteric research, active identification of allosteric sites by using existing knowledge systems has become a hot topic [7]. A variety of methods based on normal mode analysis [8,9] and MD simulation [2,10] have been developed to analyze the correlation of protein pockets and predict protein allosteric pockets. Due to the different length and time length of the alpha spheres of two dynamic pocket sequences, it is difficult to calculate the correlation. Analyzing the physicochemical properties of the pocket is helpful for experts in the field to further judge the physicochemical properties of the potentially binding drugs of the pocket. Dynamic pocket data has high dimensional, spatiotemporal, and relevant characteristics. In this case, the way to obtain the dynamic pocket characteristics from high-dimensional protein pocket data has become a challenging task. Using visual methods has become a trend that explores the dynamic characteristics of protein pockets by analyzing and calculating the trajectory data.
As far as we know, there is no visualization method by which to systematically explore the dynamic properties of the protein pocket based on any molecular dynamics (MD) simulation trajectories. We propose a visual analysis method of protein pocket dynamics to analyze the dynamic characteristics of cavities for the discovery of allosteric pockets (Figure 1). First, most of the methods only take into account the topological features or pocket volume features of protein pockets. VAPPD innovatively introduces the vectorization method in NLP into the molecular dynamic pocket feature coding. A special dynamic pocket feature encoding method is proposed to better preserve multiple features of the alpha sphere. Secondly, the common correlation calculation methods are generally unable to align three-dimensional spatiotemporal pocket vectors, so it is difficult to calculate high-dimensional molecular pocket correlation. An innovative high-dimensional pocket correlation calculation method based on P2V-DTW is proposed to solve the problems that the length of two static pocket alpha spheres is different and the correlation is misplaced, and the problems of different time lengths and time-related dislocation of two dynamic pocket sequences as well. Thirdly, we propose a progressive visual analysis method, which can gradually locate from all pockets to a single important pocket, and from global time to a more critical time. This method can help experts in the field to analyze pocket characteristics in the process of finding allosteric pockets, identifying pocket stability, and drug design. Finally, the effectiveness of this method is verified by testing in two sets of data of glutathione peroxidase 4 (GPX4) [11] and angiotensin converting enzyme 2 (ACE2) [12]. In conclusion, the contributions of this paper are as follows.
  • A coding representation based on the shape combined with topological features of protein molecular pockets is proposed to improve, to some extent, the accuracy of high-dimensional pocket similarity calculations.
  • A novel high-dimensional pocket similarity calculation method based on P2V-DTW is proposed to solve the correlation calculation of unequal length sequences in high-dimensional data.
  • A progressive visual analysis method of protein molecular pockets is adopted, with specific consideration of its multi-scale properties (in time and space). This method can explore the stability, similarity, and physicochemical properties of high-dimensional pockets, and discover potential allosteric pockets.
In Section 2, we discuss pocket calculation, allosteric site prediction, and pocket visualization. Based on the analysis of requirements in Section 3, Section 4 gives an overview of the system. Dynamic pocket feature extraction is discussed in Section 5. The view design of progressive visual analysis of protein molecular pockets will be described in Section 6. Interactive exploration instructions are provided in Section 7. We will use two case studies to illustrate the effectiveness of our approach (Section 8).

2. Related Work

In this section, we summarize the relevant work, including the existing pocket calculation, allosteric site prediction, and pocket visualization. These three fields cover a wide range, so we only deal with technologies that we think are relevant and close to our work.

2.1. Pocket Calculation

Pocket detection and recognition is the basis of pocket analysis. In recent years, the pocket detection and calculation methods are mainly divided into five distinct classes: grid-based (POCKET [13], LIGSITE [14], PocketPicker [15]), probe-based (SURFNET [16], HOLLOW [17]), surface-based (MSPocket [18]), Voronoi-based (CAVER [19], and CAST [20]). The subclasses are then formed by their combinations (KVFinder [21], CavVis [22]). The grid-based method is used to build the protein on a discrete three-dimensional grid space. The characteristic of the grid-based method is that the accuracy of protein cavity extraction will be affected by the grid size, and the improvement of grid accuracy will greatly increase the amount of computation. The PASS [23] tool developed by Brady and Stouten combines surface-based and probe-based methods. Feng et al. detect the pocket by calculating the difference between the two solvent-exclusion surfaces with different probe radii [24]. The method based on Voronoi is a computational geometry method. It is faster than the previous methods, and its results are more accurate. Therefore, in the current pocket-extraction technology, the method based on Voronoi is more commonly used. The above pocket-detection method provides a useful tool for static pocket recognition on the static snapshot provided by the protein database (PDB). They usually take a protein structure as input and return one or more candidate pockets.
In addition to static detection and calculation, it is also very important to recognize pockets under different time slices under dynamic conditions. Dynamic pocket recognition has attracted extensive attention in the field of biochemistry. A variety of dynamic pocket analysis tools have been developed, such as MDPocket [25], CAVER [19], CavityPlus [26], D3Pockets [2], and so on. CAVER proposes a grid-based solution for detecting cavities and exploring protein surface and internal pathways. On this basis, Jurcik et al. of Masarik University continued to develop CAVER Analyst 2.0 [27], which analyzes tunnels and channels in large MD simulations. In this paper, the Fpocket [28] is used to process the trajectory data of protein molecular dynamics simulation. This method uses Voronoi and alpha spheres [29] to analyze the protein surface. Pocket dynamics are analyzed by iterative pocket tracking of a set of PDB snapshots, which represent various conformational states of proteins of interest. The above work adopts the form of static three-dimensional structure in a single frame to describe the instantaneous mode of the pocket. When the static structure visually describes the dynamic process, it is easy to cause visual fragmentation, and it is difficult to form a unified and continuous visual effect in time and space, which makes it difficult for users to perceive the dynamic process of the pocket.

2.2. Allosteric Site Prediction

Allosteric, as one of the most direct and effective methods for regulating protein function, has received more and more attention in drug discovery [10]. Drugs that bind to allosteric sites have the following advantages: (1) low toxicity and side effects, (2) high selectivity, (3) ease of upregulation or reduction of target activity. Allosteric regulation is widely used in proteins, but the discovery of allosteric sites is mainly verified by experimental random discovery. Therefore, it is very important to solve the common detection problems of allosteric sites. With the development of technology, there are more and more recognition methods of allosteric sites. Huang et al. [30] used a support vector machine algorithm and Fpocket (Pocket detector) to predict allosteric sites, and built an online prediction web server allosite. Qi and Ma et al. [31] proposed a method for predicting protein allosteric pockets by using a coarse-grained two-state G o ¯ model. Normal mode analysis (NMA) was used to identify protein allosteric and regulatory sites (PARS) of protein allosteric sites [8]. The research of Ma et al. [9] shows that the movement of allosteric sites is highly correlated with that of orthosteric sites, which provides a new idea for predicting potential allosteric sites. Li et al. [32] predicted allosteric sites through ligand binding site detection and motion correlation analysis, found a potential mutation site in GPX4, and successfully found eight GPX4 activators.
The calculation of the correlation of the known drug binding pockets is helpful to the discovery of allosteric pockets. Chen et al. [2] proposed to explore protein pocket dynamics, such as pocket stability, continuity, and correlation, based on MD simulation trajectories or conformational populations with large-scale conformational changes. In D3Pockets, potential allosteric pockets are predicted based on the correlation between dynamic pocket volume sequences, and the topological information of pockets is ignored. A Pearson correlation coefficient is the most commonly used linear correlation coefficient. When calculating the Pearson correlation coefficient between two pockets, the D3Pockets method extracts the common timesteps in the two pockets because different pockets exist for different lengths of time, and ignores the single pocket that exists only at a certain time. However, the relationship between allosteric pockets is not only the relationship between the two pocket sequences changing with time, but also a time-warped relationship. For example, the combination of ACE2 protein allosteric pocket and drug molecule makes certain morphological changes in the conformation of ACE2 molecule, which affects the combination of ACE2 orthosteric pocket and SARS-CoV-2 virus. Inspired by the work of D3Pockets, our work combines the processing of pockets into word vectors [33], and uses natural language processing (NLP) to train pockets [34]. The DTW algorithm solves the problem of dynamic pocket correlation calculation. Therefore, we propose a new P2V-DTW algorithm to calculate the correlation between unequal length sequences in two high-dimensional pocket data. Compared with the correlation calculation method in D3Pockets, this method retains more pocket features and performs better in predicting allosteric pockets.

2.3. Pocket Visualization

Due to the high complexity and diversity of high-dimensional pocket data in dynamic processes, people’s perception of it has always been a difficulty in the field of biomolecular visualization. Krone and Kozlíková et al. [35] summarized the existing visualization methods for analyzing pockets. Spatial visualization displays the shape of the pockets through three-dimensional visualization technology [36,37,38]. Non-spatial visualization shows additional information and statistics about the pockets through different visualizations [39,40,41]. There are many interactive visualization analyses that combine spatial visualization and non-spatial visualization [42,43] to make up for the defects of 3D display pockets that are easy to block and difficult to perceive. CHEXVIS [43] combines spatial visualization and non-spatial visualization. The tool uses JSmol to display the geometry of the cavity. In addition, the conservative and hydrophobic residues around the pocket are mapped to the two-dimensional drawing by color mapping. The visualization of pockets is related not only to their physical properties and surrounding amino acids, but also to their binding sites. Krone et al. built a visual analysis application. Through visual interaction, we can see the context information of the selected site [42]. Guo et al. [44] designed the scale and visualization of a series of pockets from the perspective of time and space. We provide a method by which to explore the dynamic characteristics of protein pockets based on MD simulation trajectory or conformation set. Our progressive visualization is also a combination of spatial visualization and non-spatial visualization. Our method supports the observation and analysis of the dynamic feature of pockets at different time and space scales. Experts can explore the stability, similarity, and physical and chemical properties of high-dimensional pockets, and discover potential allosteric pockets. In Section 6, we will introduce visual design in detail.

3. Requirements

The goal of the visualization work in this paper is to meet the requirements of field experts and solve the problem of molecular pocket feature analysis in the field of biochemistry, not just to complete pocket detection and visualization. To determine the needs of visualization technology, we have held many meetings in the past year with the team of Ximing Xu, a teacher from the school of medicine of Ocean University of China. We jointly identified several limitations of the existing methods for studying the dynamic characteristics of pockets, and summarized them into a list of requirements. These requirements cover the most critical aspects of studying the dynamic feature of the pocket. Mr. Xu, who is also the co-author of this paper, had several informal interviews with us to ensure that our implementation meets the needs by iteratively checking and commenting on the progress. He has many years of research experience in the screening and evaluation of innovative drugs, which provides necessary domain knowledge for the design of VAPPD.
  • R1: Pocket stability is used as a key feature to determine the priority of structure-based drug design. Track the changes of pockets in molecular dynamics simulation, including appearance, frequency, volume change, and disappearance, and select molecular pockets with higher stability.
  • R2: Pockets with strong correlation with orthosteric pockets may be potential allosteric pockets, which are used to design allosteric compounds. Solving the problem of different time sequences and different alpha sphere number sequences will help to retain more pocket features, calculate the correlation between high-dimensional pockets, and perform better in the prediction of alternative pockets.
  • R3: The physical and chemical properties of dynamic molecular pockets can be presented, which supports the cross-validation of pocket shape and pocket features. At the same time, biologists hope to obtain drugs that act on allosteric sites, and the spatiotemporal exploration of the physical and chemical properties of pockets is conducive to the screening of allosteric drugs.
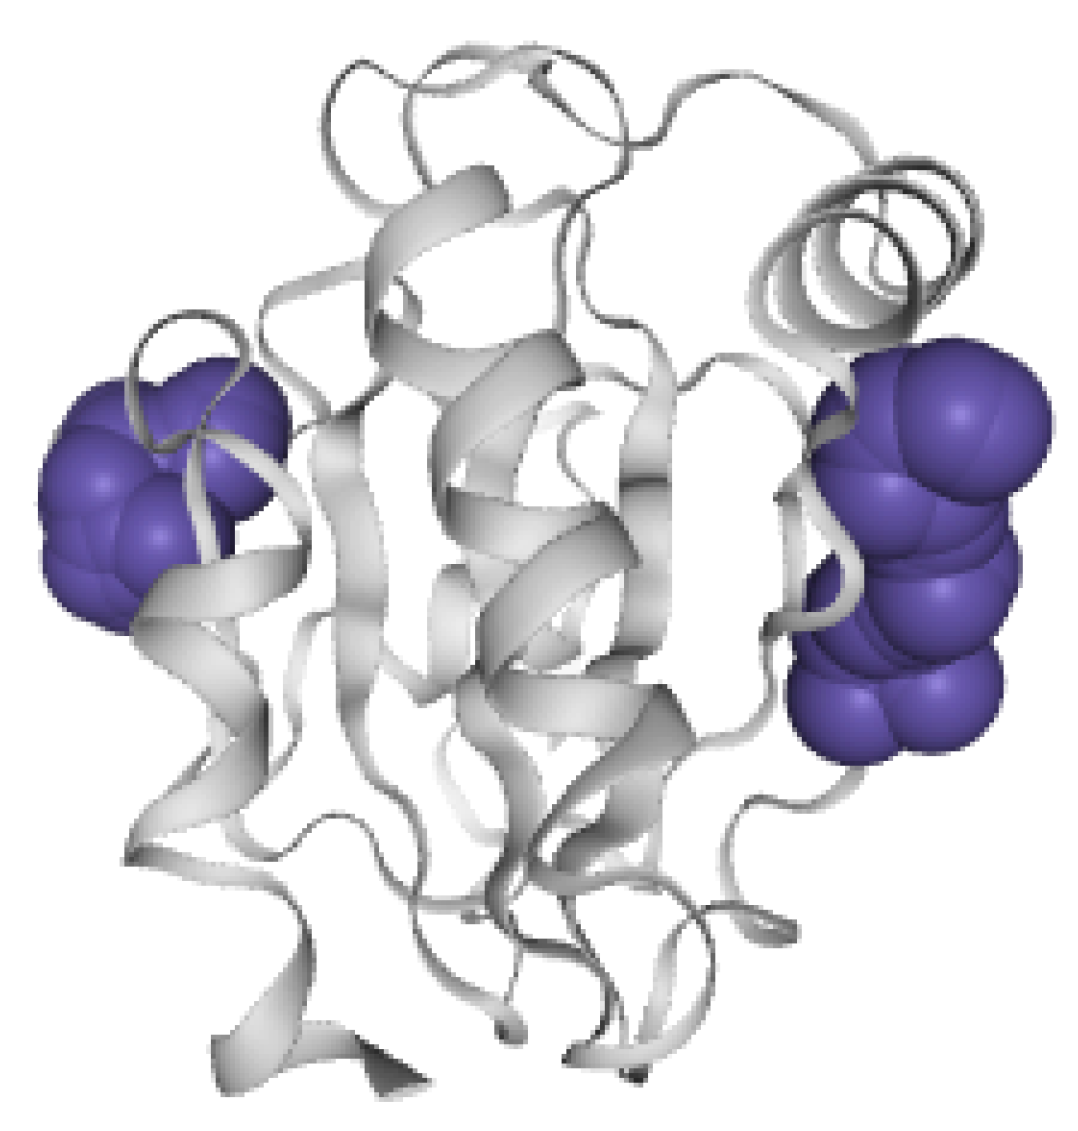
  • R4: Observe the spatial shape and position of molecular pockets. Biologists tend to perceive the real shape of pockets. The 3D display is an effective method by which to discover allosteric pockets and explore the spatial features of allosteric pockets, helping biologists establish the visual perception of molecular pockets.

4. VAPPD Overview

In this part, we will describe our work through two modules. The first module is dynamic pocket feature extraction. We briefly introduce the data processing flow and data processing methods. The second module is the progressive visual analysis module of the protein molecular pocket. This system summarizes the visual design of data. This paper introduces the visual analysis method of pocket features in different spatiotemporal scales.
In the dynamic pocket feature extraction module, compared with the original molecular structure, MD data retains more molecular information, which helps to improve the accuracy of pocket feature extraction. On the basis of previous research and expert consultation, we summarize the features of pockets that need to be analyzed in Section 3. The stability of the pocket itself is used to identify the priority pocket. The similarity of pockets is helpful to identify the allosteric pocket by comparing the orthosteric pockets. The physical and chemical properties of the pocket and the adjacent amino acids are used to screen the druggable pocket. We propose the following calculation methods to extract the features of molecular pockets. First, we use the method based on Voronoi to extract the alpha sphere representing the protein pocket, considering the alpha sphere is encoded based on its topological structure combined with its own shape feature. Secondly, we calculate the polarity and hydrophobicity of the encoded pocket through the reference scale [45] to reflect the physical and chemical properties of the pocket. Then we calculate the pocket volume by the Monte Carlo method. Due to the volatility of the pocket itself, to extract the pocket volume sequence, we need to use the Savitzky-Golay filter function to retain the sequence trend and remove the frequent noise points in the sequence. The pocket stability is expressed by the length and continuity of the existence time of the middle pocket in the extraction of the pocket volume sequence. Thirdly, the P2V-DTW algorithm is proposed. By performing two alignment operations on the sequence (different time length sequences and different alpha sphere number sequence) to calculate the correlation between high-dimensional pockets.
In the progressive visual analysis module of protein molecular pockets, our visualization method supports the observation, analysis, and exploration of the dynamic characteristics of pockets at different time and space scales. According to the requirements of Section 3, this module is divided into six scales according to the two dimensions of time and space. Different protein feature exploration schemes are designed for different spatiotemporal scales (Figure 2). Next, we introduce our spatiotemporal scale category.
According to the time scales, VAPPD is divided into three scales from top to bottom. In the time scales, our goal is to analyze the change trend of protein molecular pockets, including appearance, frequency, volume change, and disappearance. These three scales are global timescale (GTS), local timescale (LTS), and single timescale (STS). In GTS, the overall information of the pocket is explored, such as the overall change trend of the pocket shape, the volume change, and frequency of the pocket in the whole simulation time. In LTS, a more detailed analysis of the changes in the timestep of the pocket during scaling is carried out on the basis of the overall time scale. In STS, the shape of pockets in a single timestep is displayed.
According to the spatial scales, VAPPD is divided into three scales from left to right. The first scale represents total pockets (TP) in the protein. This scale shows the stability, similarity, and physicochemical properties of all pockets in general from the macro level. We can choose which pockets are of research value. The second scale represents the chosen pocket (CP). On this scale, the dynamic characteristics of different selected pockets are carefully compared. The focus is to observe the stability of the dynamic pocket itself and compare the similarities between different pockets. The third scale represents a single pocket (SP). Experts better study the physical and chemical properties of a single pocket through SP, which is suitable for analyzing the drug properties of the pocket.

5. Dynamic Pocket Feature Extraction

Alpha spheres representing protein molecular pockets are extracted from molecular dynamics simulation data, and protein molecular pocket data are encoded and represented by using the shape combined with topological characteristics of protein molecular pockets (R1R4). Different features are calculated for static and dynamic pockets. For static pockets, calculate the pocket volume, hydrophobicity, and polarity at each timestep. Among them, the pocket volume helps experts understand the state of pockets and proteins and find the pockets with a large volume according to the pocket volume to determine whether the pocket is more suitable for the entry and exit of reactants. The hydrophilicity and polarity statistics of molecular pockets helps experts to have a general understanding of the nature and composition of pockets. Dynamic pocket characteristics mainly include pocket volume sequence, pocket stability, and correlation. Pocket volume sequence obtains the change of pocket volume, the length of existence time, and the continuity of existence time. The pockets that have small changes and are more stable can also indicate the stability of the local structure of the protein. Pocket correlation provides the correlation index between two high-dimensional pockets, and provides experts with some pockets that are similar to the movement of orthosteric pockets. Based on this, we can infer the possible allosteric pockets.

5.1. Molecular Pocket Extraction

We use the Fpocket program based on Voronoi to process the trajectory data of protein molecular dynamics simulation and extract alpha spheres of molecular pockets (R1R4). Alpha sphere refers to a sphere that contacts four protein atoms on the boundary, but does not contain atoms inside (Figure 3a). The distance from four atoms to the center of the alpha sphere is equal. When four atoms are at the apex of a tetrahedron, the radius of the alpha sphere is close to the Van der Waals radius. For proteins, the smallest sphere is located inside the protein. The large sphere is located outside the protein, and the pocket corresponds to a medium radius sphere. Therefore, we can filter out the minimum and maximum radius to select the alpha sphere set of protein pocket (Figure 3b). Our approach is easily adapted to any existing solution. It only needs to input the list of the alpha sphere set forming the protein pocket and the list of surrounding atoms and amino acids, as well as additional information, such as the volume of alpha sphere, the number of surrounding atoms, and the physical and chemical properties of amino acids.
In the processing of alpha sphere coding, the topological structure features combined with its own shape features of alpha sphere are considered. The alpha sphere is defined by four adjacent vino graph vertices, where the vertices are protein atoms. Four protein atoms encode the topological structure of an alpha sphere, and 4 × m protein atoms encode m alpha spheres (one protein pocket). A group of amino acid residues around the pocket determine its physical and chemical properties, as well as its shape and position in the protein, which determines its function. The physicochemical features of protein pockets represented by alpha sphere sets are calculated by the physicochemical properties of amino acid groups near the encoded protein atoms, such as polarity and hydrophobicity. The shape of alpha sphere itself cannot be ignored. The volume of the alpha sphere is used to encode to express the morphological structure of the pocket itself; that is, a vector with a length of 5 is used to encode the alpha sphere. So a 5 × m represents a protein pocket (Figure 3c). According to the pocket data we extracted, the shape of the exit pocket is well represented, such as the number, position and radius of alpha spheres that make up the pocket. Then, according to these parameters, the depth of the exit pocket and the width of the pocket bottleneck is calculated.

5.2. Pocket Stability Calculation Based on Alpha Spheres

5.2.1. Pocket Hydrophobicity and Polarity Calculation

The hydrophilicity of amino acids on the lining pocket will affect the potential binding drugs of the pocket, and most of the pockets where the drug binding sites are located are pockets with better hydrophilicity. At the same time, the polarity of the pocket also helps experts in the field to further judge the physical and chemical properties of the potentially binding drugs in the pocket (R3).
Because the amino acids near the pocket are calculated by the alpha sphere, the amino acids near the adjacent alpha sphere may be repeated. We need to exclude this situation when calculating the hydrophilicity, hydrophobicity and polarity scores of the pocket. The amino acids lining the dynamic pocket sequence (Figure 4) are used to calculate the pocket hydrophilicity and polarity, and the amino acid hydrolysis and polarity scales were used in [46]. This is calculated as follows,
H S i j = A H S i j n i j
P S i j = A P S i j n i j ,
where H S i j and P S i j are the hydrophobicity and polarity scores of the ith timestep and jth cluster pocket. A H S i j and A P S i j are the total score of hydrophobicity and polarity of amino acids sets in the ith timestep and jth cluster pocket, and n i j is the number of alpha spheres in the ith timestep and jth cluster pocket.

5.2.2. Pocket Volume Sequence Extraction

Because the pockets composed of alpha spheres have local overlap, it is relatively difficult to calculate the pocket volume directly through geometric operations. The Monte Carlo method provides an effective method, which uses statistical simulation to simplify the calculation (R1). The ratio of the number of simulation points in the pocket to the total number of simulation points multiplied by the volume of the bounding box is the volume of the pocket. Calculate the pocket volume by the Monte Carlo method,
V p = N p V c N c ,
where V p is the value of the pocket volume, and N p is the number of random points in the pocket. The V c is the cube volume of package pocket, and N c is the number of total random points.
A major problem with the MD simulations method is that molecular jitter causes drastic data changes that cannot be directly observed on the whole timespan. Three schemes to assist the observation of pocket volume sequences are used in this paper: filtering, data compression, and data slicing. The Savitzky-Golay filter method [47] is a time-series data-filtering method based on a local polynomial least squares fit. The most important feature of this filter is to keep the original data shape and width unchanged. The volumes data compression method is also provided to compress the length of the volumes sequence by setting different compression rates. The filtering and data compression facilitate us to observe the trend of the full volume sequence, but it is difficult to observe the details of the data by these two methods. Therefore, the slicing operation of the sequence is provided to facilitate the establishment of an overall impression of the pocket, as well as to explore in-depth details.

5.2.3. Pocket Stability Representation

Pocket stability refers to the length and continuity of pocket existence time in molecular dynamics simulation (R1). The stability of pockets are used to track the changes of pockets, including their disappearance and appearance. Pockets with good stability ensure the stability of local structure of proteins. Drugs developed on allosteric pockets with high stability ensure their stable function. Our method combines visualization to express the stability of the pocket, and uses opacity to intuitively set the time node of the pocket. VAPPD helps experts in the industry to have an overall and intuitive sense of the changes in pocket stability in long-term pocket simulation, and helps experts to compare the stability between pockets. The more stable the pocket is, the higher the opacity is. The calculation method of stability is given as
opacity i = S T i r a t i o c ( i = 1 , 2 , , t o t a l t i m e s t e p / r a t i o c ) ,
where opacity i is opacity of the i time node, S T i is the number of times the ith time node pocket appears, r a t i o c the is compression ratio, and r a t i o c is the variable compression ratio.

5.3. High-Dimensional Pocket Similarity Calculation Based on P2V-DTW

We propose a high-dimensional pocket similarity calculation method based on P2V-DTW to solve the correlation calculation problem of unequal length sequences in high-dimensional data (R2). First, the molecular dynamic pocket is characterized by combining the topological and shape features of the pocket. Secondly, the Skip-Gram algorithm in Word2Vec model is used to generate the embedded vector representation of dynamic pockets. The dynamic pocket vector processed by the algorithm retains more pocket features than the pocket vector obtained from the static structure of molecules. Finally, the multiple dynamic time warping algorithm is used to deal with the problems of different time lengths and time-dependent dislocation of two dynamic pocket sequences, as well as the problems of different lengths and related dislocation of two static pocket alpha spheres.

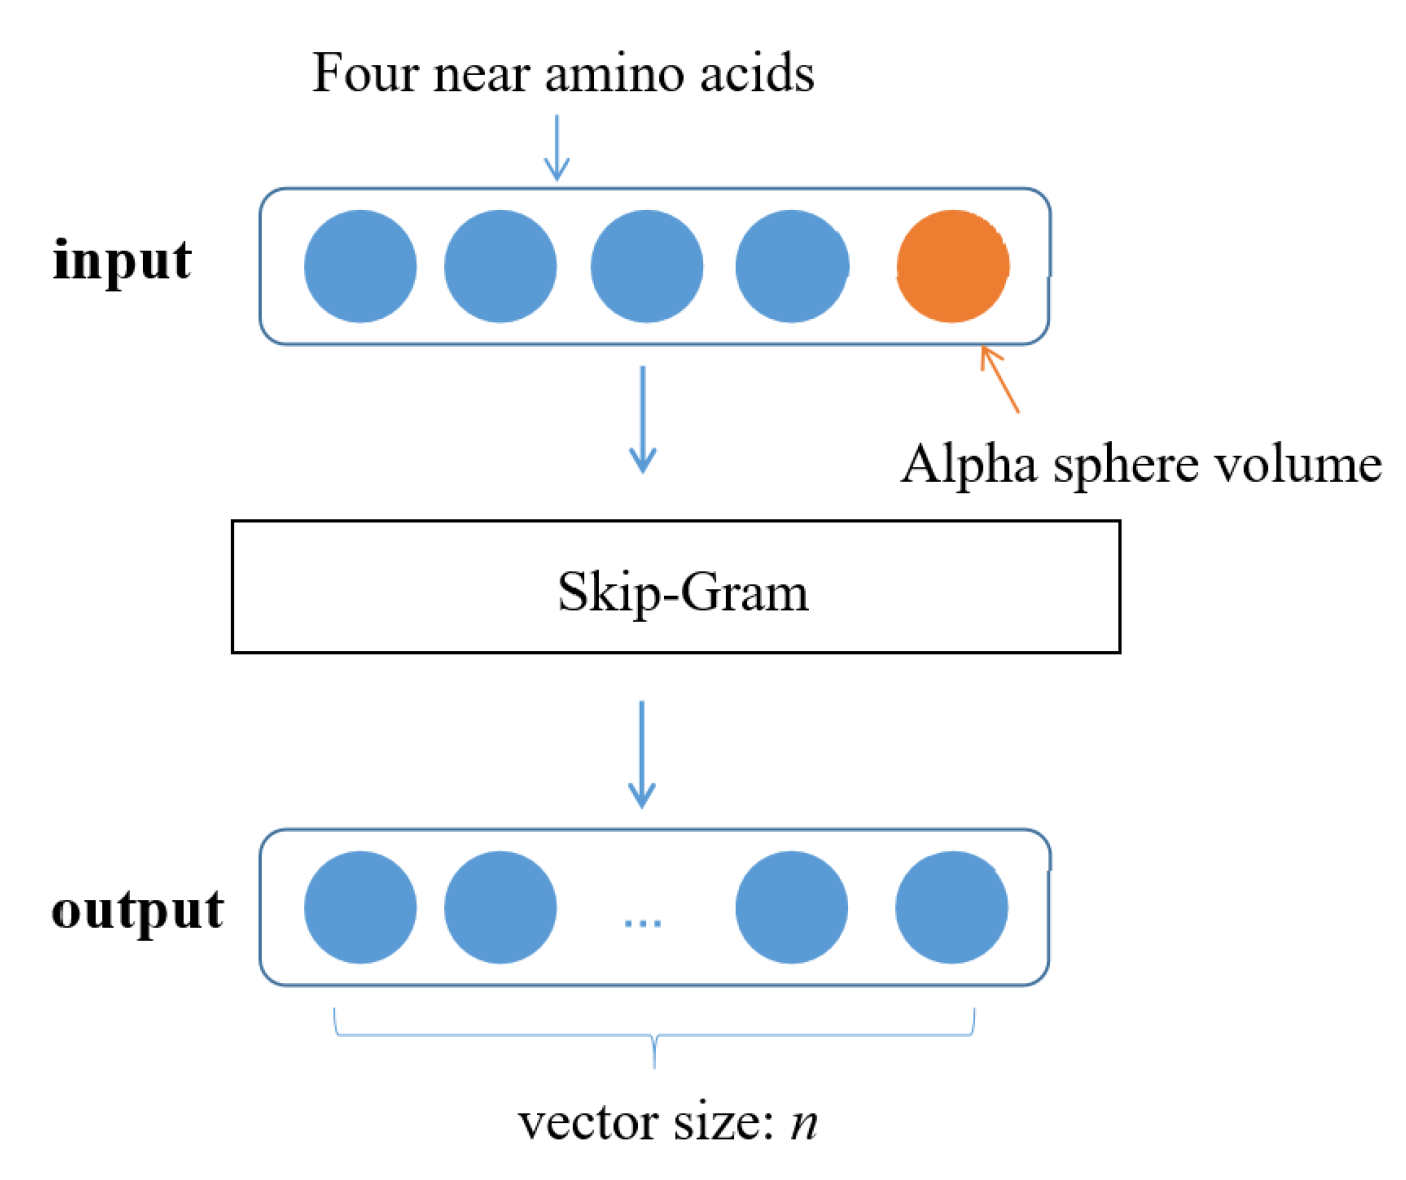
5.3.1. Pocket Word Vectorization Based on Word2Vec

To calculate the similarity of high-dimensional pocket data, there are four steps: extracting the alpha sphere of the pocket, processing the alpha sphere coding, pocket vectorization, and vector correlation calculation. The first two steps are described in Section 5.1. The vectorization of pocket words is shown in this section, and the correlation calculation of vectors is described in Section 5.3.2.
Our creative method introduces the vectorization method in NLP into the molecular dynamic pocket. It better preserves various features of alpha sphere to facilitate further analysis and process molecular pocket similarity. We use the Skip-Gram algorithm in the Word2Vec model to generate a distributed representation of dynamic pocket vectors. Alpha sphere (vector with length of 5) corresponds to words, pocket (matrix vector with length of 5 × m ) corresponds to paragraphs, dynamic pocket ( 5 × m × z ) corresponds to articles, and z is the timestep length of the dynamic pocket. The encoded protein pocket data is input as a Skip-Gram algorithm, and the generated pocket alpha sphere context vector output includes the topological relationship of the alpha sphere. If the size of the alpha sphere vector output by the model is set to n (Figure 5), and the protein pocket is composed of m alpha spheres, the calculated pocket embedded word vector size is n × m , and the dynamic pocket embedded word vector size of z timesteps is n × m × z .

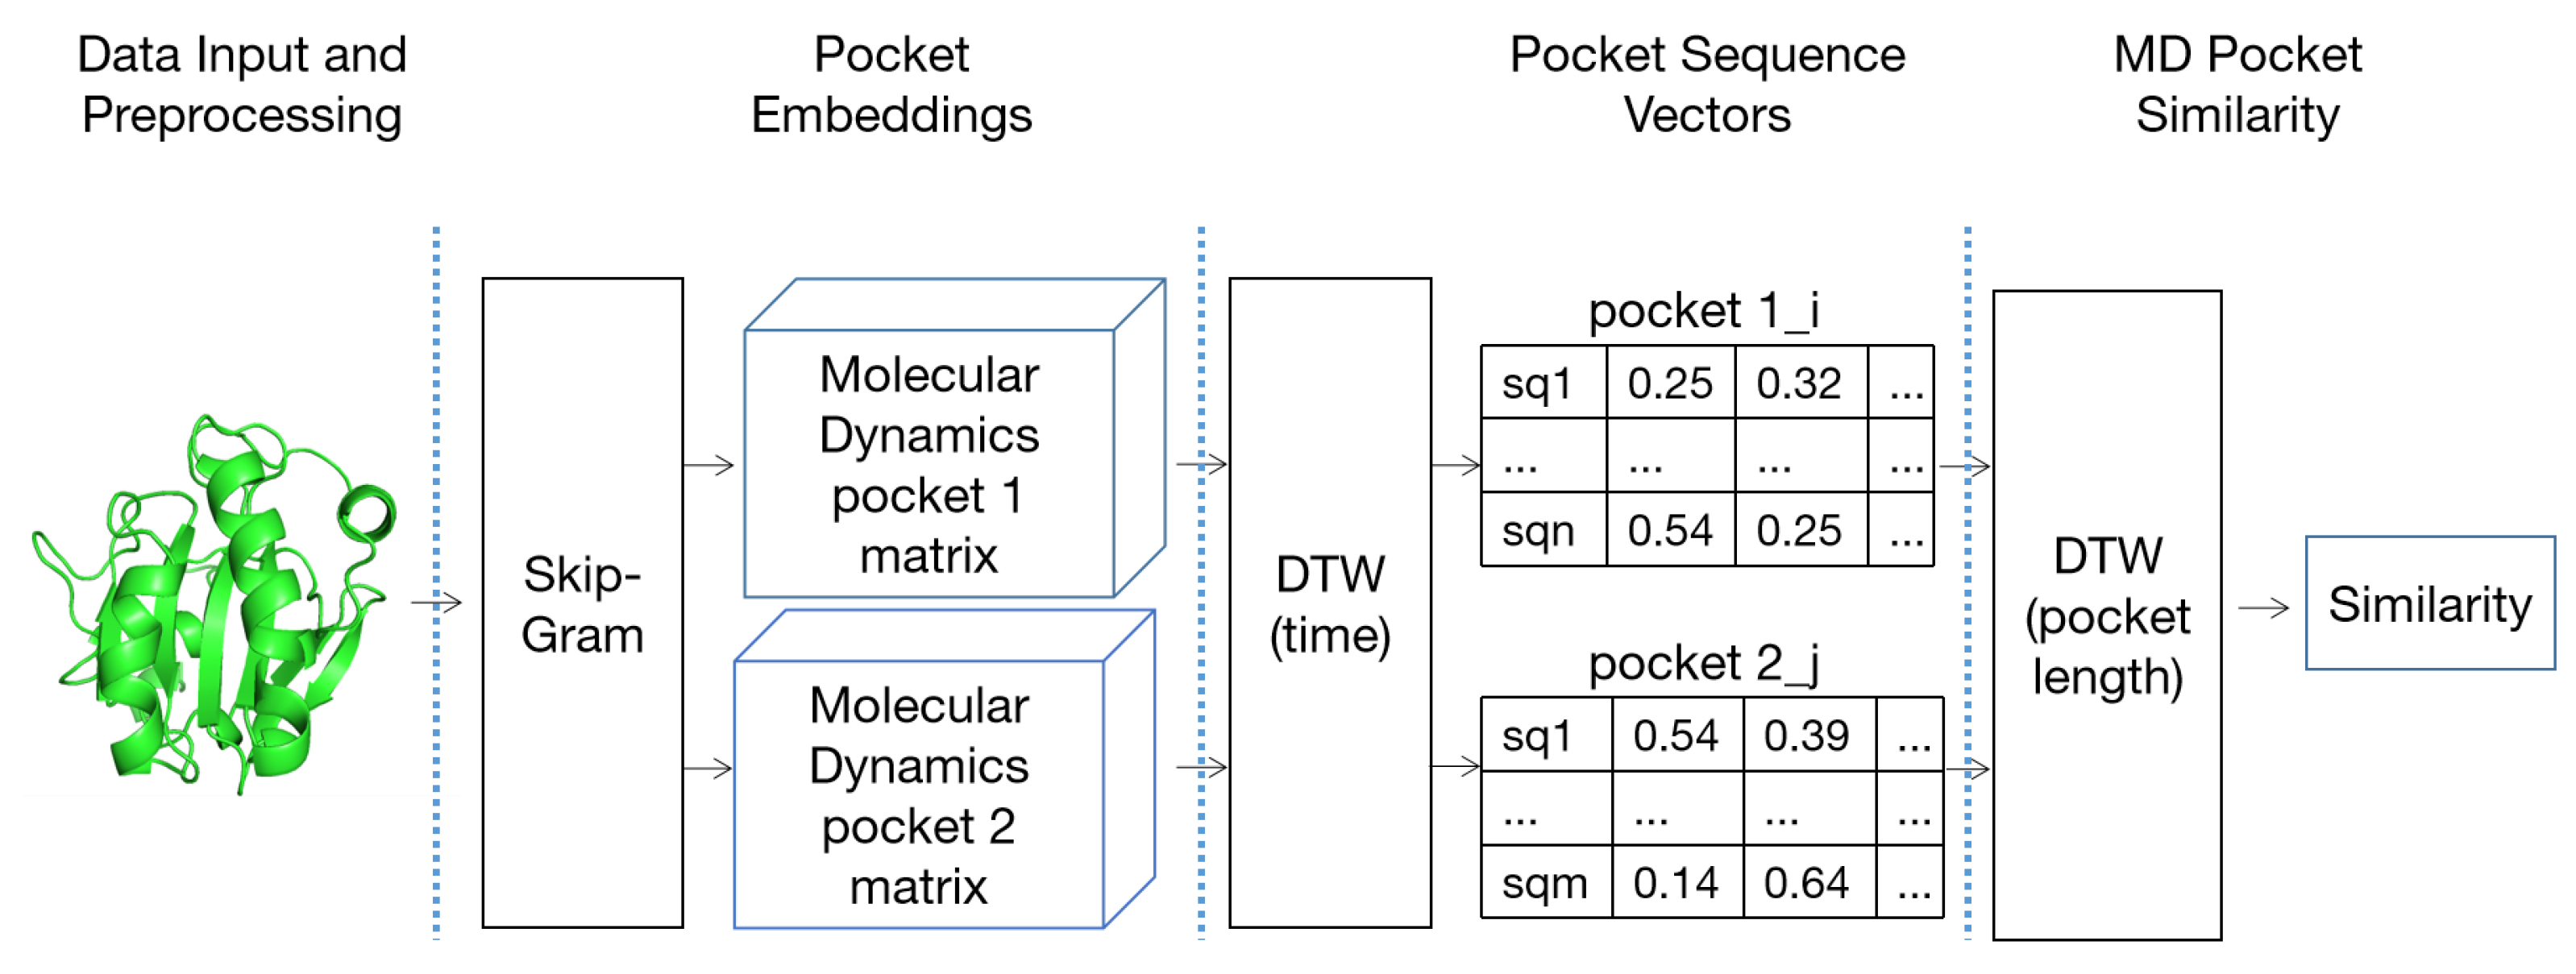
5.3.2. High-Dimensional Pocket Correlation Calculation Based on P2V-DTW

We propose a novel P2V-DTW algorithm to calculate the correlation between two dynamic pockets. The P2V-DTW algorithm is used twice to solve the problem of different time length sequences and different alpha sphere number sequences, and calculate the correlation between pockets (Figure 6).
First, calculate the distance between the mapping relationship of two static pocket vectors (the correlation between the two pocket alpha sphere vectors). Dist ( i , j ) represents the distance between the ith alpha sphere vector in the first pocket and the jth alpha sphere vector in the second pocket, Dist ( i , j ) given two vectors i and j, and the remaining chords are similar given by the dot product and the vector length as follows:
Dist ( P i , a 1 , P j , b 2 ) = n = 1 N P i , a 1 P j , b 2 n = 1 N ( P i , a 1 ) 2 n = 1 N ( P j , b 2 ) 2 ,
where n is the word vector (alpha sphere vector) length, and we choose the length of the word vector as N.
Secondly, the distance between two dynamic pockets is calculated (the correlation between two static pockets). When calculating the correlation between the two static pockets, the number of alpha spheres between the two pockets is different (m is different), so the alpha spheres of the two static pockets may have local relationship dislocation. For the second time, DTW is used to align the pockets with different alpha sphere lengths, establish the alpha sphere mapping relationship between the two static pockets, stretch and align the pocket vectors with different alpha sphere lengths through mapping, and obtain the static pocket alpha sphere mapping relationship matrix, so as to complete the alignment of pocket alpha sphere lengths and the correction of local dislocation of pocket alpha spheres. The calculation method is as follows:
L D ( P i , a 1 , P j , b 2 ) = D i s t ( P i , a 1 , P j , b 2 ) + min [ L D ( P i 1 , a 1 , P j , b 2 ) , L D ( P i , a 1 , P j 1 , b 2 ) , L D ( P i 1 , a 1 , P j 1 , b 2 ) ] ,
where L D represents the normalized path distance between two pocket length sequences, P i , a 1 represents the pocket 1 with timestep is ith, pocket length is a, P j , b 2 represents the pocket 2 with timestep is jth, and the pocket length is b.
Finally, when calculating the correlation between the two dynamic pockets, the timestep length of the two dynamic pocket matrix vectors is different (z is different), so the two dynamic pockets may have a dislocation relationship in local time. For the first DTW of dynamic pocket vector, the time mapping relationship between two dynamic pocket data is established. By mapping, two dynamic pocket vectors with different time lengths are stretched to the same length, and the dynamic pocket time mapping relationship matrix is obtained. The alignment of pocket time length and the correction of pocket local time dislocation are completed. The calculation method is as follows:
T D ( P i 1 , P j 2 ) = L D ( P i 1 , P j 2 ) + min [ T D ( P i 1 1 , P j 2 ) , T D ( P i 1 , P j 1 2 ) , T D ( P i 1 1 , P j 1 2 ) ] ,
where T D represents the normalized path distance between two different pocket time sequences, P i 1 and P j 2 represents the pocket 1 with timesteps is i length, and pocket 2 with timesteps is j length.
Dynamics pocket similarity is a scalar quantity normalised to be displayed as a pure quantity in the VAPPD system. The visualization system VAPPD is designed to help users understand the pocket characteristics of MD simulations through interactive exploration, which allows comparison throughout the dynamics process.

6. Progressive Visual Analysis of Protein Molecular Pockets

To allow domain experts to better explore the feature changes of pockets at different spatiotemporal scales, we propose a progressive visual analysis method for protein molecular pockets (R1R4).

6.1. Navigation View of GTS-TP

To analyze the stability, biochemical properties and correlation of pockets from a macroperspective, our method uses visual charts to show the volume change trend, hydrophilicity, and hydrophobicity of all pockets on a global time scale, as well as the correlation between pockets (R1R3). The navigation view of this part is designed by using the data in Table 1, and the calculation methods of each field shown in the table are described in Section 5.
The navigation view is divided into upper and lower parts (Figure 7). The upper part can be divided into two modules: the protein data loading module and the introduction module. The left side can input protein pocket number loading data, and the right side is the introduction of the protein. The fan-shaped color in the pie chart on the left side of the large picture in the lower part is calculated according to the hydrophobicity of the pocket. Amino acids on the lining pocket are divided into five categories according to the hydrophilicity. The higher the hydrophilicity, the bluer the coloring, the lighter the lower the blue. The lowest hydrophilicity is yellow. In the middle of the lower part of the big picture, the height of the line represents the pocket volume. Due to the violent shaking of molecules, the volume sequence of pockets fluctuates greatly, so it is difficult to observe the volume change trend through direct line chart statistics. Using the Savitzky-Golay filter, the time series filtering method for pocket volume can filter out some discrete data, so that the data retain the original change trend, which is convenient for experts to understand the pocket changes in the whole process of simulation. The small fluctuation of pocket volume sequence indicates that the pocket volume is stable, and a stable pocket can ensure the stability of the local structure of the protein. In the bar chart on the right of the large figure in the lower part, the length of the column indicates the correlation between pockets. The longer the length, the more similar the pockets are.

6.2. Pocket Comparison View

After understanding the changing trend of the properties and morphology of pockets in the whole molecular simulation [48], experts need to select some pockets of interest from the global time scale for detailed analysis in the pocket comparison view (R1R2). We designed a pocket comparison analysis method based on the deformed river map so that experts can better select the pockets of interest. At the same time, experts can explore pocket details by magnifying glass view, so as to compare single pockets in local time scales.

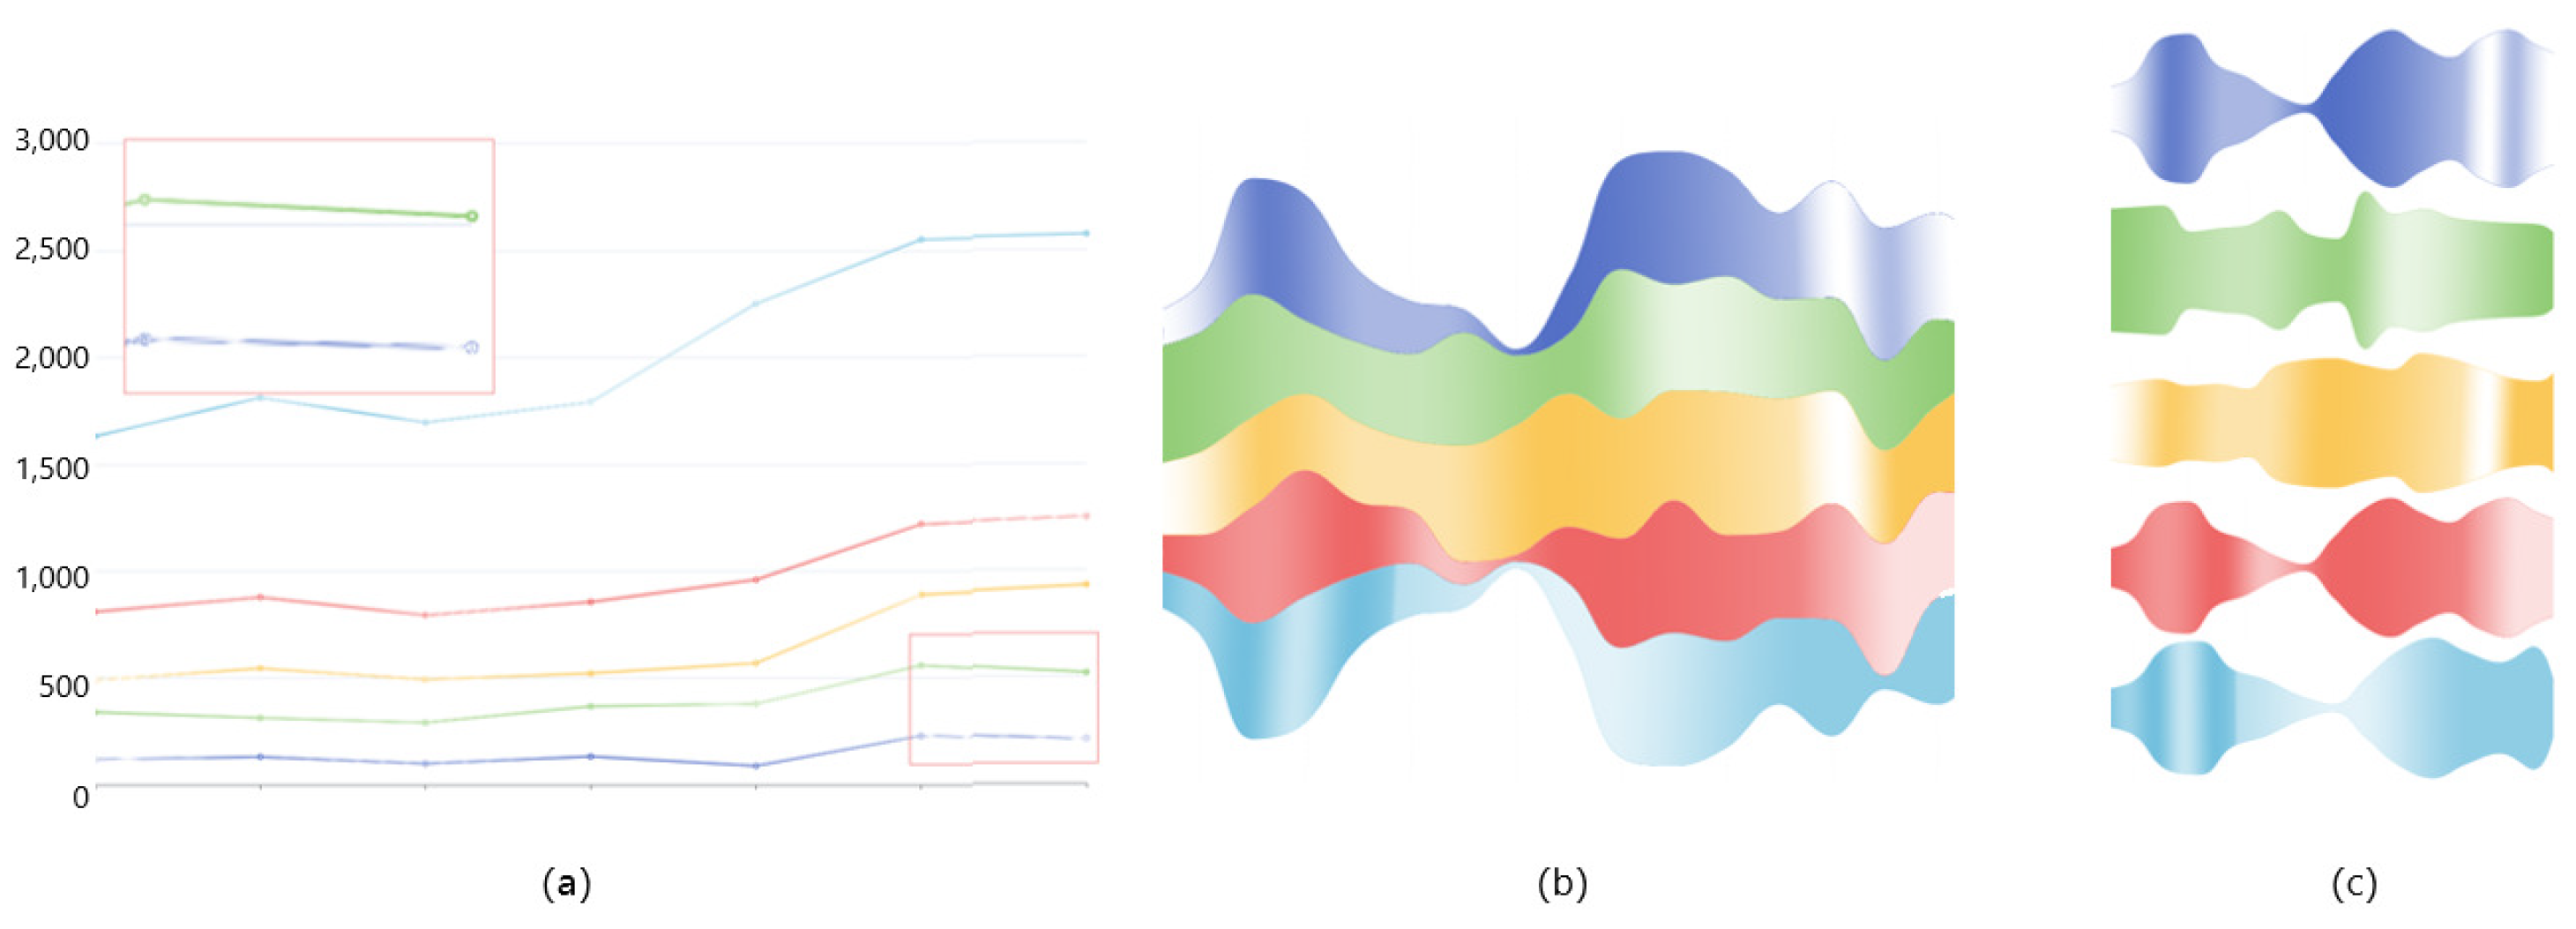
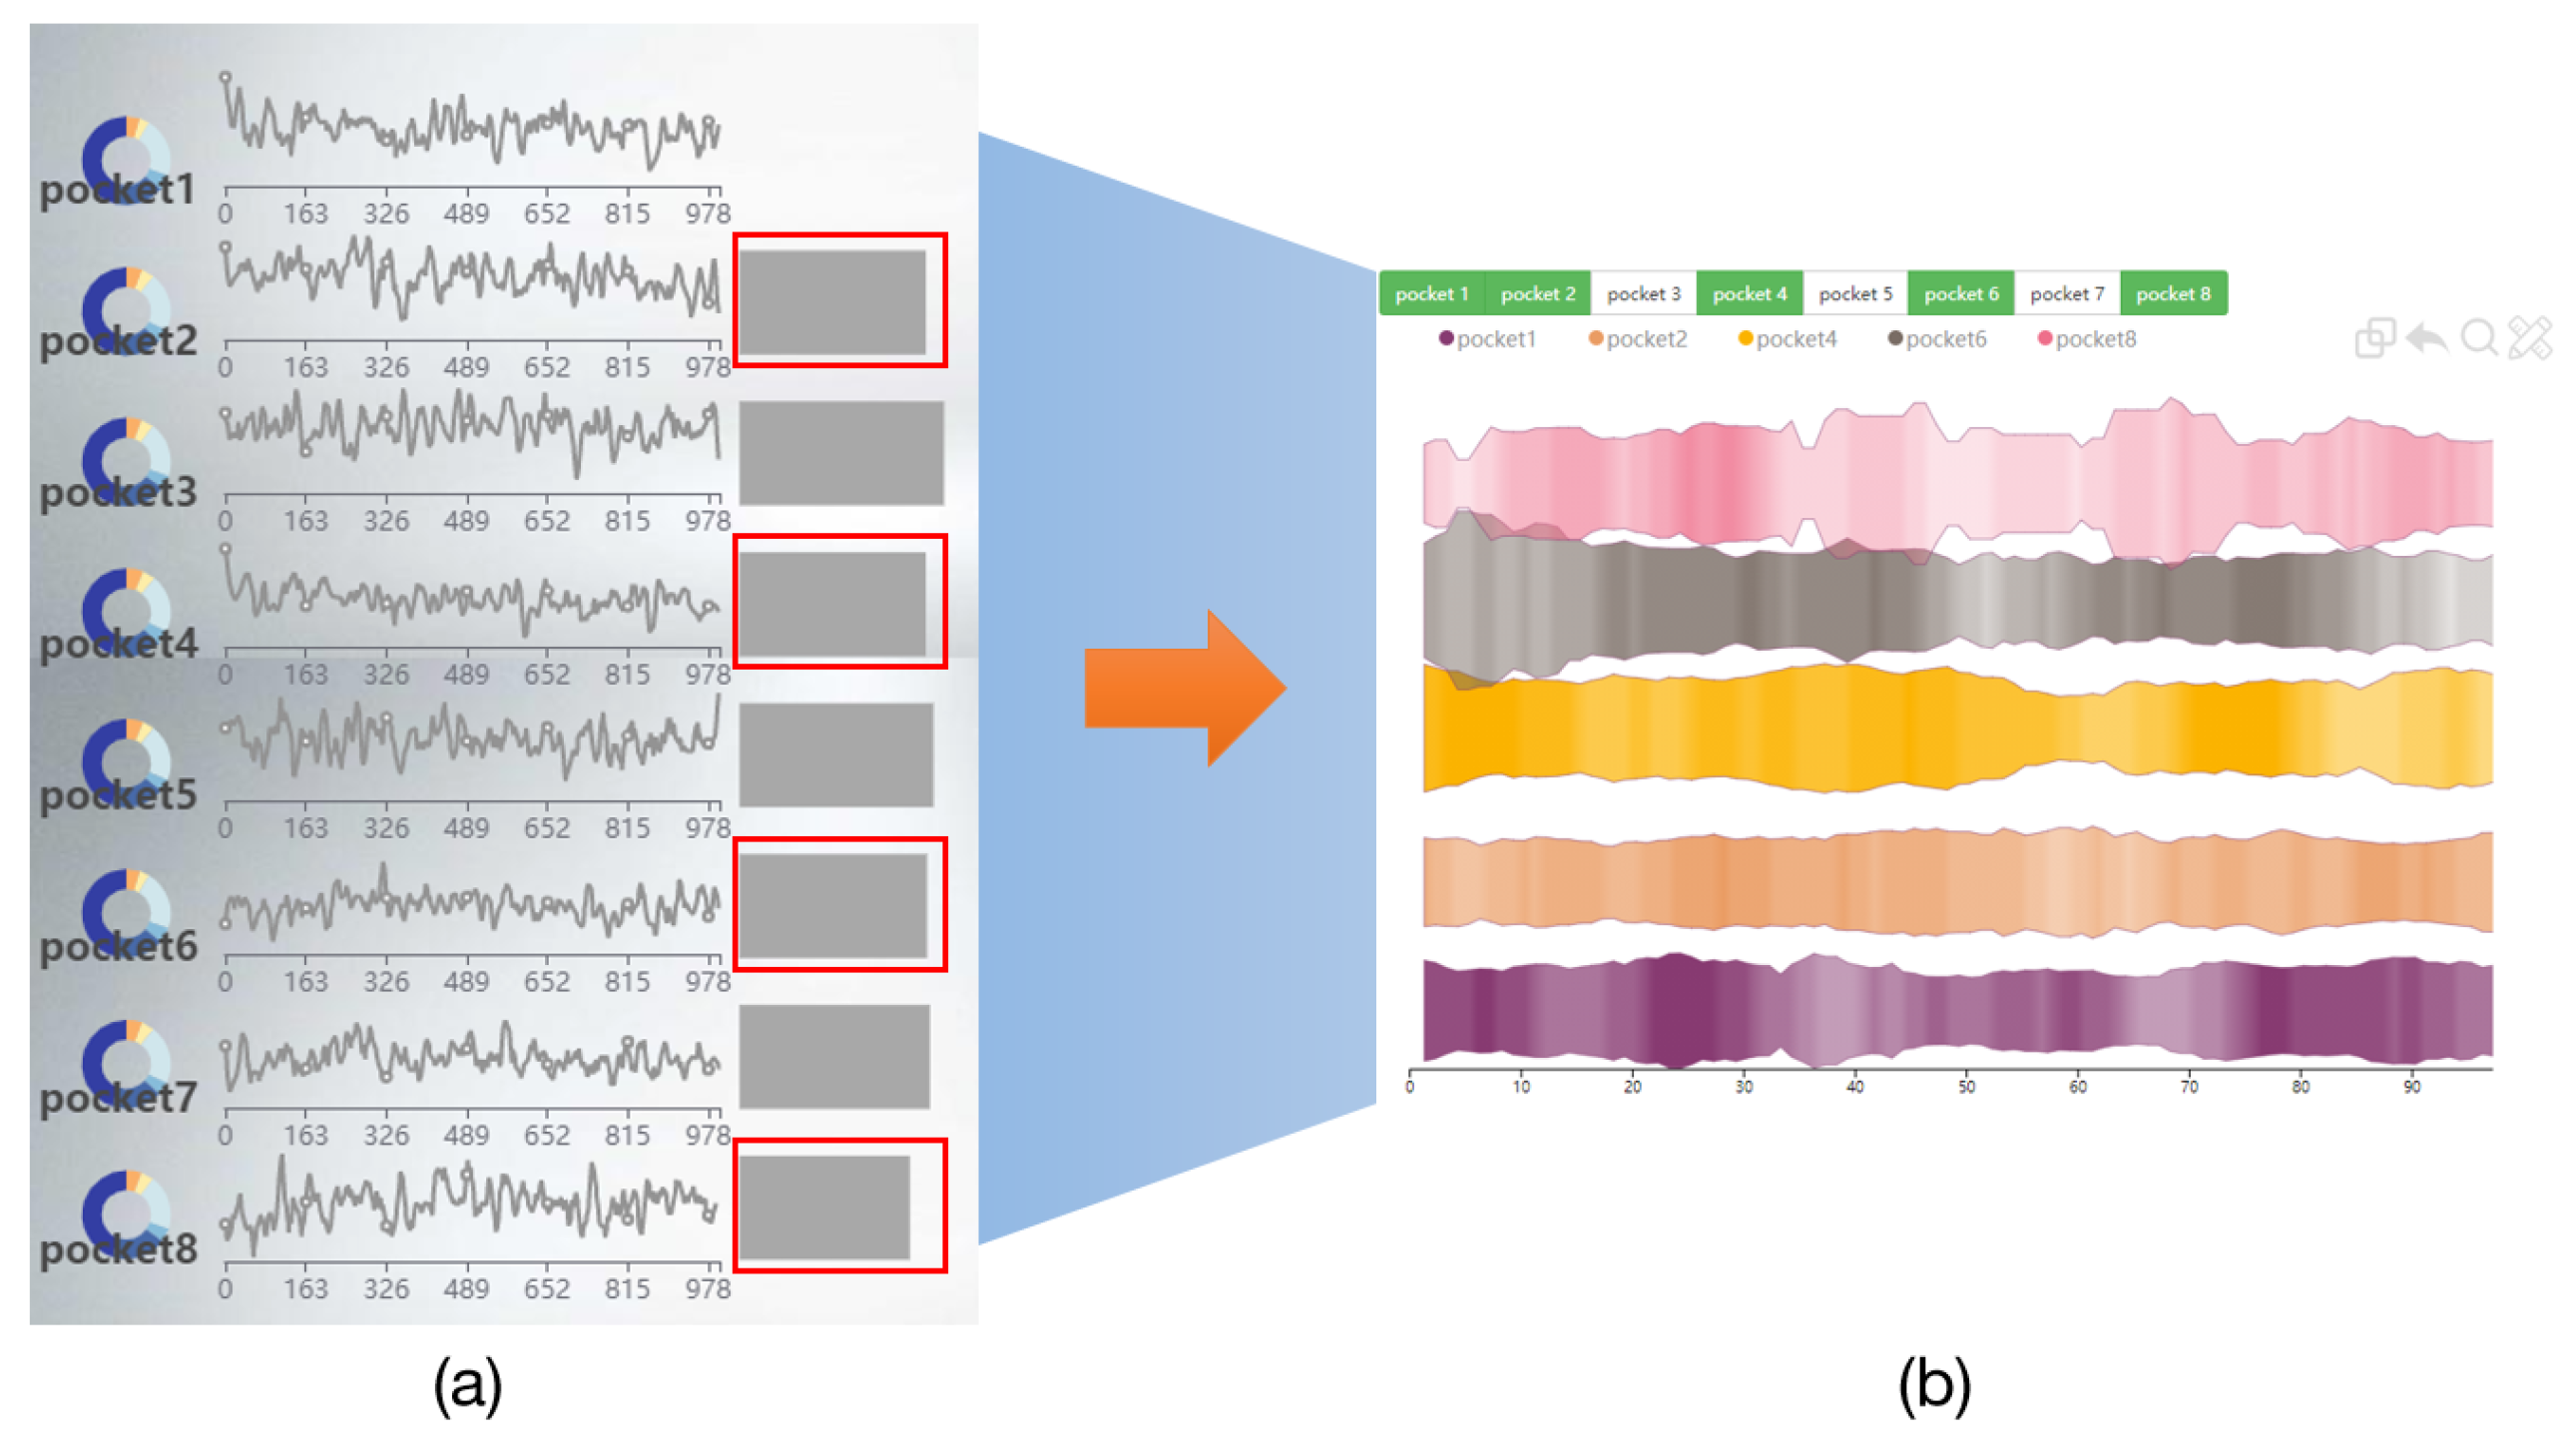
6.2.1. Comparison of Three Visualization Methods

We used three methods to quickly find the two most similar pockets among multiple pockets (R1R2). (1) We use the line chart with each line representing a different pocket, where the height of the line represents the pocket volume and different colored areas in each line represent different continuities. (2) We use the river chart, wheredifferent rivers represent different pockets, and the width of the river represents the pocket volume, and different colored areas in each river represent different continuities. (3) We use the deformed river chart, where each channel represents a pocket, and each channel is separate (Figure 8).
Comparing the visualization effects of the above three methods, the cooperative experts think that the deformed river map may be better. Comparing the line chart and the river chart, it is seen that there is a wider colored area in the river chart, and each pocket is displayed with a local river channel. Compared with the lines in the line chart, it shows more colored information, which is more conducive to comparing the similarity of pocket stability. Compare the river chart and the deformed river chart. When comparing several pockets at the same time, the deformed river chart makes the comparison between the two pockets clearer because each channel is separated by a certain distance. Therefore, the deformed river chart is finally selected for pocket comparison.

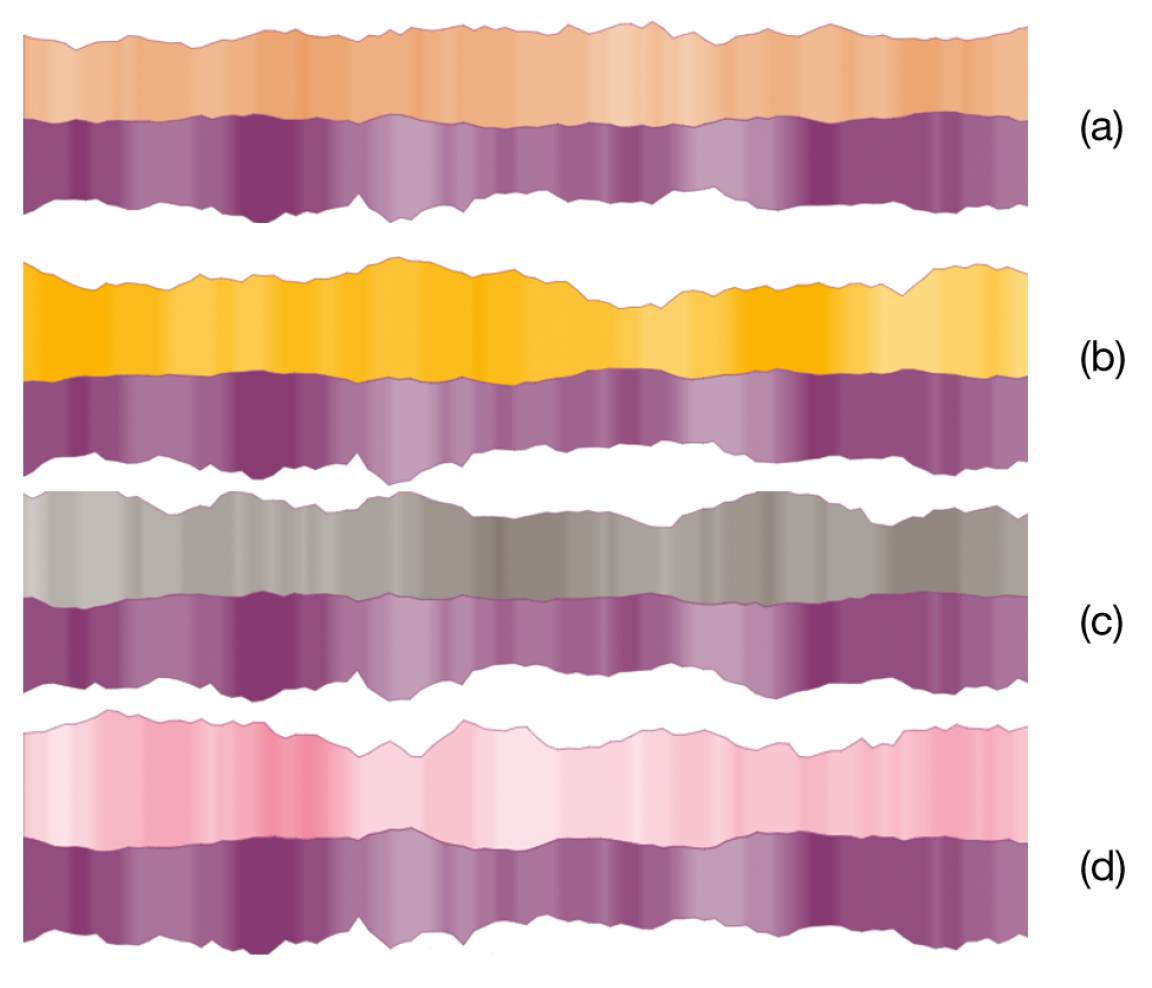
6.2.2. Deformed River Map of GTS-CP

The pocket comparison view can analyze the selected pocket on a global time scale (Figure 9). Analyze the stability of pockets through the volume change trend and the occurrence frequency of pockets, and analyze the similarity between pockets by comparing the volume of different pockets at the same time (R1R2).
Protein molecules normally react with ligands in pockets, which are important for comparing similarities between dynamic pockets due to the structural changes in the pockets that determine ligand entry. When analysing multiple pockets, experts are able to extract multiple pockets of interest and place them into comparison regions to compare pocket structural changes. The similarity between all pockets and the substrate pockets is calculated, and the four most similar pockets are selected for comparison with the substrate pockets, while a visualization method and a set of interactions are proposed to achieve comparative analysis between the pockets.
The pocket comparison view is divided into three parts, from bottom to top, including the river map area, component area, and pocket selection area. In the river map at the bottom, each river represents a pocket, the change of pocket volume is represented by the change of river width, and the change of river opacity represents the change of pocket frequency. The upper right corner is the component area, which provides some interactive operations in the river map area. From left to right are the merge component, the restore component, the magnifying glass component, and the draw component. The merge component can control each river in the river map area by clicking to merge different rivers. The restore component can restore the merged state of the river. The magnifying glass component can open a new view to show the characteristics of the local pocket (Figure 10).
The drawing component can draw the characteristic view of the pocket after selecting the local characteristics of the pocket. The pocket selection area at the top can select different pockets displayed in the river map area by clicking.

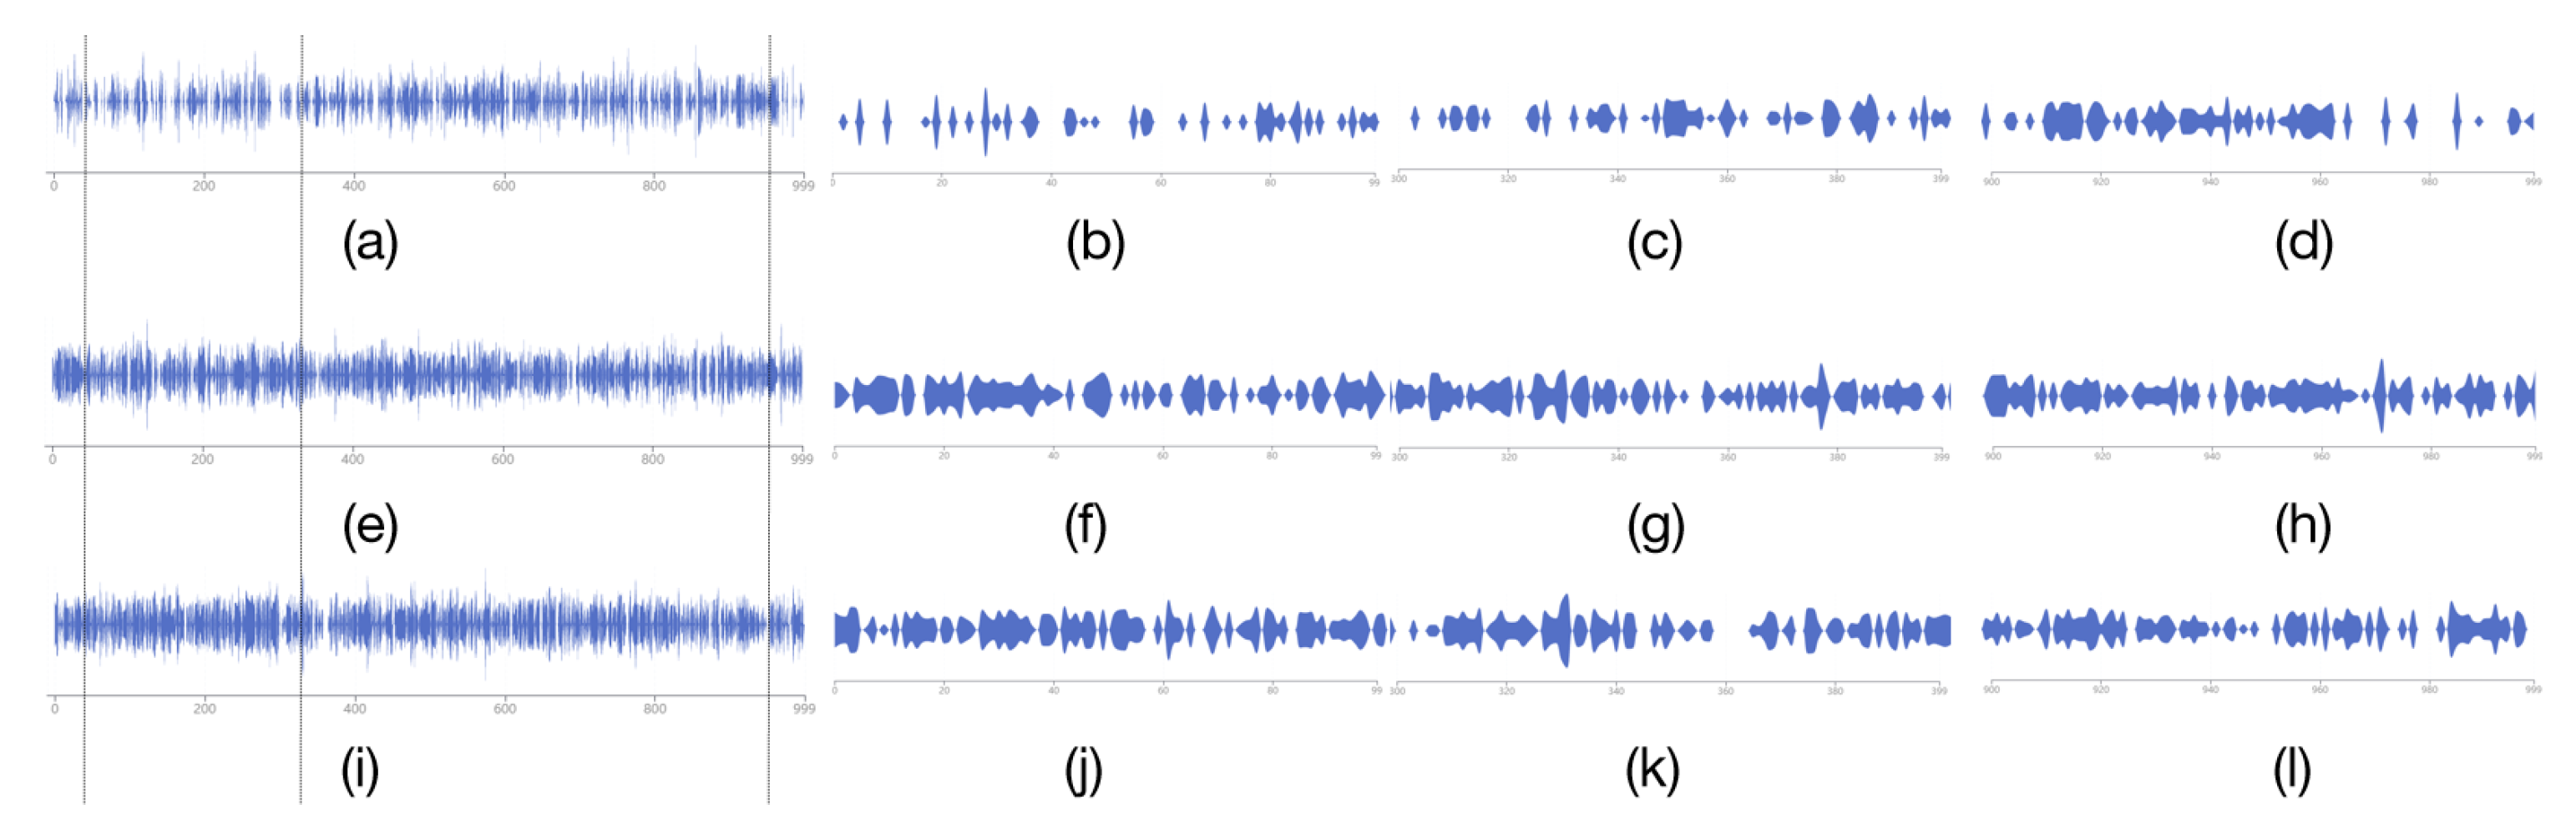
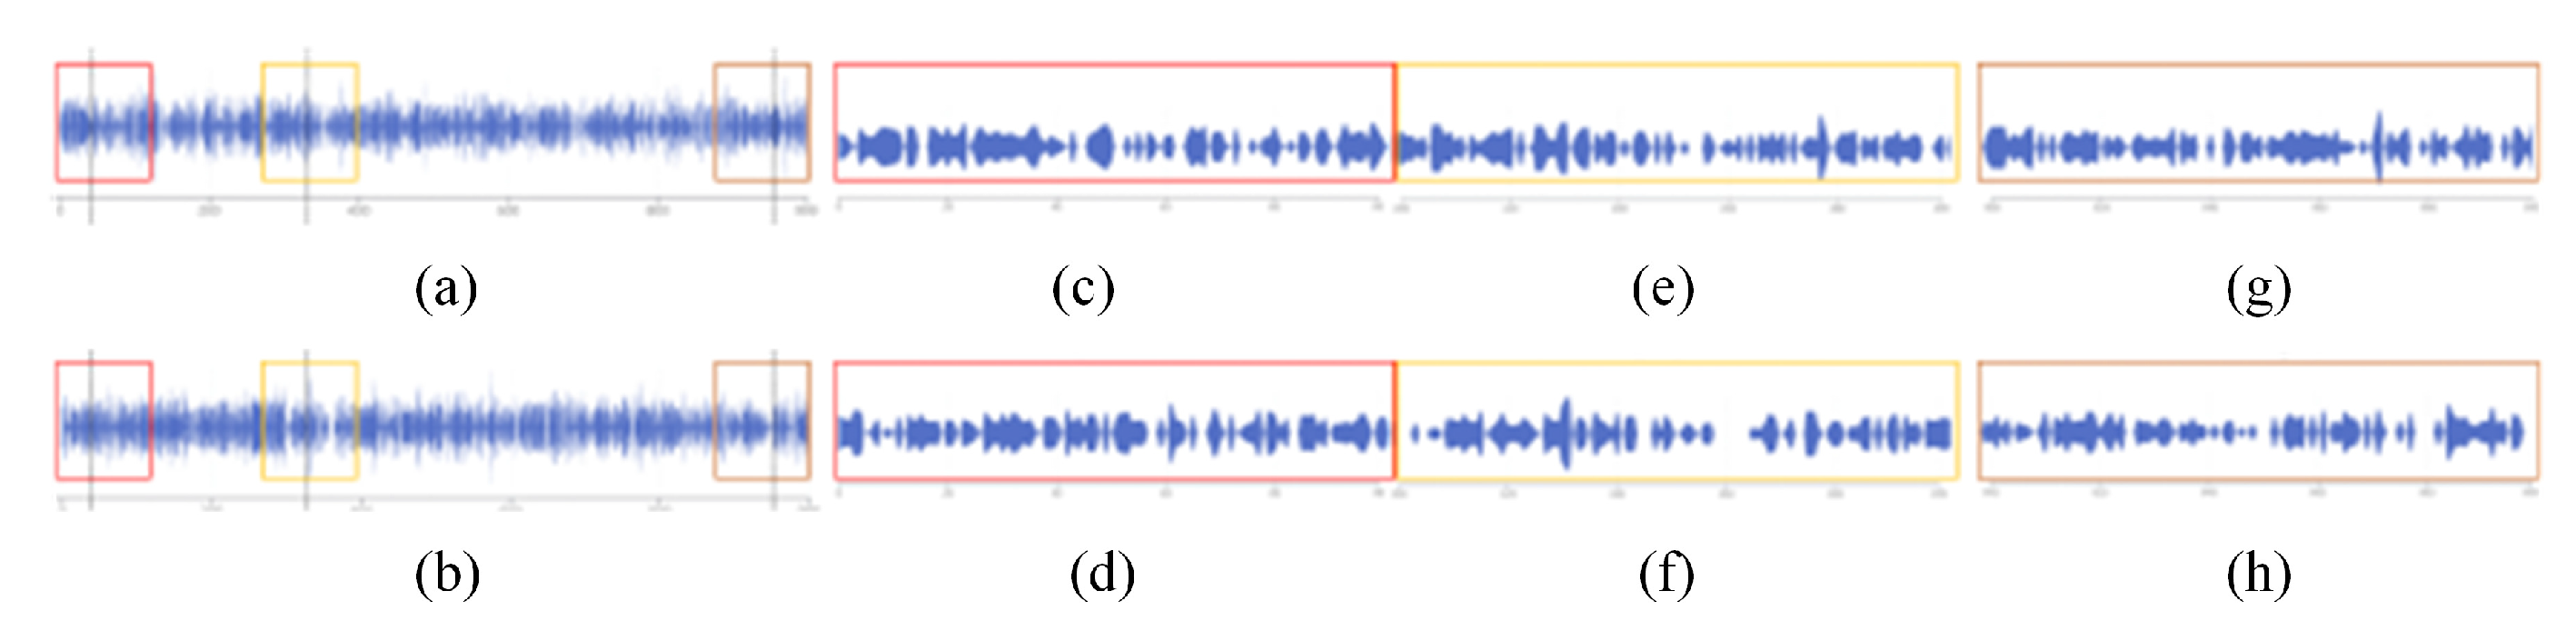
6.2.3. Magnifying Glass View of LTS-SP

To improve the efficiency of pocket comparison, the pocket comparison view designed provides a complete set of interaction schemes including component areas, allowing experts to explore pocket details (R1R2) layer by layer through interaction methods.
  • The P2V-DTW algorithm is provided in the pocket comparison area to compare pockets, and users are also supported to manually switch pockets for comparison.
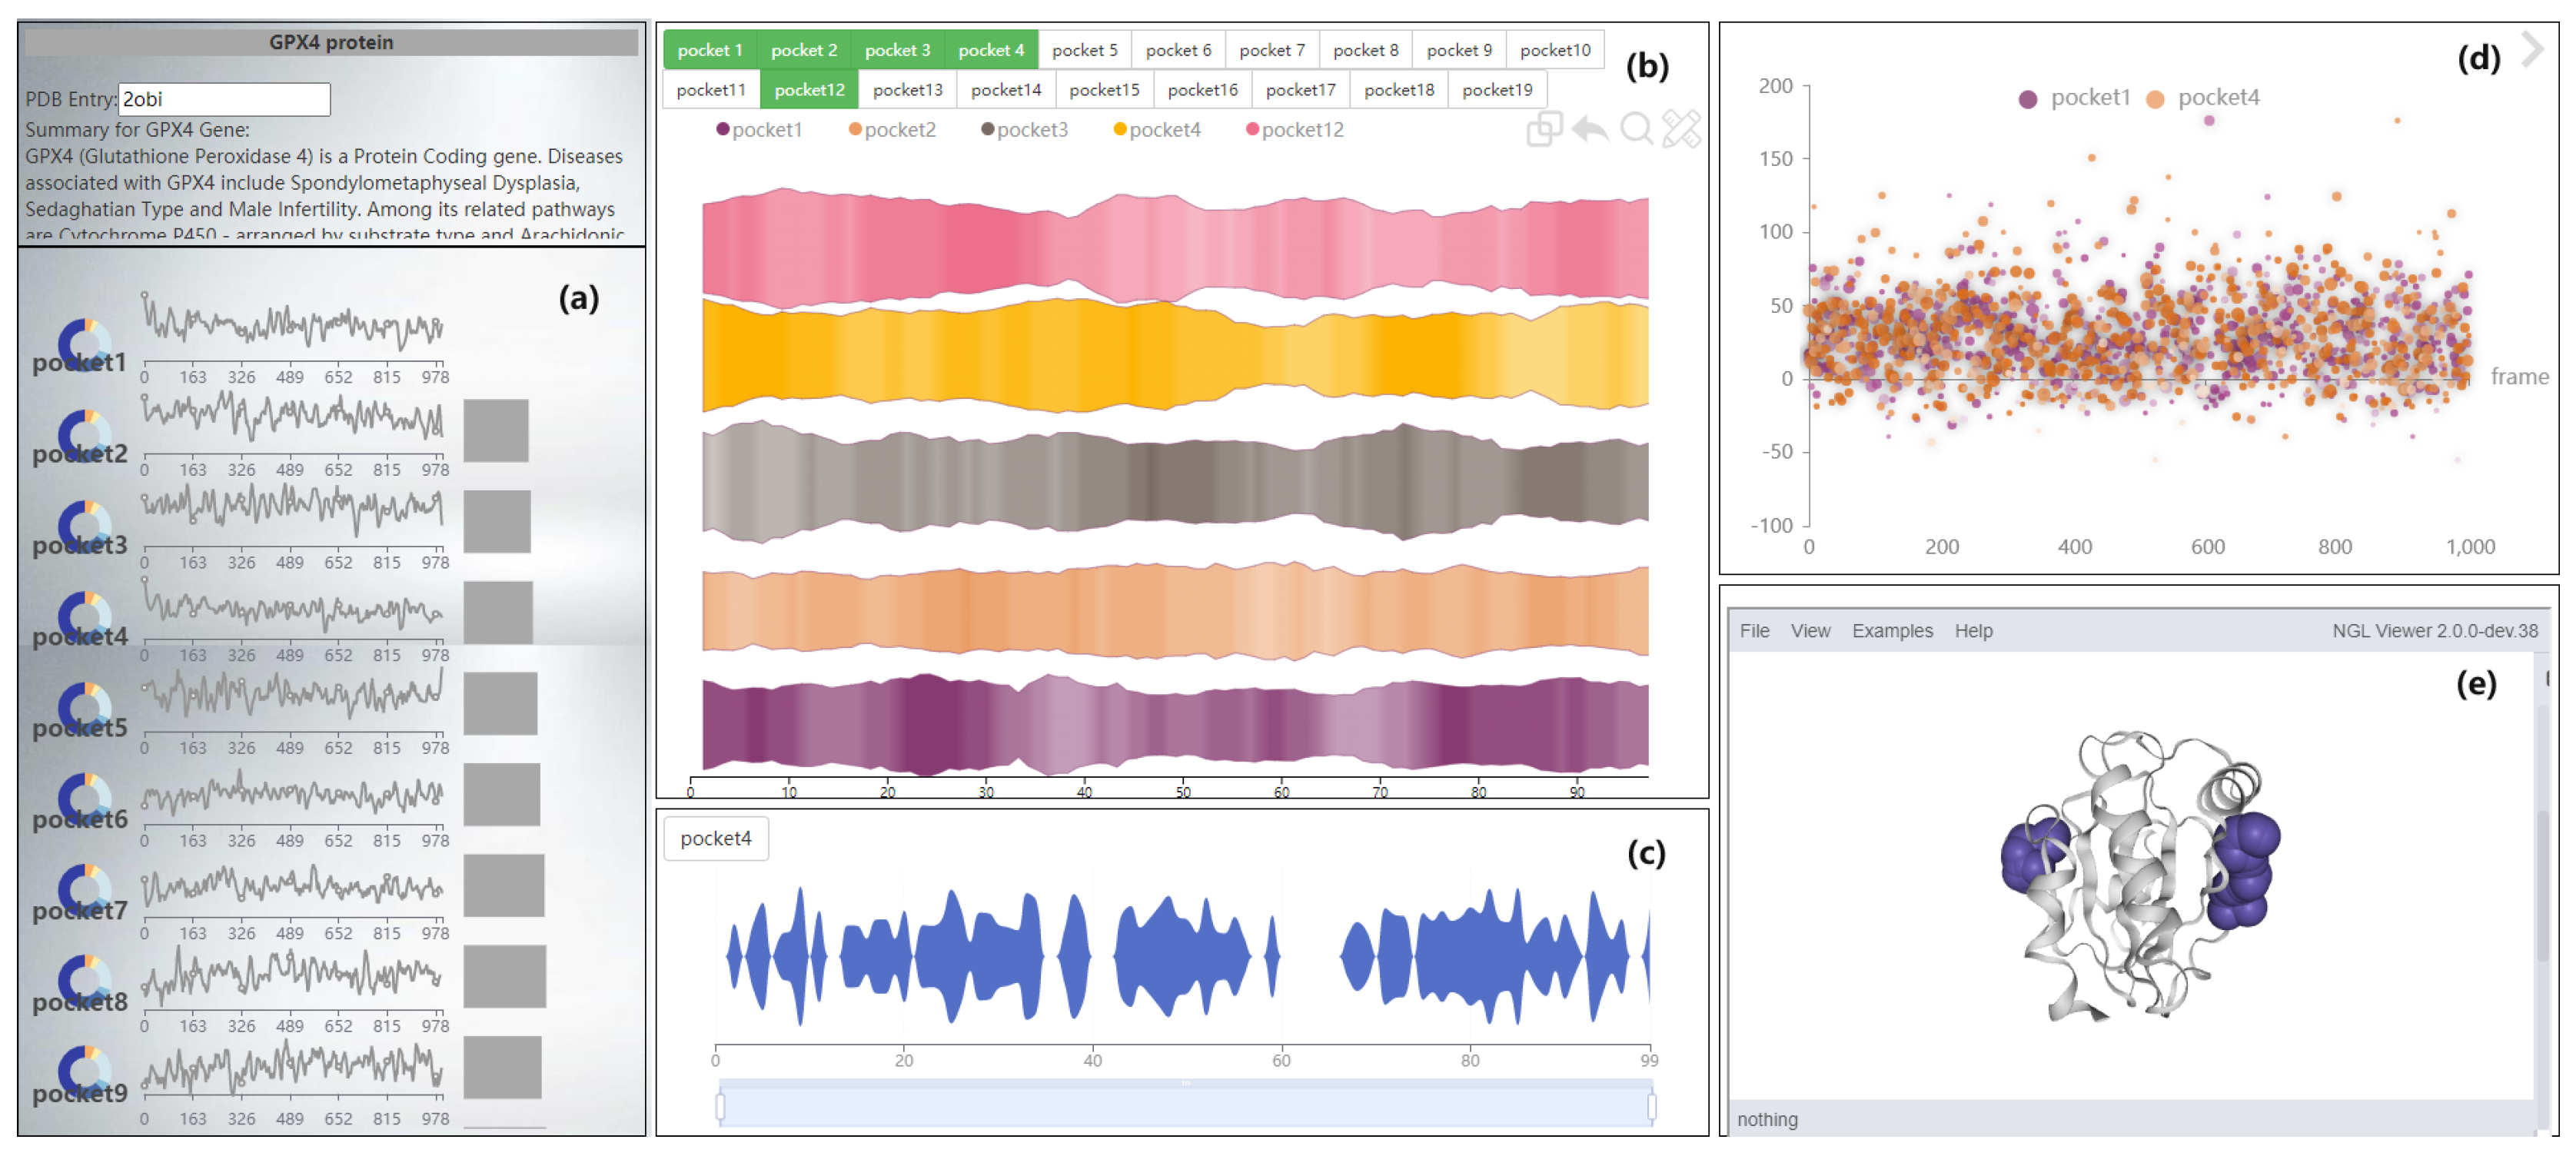
  • Provide a method for detecting subtle changes in a molecular dynamics pocket after compression. When comparing pockets, the user wants to get an overview of two pockets, and compare more details. A method of slicing the data is provided to help users to better compare the pockets, and a focus river chart is used to present the sliced data. When the magnifying glass component is activated, the focus river chart follows the mouse to zoom in and out. Clicking the left mouse button will pause or start updating the data (Figure 10).
  • Support for adjusting the extent of data display when observing subtle features of pockets. Interaction has been added to the focal river chart to adjust the size of the data slices by sliding the mouse wheel up to increase the magnification and down to decrease the magnification.
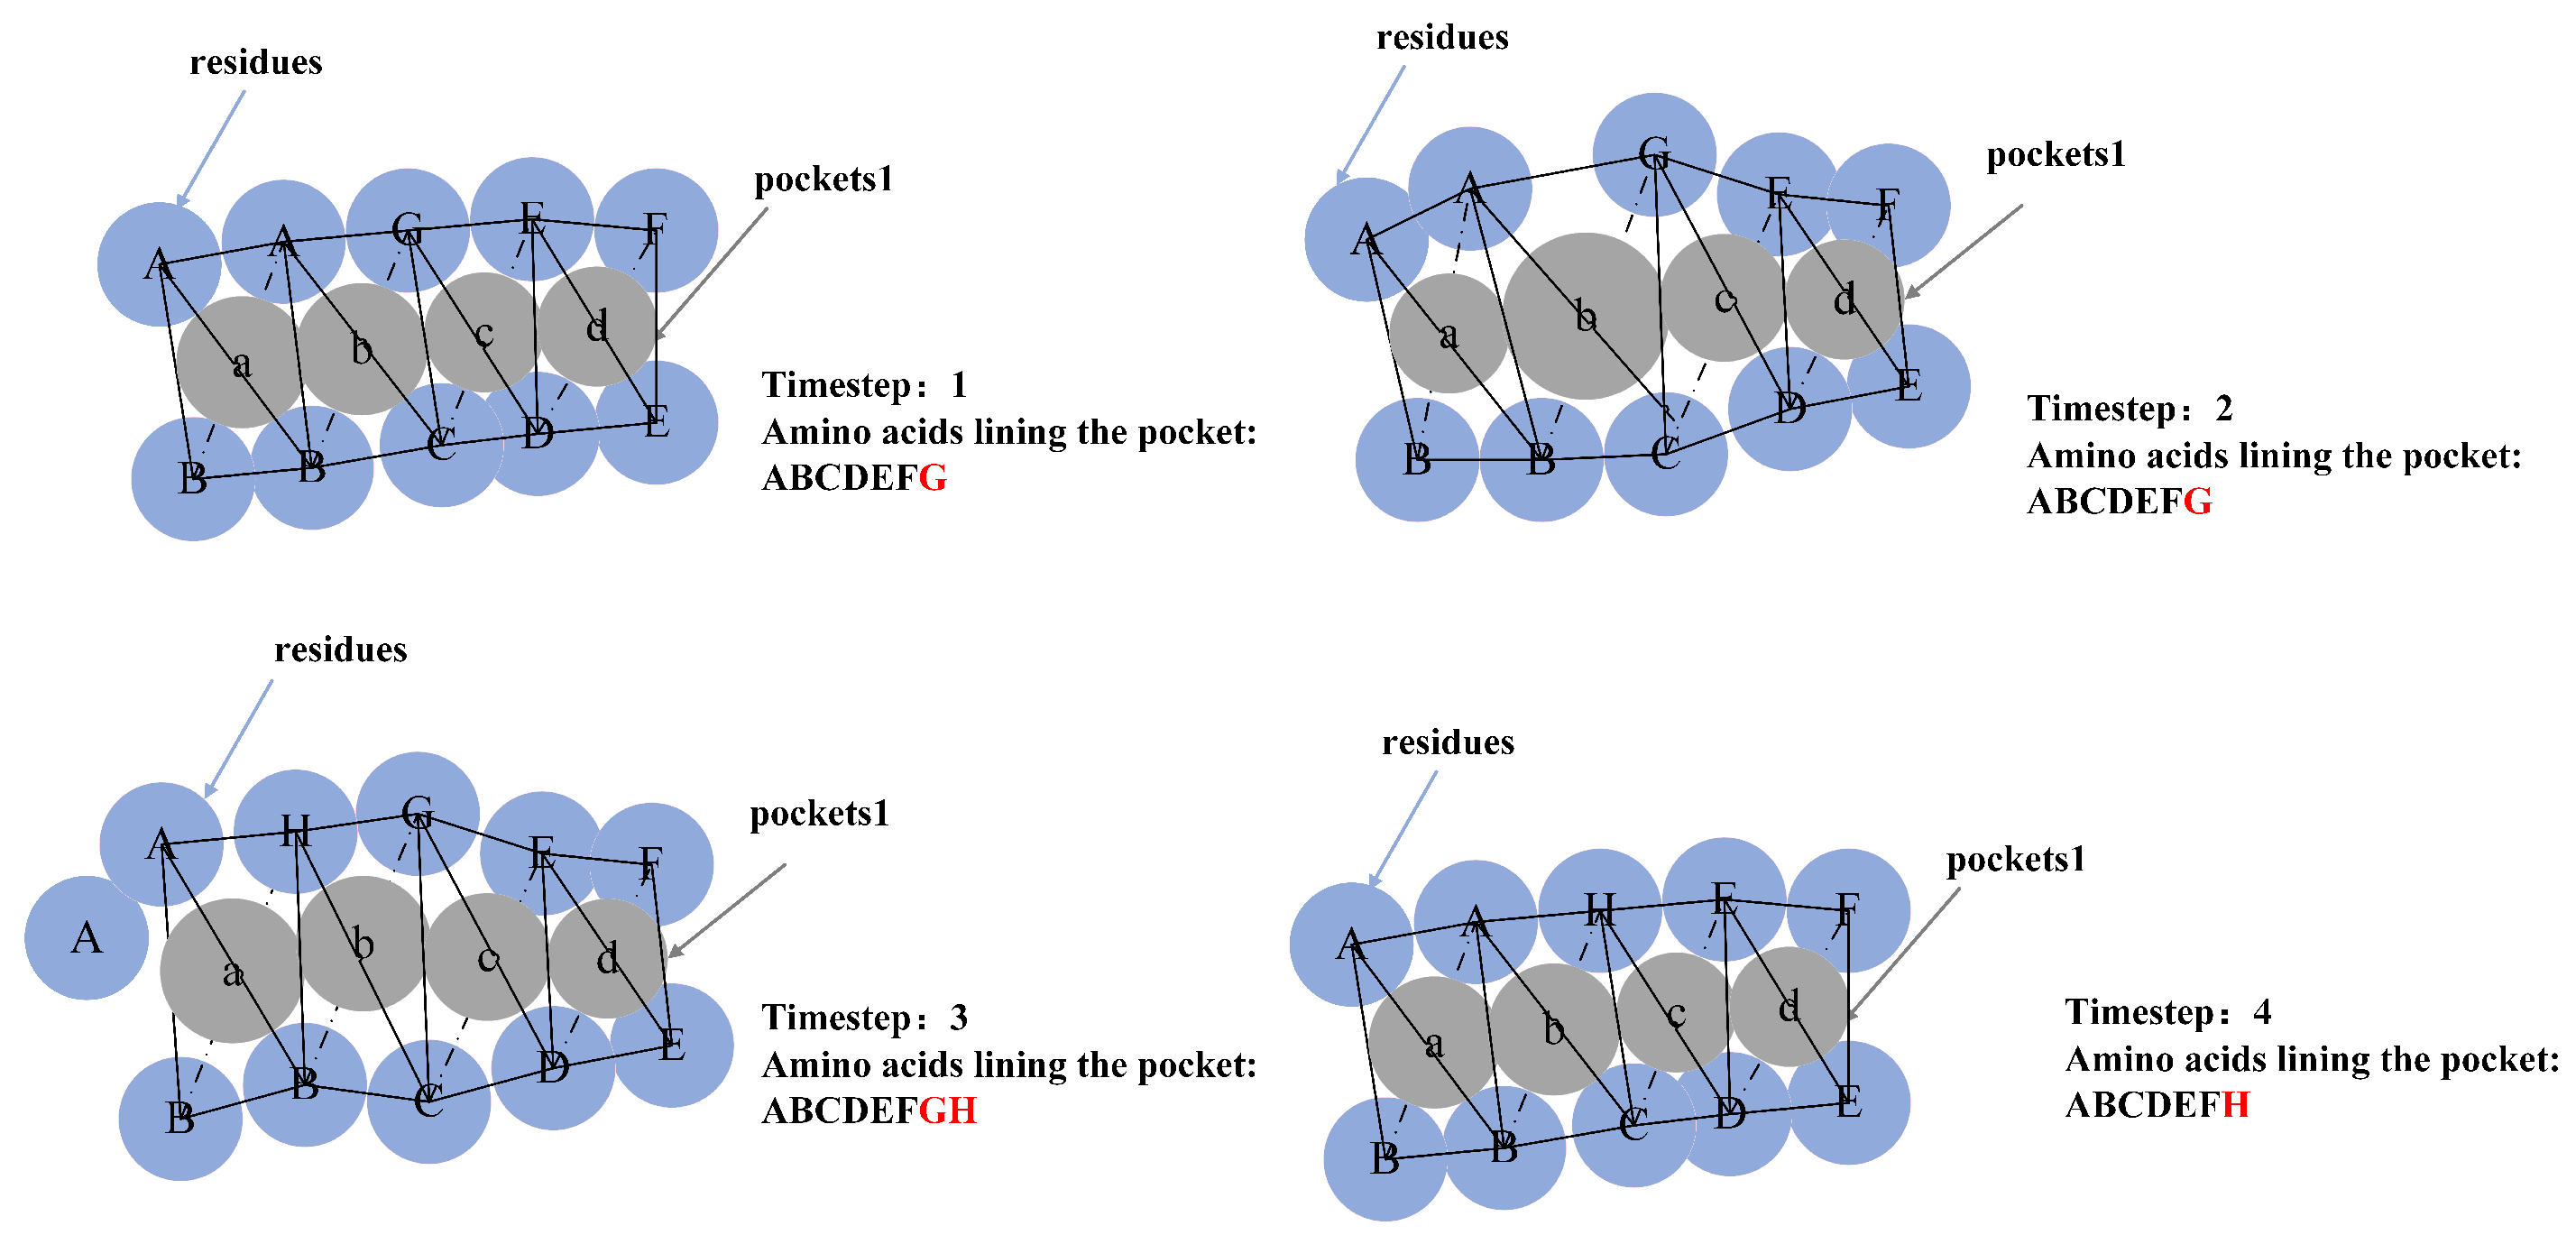
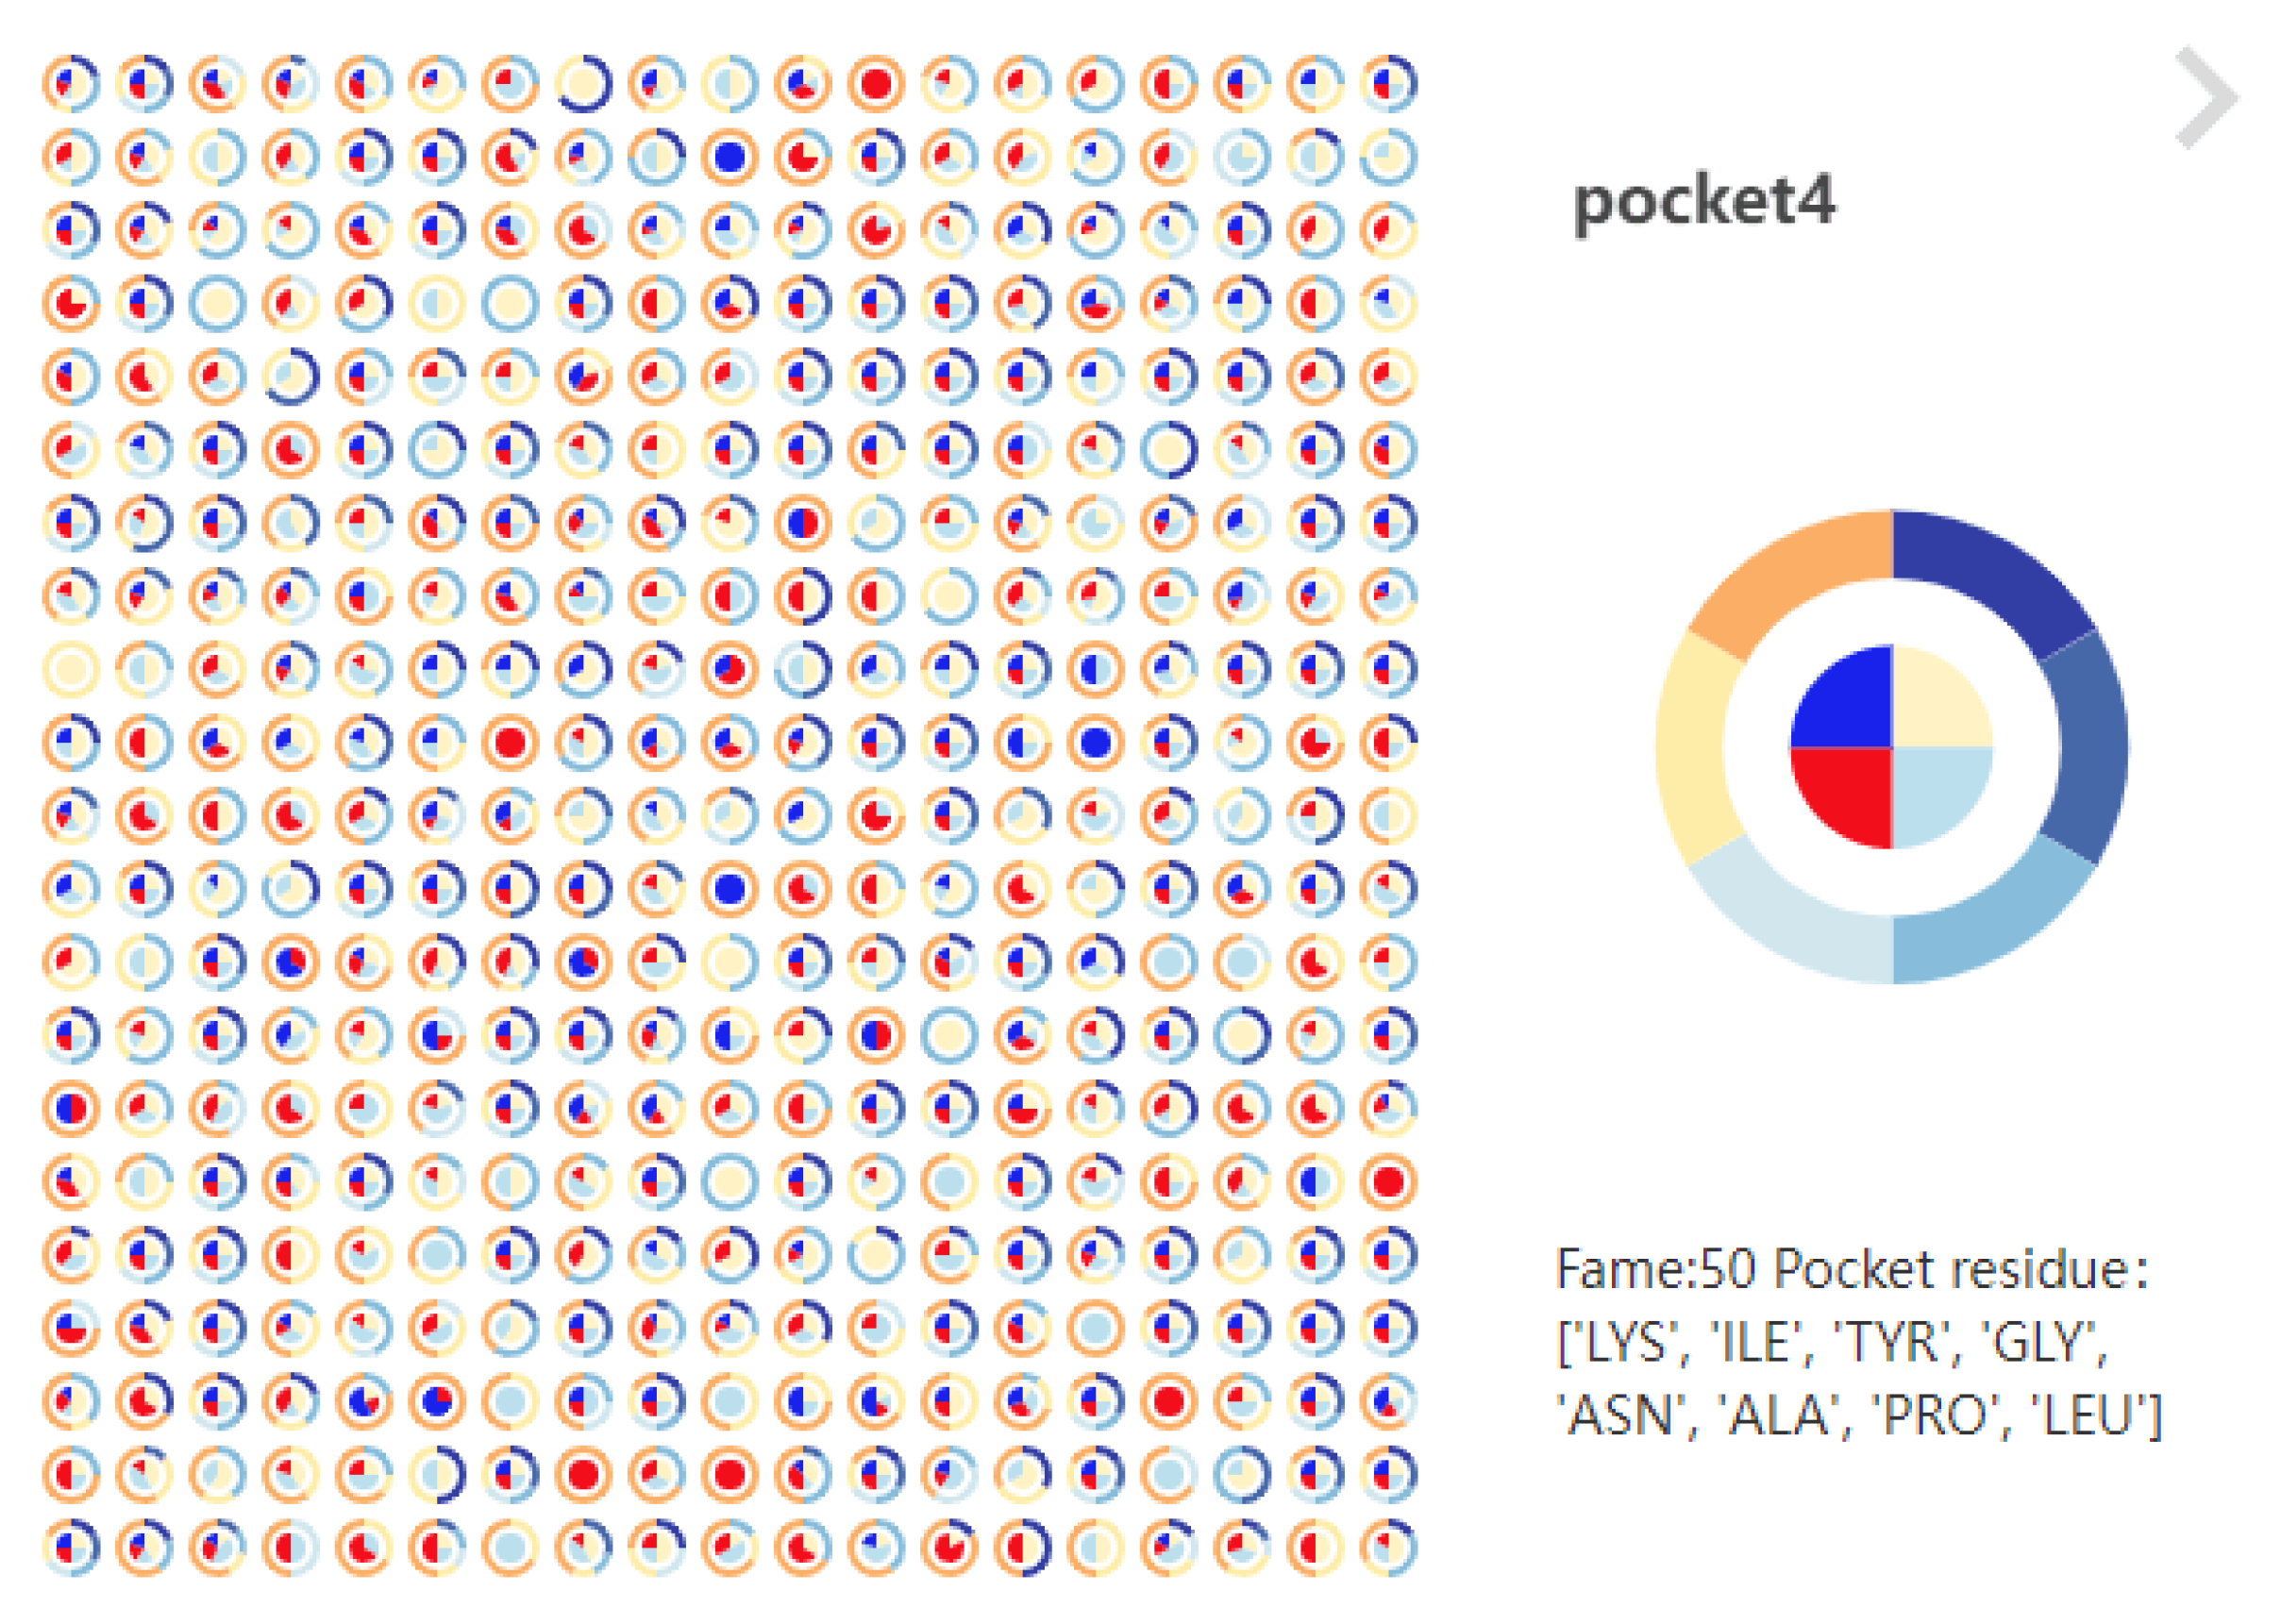
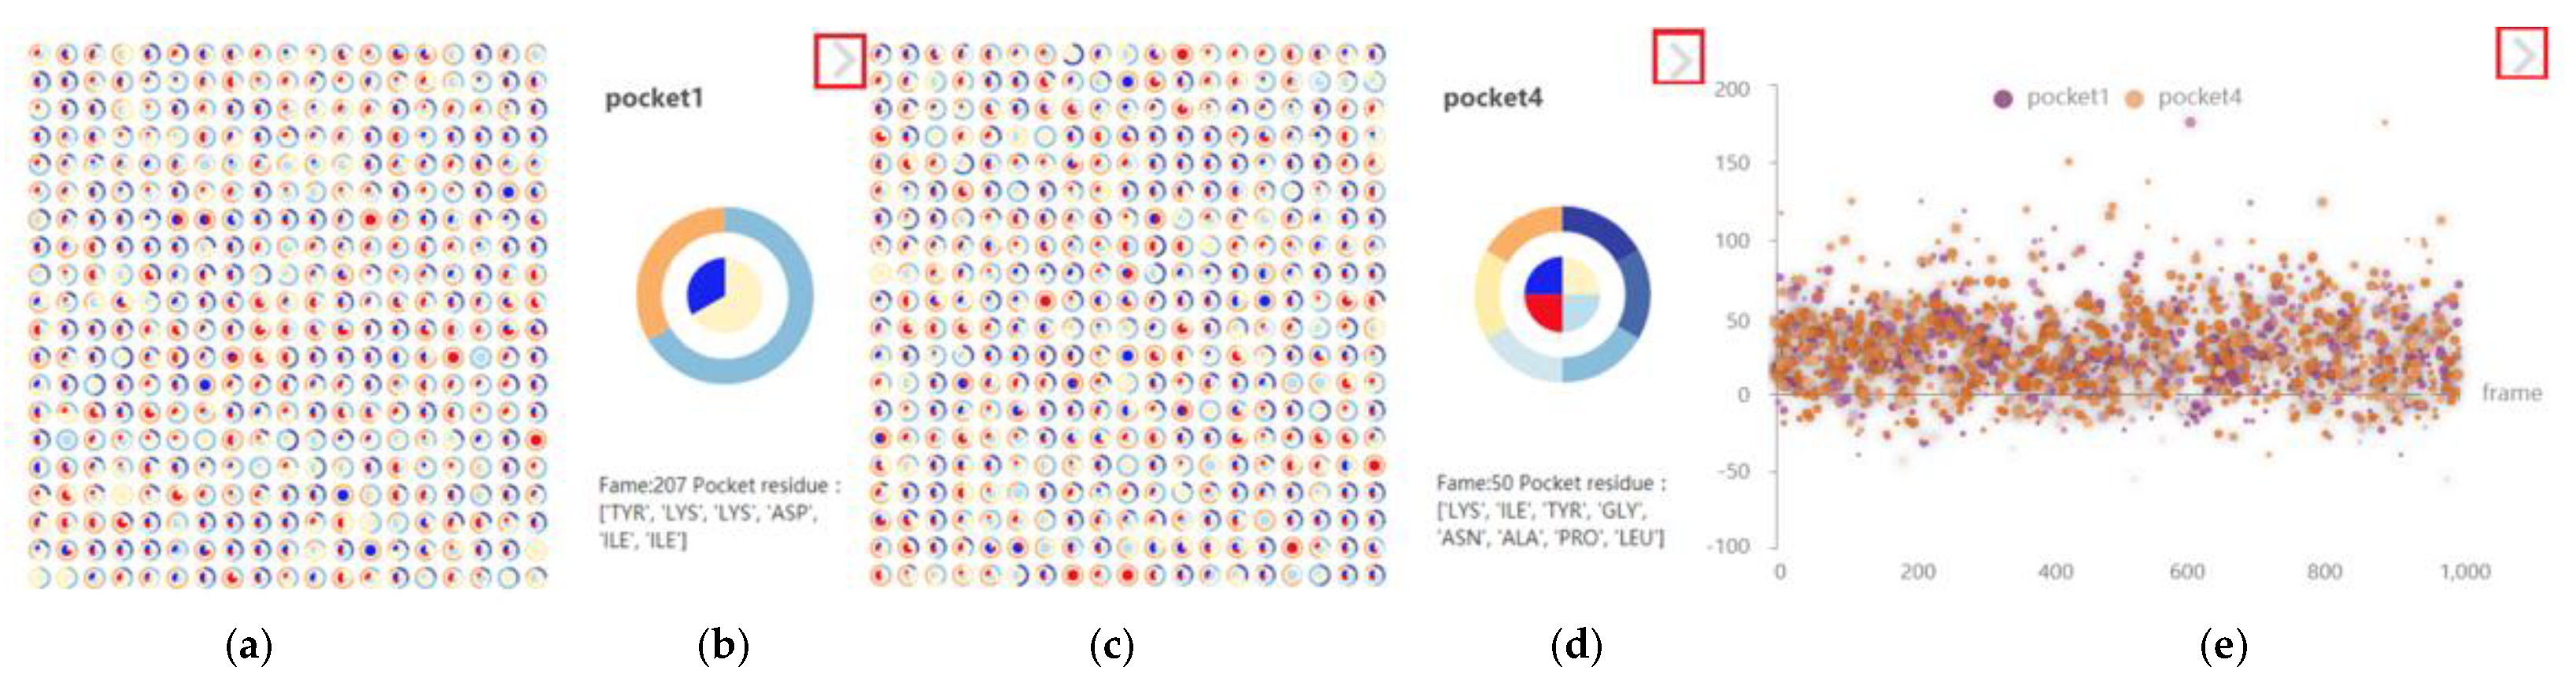
  • Support for cross-analysis of pocket morphological characteristics and pocket physicochemical properties. Click on any specific moment in the focus river chart to see the pocket physicochemical properties and the proximity of amino acids at the moment.

6.3. Other Feature Views

In addition to the navigation view and pocket comparison view, the use of visual methods to study the physical and chemical properties of molecular pockets is also of concern to domain experts (R3R4). The research on the physical and chemical properties of molecular pockets can help experts have a certain understanding of the changes in the properties of pockets and the adjacent amino acids of pockets, and assist experts in selecting compounds more suitable for entering the pockets. We use the magnifying glass component in the pocket comparison view to adjust the time span, and select the draw component to switch to other characteristic charts of the pocket. Other feature views of the pocket include the global time scale-chosen pocket scatter plot, the pocket pie diagram of a single pocket with a local time scale, and the pocket 3D view of a single pocket with a single time scale.

6.3.1. Pocket Scatter Plot of GTS-CP

The global time scale-selective pocket scatter plot (Figure 11) shows the characteristic distribution of pocket volume, hydrophilicity, and olarity at all timesteps (R3). After studying the characteristics of the volume change between molecular pockets, we explore the physicochemical properties of the pockets. The scatter plot shows the characteristics of the pockets at all time slices. The size of the scatter point indicates the volume of the pocket, the position of the scatter point on the x-axis indicates the time in the molecular dynamics simulation, the position of the scatter point on the y-axis indicates the hydrophilicity of the pocket, the positive direction of the y-axis indicates the higher hydrophilicity, the transparency of the scatter point indicates the polarity of the pocket at a certain timestep, the dark color indicates the positive charge, and the light color indicates the negative charge.

6.3.2. Pocket Pie of LTS-SP

The pocket pie chart of local timescale-single pocket (Figure 12, left) is used to explore the changes in physical and chemical properties in the pocket over a period of time (R3). The pie chart is divided into inner and outer rings. The inner ring represents the polarity of the pocket, and the outer ring represents the hydrophilicity and hydrophobicity of the pocket. Pocket polarity and hydrophilicity are encoded in different colors. Each pie chart represents a specific timestep. Click the small pie chart, or click a specific time in the magnifying glass, and the pie chart of a specific timestep will be enlarged to display the specific timestep and the most pocket adjacent amino acids at that time (Figure 12, right).

6.3.3. Pocket 3D View of STS-SP

The 3D view of a single pocket on a single time scale (Figure 13) shows the 3D structure of protein molecules and protein molecular pockets (R4). In 3D visualization, the pockets and the amino acids are visualized in 3D. The distribution of pockets in the spatial view helps experts conveniently analyze pockets and interactively explore the spatial distribution of amino acids lining the pocket (Figure 13). The 3D view visualizes the molecular pockets only from the aspect of spatial form and position. Thus, experts require a chart of pocket characteristics to assist in the observation of pockets.

7. Interactive Exploration

To make the system more in line with the usage habits of experts in the field, combined with the advice of experts, this paper determines the pocket features that need to be analyzed, and gradually sorts out the pocket feature analysis process (R1R4). Considering the spatial and temporal characteristics of protein molecules, a progressive interactive exploration method of pocket features is proposed. From large to small in terms of space, and from whole to part in terms of time, we finally focus on the specific spatial location and time range. In the determination of interaction scheme, the pockets are divided into different scales according to time scale and space scale, and a set of visual analysis framework of pocket characteristics is proposed according to the progressive exploration idea (Figure 14).
From TP to CP, after reviewing the overall information of the pocket in the navigation view, one can select which local pockets are important pockets according to the characteristics of the pocket, such as relevance, morphological changes and hydrophilicity. From CP to SP, analyze and compare the correlation between pockets and the stability of pockets in the pocket comparison view to assist in the discovery of allosteric pockets. Finally, in the pocket contrast view, the magnifying glass component can open a new view to show the characteristics of local pockets. We explore the shape, physical and chemical properties, amino acids, and other characteristics of a single pocket in the magnifying glass view, pocket pie chart, and pocket 3D view, and support the cross-analysis of multiple features of the pocket. From GTS to LTS, select the time period of interest in the deformed river map to zoom, and display the subtle changes of pocket shape in the local timestep in the magnifying glass view. Observe the changes of physical and chemical properties of pockets in the overall time in the pocket scatter plot, and check the physical and chemical properties of different pockets in the pocket local timescale pie chart. From LTS to STS, click the pie chart, or click a specific time in the magnifying glass to enlarge the pie chart of a specific timestep. The morphological structure and physicochemical properties of pockets can be studied in a single timestep. Finally, the 3D view shows the 3D structure of protein molecules and protein molecular pockets.

8. Case Study and Feedback

To evaluate the effectiveness of the P2V-DTW algorithm, two sets of data were used in the ablation experiment. The first group is the GPX4 [11] protein trajectory data provided by the Zhu research group of the Shanghai Institute of Medicine, which includes a 1000-step molecular dynamics simulation trajectory. The other group is ACE2 [12] from BioExcel-CV19 molecular dynamics simulation open source database. This data contains 1000 steps of molecular dynamics simulation trajectory, and the data set used is MCV1900004.

8.1. Case Study

The GPX4 [11] protein can degrade small molecular peroxides and some lipid peroxides, and inhibit cell death caused by lipid peroxidation, namely ferroptosis. Ferroptosis can be used as a new mechanism in anti-tumor research, and can be applied to the research of tumor immunity [49], so it has become a new hot topic in recent years. In the study of Li et al. [32], allosteric drugs that can regulate the expression of GPX4 protein were found.
ACE2 [12] is the main entry point of some coronaviruses into cells, including SARS-CoV (the virus that causes SARS) and SARS-CoV-2 (the virus that causes COVID-19). Wang et al. [50] found an individual conformation site near the drug binding site of ACE2. The binding of allosteric drugs to this site may change the biophysical properties of ACE2 receptor, which destroys the interaction between RBD of ACE-2 and SARS-CoV-2; that is, when the drug binds to the allosteric site of ACE-2 receptor, it changes the conformation of ACE2 to limit the invasion of SARS-CoV-2.

8.1.1. Pocket Correlation Calculation Results of P2V-DTW

In this experiment, the Fpocket [28] tool is used to extract dynamic molecular pockets from the above two groups of data, and a variety of dynamic features of pockets are extracted. After generating the vector representation of pockets, the P2V-DTW method is used to calculate the correlation between pockets. We verify the effectiveness of the P2V-DTW method proposed in this paper, calculate the correlation of molecular pockets, and verify whether using the shape combined with topological representation of protein pockets can improve the correlation calculation to a certain extent. The evaluation result of correlation is mainly based on whether more accurate allosteric pockets can be selected according to the correlation between pockets, and the ranking of real allosteric pockets calculated according to the correlation determines the advantages and disadvantages of the method.
Compare the six cases using P2V-DTW and not using P2V-DTW when processing volume, topology, and volume and topology data respectively. In this paper, the above six cases are tested and compared. The calculated results are shown in Table 2. This is worth mentioning because the use of P2V-DTW method requires the acquisition of topological relations, and it is impossible to directly process volume data. When volume data is processed without a P2V-DTW method, it is the correlation calculation method proposed in D3Pockets [2].
Table 2 shows the real allosteric pocket correlation ranking obtained by using P2V-DTW and not using P2V-DTW methods to calculate the correlation between orthosteric and allosteric pockets. The higher the allosteric pocket ranking is, the higher the accuracy of the algorithm is. For example, in the GPX4 dataset, the P2V-DTW method and volume plus topology data combination can attain the similarity ranking between pockets and orthosteric pockets, and allosteric pockets are ranked as 2 in all pockets. Comparing the pocket correlation calculated by the two sets of protein trajectory datasets, it is found that using the P2V-DTW method and volume plus topology data in the GPX4 dataset has the greatest effect on the correlation calculation, which is significantly improved compared with D3Pockets method. The calculation effect of using the P2V-DTW method in the ACE2 dataset is better than that without the P2V-DTW method. When the P2V-DTW method is not used, the calculation effect of correlation can also be effectively improved by using topological data, especially compared with the D3Pockets method, and the effect is significantly improved.
To further illustrate the effectiveness of our method, we compare our method with D3Pockets. The results of the similarity calculations are shown in Table 3. The smaller value for the P2V-DTW method means the two pockets are more relevant than the two pockets are, with pocket 4 being the second in the similarity ranking. The value of the D3Pockets method closer to 1 means the two pockets are more relevant, with pocket 4 being the fourth in the similarity ranking. Therefore, using protein morphological data plus topological data combined with the P2V-DTW algorithm to calculate pocket correlation makes the overall performance is better.

8.1.2. Progressive Visual Analysis Results of Molecular Pockets

This paper evaluates the usability of visual analysis methods according to the needs of domain experts. According to the pocket characteristics in GPX4, the allosteric pockets in the protein were found. We analyze the characteristics of GPX4 protein molecular dynamic pocket to determine whether this method can quickly locate a specific location and time from the overall dynamic simulation data. This paper also supports cross-analysis of various characteristics of pockets to help experts find pockets of interest from all pockets.
To establish the overall impression of the whole molecular pocket and provide a transition method from the overall pocket to the local pocket, this paper provides a navigation view. The navigation map shows the overall characteristics of the protein in the simulation time, the hydrophilic and hydrophobic characteristics, and an overview of all pocket volume changes (Figure 15a). By examining the hydrophilic and hydrophobic characteristics of the pockets, it can be seen that hydrophilic amino acids dominate in all pockets. After checking the volume change of each pocket roughly through the line chart, we notice that pocket 4 is similar to pocket 1 in the change of pocket shape.
Through the column chart on the right side of the navigation chart, we determine the correlation between the pockets, select the normal pocket and the four pockets most similar to the normal pocket and put them into the pocket comparison view. As shown in the column diagram in Figure 15a, the orthosteric pocket (Pocket 1) of GPX4 protein is most similar to pocket 2, pocket 4, pocket 6, and pocket 8. We put the four pockets most similar to pocket 1 into the contrast view, and use the contrast view to analyze the local changes of pockets. In Figure 15b, pocket 8, pocket 6, pocket 4, pocket 2, and pocket 1 are from top to bottom. For a few selected pockets, experts need to further understand whether the size of these pockets has changed greatly and whether the pockets exist stably in the simulation process. We can observe that the volume fluctuation of pocket 8 and pocket 6 is relatively large, and the volume fluctuation of pocket 4 and pocket 2 is small. Because the opacity of each channel is encoded by the number of pockets, the opacity is high and stable. We can clearly see that the opacity of pocket 4, pocket 2, and pocket 1 is higher than that of pocket 8 and pocket 6. The river channel corresponding to pocket 4 is more opaque than other rivers, which proves that pocket 4 is more stable in a pocket similar to pocket 1.
The merge component can also be used to compare the stability and correlation between pockets. In Figure 16, pocket 1 is merged and compared with pocket 2, pocket 4, pocket 6, and pocket 8, respectively. In the first stage, the shape and opacity of pocket 2 and pocket 4 are close to that of pocket 1. By comprehensively investigating the morphological changes and opacity changes of different pockets and pocket 1 at various stages, it is found that pocket 4 is the most similar to ortho pocket 1 in morphology and has good stability.
At this time, experts can observe the detailed features of pocket 4 and orthosteric pocket 1 by activating the magnifying glass component. The zoom operation of the magnifying glass component can display the changes of pocket characteristics in any time period and the effect of the magnifying glass component. Figure 17a shows pocket 4 with 1000 timesteps, and Figure 17b shows pocket 1 with 1000 timesteps. Comparing Figure 17a,b, it can be seen that there are certain differences between the two pockets in some local areas. Enlarge some parts with obvious differences, as shown by the vertical dotted line in Figure 17a,b. Enlarge the range of 100 timesteps locally in pocket 4, as shown in Figure 17c,e,g. Enlarge the range of 100 timesteps locally in pocket 1, as shown in Figure 17d,f,h. It can be seen that the fluctuation of local characteristics in Figure 17c,d is not obvious, the characteristics in Figure 17f are locally delayed from those in Figure 17e, and the characteristics in Figure 17h are also locally delayed from those in Figure 17g. Biochemists believe that these graphs are an effective method for them to visually view dynamic features, and can be used to observe multiple characteristics of pockets, such as the stability of pockets and the correlation between pockets. This method is very helpful for experts seeking to screen alternative pockets.
We use other feature views to analyze the characteristics of pockets with a single granularity. The system supports experts use of the magnifying glass component to select pockets, click to pause amplification, and submit the data to the attribute analysis module. Changes in the distribution of hydrophilic, hydrophobic, and polar amino acids in the pocket can be seen in the pie chart. As shown in Figure 18a, there are fewer dark blue outer rings, whereas there are more light blue outer rings and light yellow orange outer rings in the pie chart. As shown in Figure 18c, there are more dark blue outer rings and light blue outer rings. It shows that the hydrophilic amino acids in pocket 4 are more widely distributed; that is, the hydrophilicity of pocket 1 is worse than pocket 4 in molecular dynamics simulation. Looking at the distribution of inner rings in Figure 18a,c thumbnail pie charts, it is seen that there are more dark blue inner rings and bright red inner rings in Figure 18c than in Figure 18a, indicating that the polarity characteristics of pocket 4 are more obvious than those in pocket 1.
Click the thumbnail pie chart, enlarge the timestep of interest, and check the proximity of its physical and chemical properties to amino acids (Figure 18b,d). When the mouse clicks the arrow in the upper right corner of other feature views (red box in Figure 18), the display mode of the pie chart and scatter chart can be switched. The display mode of the scatter chart makes it easy to display the distribution of physical and chemical properties of pockets (Figure 18e). Most of the scatterers are above the y axis, indicating that the hydrophilicity of the two pockets is good, and there are more light-colored scatterers in pocket 4 than in pocket 1, indicating that there are more negatively charged amino acids in pocket 4 than in pocket 1 in the molecular dynamics simulation.
The three-dimensional map can assist field experts to observe the morphological characteristics of pockets on a single timestep scale, compare the morphological characteristics of pockets and observe the positional relationship between pockets and molecules. As shown in Figure 19a, orthosteric pocket 1 is a slender pocket located on the shallow surface of GPX4 molecule. As shown in Figure 19b, the opening of pocket 4 is wider than that of normal pocket 1, which is also very conducive to the combination of drug molecules.
The above results confirm that pocket 4 is the most similar to pocket 1. At the same time, pocket 4 has high stability, high hydrophilicity and wide opening, which is likely to be an allosteric pocket related to ortho pocket 1. This means that this paper verifies the experimental results of Li [32] et al. From the perspective of visual analysis of pocket characteristics, pocket 4 is an individual structural pocket in GPX4 protein.

8.2. Feedback

After completing the case study of VAPPD, Mr. Xu, who has many years of research experience in the screening and evaluation of innovative drugs, evaluated the visual analysis method of this paper from several aspects.
First, according to the feedback of experts in this field, VAPPD can carry out different protein feature exploration schemes for different spatiotemporal scales. This makes it easier to compare multiple properties, which is not common in virtual filtering tools, but it is very useful. He believes that the visual analysis of pockets can be completed through VAPPD, and the allosteric pockets in GPX4 protein molecules can be determined.
Secondly, this method can support domain experts to analyze the stability of dynamic molecular pockets. It is very convenient to analyze the changing trend and nature of pockets in the macro view through the navigation map, which allows experts to quickly focus on pockets with high similarity. Domain experts emphasized the usefulness of calculating high-dimensional pocket correlation based on P2V-DTW and the ability to use correlation scores to focus on specific pockets, and compared them through the river map. According to experts in the field, the pocket comparison view is well done, which enables users to compare high-dimensional dynamic pockets through visual methods under different time-length sequences and different alpha sphere number sequences. They showed that it was also interesting to use different transparency to encode pockets, and to use merge components to compare the stability and morphological differences between different dynamic pockets.
Finally, by using other feature views, we can observe the physical and chemical properties of the pocket and the adjacent amino acids of the pocket. Combined with the magnifying glass component, the slicing operation with different granularity is carried out, and the local simulation time is selected for the cross-verification of pocket properties. The 3D view of the pocket in a single timestep can help experts confirm the true shape of the pocket and the spatial location area.
To sum up, experts have great interest in our work, and believe that the system can clearly show a variety of characteristics of protein pockets from multiple spatiotemporal scales, and assist experts to complete the task of protein pocket feature analysis.

9. Conclusions

This paper analyzes the high-dimensional dynamic protein molecular pocket data. Aiming at the problems of how to fully extract multiple features of dynamic pockets to better characterize them, how to calculate the pocket correlation between dynamic pockets based on the representation of multiple features of pockets, and how to better compare and visually analyze the features of dynamic pockets, the following aspects are discussed.
(1)
A special representation of dynamic pocket data is proposed. This method can better characterize protein molecular pockets, and the pocket code can also be used as the input data of natural language processing model.
(2)
An algorithm called P2V-DTW for the correlation of molecular dynamic pocket sequences is proposed. The algorithm solves the problem of correlation calculation of unequal length sequences in high-dimensional data, and can better compare the dynamic pocket characteristics of protein molecules.
(3)
A progressive visual analysis method of pocket feature exploration is proposed. This method has a variety of potential applications, such as the identification of normal and allosteric pockets, the identification of stable pockets, and pocket-based drug design.
Finally, the case analysis is carried out through GPX4 protein trajectory data and ACE2 molecular dynamics simulation trajectory data. The results show that this method can accurately describe the pocket information to biochemical experts, help them quickly locate the key features that affect the protein pocket, and complete the tasks of dynamic pocket feature comparison and visual analysis (R1R4).
The dynamic pocket feature calculation and analysis method proposed in this paper, however, needs to be further improved. There are some uncertain factors in the prediction of allosteric pockets, due to the limited number of known allosteric protein samples suitable for training and testing, and the amount of calculation, the accuracy, and applicability of VAPPD are different. Our work is an application-oriented solution, and we can consider integrating more excellent allosteric prediction methods to provide decision-making assistance for domain experts.

Author Contributions

Conceptualization, D.G. and L.F.; methodology, D.G. and L.F.; software, Y.L. and C.S.; validation, L.C. and C.S.; formal analysis, D.G.; investigation, L.F.; resources, L.F.; data curation, Y.L. and L.F.; writing—original draft preparation, L.F.; writing—review and editing, Y.W. and L.F.; visualization, L.F. and L.C.; supervision, X.X.; funding acquisition, D.G. All authors have read and agreed to the published version of the manuscript.

Funding

This work was supported in part by grants from the National Science Foundation of China (Grant no. 61802334, no. 61902340), Natural Science Foundation of Hebei Province (F2022203015) and Innovation Capability Improvement Plan Project of Hebei Province (22567637H).

Institutional Review Board Statement

Not applicable.

Informed Consent Statement

Not applicable.

Data Availability Statement

Not applicable.

Acknowledgments

The authors wish to thank Ximing Xu in Chinese Marine University for his advice on domain knowledge. We are very grateful for the experimental data provided by Fpocket [28].

Conflicts of Interest

The authors declare no conflict of interest. The funders had no role in the design of the study; in the collection, analyses, or interpretation of data; in the writing of the manuscript, or in the decision to publish the results.

References

  1. Kozlíková, B.; Krone, M.; Falk, M.; Lindow, N.; Baaden, M.; Baum, D.; Hege, H.C. Visualization of biomolecular structures: State of the art revisited. Comput. Graph. Forum 2017, 36, 178–204. [Google Scholar] [CrossRef] [Green Version]
  2. Chen, Z.; Zhang, X.; Peng, C.; Wang, J.; Xu, Z.; Chen, K.; Zhu, W. D3Pockets: A method and Web server for systematic analysis of protein pocket dynamics. J. Chem. Inf. Model. 2019, 59, 3353–3358. [Google Scholar] [CrossRef] [PubMed]
  3. Stank, A.; Kokh, D.B.; Fuller, J.C.; Wade, R.C. Protein Binding Pocket Dynamics. Acc. Chem. Res. 2016, 49, 809–815. [Google Scholar] [CrossRef] [Green Version]
  4. Eyrisch, S.; Helms, V. Transient pockets on protein surfaces involved in protein-protein interaction. J. Med. Chem. 2007, 50, 3457–3464. [Google Scholar] [CrossRef]
  5. Laurent, B.; Chavent, M.; Cragnolini, T.; Dahl, A.C.E.; Pasquali, S.; Derreumaux, P.; Baaden, M. Epock: Rapid analysis of protein pocket dynamics. Bioinformatics 2015, 31, 1478–1480. [Google Scholar] [CrossRef] [PubMed] [Green Version]
  6. Lu, S.; He, X.; Yang, Z.; Chai, Z.; Zhou, S.; Wang, J.; Zhang, J. Activation pathway of a G protein-coupled receptor uncovers conformational intermediates as targets for allosteric drug design. Nat. Commun. 2021, 12, 1–15. [Google Scholar] [CrossRef]
  7. Xie, J.; Wang, S.; Xu, Y.; Deng, M.; Lai, L. Uncovering the Dominant Motion Modes of Allosteric Regulation Improves Allosteric Site Prediction. J. Chem. Inf. Model. 2021, 62, 187–195. [Google Scholar] [CrossRef]
  8. Panjkovich, A.; Daura, X. PARS: A web server for the prediction of protein allosteric and regulatory sites. Bioinformatics 2014, 30, 1314–1315. [Google Scholar] [CrossRef] [PubMed] [Green Version]
  9. Ma, X.; Meng, H.; Lai, L. Motions of allosteric and orthosteric ligand-binding sites in proteins are highly correlated. J. Chem. Inf. Model. 2016, 56, 1725–1733. [Google Scholar] [CrossRef]
  10. Ni, D.; Wei, J.; He, X.; Rehman, A.U.; Li, X.; Qiu, Y.; Zhang, J. Discovery of cryptic allosteric sites using reversed allosteric communication by a combined computational and experimental strategy. Chem. Sci. 2021, 12, 464–476. [Google Scholar] [CrossRef]
  11. Cardoso, B.R.; Hare, D.J.; Bush, A.I.; Roberts, B.R. Glutathione peroxidase 4: A new player in neurodegeneration? Mol. Psychiatry 2017, 22, 328–335. [Google Scholar] [CrossRef] [PubMed] [Green Version]
  12. Ni, W.; Yang, X.; Yang, D.; Bao, J.; Li, R.; Xiao, Y.; Gao, Z. Role of angiotensin-converting enzyme 2 (ACE2) in COVID-19. Crit. Care 2020, 24, 1–10. [Google Scholar] [CrossRef]
  13. Levitt, D.G.; Banaszak, L.J. POCKET: A computer graphies method for identifying and displaying protein cavities and their surrounding amino acids. J. Mol. Graph. 1992, 10, 229–234. [Google Scholar] [CrossRef]
  14. Hendlich, M.; Rippmann, F.; Barnickel, G. LIGSITE: Automatic and efficient detection of potential small molecule-binding sites in proteins. J. Mol. Graph. Model. 1997, 15, 359–363. [Google Scholar] [CrossRef]
  15. Weisel, M.; Proschak, E.; Schneider, G. PocketPicker: Analysis of ligand binding-sites with shape descriptors. Chem. Cent. J. 2007, 1, 1–17. [Google Scholar] [CrossRef] [PubMed] [Green Version]
  16. Laskowski, R.A. SURFNET: A program for visualizing molecular surfaces, cavities, and intermolecular interactions. J. Mol. Graph. 1995, 13, 323–330. [Google Scholar] [CrossRef]
  17. Ho, B.K.; Gruswitz, F. HOLLOW: Generating Accurate Representations of Channel and Interior Surfaces in Molecular Structures. BMC Struct. Biol. 2008, 8, 49. [Google Scholar] [CrossRef] [Green Version]
  18. Zhu, H.; Teresa, P.M. MSPocket: An orientation-independent algorithm for the detection of ligand binding pockets. Bioinformatics 2011, 27, 351–358. [Google Scholar] [CrossRef] [Green Version]
  19. Chovancova, E.; Pavelka, A.; Benes, P.; Strnad, O.; Brezovsky, J.; Kozlikova, B.; Damborsky, J. CAVER 3.0: A tool for the analysis of transport pathways in dynamic protein structures. PLoS Comput. Biol. 2012, 8, e1002708. [Google Scholar] [CrossRef] [Green Version]
  20. Jie, L.; Edelsbrunner, H.; Woodward, C. Anatomy of protein pockets and cavities: Measurement of binding site geometry and implications for ligand design. Protein Sci. 2010, 7, 1884–1897. [Google Scholar]
  21. Oliveira, S.H.; Ferraz, F.A.; Honorato, R.V. KVFinder: Steered identification of protein cavities as a PyMOL plugin. BMC Bioinform. 2014, 15, 197. [Google Scholar] [CrossRef]
  22. Simoes, T.; Gomes, A. CavVis—A field-of-view geometric algorithm for protein cavity detection. J. Chem. Inf. Model. 2019, 59, 786–789. [Google Scholar] [CrossRef]
  23. Brady, G.P.; Stouten, P.F.W. Fast prediction and visualization of protein binding pockets with PASS. J. Comput. Aided Mol. Des. 2000, 14, 383–401. [Google Scholar] [CrossRef] [PubMed]
  24. Feng, L.; Wang, F.; Zhang, J.; Tang, Y.; Zhao, J.; Zhou, L.; Singh, A.K. Particle-based calculation and visualization of protein cavities using SES models. IEEE J. Biomed. Health Inform. 2021, 26, 2447–2457. [Google Scholar] [CrossRef] [PubMed]
  25. Barril, X. MDpocket: Open-source cavity detection and characterization on molecular dynamics trajectories. Bioinformatics 2011, 27, 3276–3285. [Google Scholar]
  26. Xu, Y.; Wang, S.; Hu, Q.; Gao, S.; Ma, X.; Zhang, W.; Pei, J. CavityPlus: A web server for protein cavity detection with pharmacophore modelling, allosteric site identification and covalent ligand binding ability prediction. Nucleic Acids Res. 2018, 46, 374–379. [Google Scholar] [CrossRef]
  27. Jurcik, A.; Bednar, D.; Byška, J.; Marques, S.M.; Furmanova, K.; Daniel, L.; Kozlikova, B. CAVER Analyst 2.0: Analysis and visualization of channels and tunnels in protein structures and molecular dynamics trajectories. Bioinformatics 2018, 34, 3586–3588. [Google Scholar] [CrossRef] [Green Version]
  28. Peter, S.; Le, G.V.; Julien, M.; Tuffïry, P. Fpocket: Online tools for protein ensemble pocket detection and tracking. Nucleic Acids Res. 2010, 38, 582–589. [Google Scholar]
  29. Manak, M. Voronoi-based detection of pockets in proteins defined by large and small probes. J. Comput. Chem. 2019, 33, 521–533. [Google Scholar] [CrossRef]
  30. Huang, W.; Lu, S.; Huang, Z.; Liu, X.; Mou, L.; Luo, Y.; Zhang, J. Allosite: A method for predicting allosteric sites. Bioinformatics 2013, 29, 2357–2359. [Google Scholar] [CrossRef] [PubMed] [Green Version]
  31. Ma, X.; Qi, Y.; Lai, L. Allosteric sites can be identified based on the residue–residue interaction energy difference. Proteins Struct. Funct. Bioinform. 2015, 83, 1375–1384. [Google Scholar] [CrossRef]
  32. Li, C.; Deng, X.; Zhang, W.; Xie, X.; Conrad, M.; Liu, Y.; Lai, L. Novel allosteric activators for ferroptosis regulator glutathione peroxidase 4. J. Med. Chem. 2018, 62, 266–275. [Google Scholar] [CrossRef] [PubMed]
  33. Guo, D.; Wang, Q.; Liang, M.; Liu, W.; Nie, J. Molecular cavity topological representation for pattern analysis: A NLP analogy-based Word2Vec method. Int. J. Mol. Sci. 2019, 20, 6019. [Google Scholar] [CrossRef] [PubMed]
  34. Raina, V.; Krishnamurthy, S. Natural language processing. In Building an Effective Data Science Practice; Apress: Berkeley, CA, USA, 2022; pp. 63–73. [Google Scholar]
  35. Krone, M.; Kozlíková, B.; Lindow, N.; Baaden, M.; Baum, D.; Parulek, J.; Viola, I. Visual analysis of biomolecular cavities: State of the art. Comput. Graph. Forum 2016, 35, 527–551. [Google Scholar] [CrossRef]
  36. Lindow, N.; Baum, D.; Bondar, A.N.; Hege, H.C. Exploring cavity dynamics in biomolecular systems. BMC Bioinform. 2013, 14, S5. [Google Scholar] [CrossRef] [PubMed] [Green Version]
  37. Parulek, J.; Turkay, C.; Reuter, N.; Viola, I. Implicit surfaces for interactive graph based cavity analysis of molecular simulations. In Proceedings of the 2012 IEEE Symposium on Biological Data Visualization (BioVis), Seattle, WA, USA, 14–15 October 2012; IEEE: PIscataway, NJ, USA, 2012; pp. 115–122. [Google Scholar]
  38. Parulek, J.; Turkay, C.; Reuter, N.; Viola, I. Visual cavity analysis in molecular simulations. BMC Bioinform. 2013, 14, 1–15. [Google Scholar] [CrossRef] [Green Version]
  39. Byška, J.; Jurčík, A.; Gröller, M.E.; Viola, I.; Kozlikova, B. MoleCollar and tunnel heat map visualizations for conveying spatio-temporo-chemical properties across and along protein voids. Comput. Graph. Forum 2015, 34, 1–10. [Google Scholar] [CrossRef]
  40. Byška, J.; Le Muzic, M.; Gröller, M.E.; Viola, I.; Kozlikova, B. AnimoAminoMiner: Exploration of protein tunnels and their properties in molecular dynamics. IEEE Trans. Vis. Comput. Graph. 2015, 22, 747–756. [Google Scholar] [CrossRef]
  41. Zhao, Y.; Ge, L.; Xie, H.; Bai, G.; Zhang, Z.; Wei, Q.; Lin, Y.; Liu, Y.; Zhou, F. ASTF: Visual Abstractions of Time-Varying Patterns in Radio Signals. IEEE Trans. Vis. Comput. Graph. 2022, in press. [Google Scholar] [CrossRef]
  42. Krone, M.; Kauker, D.; Reina, G.; Ertl, T. Visual analysis of dynamic protein cavities and binding sites. In Proceedings of the 2014 IEEE Pacific Visualization Symposium, Yokohama, Japan, 4–7 March 2014; IEEE: PIscataway, NJ, USA, 2014; pp. 301–305. [Google Scholar]
  43. Masood, T.B.; Sandhya, S.; Chandra, N.; Natarajan, V. CHEXVIS: A tool for molecular channel extraction and visualization. BMC Bioinform. 2015, 16, 119. [Google Scholar] [CrossRef] [PubMed] [Green Version]
  44. Guo, D.; Han, D.; Xu, X.; Ye, K.; Nie, J. Spatiotemporal multiscale molecular cavity visualization and visual analysis. J. Vis. 2020, 23, 661–676. [Google Scholar] [CrossRef]
  45. Southall, N.T.; Dill, K.A.; Haymet, A.D.J. A View of the Hydrophobic Effect. J. Phys. Chem. 2002, 106, 521–533. [Google Scholar] [CrossRef]
  46. Southall, N.T.; Dill, K.A.; Haymet, A.D.J. ChemInform Abstract: A View of the Hydrophobic Effect. Cheminform 2010, 33, 521–533. [Google Scholar] [CrossRef]
  47. Jianwen, L.; Kui, Y.; Jing, B. Savitzky CGolay smoothing and differentiation filter for even number data. J. Abbr. 2005, 85, 1429–1434. [Google Scholar]
  48. Sawada, S.; Itoh, T.; Misaka, T.; Obayashi, S.; Czauderna, T.; Stephens, K. Streamline pair selection for comparative flow field visualization. Vis. Comput. Ind. Biomed. Art 2020, 3, 1–12. [Google Scholar] [CrossRef]
  49. Xu, S.; Min, J.; Wang, F. Ferroptosis: An Emerging Player in Immune Cells. Sci. Bull. 2021, 22, 2257–2260. [Google Scholar] [CrossRef]
  50. Wang, D.S.; Hayatshahi, H.S.; Jayasinghe-Arachchige, V.M.; Liu, J. Allosteric Modulation of Small Molecule Drugs on ACE2 Conformational Change upon Binding to SARS-CoV-2 Spike Protein. In Proceedings of the IEEE International Conference on Bioinformatics and Biomedicine (BIBM), Houston, TX, USA, 9–12 December 2021; pp. 2587–2594. [Google Scholar]
Figure 1. VAPPD representation for the abstracted overview of protein pocket exploration over time. The navigation view (a) shows the volume change trend of all cavities in the protein (line chart), the hydrophilic and hydrophobic properties of pockets (pie chart), and the correlation between pockets (bar chart). The pocket comparison view (b) is used to select some pockets for pocket feature comparison. The pocket properties of comparison include pocket stability (river opacity) and pocket volume (river width). The magnifying glass view (c) shows the pocket features after partial magnification. Open the “magnifier” component and start the view. Other feature views (d) mainly show the changes of hydrophilicity and polarity of the pocket with time, which can be switched to the form of scatter chart or pie chart. In the pie chart form, the pocket-lining amino acids in each timestep can be viewed. The 3D visual view (e) describes the morphology, position, and changes of molecules and pockets. This helps users to establish the interaction between two-dimensional and three-dimensional.
Applsci 12 10465 g001
Figure 2. Visual analysis pipeline from temporal–spatial dimensions. The horizontal axis represents time scales (GTS, LTS, STS). The vertical axis represents spatial scales (TP, CP, SP). In the middle are the four scales (GTS-TP, GTS-CP, LTS-SP, STS-SP).
Applsci 12 10465 g002
Figure 3. Protein molecular pocket representation. (a) Alpha sphere. (b) Protein molecular pocket. (c) Molecular pocket representation.
Applsci 12 10465 g003
Figure 4. Amino acids lining the dynamic pocket.
Applsci 12 10465 g004
Figure 5. Input and output of Word2vec word vector.
Applsci 12 10465 g005
Figure 6. Dynamic pocket extraction and P2V-DTW similarity calculation pipeline.
Applsci 12 10465 g006
Figure 7. Molecular pocket feature navigation view.
Applsci 12 10465 g007
Figure 8. Three visual methods for comparing pockets. (a) Line Chart. (b) River Chart. (c) Deformed River Chart.
Applsci 12 10465 g008
Figure 9. Pocket comparison view. The selected pockets are shown at the top and the component actions provided at the top right. Each river in the main image represents a single pocket, the change in width of the river indicates the change of pocket volume, and the change in transparency of the river indicates how often the pocket appears.
Applsci 12 10465 g009
Figure 10. Using the magnifying glass component. (a) The 1000 timesteps of pocket 12. (b) The 0–99 timesteps of pocket 12. (c) The 300–399 timesteps of pocket 12. (d) The 900–999 timesteps of pocket 12. (e) The 1000 timesteps of pocket 4. (f) The 0–99 timesteps of pocket 4. (g) The 300–399 timesteps of pocket 4. (h) The 900–999 timesteps of pocket 4. (i) The 1000 timesteps of pocket 1. (j) The 0–99 timesteps of pocket 1. (k) The 300–399 timesteps of pocket 1. (l) The 900–999 timesteps of pocket 1.
Applsci 12 10465 g010
Figure 11. The contrast scatter plot between pocket 1 and pocket 4 at 1000 timesteps, the size of the dot represents the pocket volume, the x-axis coordinate of the dot represents the hydrophilicity of the pocket, transparency of dots indicates pocket polarity.
Applsci 12 10465 g011
Figure 12. (Left): The hydrophobicity and polarity of pocket 4 at 1000 timesteps. (Right): The hydrophobicity and polarity of pocket 4 at the 50th timestep; the neighboring amino acids of the pocket were shown below.
Applsci 12 10465 g012
Figure 13. Substrate binding site and allosteric site of GPX4. The protein molecule is shown as a gray cartoon representation. Each pocket is shown in purple.
Applsci 12 10465 g013
Figure 14. Classification according to the different scales. The horizontal axis direction is divided into three scales according to time scales. The vertical axis is divided into three dimensions according to space scales. The arrows represent the interaction processes.
Applsci 12 10465 g014
Figure 15. (a) The calculated primary pocket profile. (b) Automatically extracts the pocket according to the pocket similarity.
Applsci 12 10465 g015
Figure 16. Using the merge component, compare pocket 1 with (a) pocket 2, (b) pocket 4, (c) pocket 6, and (d) pocket 8.
Applsci 12 10465 g016
Figure 17. Features of pocket 4 and pocket 1 enlarged. (a) 1000 time steps(pocket 4). (b) 1000 time steps(pocket 1). (c) 0–100 time steps. (d) 0–100 time steps. (e) 300–400 time steps. (f) 300–400 time steps. (g) 900–1000 time steps. (h) 900–1000 time steps.
Applsci 12 10465 g017
Figure 18. Comparison of other features of pocket 1 and pocket 4. Click the arrow in the red box to switch between pie chart and scatter chart. (a) Pocket 1 thumbnail. (b) Pocket 1 enlarged. (c) Pocket 4 thumbnail. (d) Pocket 4 enlarged. (e) Pocket 1 pocket 4 scatter plot.
Applsci 12 10465 g018
Figure 19. Three-dimensional structure of GPX4 protein molecular pocket. The purple one is an orthosteric pocket. The red one is an allosteric pocket. (a) Orthosteric pocket 1 in GPX4 protein molecule. (b) Allosteric pocket 4 in GPx4 protein molecules.
Applsci 12 10465 g019
Table 1. Molecular pocket navigation view field description table.
NameDescription
Time_idPocket timestep number.
Pocket_idPocket number.
HydrophilicityStatistics of hydrophilic amino acids in molecular pockets.
HydrophobicityStatistics of hydrophobic amino acids in molecular pockets.
Pocket volumePocket volume.
Pocket relevancePocket correlation.
Table 2. Comparison of pocket similarity rank of calculation methods.
MethodVolumeGPX TopologyVol + TopoVolumeACE TopologyVol + Topo
P2V-DTW-52-33
No P2V-DTW4 (D3Pockets)448 (D3Pockets)44
Table 3. Comparison of pocket similarity calculation methods.
MethodPocket 2Pocket 3Pocket 4Pocket 5Pocket 6Pocket 7Pocket 8
P2V-DTW1416.61555.21416.21474.51425.61446.41294.7
Similarity Rank3726451
D3Pockets [2]0.10020.05490.02860.03230.01680.01920.0174
Similarity Rank1243756
Publisher’s Note: MDPI stays neutral with regard to jurisdictional claims in published maps and institutional affiliations.

