1. Introduction
Electroencephalographic (EEG) measurements have been successfully used for many years in various projects including biomedical engineering, neuroscience, BCI (brain–computer interface) and neurogaming issues. Carrying out EEG signal measurements is relatively noninvasive. The development of classification systems of this type of signals may result in their practical use and, above all, independence from the analysis of these signals by trained persons [
1,
2,
3,
4,
5,
6,
7,
8,
9]. Currently, the determination of the frequency of EEG waves follows the following order: alpha (8–12 Hz), beta (13–30 Hz), delta (<4 Hz), gamma (>30 Hz), theta (4–7 Hz) and mu (8–12 Hz). The latter band is closely related to the activity and performance of the brain [
10,
11,
12,
13,
14].
Brain–computer interface projects are important elements in the development of research aimed at the practical use of electroencephalographic signals. These types of solutions are designed to directly connect the brain with an external device adapted to a given project. The goals of such solutions are very diverse and extensive. These are, i.a., improving or repairing human senses or motor activities, supporting IoT in everyday life, supporting tasks in the industry or automotive section, as well as neurogaming. It should be noted that the further development of BCI systems will result in the improvement of computer–human communication. Thus, it makes it possible to significantly improve the quality of life of people with disabilities, for example by converting the image of movement or facial expressions into a control or executive signal that a computer or other microprocessor system sends to various types of devices. The listed applications are presented in detail in the articles [
7,
15,
16,
17,
18,
19,
20,
21,
22,
23,
24,
25].
Based on a review of the classification algorithms used to design brain–computer interface (BCI) systems presented in [
26,
27], the classification of these types of designs that rely heavily on electroencephalographic signal measurements can be summarized. The authors proposed a division according to four main categories: adaptive classifiers, matrix and tensor classifiers, transfer learning and deep learning and other classifiers.
The aim of the research carried out in this work was to design a system that is able to cope with the classification of signals where control commands are given by means of facial expressions. These commands were forward (both eyes squint), right (right eye squints) and left (left eye squints). As the system was designed with people with disabilities in mind, the tested person during the measurements was moved in a wheelchair in order to reflect the real conditions and the evident disturbances that arose in this way. In addition, it was assumed that the system’s task was to detect three selected nervous tics that the examined person was supposed to emit. These were: eye blinking, neck tightening and shoulder tension. In addition, sound stimuli in the form of street noise, radio and television were used during the study. Side interference was Wi-Fi signals and the radio signal affecting the connection of the Emotiv set to the computer via Bluetooth technology. The aim of the study was to reproduce the conditions of everyday life as faithfully as possible. Consequently, the focus was on generating movement commands using facial expressions rather than mental commands that can be difficult to implement. This is due to the concern for the greatest possible adaptation of the system to the needs of everyday life. Mental commands could be influenced by disturbances from the outside world and disturbances caused by the distraction of the subject. In the case of mental commands, the person must be clearly focused to generate the expected potentials. Unfortunately, it is not possible to maintain a full and continuous state of concentration in the tasks of everyday life. The authors, in order to adapt the system to the needs of everyday life as much as possible, tried to achieve the highest possible robustness of the designed algorithm. Hence, the use of mental commands was abandoned in favor of facial expressions, which are more unambiguous. The designed classification system was therefore designed to effectively filter out numerous disturbances in such a way as to isolate and properly assess the signal generated by the examined persons from their facial expressions. The following sections effectively develop and describe this system. Moreover, the system was also expected to accurately indicate when the signal artifacts due to the selected nervous tics occurred and which one occurred. An expert classification system was expected to indicate the occurrence of a particular neural tic in the signal; the details are described in future sections. The designed expert system was therefore based on a solution using artificial intelligence in the form of a neural network. The tests included an analysis of the signal based on its filtering and an observation of the results after the application of power spectral density estimation.
In this study, it was decided to use the Emotiv EPOC Flex Gel kit. It is a wireless BCI headset, which consists of 32 electrodes and provides the possibility of a wide application in projects requiring precision [
28]. The use of Emotiv EPOC Flex took place, inter alia, in the work on comparing the impact of smoothing filters on the quality of data recorded with the Emotiv EPOC Flex brain–computer interface headset during sound stimulation [
10]. It was also used in articles covering research on the use of mental commands in the mobile robot control task in [
4,
5]. Further research using this device was presented in the article on a brain computing training system for motor imagery [
29] and the publication on EEG-based eye-movement recognition [
30,
31,
32,
33]. In addition, the headset was used in studies on the measurement of stress while using VR (virtual reality) [
34] technology, as well as performing other [
35] activities.
The topic of research on the influence of nervous tics on BCI systems is not very well developed. Of course, attention should be paid to numerous studies on the influence of artifacts (mainly visual and blinking) on EEG signal quality and system efficiency. However, the number of studies focusing on topics strictly related to artifacts caused by nervous tics and disturbances in the environment of the examined person is small.
The next section features articles and research related to the topics covered in this article.
2. Related Works
In the works of [
36,
37], the LORETA technique (low-resolution brain electromagnetic tomography) was used for electrophysiological measurements. It is based on the idea of solving inverse problems and estimating the distribution of the electrical activity of neurons in three-dimensional space. This approach is a linear estimation method that does not supplement the EEG signal with new information but is used successfully to estimate the sources of certain signals in the human brain. The author of the work [
36] filtered the signals using software that allowed to eliminate biological artifacts, such as the nervous tics of the test subjects, momentary eyelid clenching and others.
The article [
38] covers research on the most common type of artifact, belonging to the group of electro-oculographic artifacts—blinking eyes. The research used and analyzed the power spectrum of eye blink artifacts in combination with the use of EEG in the brain–computer interface design. Similarly, in the study [
39], the authors performed a spectral analysis of EEG signals in the insomnia disorder.
The work [
40] described a novel artifact removal algorithm for the BCI hybrid system. To remove artifacts in EEG signals, the authors designed a program that could meet this challenge by means of a stationary wavelet transform in combination with a new adaptive-thresholding mechanism. In turn, the authors in [
41] investigated the influence of various artifacts on a BCI system based on motor imaging. Tests were carried out using the IC MARC classifier. The results showed that muscle artifacts adversely affected BCI performance when all 119 EEG channels were used, rather than being configured with 48 centrally located channels. On the other hand, the authors of the article [
42] designed an innovative system for the automatic removal of artifacts from the eyes in the EEG. The methods of outlier detection and independent component analysis were used. The test results proved that the OD-ICA (outlier detection and independent component analysis) method effectively removed OA (ocular artifact) from EEG signals, and also successfully preserved significant EEG signals while removing OA.
The concept of peak detection with online electroencephalography (EEG) removal for the BCI was also addressed in [
43]. The effect of filtering on BCI performance and most importantly on peak frequency detection when using the brain–computer interface was investigated. The filter improved peak detection, but BCI performance was degraded due to movement and further removal of artifacts. The use in [
44] of the Lomb–Scargle periodogram to estimate spectral power from partial EEG and a denoising autoencoder (DAE) for training helped to solve the problem of noisy EEG signals. The results showed that the investigated method could successfully decode incomplete EEG recordings with good results.
Neural networks and broadly understood classification expert systems including artificial intelligence solutions have long been used in many areas of life and industry. A good understanding of the research topic involving the use of a convolutional neural network as a skin cancer classification system was presented in the paper [
45]. Work using a deep neural network in the classification of breast cancer histopathological images was presented in [
46], while the article [
47] contained a hybrid, convolutional and recurrent deep neural network for classification purposes.
Artificial intelligence has also successfully been used in the regulation of automation systems. The works [
48,
49,
50] proposed an approach based on an algorithm using an artificial neural network in the task of controlling a magnetic levitation object, music notation classification and a robot.
One should also not forget to consider other classification methods based on modern approaches to deep learning such as convolutional neural networks (CNNs). The use of deep CNNs with different two-dimensional representations of the time–frequency signal has recently become an interesting research topic. For example, in the article [
51], the authors proposed a research method that was based on combining three different time–frequency representations of signals by computing the continuous wavelet transform, mel spectrograms and gammatone spectrograms. Then, they were combined into 3D channel spectrograms. Thanks to the conducted research, applications were found in the automatic detection of speech deficits in users of cochlear implants. The second application turned out to be the recognition of phoneme classes to extract phone-attribute features.
The paper [
52] proposed an approach to the problem of classification of noisy nonstationary time series signals based on the class of their Cohen time–frequency representations (TFR) and deep learning algorithms. The authors of the research presented an example of detecting gravitational wave (GW) signals in intense, real, nonstationary, nonwhite and non-Gaussian noise. The test results showed that the approach in which deep CNN architectures were combined with Cohen’s class TFR allowed to obtain satisfactory algorithm performance.
Article [
53], however, is similar in scope to the problem discussed in this article. It also analyzed EEG signals. An approach based on the automatic extraction and classification of features using various convolutional neural networks was used. The results of the research showed that a configurable CNN required much less learning parameters and gave a better accuracy. As in this article, the EEG signals were also filtered; however, in that study, they were converted into an image using the time–frequency representation.
Table 1 summarizes the related work and the keywords that can be associated with it.
This article is divided into several sections that effectively discuss all issues related to the topic of interest. Initially, a set of components is presented, as well as the purpose of the research and the structure of the expert system. Next, the preclassification part of the EEG signal is discussed. The details of the artificial intelligence algorithm implemented in the system are also explained. Subsequently, the results of the classification are presented. The article ends with conclusions and a discussion of future plans and work related to this research.
3. Presentation of Components, Methodology of Study and System
The article presents a comprehensive approach to the problem of classifying an EEG signal significantly disrupted by four selected simulated neural tics causing artifacts. In addition, a slight interference was introduced from ambient noise (TV, radio and street sounds) as well as radio waves and Wi-Fi wireless signals. The whole experiment was designed to reflect real conditions as closely as possible. The raw EEG signal was recorded with an Emotiv EPOC Flex Gel headset. The necessary measurements were collected using dedicated EmotivPRO software. The EEG signal subjected to an appropriate multistage filtering was assessed in a two-stage analysis by an expert system. The system consisted of two neural networks implemented in Matlab software. In this case, version 2020b was used. The first of them evaluated the signal in terms of the detection of facial expressions, with the help of which the BCI system was to issue control commands. The classification took place through the consistent preparation of the signal in the classification process, starting with an appropriate filtering and ending with a spectral analysis. The second neural network learned to analyze the signal in search of neural tics. Detailed information on how the expert system works can be found in
Section 3.2.
The electrodes in the Emotiv EPOC Flex Gel headset are presented according to the following channels: Cz, Fz, Fp1, F7, F3, FC1, C3, FC5, FT9, T7, TP9, CP5, CP1, P3, P7, O1, Pz, Oz, O2, P8, P4, CP2, CP6, TP10, FC6, C4, FC2, F4, F8 and Fp2.
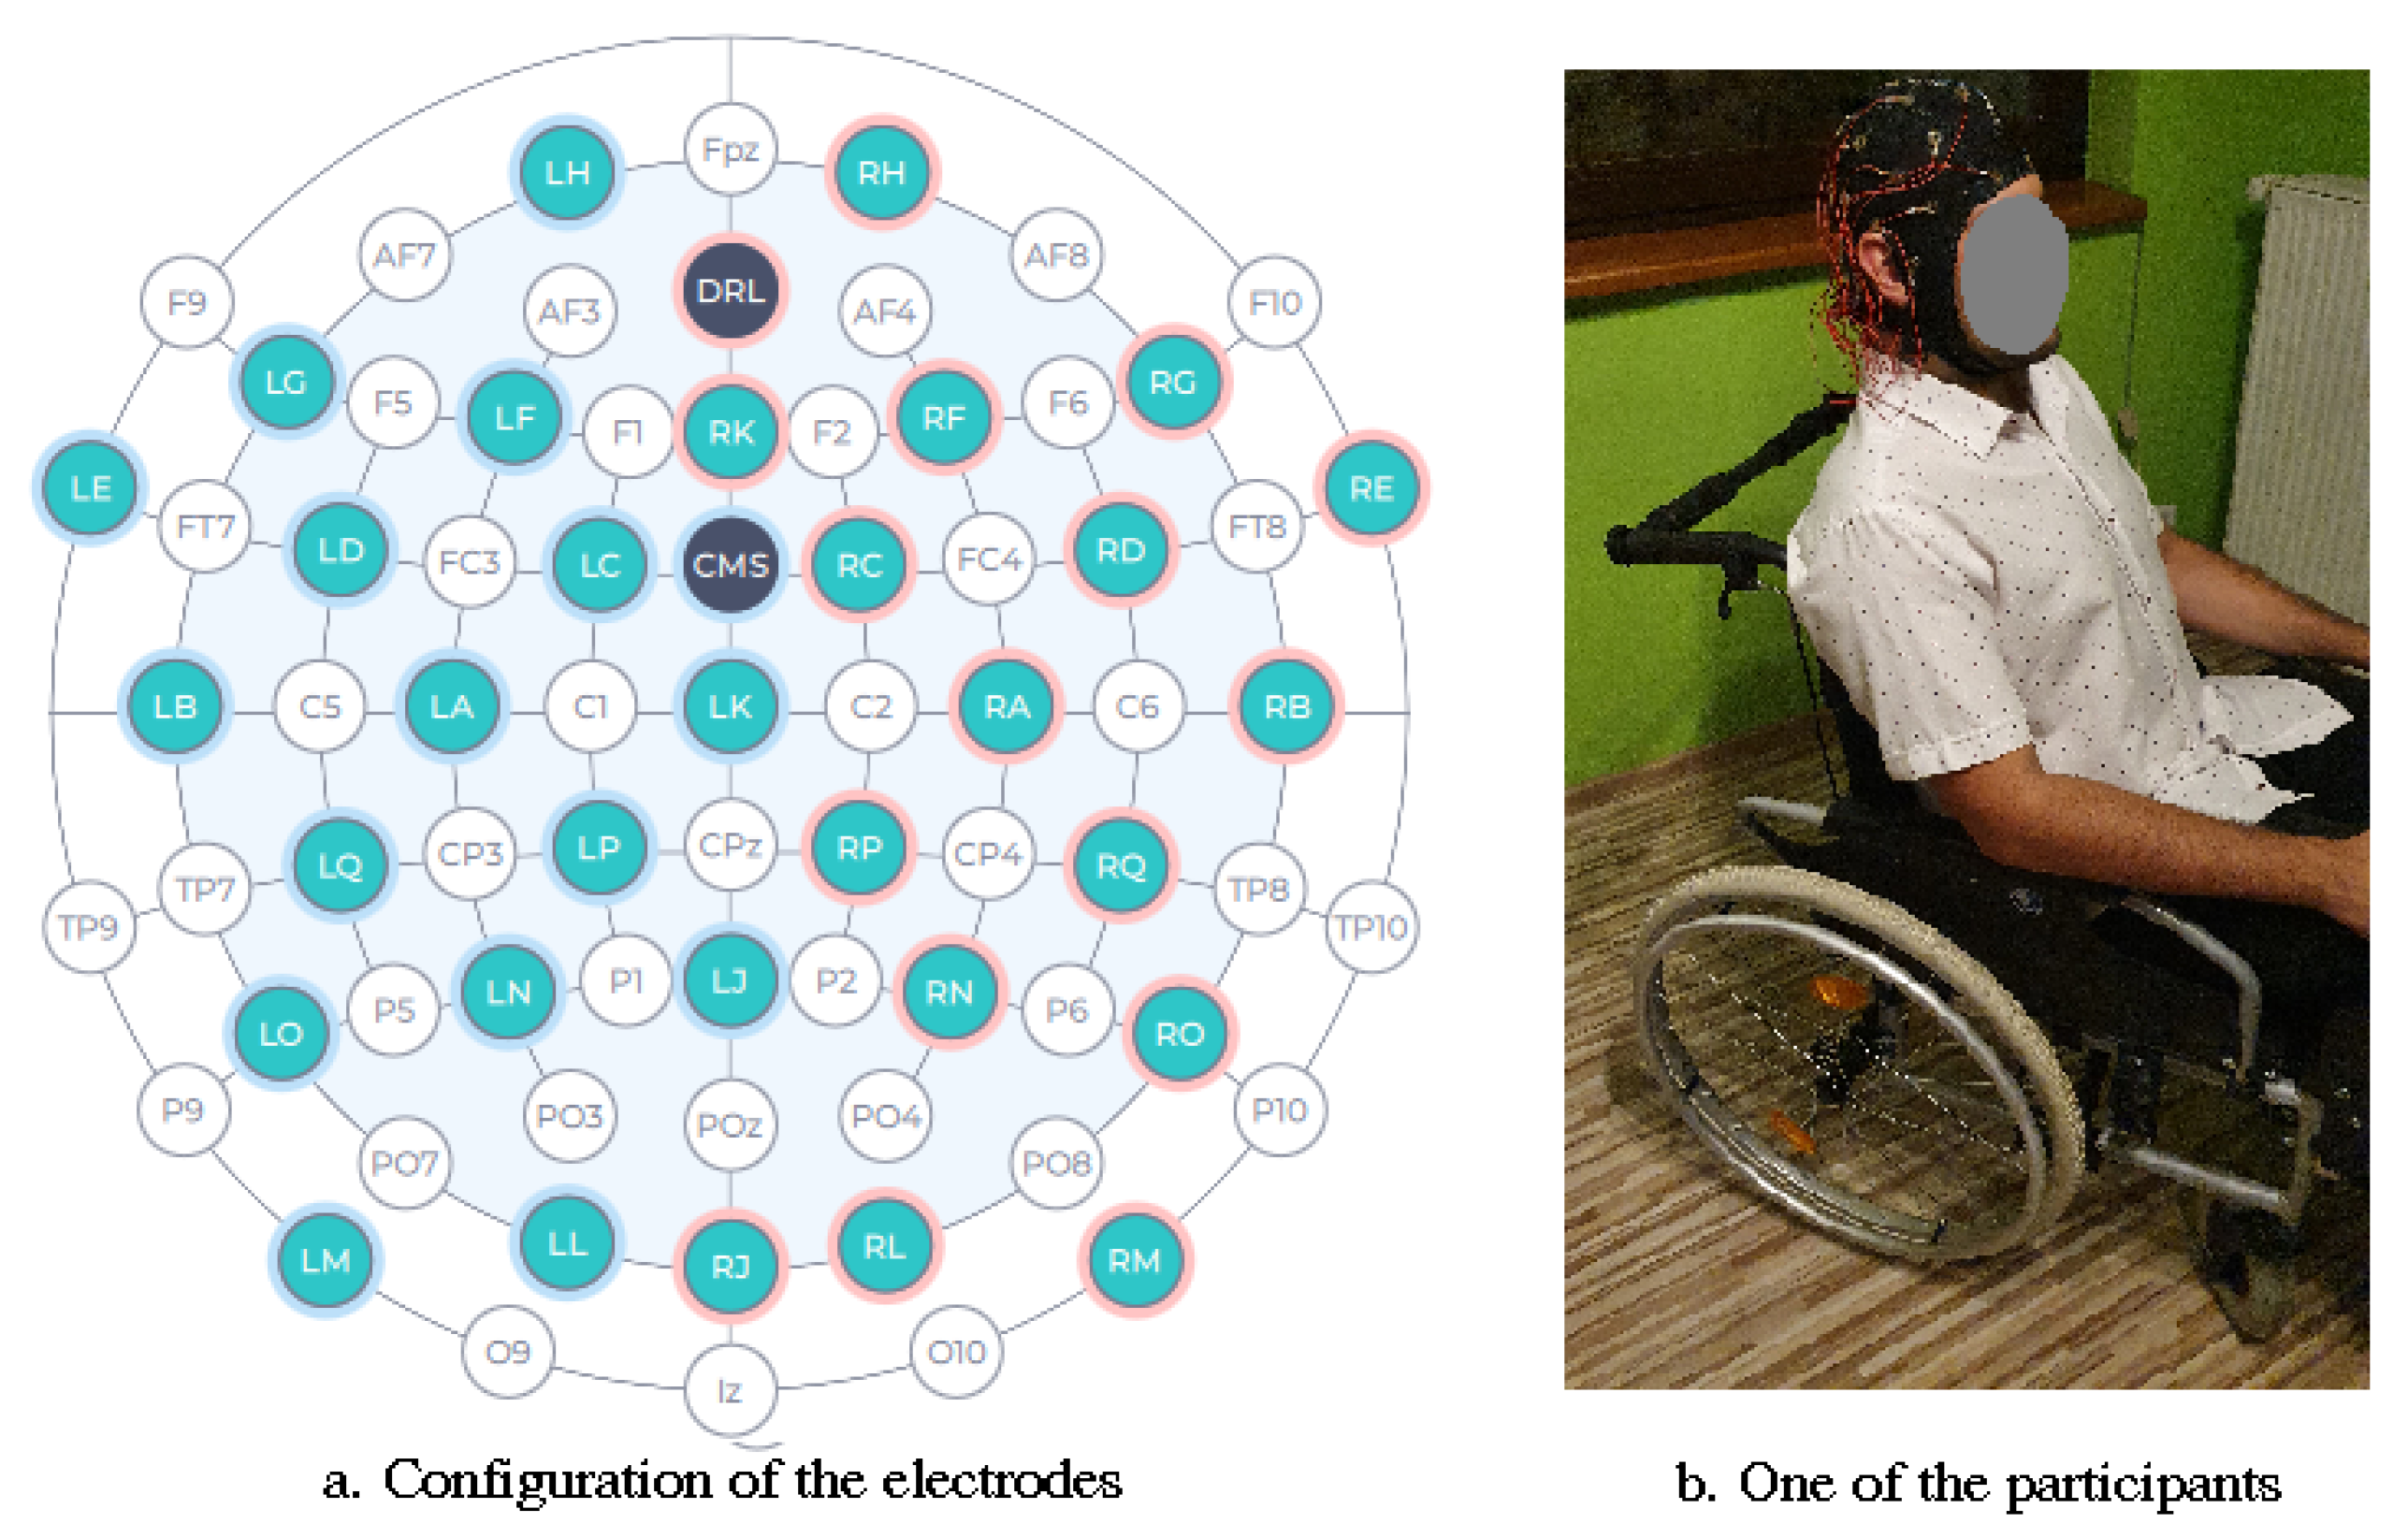
Table 2 summarizes the set of all channels with their associated names, as shown in
Figure 1. The green channels represent the electrodes that were used for the test. The white marks, however, were not used in the study. Moreover, this drawing contains an example of a graphic presenting one of the participants of the study placed in a wheelchair.
The next section contains the purpose and planned course of the research, as well as the test assumptions.
3.1. Description of the Task and Related Assumptions
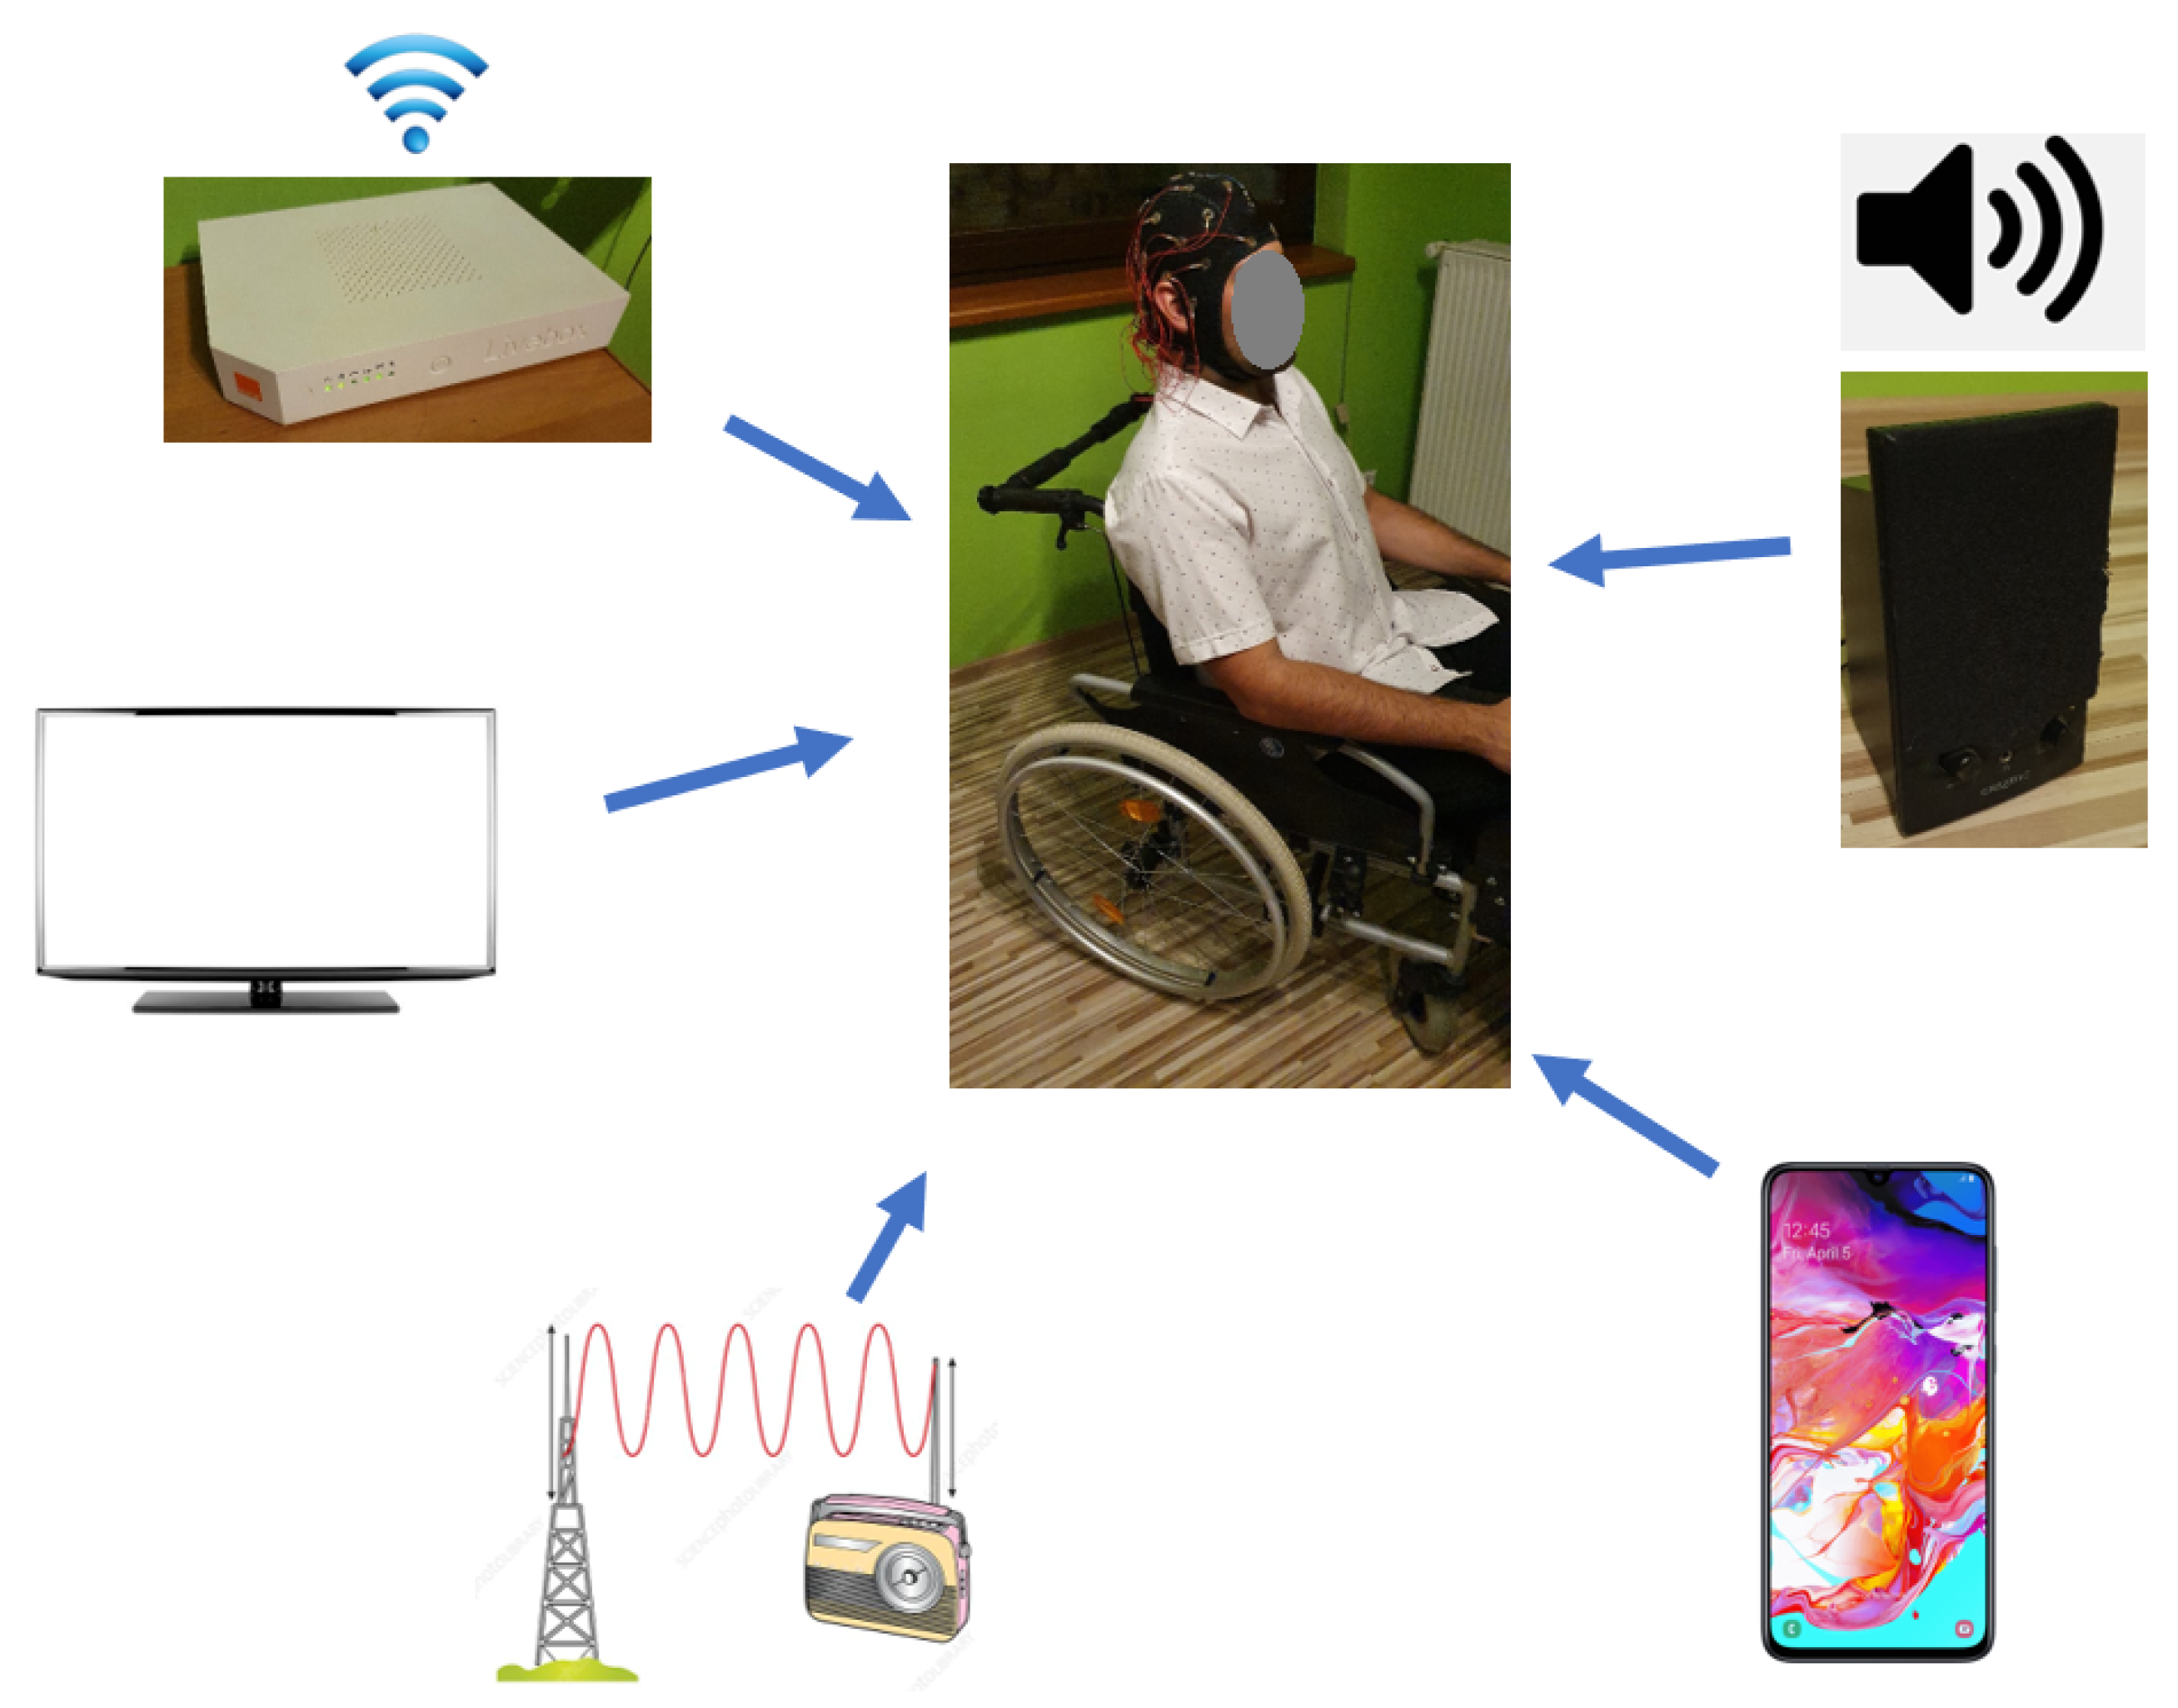
Eight male and female subjects aged 23–51 were asked to participate in the study. Each of the test members was tasked with taking 15 measurements of repetitive signals consisting of various facial expressions and simulated nervous tics. While the combination of repetitive sequences of specific facial expressions for the classification of control commands was the same for all measurements, the calling of neural tics artifacts was not. The authors decided that each of the 15 measurements per participant would be divided into 5 measurements for each of the three tics. Thus, for 5 measurements, the signal was disturbed by eye blink artifacts, the next 5 measurements disrupted the neck muscles tensions, and finally the last 5 measurements of each participant were accompanied by alternating left or right shoulder strains. The measurement consisted of the following sequences, each lasting a few seconds: neutral state, frowning (two repetitions of a nervous tic during this time), neutral state (one repetition of a nervous tic during this time), squinting of the right eye (two repetitions of a nervous tic during this time), neutral state (one repetition of a nervous tic during this time), squinting of the left eye (two repetitions of a nervous tic during this time). In this configuration, the frown corresponded to the forward movement command, while the squinting of the right or left eye was responsible for the right or left movement command. During the measurements, each of the participants of the study was moved in a wheelchair by an assistant, and in addition, there were loudspeakers in the room which alternately emitted the sound of the street, TV or radio. In addition, there was a Wi-Fi wireless router in the room. Due to this sequence of actions, the signals collected in the measurements lasted about 70 s.
Figure 2 provides an overview of how the research was carried out. We can observe a test participant with the Emotiv Epoc Flex Gel headset on his head, being moved by an assistant in a wheelchair. In addition, sources of additional interference, such as TV, radio, Wi-Fi router or a loudspeaker emitting street sounds, are also marked.
Such treatments were intended to reflect the real conditions of the everyday life of disabled people as closely as possible. After collecting an appropriate number of measurements, their filtering and classification took place using the artificial intelligence included in the expert system, which is described in
Section 3.2 and in the following sections.
3.2. Structure of the Expert System
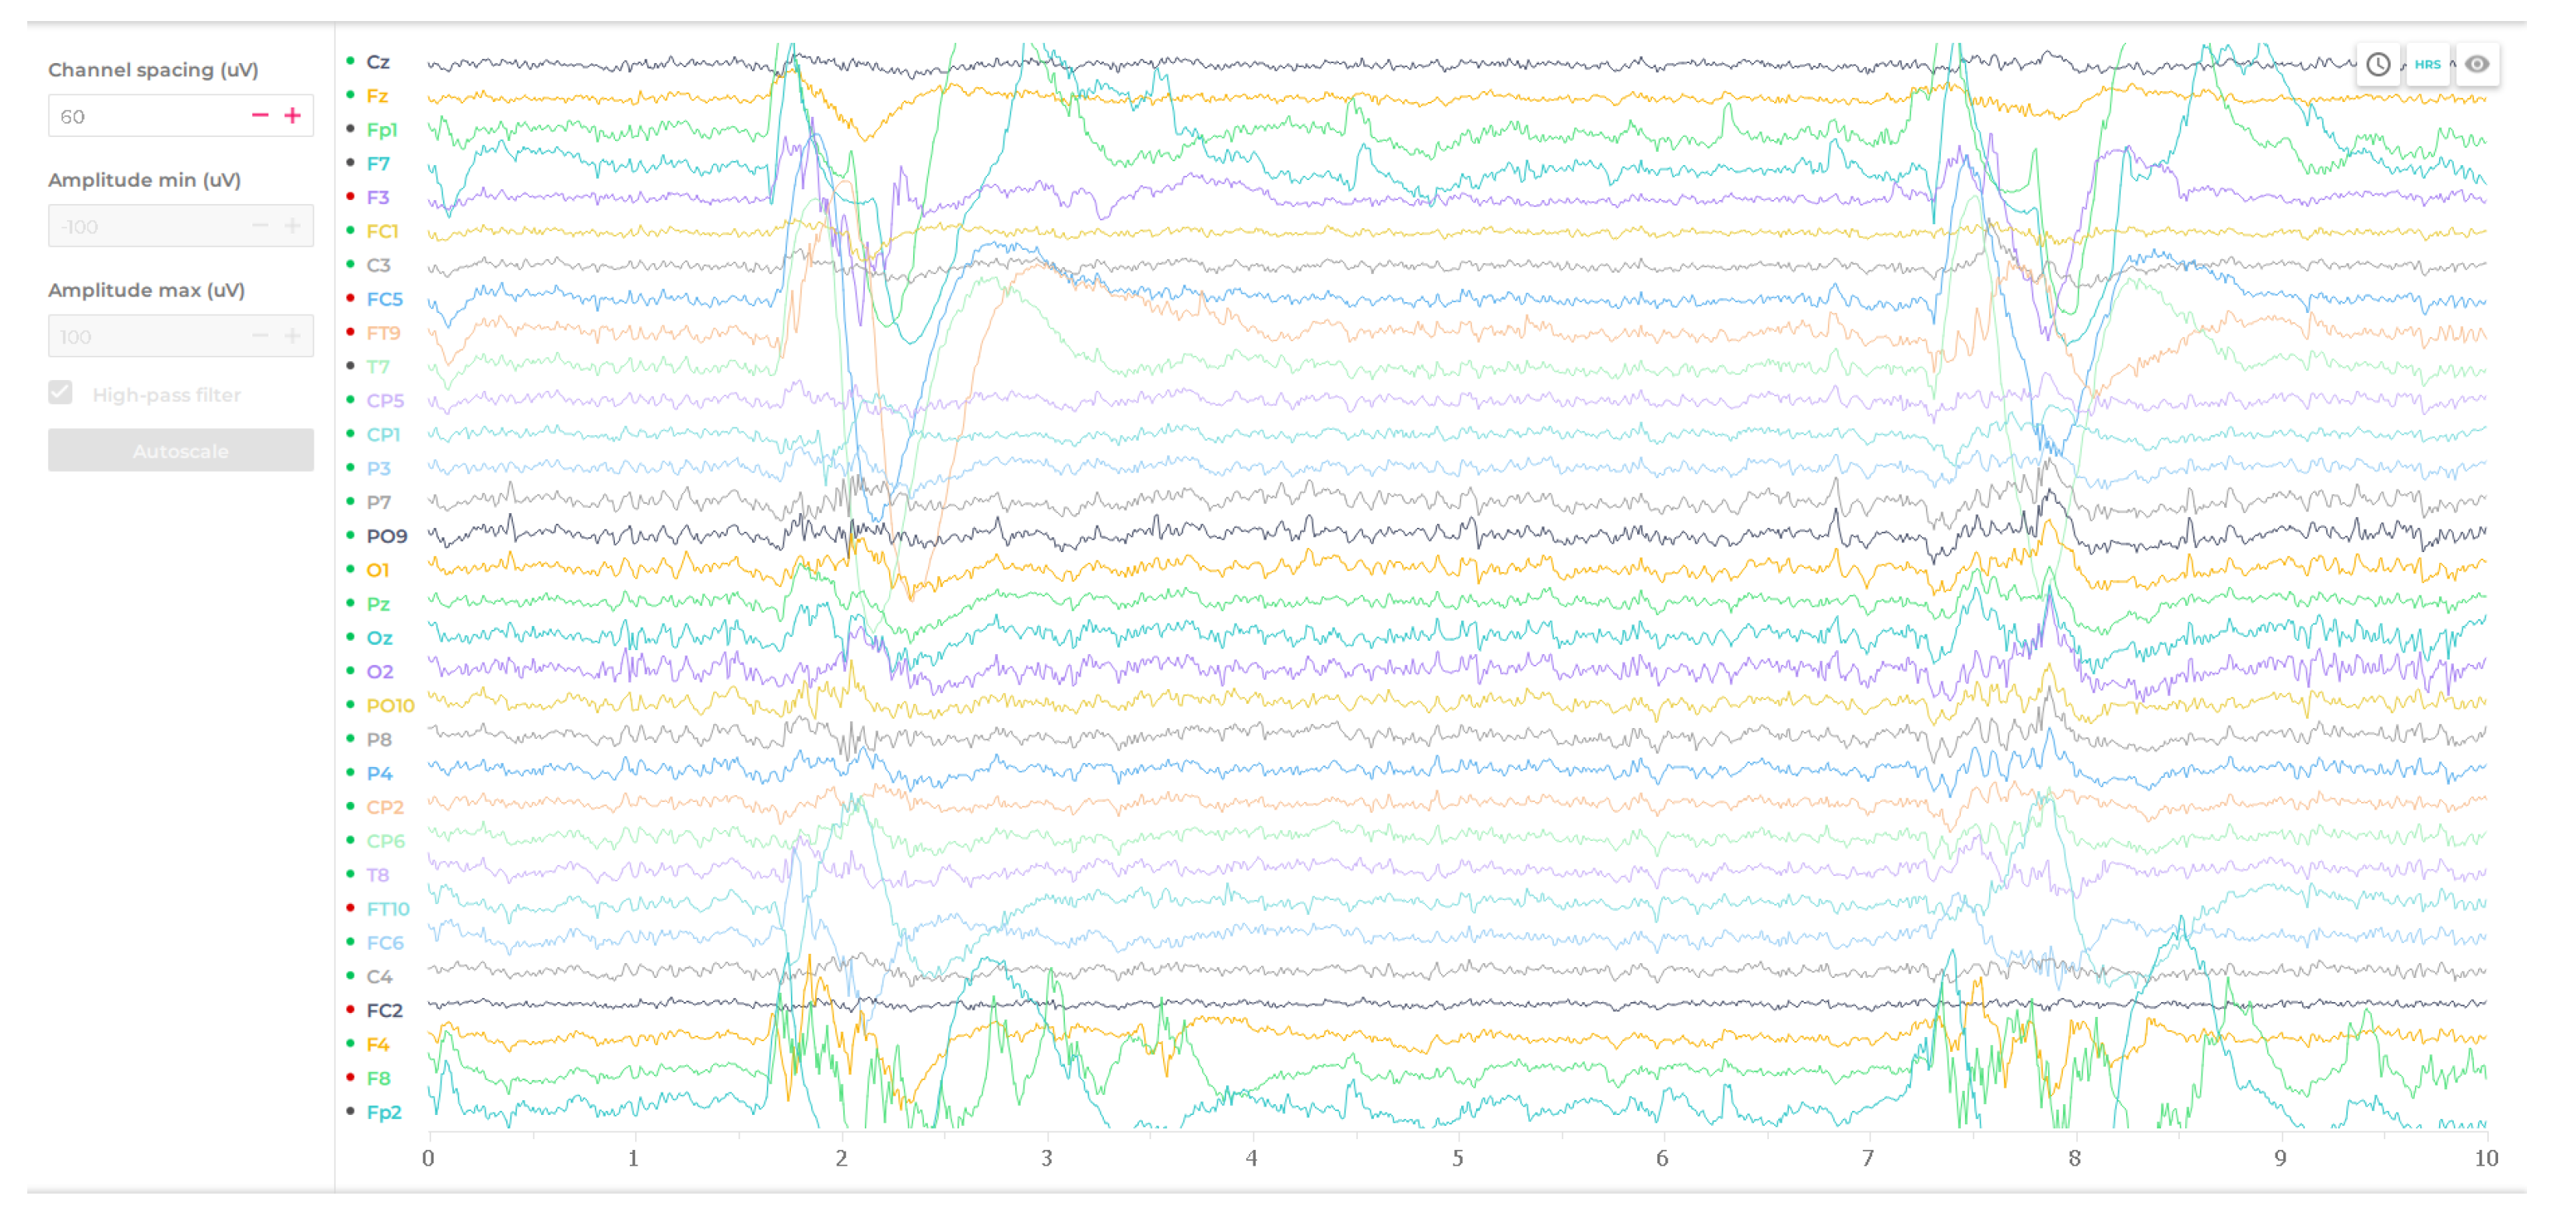
Dedicated EmotivPRO software allowed one to archive a raw EEG signal with the Emotiv EPOC Flex Gel headset. The product allows one to export data to a selected file type, and then check its features and properties in any other software.
Figure 3 shows the preview of the measured EEG signals in the EmotivPRO application.
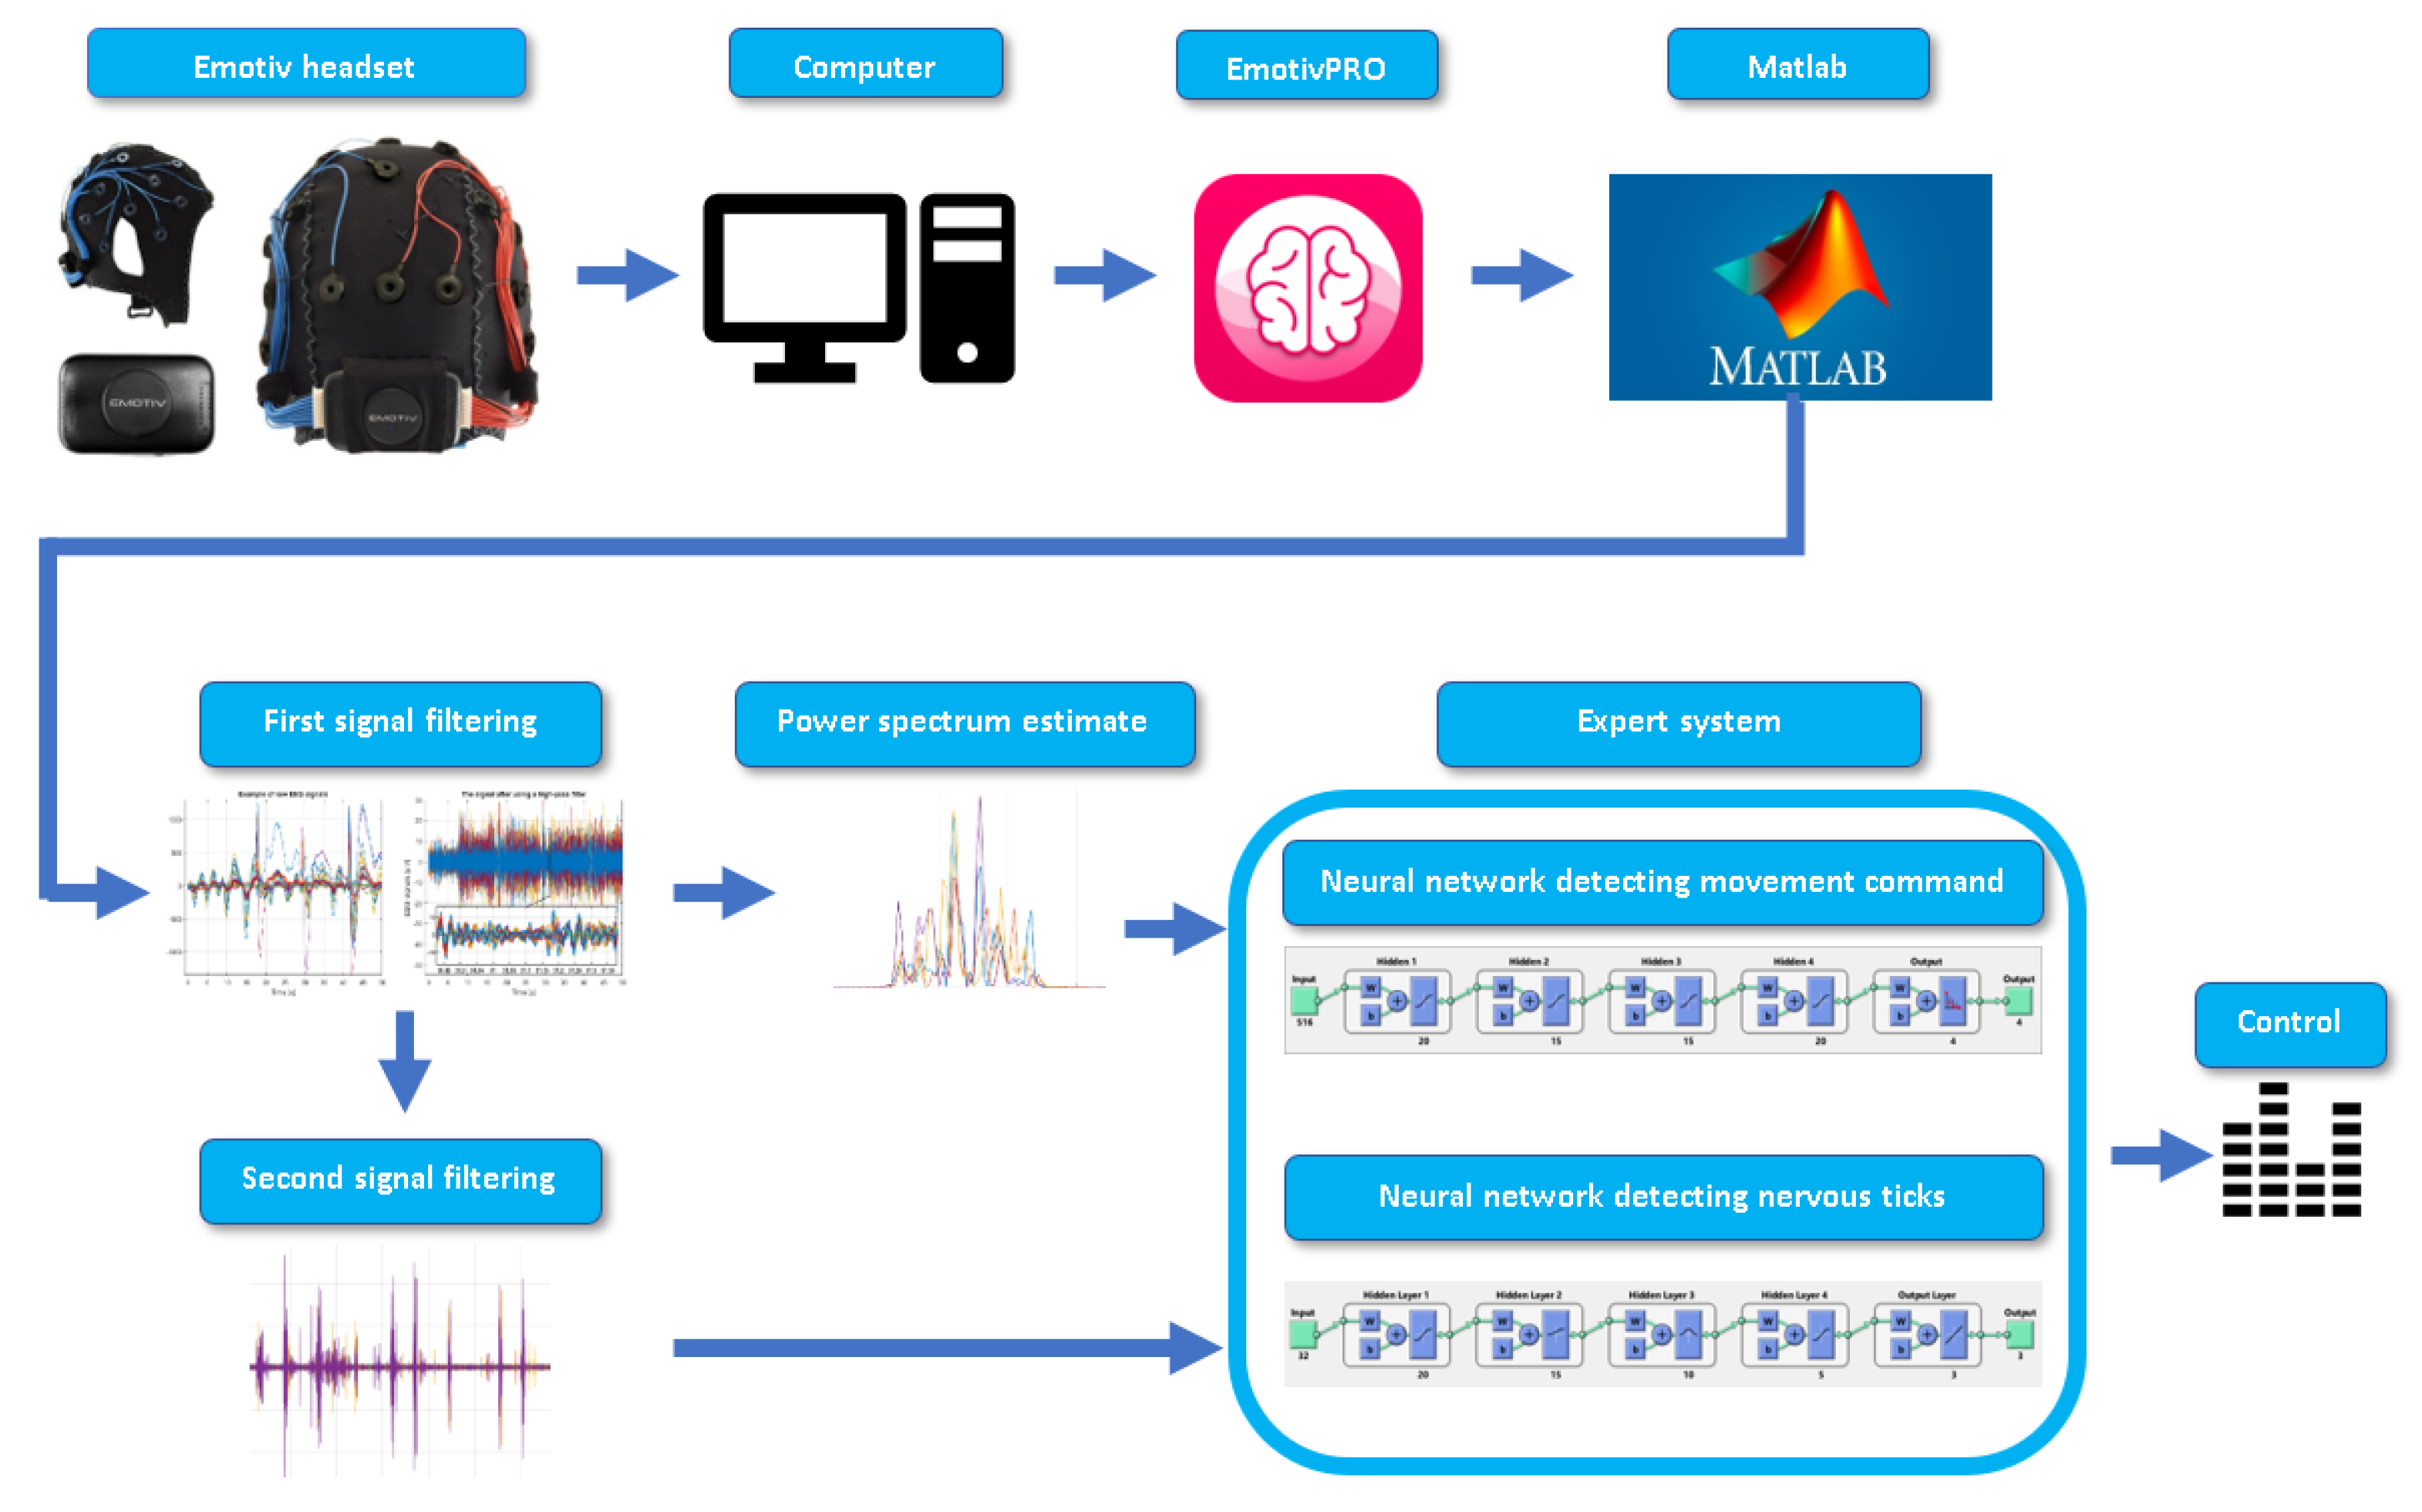
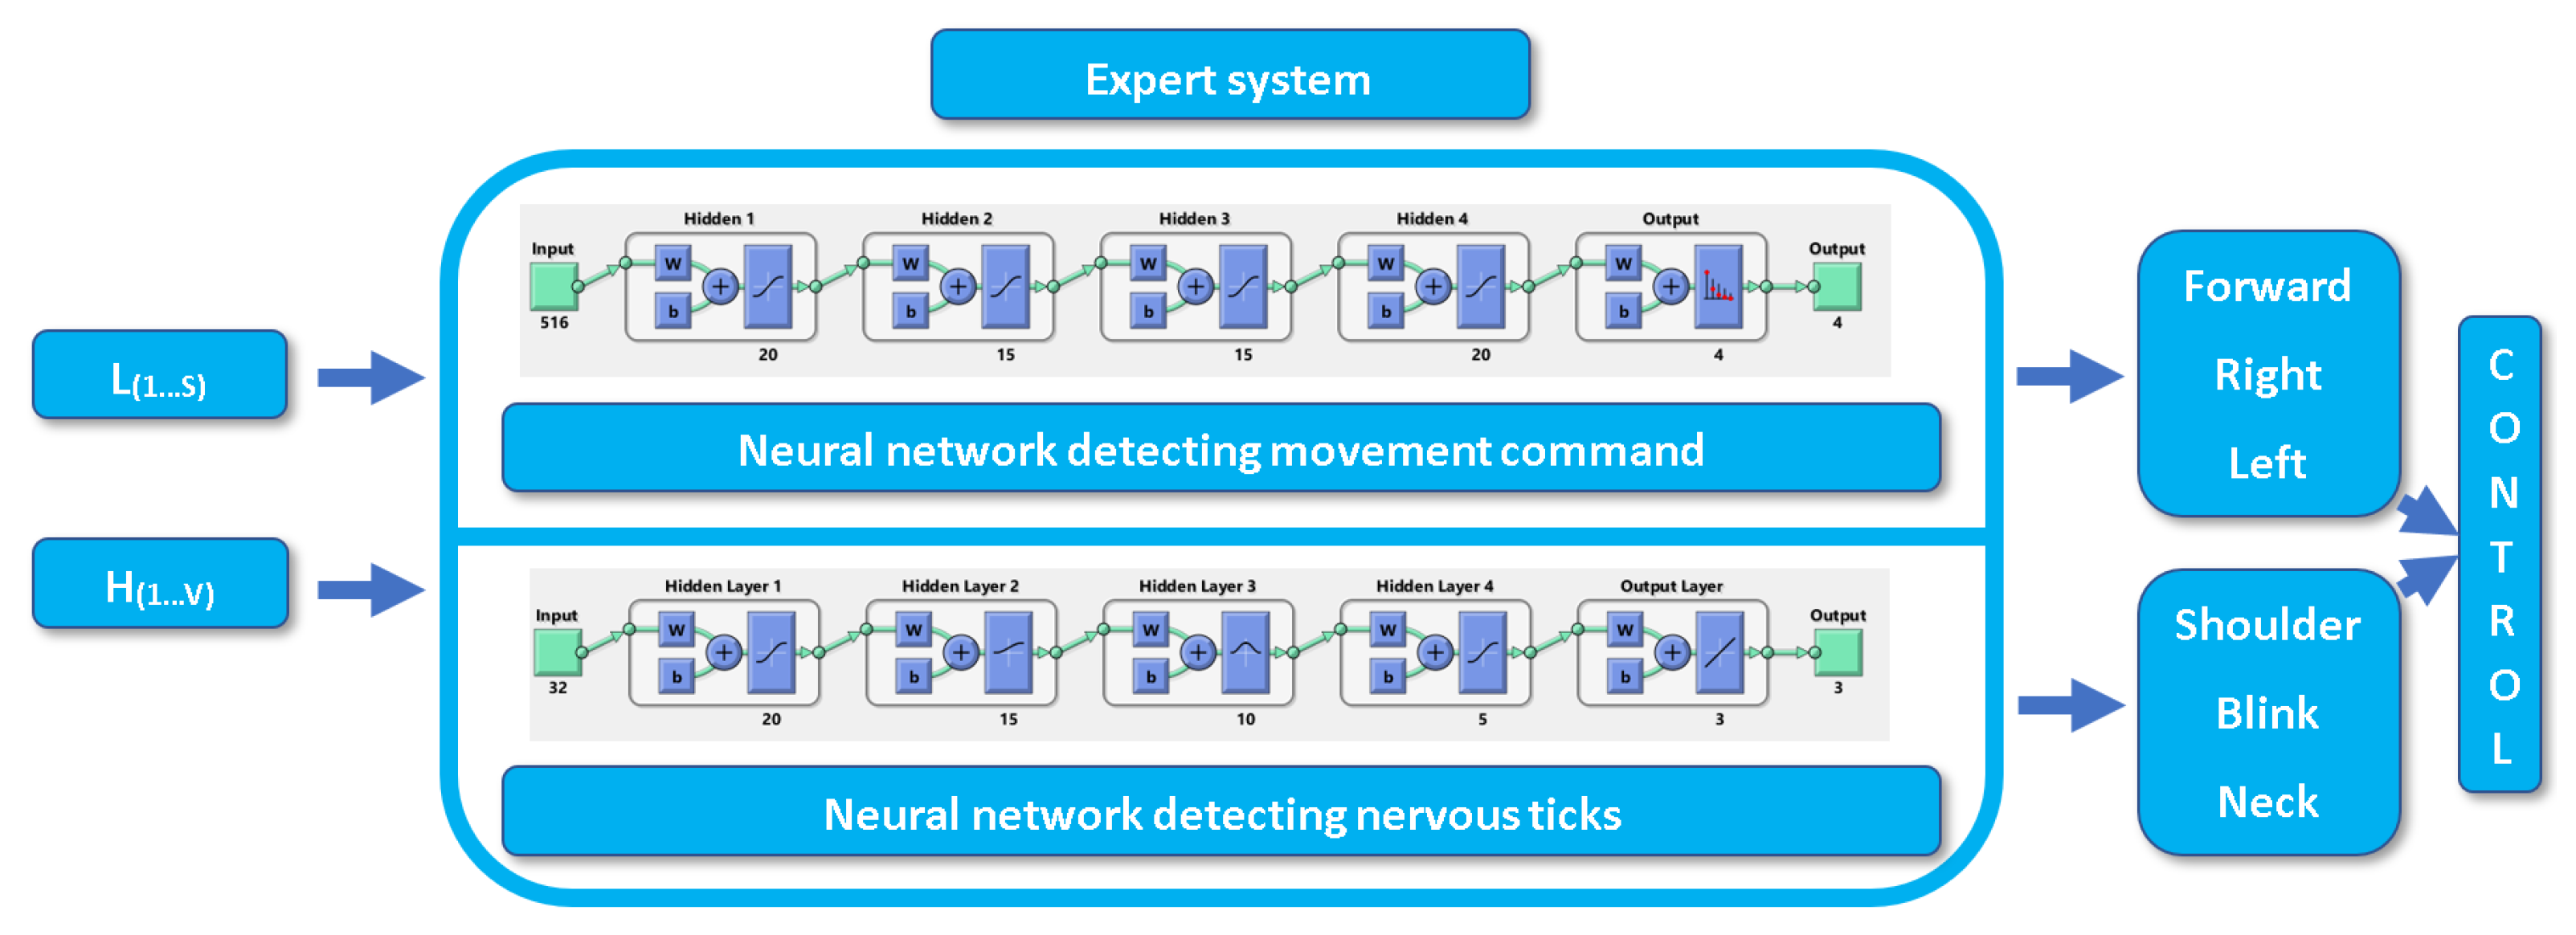
The designed system was composed of several components and its structure is presented in
Figure 4. The signal collected from the BCI headset went to the computer connected via Bluetooth technology. The raw signal should be properly filtered (see
Section 4), as its analysis is much more difficult.
During the research, all analyses and classification methods were performed with the help of the Matlab programming and numerical computing platform. Thanks to this software platform, the authors had the opportunity to carry out appropriate modifications to the signals by filtering them. This enable an appropriate analysis and classification. All 32 electrodes available in the device Emotiv EPOC Flex Gel headset were used. It should be noted, however, that during the analysis of facial expressions for the purpose of generating movement commands, only 4 channels were used, which were: F8, Fp2, F7 and Fp1. Due to the fact that in order to create the control signal it was necessary to analyze the channels, the activity of which was the greatest when the muscles around the eyes moved. A completely different procedure took place in the case of the signal analysis in search of nervous tics. In this case, the authors decided to observe the potentials on all channels, due to the need for clarity and certainty of the appearance of the artifact.
As can be seen in
Figure 4, the raw signal was filtered twice (see
Section 4). The first filtering of the signal was adapted to the needs of the classification of traffic commands. An approach was applied using the analysis of one-second samples of the signal coming from each of the 4 analyzed channels (F8, Fp2, F7 and Fp1). Then, waveforms showing the power spectrum estimation were obtained. The result was 4 waveforms of power as a function of frequency for each of the electrodes and for each one-second signal sample. Checking the signal at such times was not pointless. In this way, unambiguity could be obtained in the reading of the state at a given moment of the signal. The obtained spectra were analyzed by an expert system, in which the learned neural network evaluated them (
Figure 4).
As can be seen in
Figure 4, the signal was refiltered to isolate the artifacts due to simulated neural tics. Then, the product of this operation went to the expert system, where it was analyzed by the second of the neural networks (
Figure 4). This time, however, all 32 channels were taken into account.
The next section effectively describes the procedure of preparing the EEG signal for filtering and thus the preclassification process is analyzed.
4. Preparation of EEG Signals for Double Filtering and Classification: Preclassification Part
This section discusses the entire preclassification process in detail. Details of the raw signal filtering for motion command detection as well as the refiltering performed to isolate nervous tics are presented. The preparation of the received signals for their subsequent analysis by artificial intelligence is also discussed (see
Section 4.2).
4.1. EEG Signal Filtering Method and Its Spectral Presentation for Motion Command Detection
As per
Section 3, the raw signal from all 32 channels was filtered. This was necessary for this project, because the signal without proper filtering is difficult to analyze. The example in
Figure 5 shows how unfiltered waveforms stabilize for a long time before reaching a steady = state voltage.
The authors implemented an algorithm that enabled high-pass filtering. The sampling frequency was
Hz and the bandwidth was
Hz.
Figure 5 shows the final form of the filtered signal.
The literature describes various ways of classifying EEG signals, including spectral analyses and various types of filtering. However, there is still no extensive collection of studies using the Emotiv EPOC Flex Gel headset compared to other sets of this company. Thus, methods for using this product for the design of BCI systems, signal processing and measurement classification methods are constantly being developed.
The signal sampling frequency by the dedicated application was
Hz. The authors decided to generate a power spectrum of one-second signal samples for each of the 4 channels separately (F7, Fp1, F8, Fp2). It was therefore possible to unequivocally assess the actual state that took place in this period of time. We formulated Equation (
1) to represent the number of samples per signal. Using the
S variable, we could express the number of one-second spectral verification samples that were allocated to the entire measurement. The
V variable was a presentation of the number of all samples included in the measurement. The signal sampling frequency was described by a variable
.
Taking a 15 s signal of
samples as an example as represented in Equation (
1), the result was
. However, substituting a 20.5 s signal with
samples in the same formula resulted in
as only full one-second periods of electroencephalographic samples were taken into account. This was due to concern for unambiguous results. The
S result was necessary for use in Equation (
2).
It is worth paying attention to the method of collecting data resulting from the spectral analysis of one-second EEG signals. After the Equation (
2) analysis, it can be observed that the obtained spectral results for the four selected electrodes (F7, Fp1, F8 and Fp2) were placed in the
K matrix with dimensions
i = 4 and
j = 129. It consisted of four one-dimensional vectors. In each of them, there was the result of the applied operation under the vector
of size
j.
As a result of the operation of obtaining the power spectrum of a one-second signal of 4 electrodes, the results of which were in the
K matrix, a relationship could be formulated according to which they could be collected into the matrix and then transferred to the neural network. Hence, Equation (
3) was formulated. Analyzing this relationship, it can be concluded that the
L matrix was the set of transpositions of the
K matrix arranged in one column for a one-second sample of signals. Hence, it was known that the dimensions of
L were 516 lines and
S columns. In this form, it was transferred to the artificial intelligence module in an expert system.
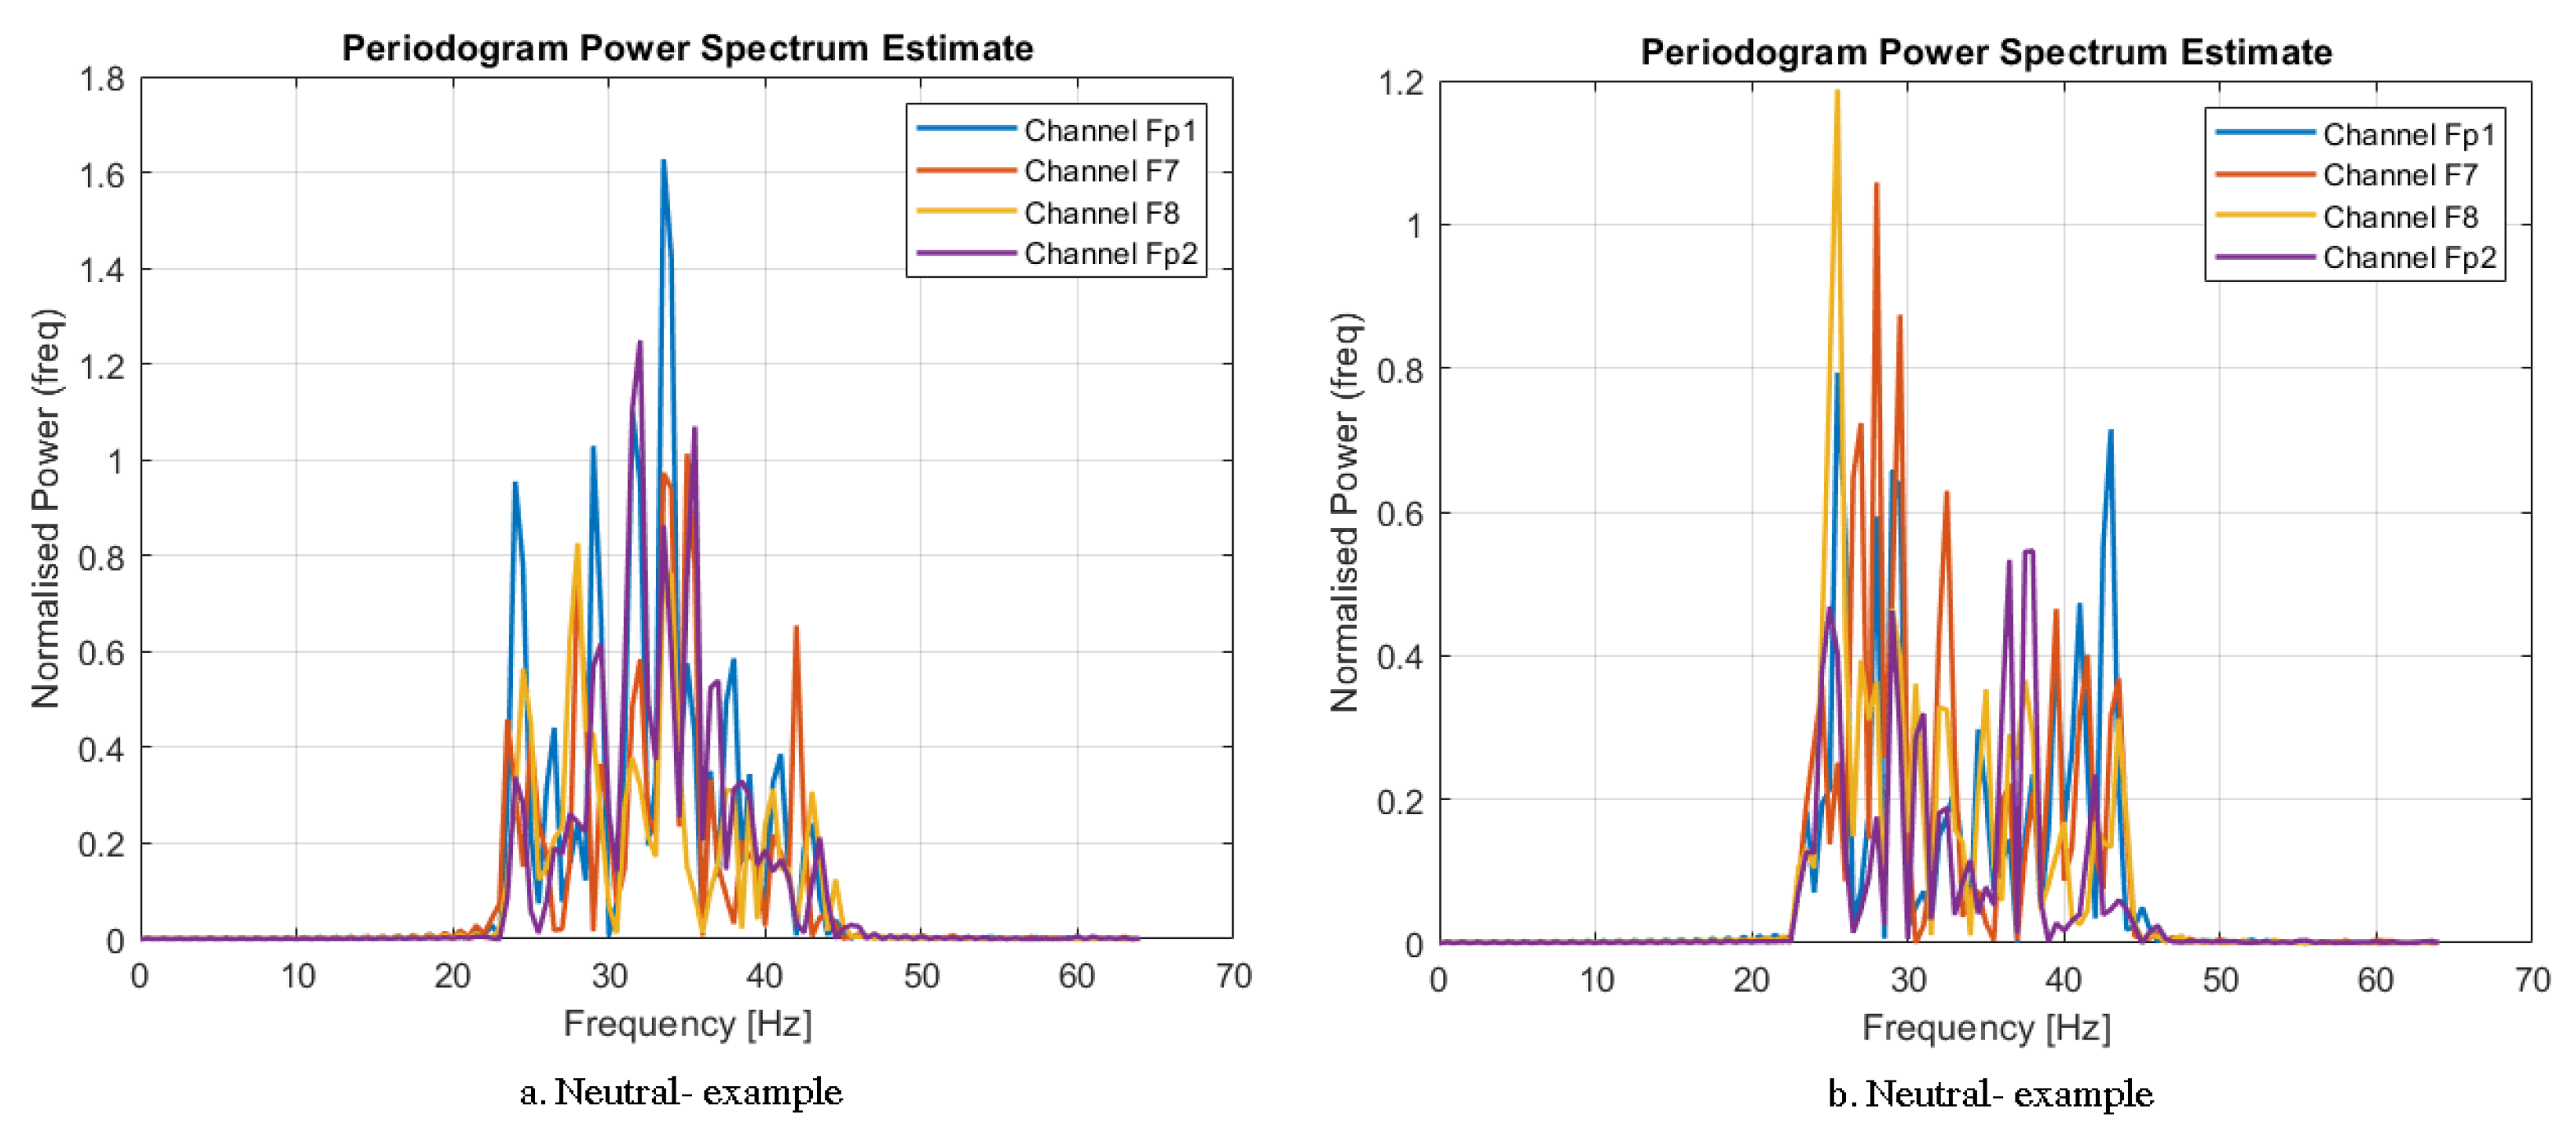
By using the tools available in the Matlab environment, it was possible to obtain results enabling the spectral analysis of the signal. Hence,
Figure 6,
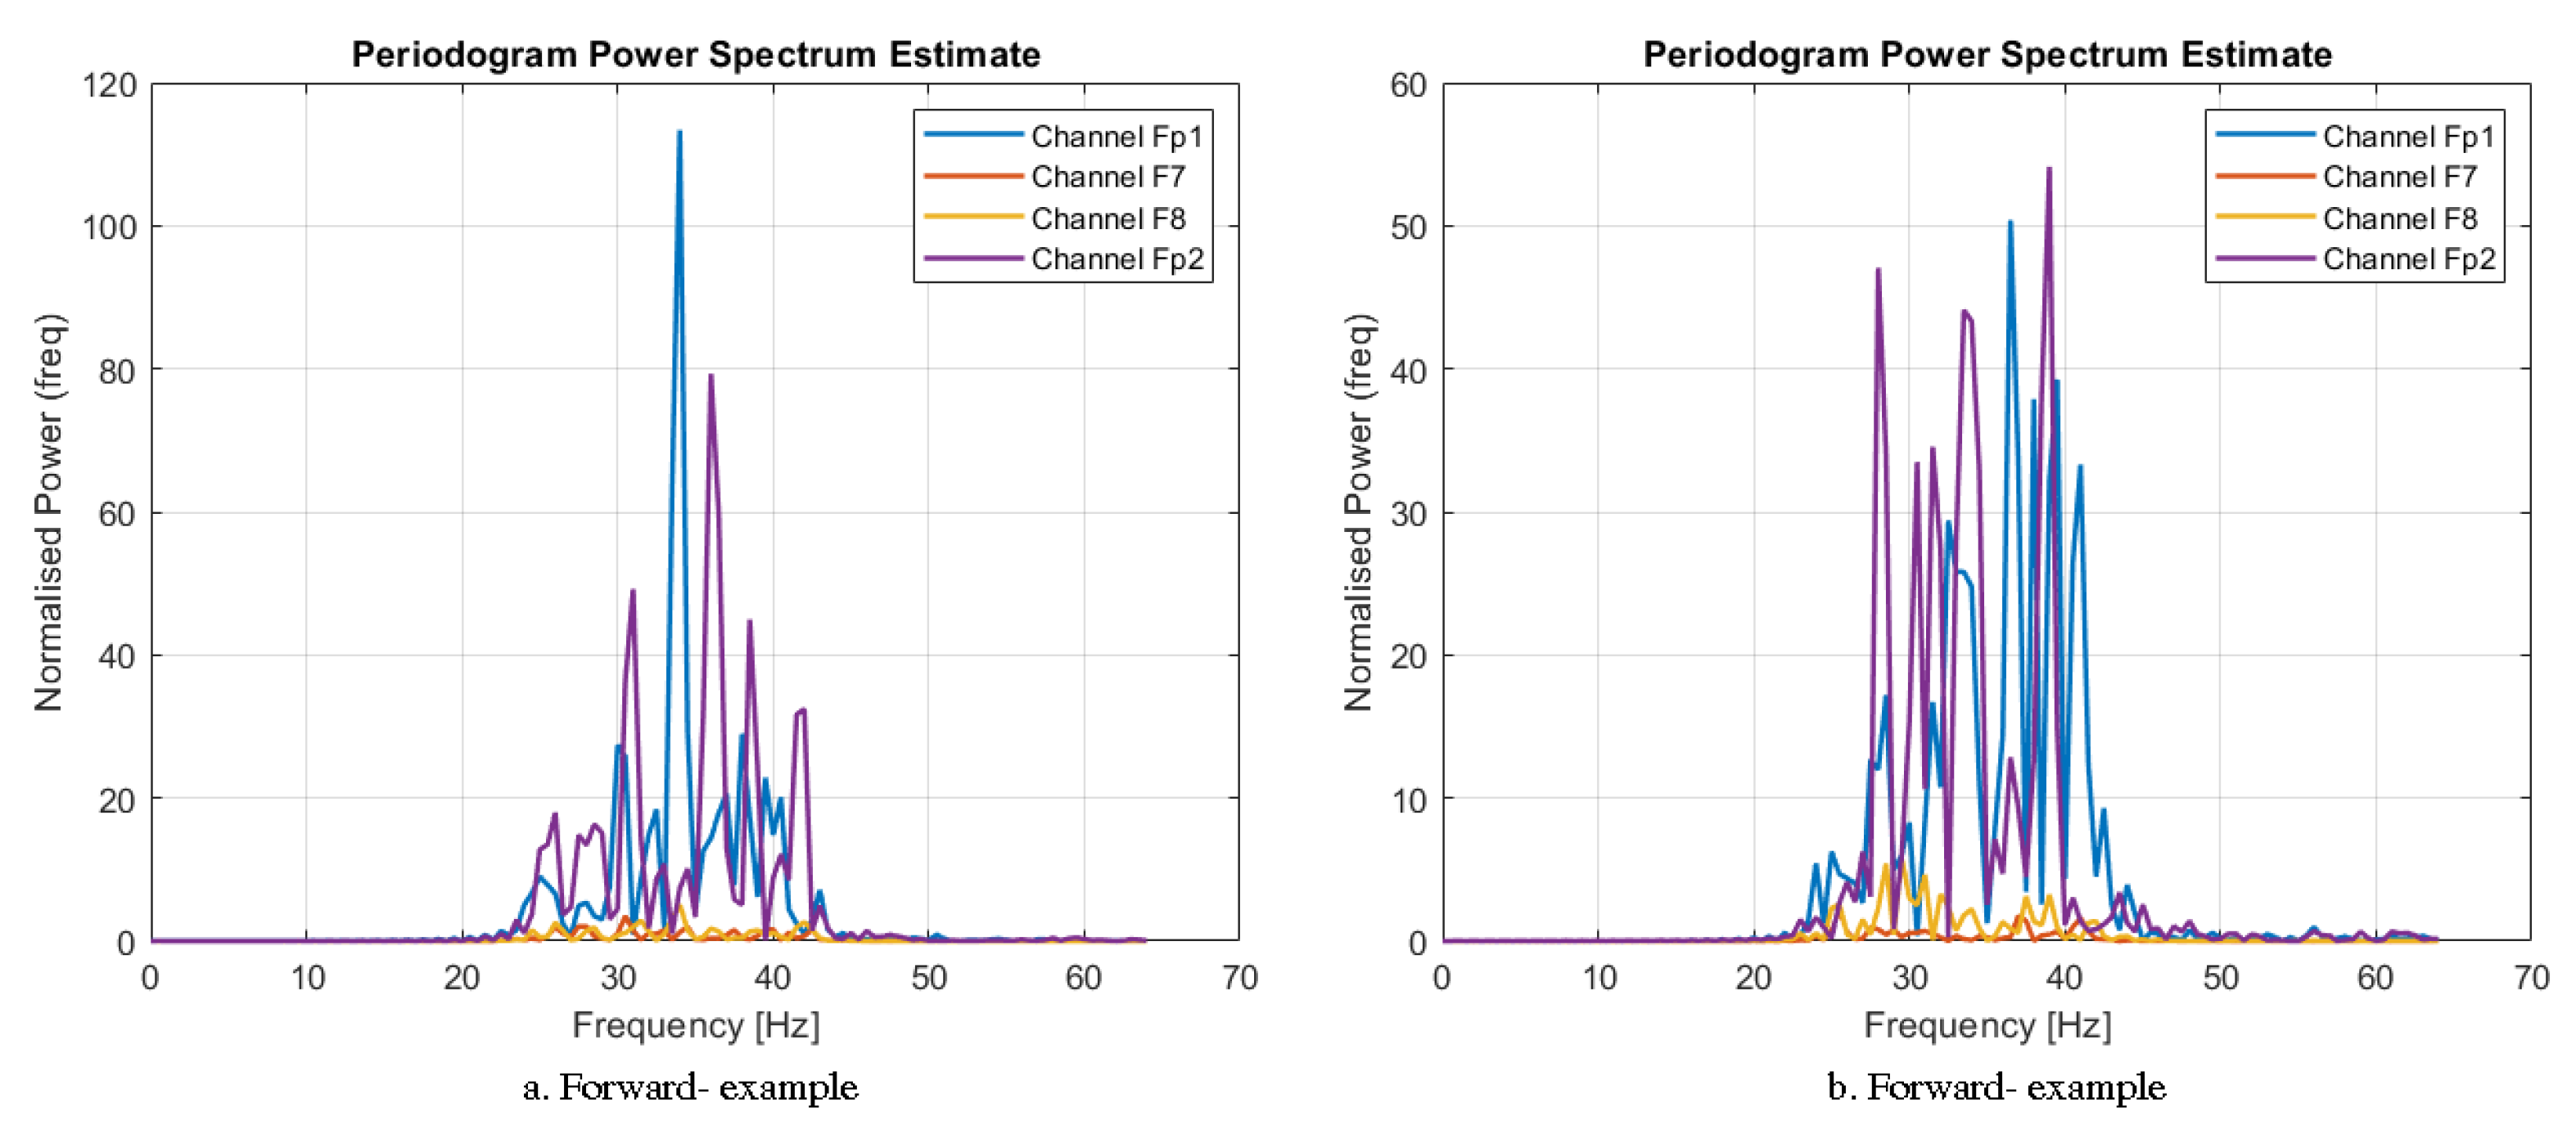
Figure 7,
Figure 8 and
Figure 9 show the periodogram of the power spectrum estimate.
Figure 6 presents exemplary results for the neutral state (without any facial expressions) for participants 1–2. The results of the normalized power waveforms as a function of frequency oscillated around 1.5–2 and none of the four analyzed channels was particularly more active than the others.
Figure 7 shows the results of the spectral analysis for frowning (command to move forward) for participants 3–4. In this case, the Fp1 and Fp2 electrodes showed particular activity and the highest amplitude.
As can be seen in
Figure 8, the channel in Fp2 and F8 was active in the case of squinting the right eye (command to move right) as expected. The amplitude was the greatest in this case. As in the previous spectral analyses, the highest values of the normalized power fell in the 25–45 Hz frequency range. Again, random samples from measurements made on participants 5–6 were used.
Figure 9, in turn, shows the results of the analysis for the move-left command signal (left eye squinted). In this case, the sample results of trials collected from participants 7–8 are shown. The highest amplitudes can be observed in the case of the Fp1 and F7 electrodes in the frequency vicinity of 25–45 Hz.
Section 4.2 details the signal analysis approach for detecting nervous tics during measurements.
4.2. EEG Signal Filtering Method for Nervous Tics Detection
The next stage of preclassification was filtering the signal again. The high-pass filtering method was used again. The sampling frequency was
Hz and the bandwidth was
Hz.
Figure 10 shows the final form of the refiltered signal. We can notice clearly distinguished increases in amplitude at the time of simulating nervous tics, which allowed for their effective classification.
Equation (
4) presents the method of data collection using the
H variable, in which the signals from 32 channels measured during the test were collected. Hence, the variable
H was a 32-row matrix with
V columns (number of samples).
Figure 11,
Figure 12,
Figure 13 and
Figure 14 effectively present the signal waveforms for each of the nervous tics. Graphics were collected from dedicated EmotivPRO software for the Epoc Flex Gel headset.
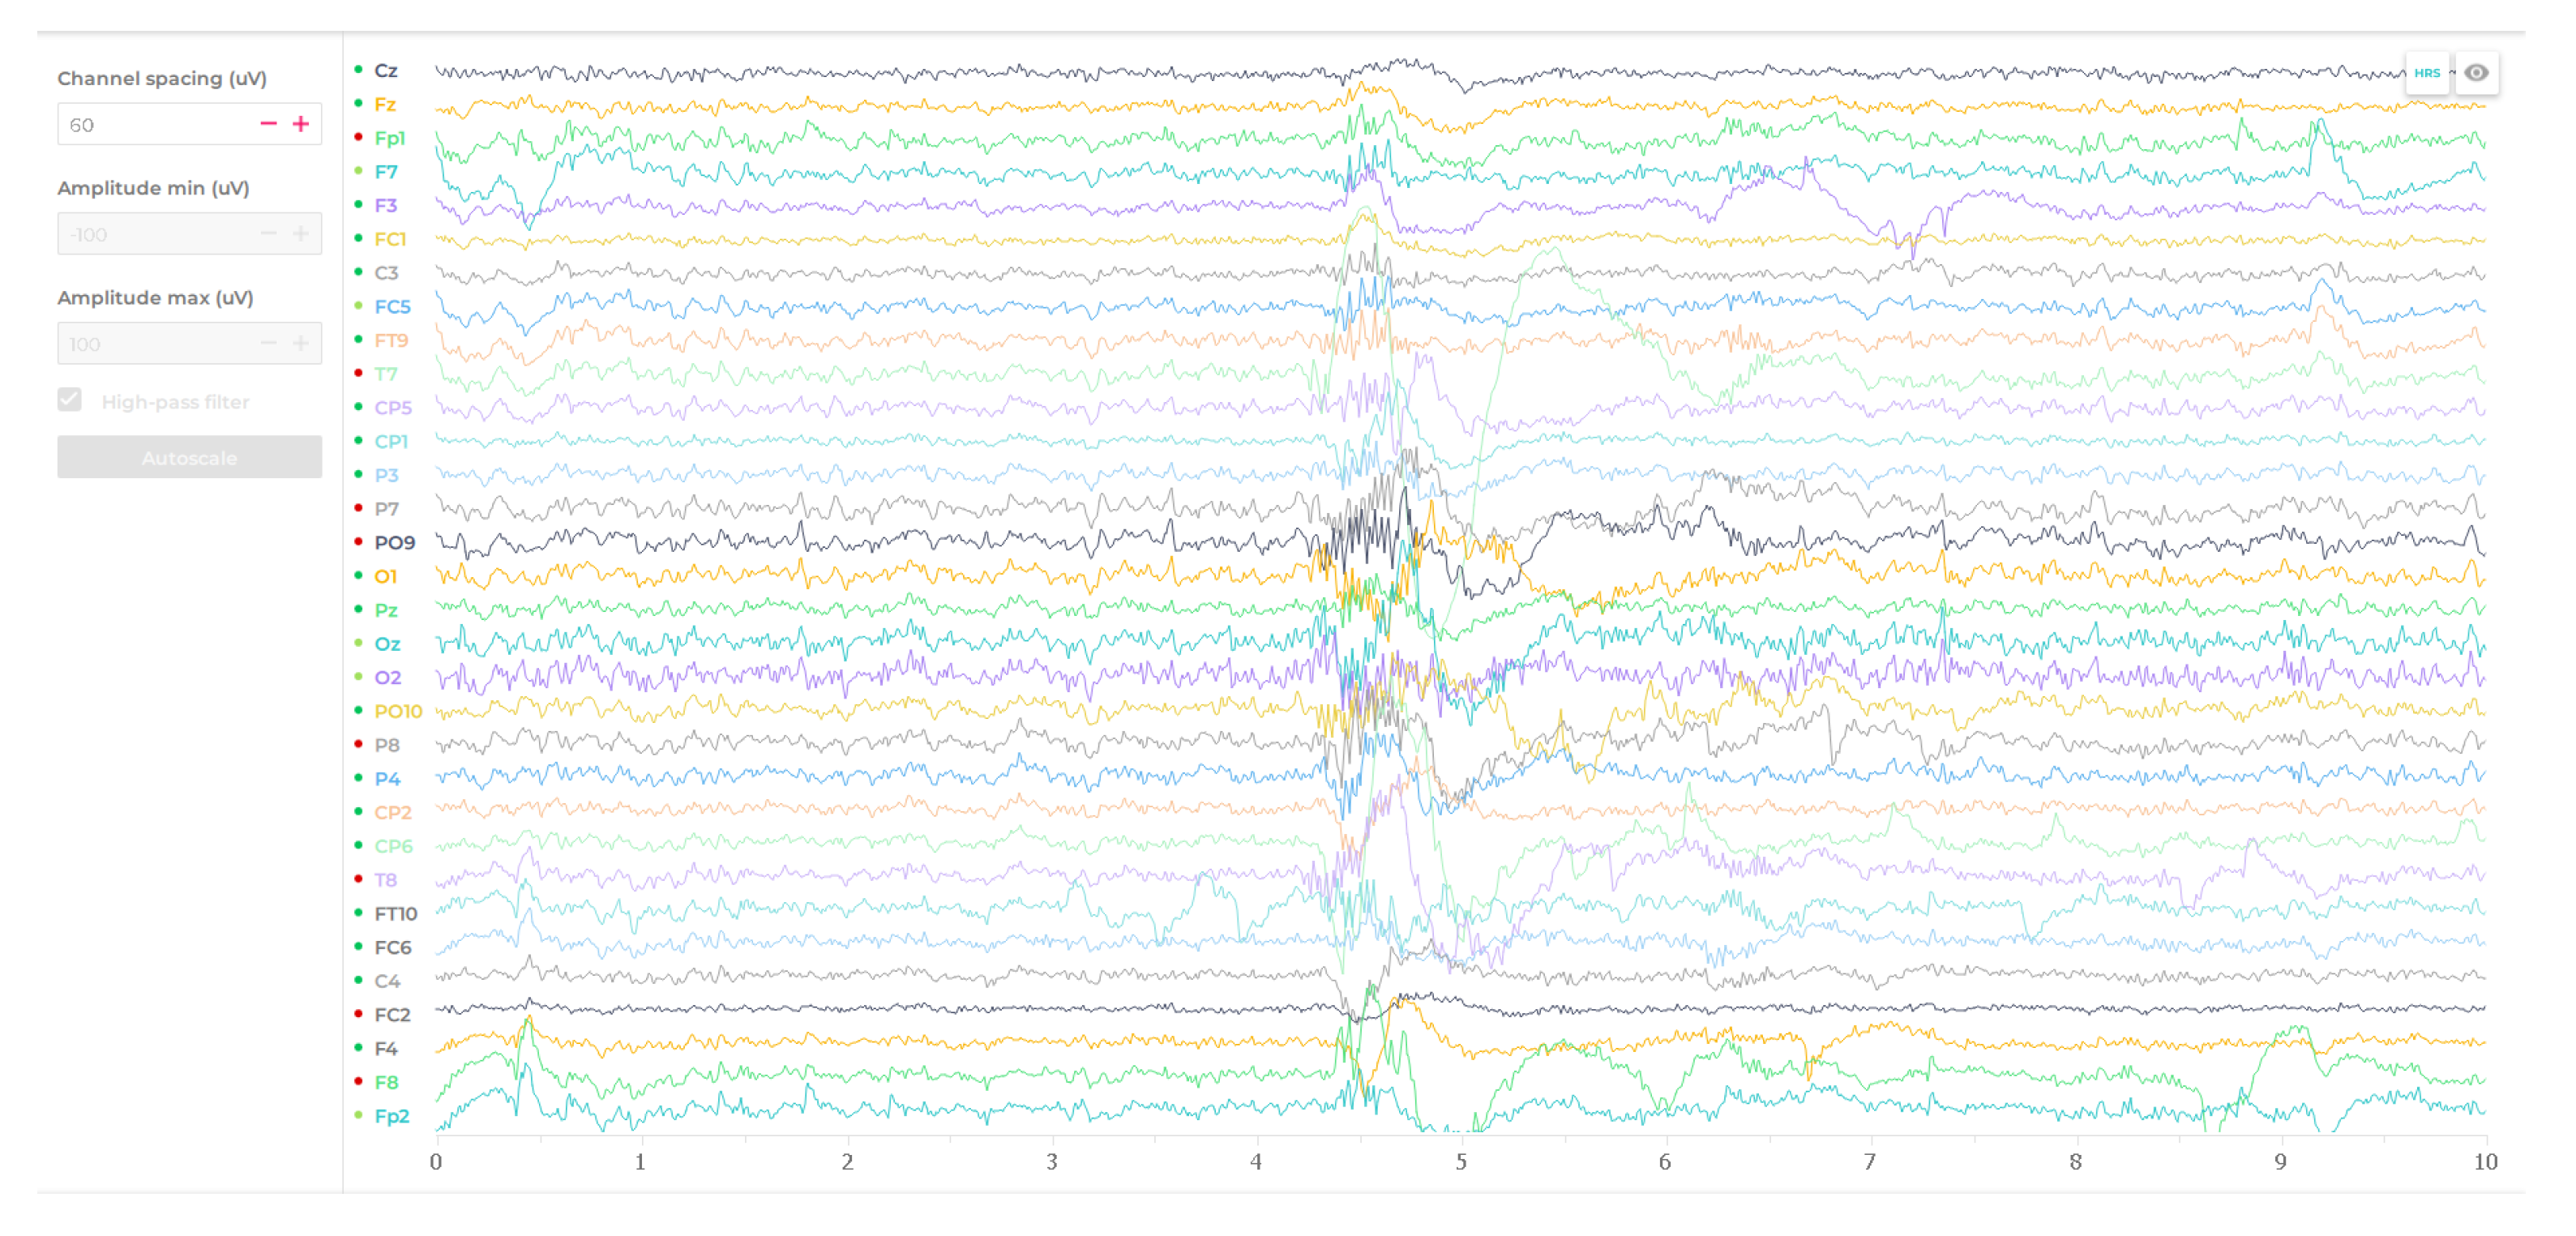
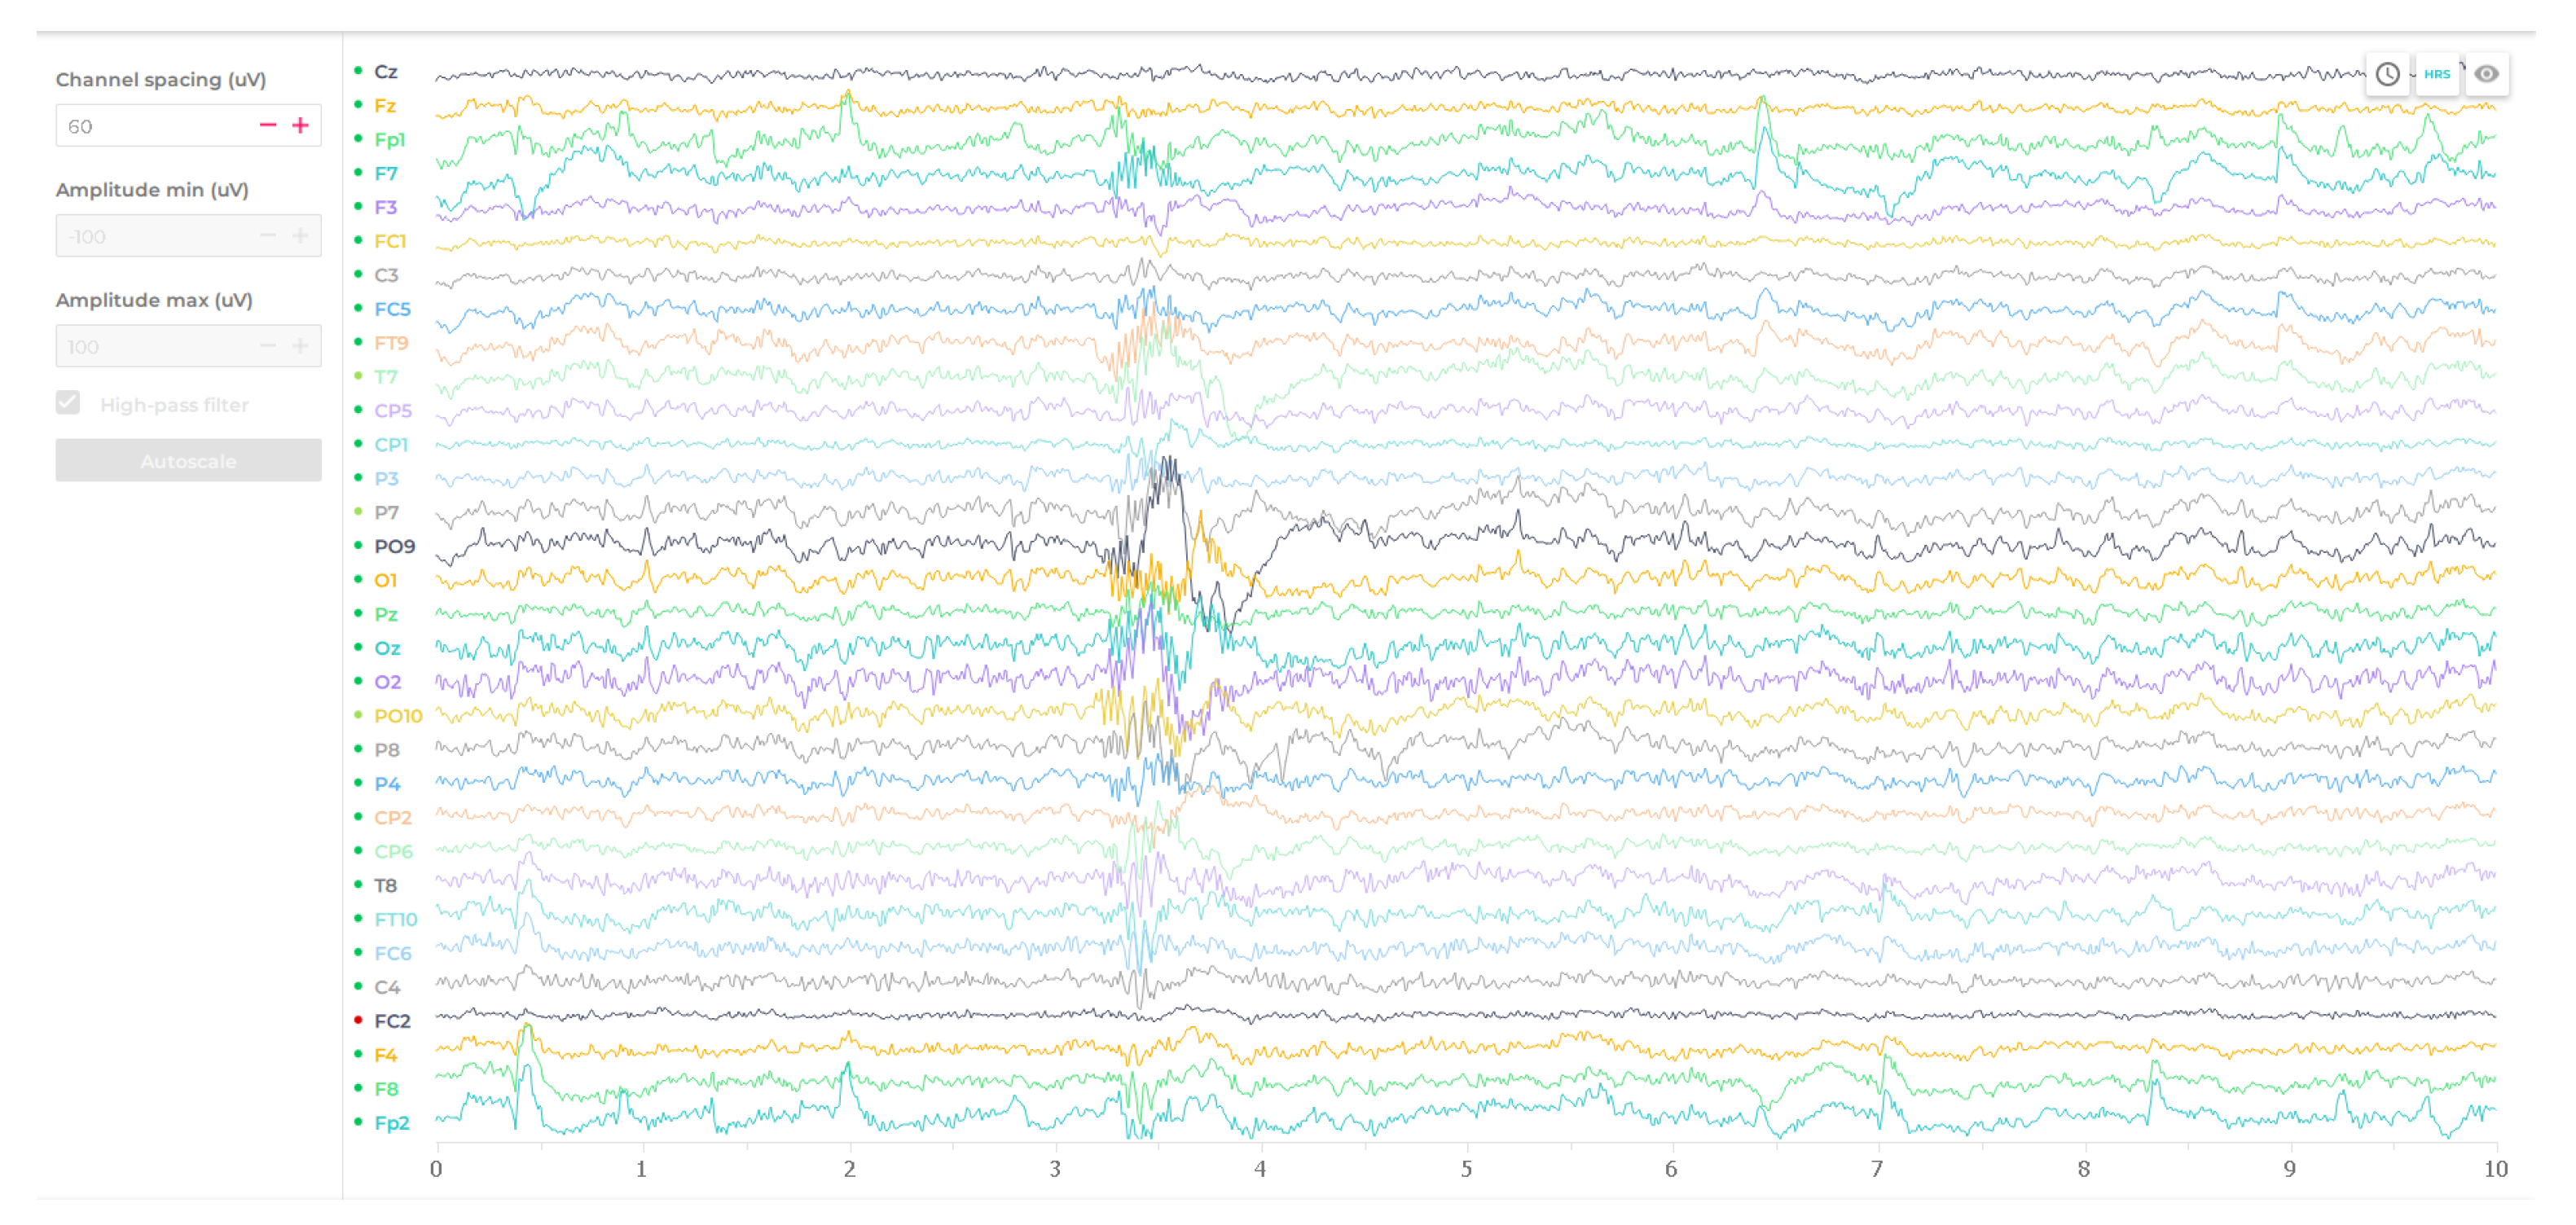
By analyzing
Figure 11 and
Figure 12, which illustrate the signals during which tics of the arm and shoulder muscles occurred, one can come to interesting conclusions. As you can see, this kind of neural tic caused an increase in amplitude on almost all electrodes. It was therefore distinctive, but did not affect the aspect from which part the artifact comes from. A similar waveform of the signal occurred for both the right and left parts.
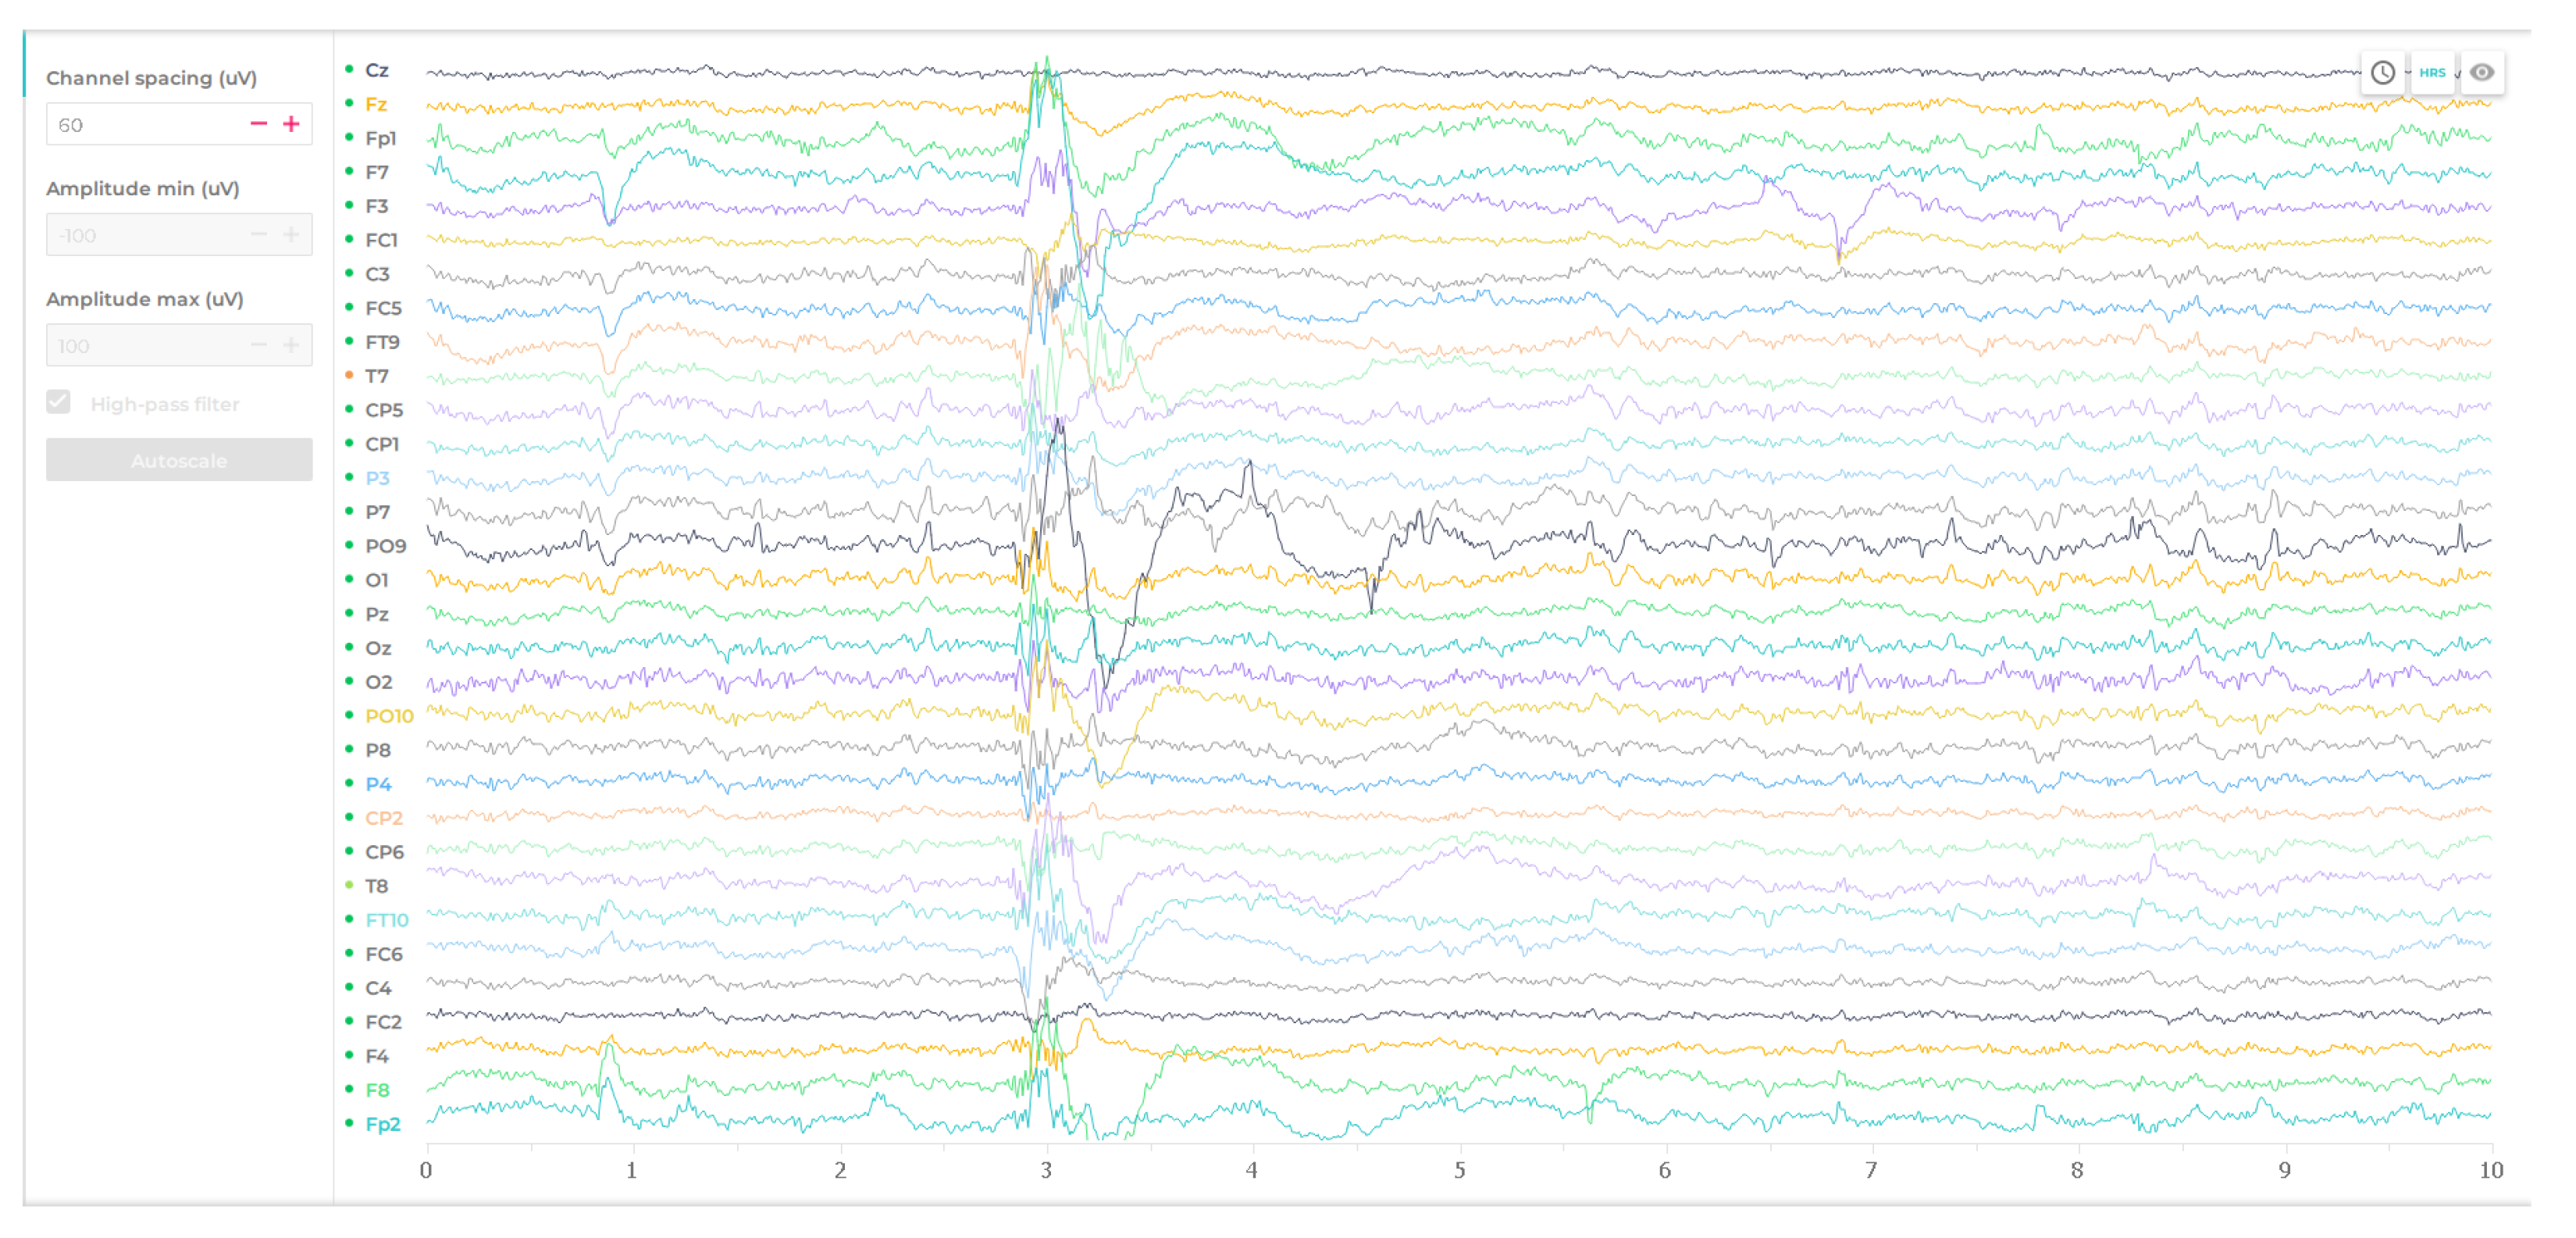
Figure 13 shows an example of a signal waveform with an artifact caused by a contraction nervous tic in the neck. You can immediately see its similarity with the results of the arm tic (
Figure 11 and
Figure 12). This may indicate some difficulty in distinguishing them by the classification system. However, it could be concluded that the neck tic artifact was somewhat “smoother” and had a similar amplitude value on all channels.
A completely different situation occurred for the eye blink tic signal (
Figure 14). When this artifact was induced, the greatest electrical activity could be observed in the channels around the eyes.
The next section effectively discusses the issues related to the classification part, i.e., the expert classification system based on artificial intelligence in the form of neural networks.
5. Explanation of the Functioning of the Artificial Neural Network: Classification Part
This section deals with the description of the elements of the classification system. In addition, it discusses the methods of providing input signals to neural networks along with the analysis of output data. In addition, the structure of the artificial intelligence algorithms used and an overview of the training data are described.
When analyzing the graphic included in
Figure 15, it can be observed that the signal matrices
L and
H are fed to the expert system. These data were effectively explained within
Section 4. They contained input data for the analysis of movement commands and nervous tics. Then, they were analyzed by two neural networks. The first was a network that recognized forward, right and left commands based on the patterns of spectral waveforms. This could be seen in the system output. The situation regarding the neural network of nervous tics was similar. In this case, the multilayer deep neural network recognized three selected nervous tics (eye blinking, neck tightening and shoulder tension). The entire output signal comprised the control signal of the motion commands.
Section 5.1 and
Section 5.2 cover these issues in detail.
5.1. Neural Network for Recognizing Movement Commands
The neural network used to recognize the patterns of spectral waveforms was a diagram with 516 inputs (see
Section 4.1) consisting of 4 hidden layers, composed successively of layers of 20, 15, 15 and 20 hyperbolic tangent neurons, as well as one layer as output (
Figure 15). The last layer had four exits, but only three were move commands. The fourth output represented the person’s resting state. It was necessary to distinguish it in the signal to avoid distortions in the classification of traffic commands.
Hidden layers consisting of hyperbolic tangent activation functions (
) as represented by the following relationship [
48]:
The adopted function in the analyzed case gave better results and a wider range of possibilities due to the values being in the range <>. It was therefore different from the sigmoidal form, which only takes non-negative results.
The neural network was trained with the input data set
(input movement) (Equation (
6)) and the output
(output movement) (Equation (
7)). The training set was composed of 516 network inputs denoting the
L matrix, i.e., the matrix composed of one-second spectral waveforms of the F7, Fp1, F8 and Fp2 channels. They were marked as the matrix of patterns
with the number of lines
= 516. The set of initial training data was represented as
with the number of lines
= 4. This state of affairs was naturally dictated by the requirements of the network used. It was necessary to recognize four different states.
The discussed matrix of output patterns was presented in accordance with the relationship:
The input and output training patterns covered the same number of elements, and it was selected by trial and error. Thus, it was established that the set consisting of
n = 1230 gave satisfactory results for the classification. The learning results are presented in
Figure 16.
Observing the neural network training confusion matrix from
Figure 16, it can be seen that the training of the neural network on the patterns was very successful. Taking into account the training, validation and test matrices, it can be concluded that the percentages of the results of these treatments were equal or close to 100%.
5.2. Neural Network for Recognizing Nervous Tics
It was decided to choose a network consisting of 4 hidden layers. The first layer consisted of a hyperbolic tangent function with 20 neurons. The second layer had a log-sigmoid activation function consisting of 15 neurons. The third layer, in turn, was the radial base function . For this function, only 10 neurons were used. In the last hidden layer, the hyperbolic tangent function was again used, but this time with 5 neurons. The last part of the neural network configured in this way must consist of a single layer containing 3 neurons with a linear activation function. It is adequate to the number of outputs of the neural network. In such a configuration, it is supposed to sum up the nonlinear activation functions of the neurons.
The output signal of the designed neural network classifying the signal was consistent with the formulas in Equation (
8). It describes the neural network layers (
W), activation functions (
f) and biases (
b). The network output is
y. [
4,
48]:
The neural network was trained with
(input tics) (Equation (
9)) and with output
(output tics) (Equation (
10)). The training set was composed of 32 network inputs denoting the matrix
H, i.e., the matrix of the refiltered EEG signal. They were marked as the set of patterns
with the number of lines
= 32. The training output data set was hidden under the variable
with the number of lines
= 3.
The matrix of output patterns is illustrated according to the formula:
The input and output training patterns covered the same number of elements. Satisfactory results of the classification were given by the set consisting of r = 118,000. The next section contains the results of the classification of the discussed algorithm.
6. The Results of the Classification of Facial Expressions for the Purposes of Movement Commands and the Detection of Nervous Tics
The present section describes the effects of the designed classification system. The classification of EEG signals from neural tics was tested by an expert system composed of artificial intelligence solutions.
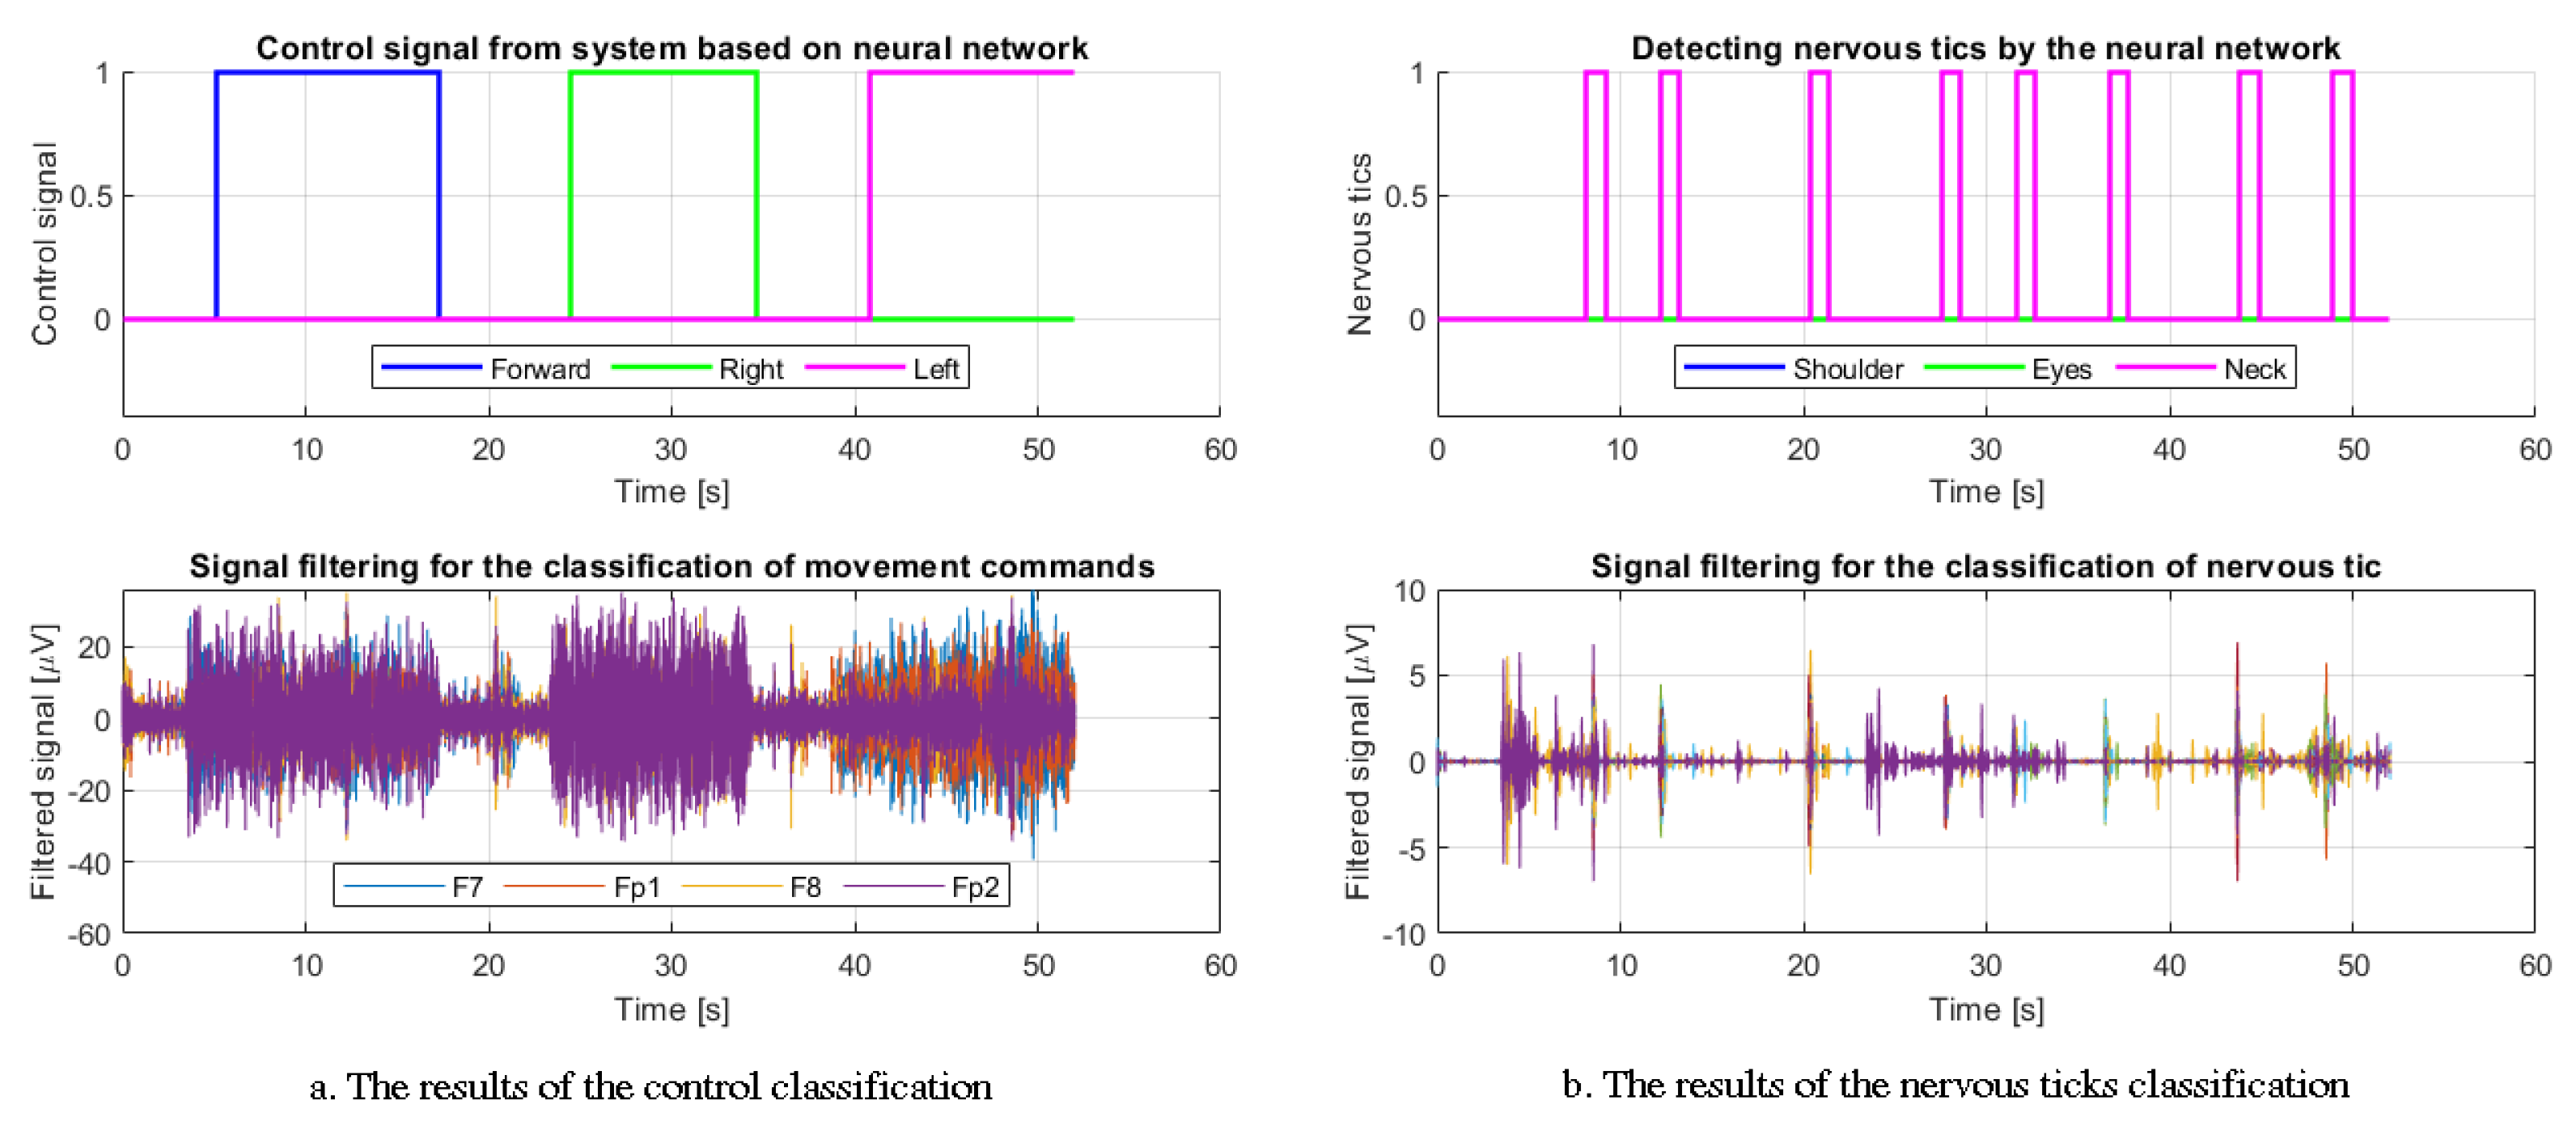
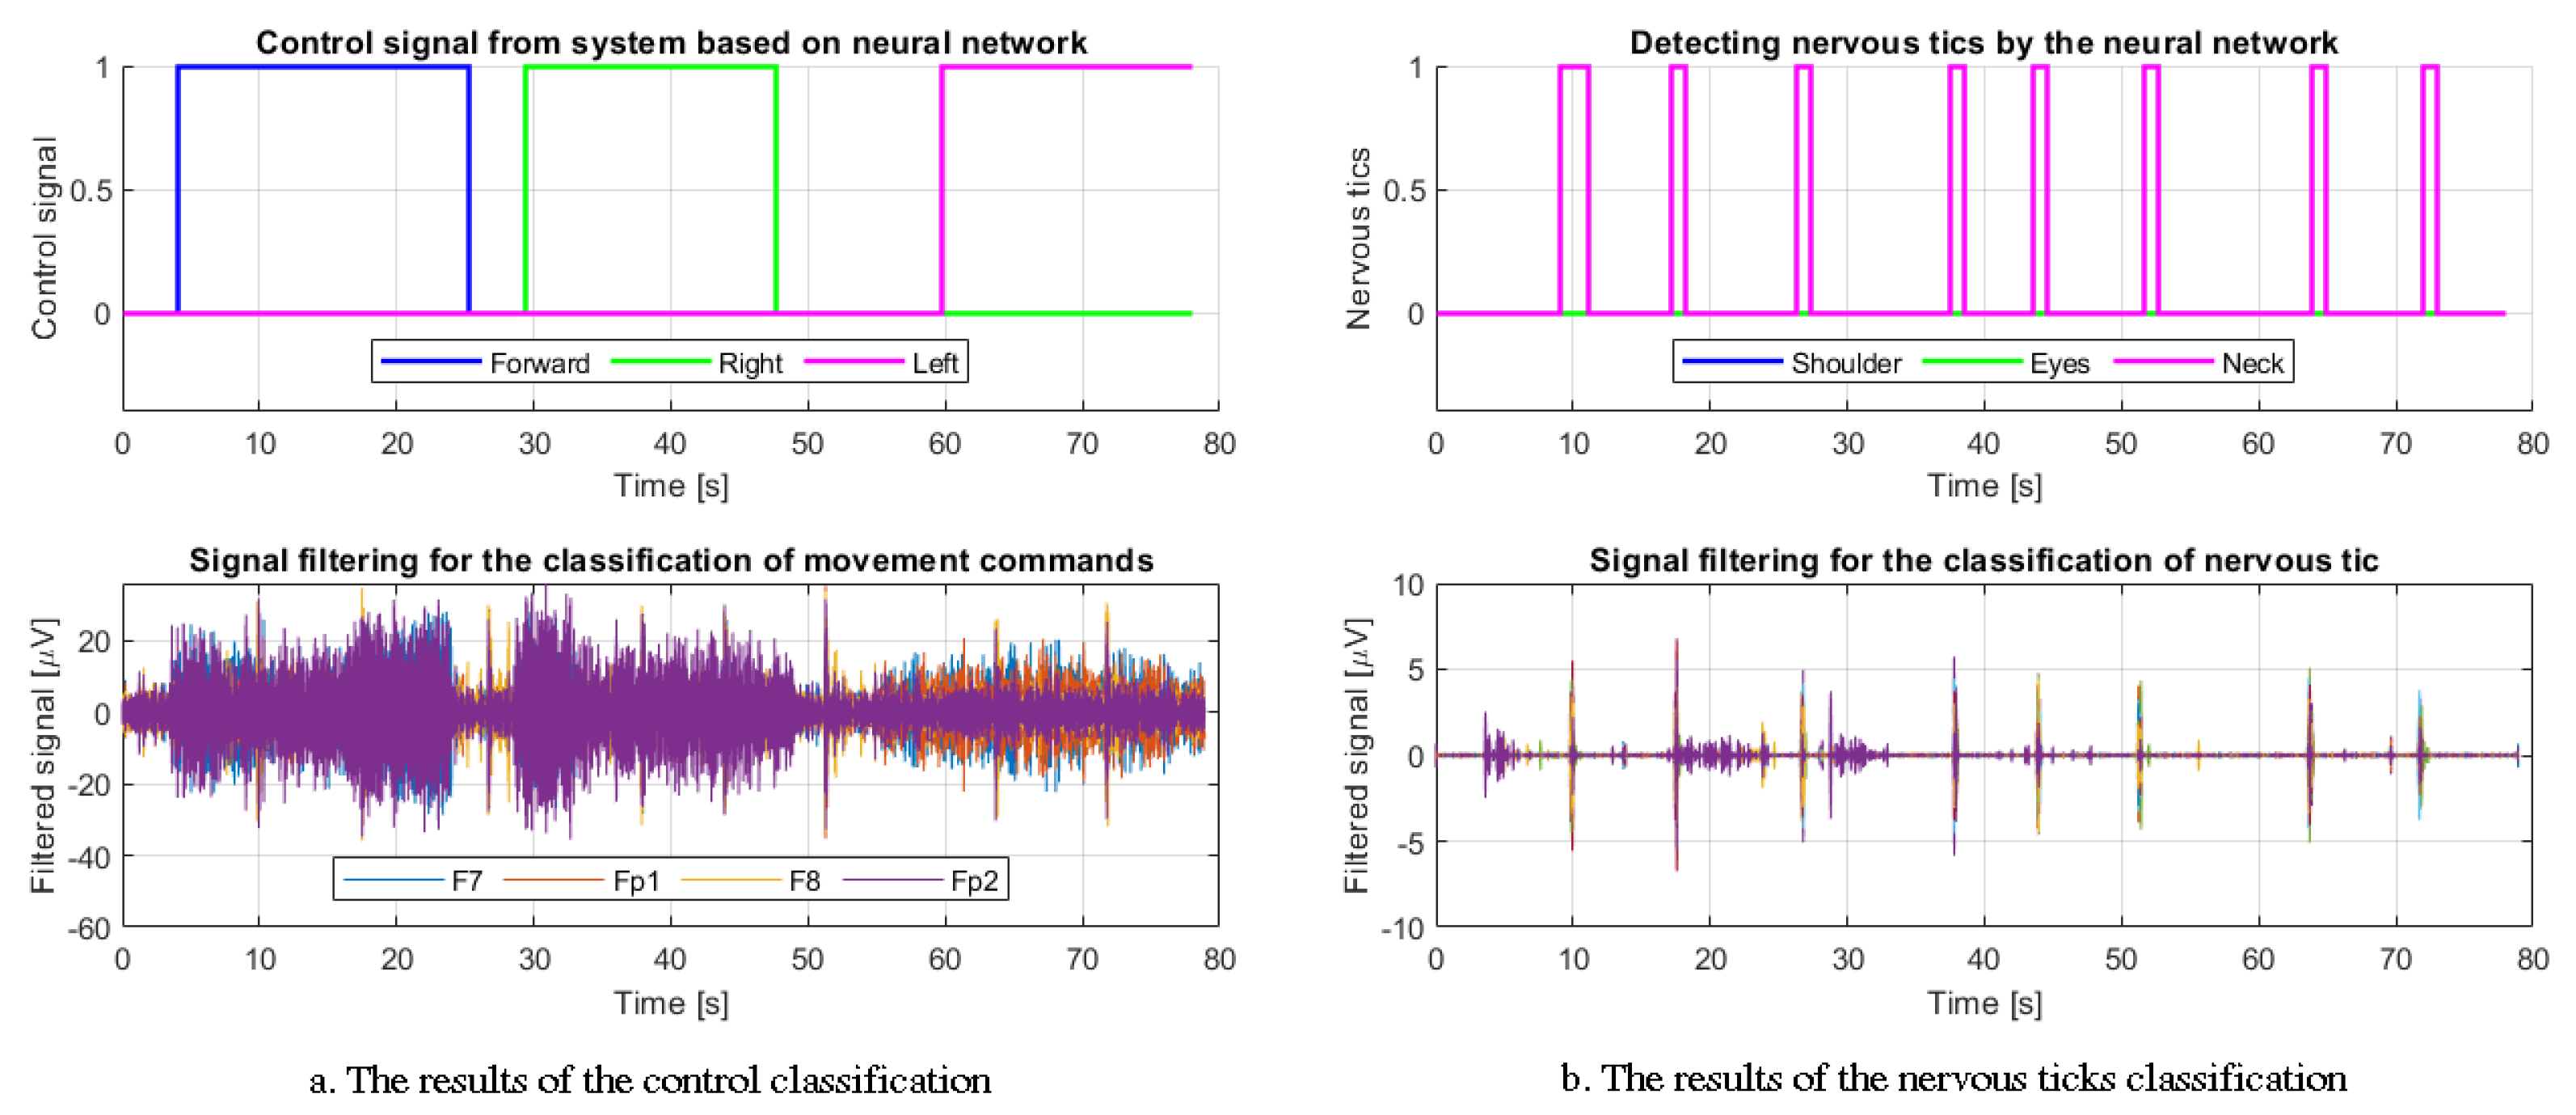
Figure 17,
Figure 18,
Figure 19,
Figure 20,
Figure 21 and
Figure 22 show exemplary classification results with the resulting control signals and detections of nervous tics. Only two exemplary results of the sequence of movement commands for each nervous tic are presented. This is naturally dictated by the need for transparency in the article. Each of the figures (part “a”) contains the movement commands (forward, right and left) and a filtered EEG signal from the four electrodes considered. The spectral estimation waveforms resulting from their one-second samples were included in
Section 4.1. Moreover, in part “b” of each figure, there are classified artifacts resulting from the simulation of a nervous tic by the examined person (shoulder, neck and blinking eyes). Additionally, the authors present a graph with the refiltered EEG signal containing the waveforms of all channels.
Figure 17 and
Figure 18 show exemplary results for the detection of facial expressions generating movement commands and artifacts in the signal caused by contraction of the arm/shoulder muscles, i.e., a simulated nervous tic. By analyzing the results, it is possible to notice the accuracy of the classification and the resulting control signal as well as the adequacy in finding nervous tics in the EEG signal time courses.
The results shown in
Figure 19 and
Figure 20 represent random results for the classification of facial expressions in favor of the generation of control commands together with the signals from the four analyzed channels. They also include the classification of nervous tics in the form of eye blinks and the EEG signals from 32 electrodes analyzed after the secondary filtering. Similarly, in this case, a very high effectiveness was noted.
The last of the exemplary results of the classification is presented in
Figure 21 and
Figure 22. Again, you can observe the signal of selected channels used in preclassification and the resulting control signal generated by an expert system based on a neural network. The second part of the figures informs that this time, the signal detected artifacts resulting from the tension in the neck muscles by the participants of the study. The signals generated after the secondary filtering seemed to confirm the results of the classification of nervous tics.
Section 7 provides a concrete, complete and detailed analysis of the results obtained from
Section 6.
7. Discussion of Obtained Results
By analyzing the results obtained in
Section 6, interesting conclusions can be drawn. First of all, from
Figure 17,
Figure 18,
Figure 19,
Figure 20,
Figure 21 and
Figure 22 it can be seen that the signals were composed of many very different samples, which included a neutral state, as well as facial expressions responsible for generating forward, rightward and left movements. The signals collected from all participants lasted about 60–70 s. Each of the signals was burdened with eight nervous tics. The authors carefully checked each type of tics and its impact on the quality of classification by the expert system.
It should be emphasized that the EEG signal from the four electrodes, which were subjected to a spectral analysis, oscillated around the amplitude of 20 V. There was significant activity for all four channels for the forward command, while the main activity for the right command was for the Fp2 and F8 electrodes. In turn, the command to move left generated a significant increase in amplitude on the F7 and Fp1 channels. The idle state between the forward and right command, and between the right and left command, had a very low amplitude on each of the analyzed channels. These results were in line with expectations. It was possible to achieve an acceptable efficiency for the algorithm, and above all, confirm its applicability to the conditions of everyday life, which was the main goal. It was also important to have a practical approach to the problem that can really affect the lives of people with disabilities. In addition, a system was designed to enable the analysis of filtered signals subjected to the spectral analysis. Most importantly, these signals were heavily distorted by artifacts, yet an expert classification system coped with the problem.
It showed a high efficiency in the classification of the EEG signal burdened with many artifacts resulting from various nervous tics. This is an important conclusion because it may indicate the usefulness of the proposed algorithm in everyday life for disabled people with nervous tics. The designed neural network was able to analyze the signal quite efficiently and effectively, disregarding the disturbances, thanks to the splitting of the signal into one-second samples subjected to the subsequent analysis.
The applied refiltering of the signal had a huge impact on the quality of the classification of nervous tics. The filtered EEG waveforms seen in
Figure 17,
Figure 18,
Figure 19,
Figure 20,
Figure 21 and
Figure 22 in section “b” were clearly characterized by high jumps in amplitude at the moment of a tic artifact. One can get the impression that it was separated from the rest of the signal. At the same time, it should be noted that the amplitude was lower than the values after the first filtering of the signals (part “a” in the figures). The disturbance classification results indicated a one-second or two-second duration of a nervous tic. This was a consequence of the very varied, complex and intricate nature of such artifacts.
Summing up the conclusions drawn, it should be noted that apart from measurable disturbances, the subjects were also affected by additional difficulties affecting the measurement of the EEG signal. These disturbances were sound stimuli coming from a loudspeaker, TV or radio, as well as a Wi-Fi network and radio waves. The whole setup, according to the authors, fully reflected the conditions of everyday life.
When analyzing the obtained results and the literature proposed in
Section 2, it should be emphasized that it constitutes a valuable contribution to the development of several fields. First of all, it contributes to the development of BCI systems, but also to the use of artificial intelligence in classification tasks. The spectral analysis is also an additional research problem. Therefore, it can be said that this article combines the subjects of the proposed literature.
The next section contains the final work summary and future plans for the project.
8. Conclusions and Future Work
The proposed expert classification system offers many development opportunities. There is also the possibility of further research in terms of its use by disabled people in various types of BCI systems projects. First of all, it would be worth checking how the proposed algorithm performs in the case of people who actually suffer from the nervous tics in question. It would also be worth checking what the intensity limit of this type of tic is for which the algorithm is no longer accurate. Thus, possible weaknesses of the designed system could be found and improved as expected. It would then be known whether the algorithm classifies equally effectively with an increase in the intensity and frequency of the tics, or whether its accuracy decreases.
Future research should also consider other types of preclassification steps and the use of other signal modification methods prior to classification. Certainly, further improvements and changes to the system will bring new research results. However, the technical limitations of a given approach should not be forgotten. An example is external disturbance. Most of them are not measurable and should be subject to subjective evaluation. Each of the participants in the study had a different response to sound stimuli and other disturbances. Combining this fact with a significant distortion of measurements by artifacts, it should be noted that some cases may exceed classification capabilities. This is related to the need to train the network and collect new training data, which can be burdensome.
Summarizing the results obtained in the experiment, it can be concluded that the expectations set for the system were met. The advantage is the possibility of further research leading to the expansion of the system. Undoubtedly, the greatest hopes are related to the improvement of the project in terms of deep learning. It would be good to test the system on people with disabilities, and above all on people with nervous tic syndromes, the analysis of which was presented in the article. This would certainly make it possible to better adapt it to their needs. The authors trust that then, it could improve their functioning activities in the future.
A advantage of the project is its adaptation to real conditions, and it is mainly based on the use of facial expressions as a control element. Mental commands due to so many disturbances would be very difficult to analyze, not only due to the limitations of algorithms, but above all due to the inability for the respondents to sufficiently concentrate. However, it can be concluded that such a system also has disadvantages and limitations. It cannot be used in projects where completely paralyzed people are considered. This is not possible because the analysis of the EEG signals in this case is based on potentials evoked by muscle stimulation, which may not be present in paralyzed people.
The authors also added the program code that has a file with the instruction manual. However, the detailed description of the script in this work was omitted for the sake of readability and the size of the article.
Author Contributions
Conceptualization, D.P. and S.P.; methodology, D.P.; software, D.P.; validation, S.P. and D.P.; formal analysis, S.P.; investigation, D.P.; resources, D.P. and S.P.; data curation, D.P.; writing—original draft preparation, D.P.; writing—review and editing, S.P.; visualization, D.P.; supervision, D.P. and S.P.; project administration, S.P. and D.P.; funding acquisition, S.P. All authors have read and agreed to the published version of the manuscript.
Funding
This research was funded by the National Science Center, grant number: 2021/05/X/ST7/34, MINIATURA 5.
Informed Consent Statement
In the case of this study, it should be noted that it did not require the approval of the Bioethics Committee because it was not a medical experiment. However, there is one point that needs to be clearly highlighted: informed consent was obtained from all subjects involved in the study.
Conflicts of Interest
The authors declare no conflict of interest.
Abbreviations
The following abbreviations are used in this manuscript:
| |
| Signal sampling frequency |
| Sampling frequency of high-pass filtering |
| Bandwidth of high-pass filtering |
| S | Number of one-second spectral verification samples |
| V | Number of all samples included in the measurement |
| K | Result of the operation of obtaining the power spectrum of a one-second signal of 4 electrodes |
| Power spectrum data vector |
| L | Set of transpositions of the K matrix |
| H | Variable, in which the signals from 32 channels measured during the test are collected |
| Neural network input data set (facial expressions) |
| Neural network output data set (facial expressions) |
| Neural network input data set (nervous tics) |
| Neural network output data set (nervous tics) |
| W | Neural network layers |
References
- Craik, A.; He, Y.; Contreras-Vidal, J.L. Deep learning for electroencephalogram (EEG) classification tasks: A review. J. Neural Eng. 2019, 16, 031001. [Google Scholar] [CrossRef] [PubMed]
- Bricker, A.M. The neural and cognitive mechanisms of knowledge attribution: An EEG study. Cognition 2020, 203, 104412. [Google Scholar] [CrossRef] [PubMed]
- Gordleeva, S.Y.; Lobov, S.A.; Grigorev, N.A.; Savosenkov, A.O.; Shamshin, M.O.; Lukoyanov, M.V.; Khoruzhko, M.A.; Kazantsev, V.B. Real-time EEG–EMG human–machine interface-based control system for a lower-limb exoskeleton. IEEE Access 2020, 8, 84070–84081. [Google Scholar] [CrossRef]
- Pawuś, D.; Paszkiel, S. The Application of Integration of EEG Signals for Authorial Classification Algorithms in Implementation for a Mobile Robot Control Using Movement Imagery—Pilot Study. Appl. Sci. 2022, 12, 2161. [Google Scholar] [CrossRef]
- Pawuś, D.; Paszkiel, S. Application of EEG Signals Integration to Proprietary Classification Algorithms in the Implementation of Mobile Robot Control with the Use of Motor Imagery Supported by EMG Measurements. Appl. Sci. 2022, 12, 5762. [Google Scholar] [CrossRef]
- Li, F.; He, F.; Wang, F.; Zhang, D.; Xia, Y.; Li, X. A novel simplified convolutional neural network classification algorithm of motor imagery EEG signals based on deep learning. Appl. Sci. 2020, 10, 1605. [Google Scholar] [CrossRef]
- Paszkiel, S. Application of Brain-Computer Interface Technology in Neurogaming. In Applications of Brain-Computer Interfaces in Intelligent Technologies; Springer: Berlin/Heidelberg, Germany, 2022; pp. 37–50. [Google Scholar]
- Paszkiel, S. Analysis and Classification of EEG Signals for Brain-Computer Interfaces; Springer: Berlin/Heidelberg, Germany, 2020. [Google Scholar]
- Paszkiel, S. Applications of Brain-Computer Interfaces in Intelligent Technologies; Springer: Berlin/Heidelberg, Germany, 2022. [Google Scholar]
- Browarska, N.; Kawala-Sterniuk, A.; Zygarlicki, J.; Podpora, M.; Pelc, M.; Martinek, R.; Gorzelańczyk, E.J. Comparison of Smoothing Filters’ Influence on Quality of Data Recorded with the Emotiv EPOC Flex Brain–Computer Interface Headset during Audio Stimulation. Brain Sci. 2021, 11, 98. [Google Scholar] [CrossRef]
- Sawangjai, P.; Hompoonsup, S.; Leelaarporn, P.; Kongwudhikunakorn, S.; Wilaiprasitporn, T. Consumer grade EEG measuring sensors as research tools: A review. IEEE Sens. J. 2019, 20, 3996–4024. [Google Scholar] [CrossRef]
- Kaur, B.; Singh, D.; Roy, P.P. EEG based emotion classification mechanism in BCI. Procedia Comput. Sci. 2018, 132, 752–758. [Google Scholar] [CrossRef]
- Cimtay, Y.; Ekmekcioglu, E. Investigating the use of pretrained convolutional neural network on cross-subject and cross-dataset EEG emotion recognition. Sensors 2020, 20, 2034. [Google Scholar] [CrossRef]
- Sasaki, M.; Iversen, J.; Callan, D.E. Music improvisation is characterized by increase EEG spectral power in prefrontal and perceptual motor cortical sources and can be reliably classified from non-improvisatory performance. Front. Hum. Neurosci. 2019, 13, 435. [Google Scholar] [CrossRef] [PubMed]
- Paszkiel, S.; Rojek, R.; Lei, N.; Castro, M.A. A Pilot Study of Game Design in the Unity Environment as an Example of the Use of Neurogaming on the Basis of Brain–Computer Interface Technology to Improve Concentration. NeuroSci 2021, 2, 109–119. [Google Scholar] [CrossRef]
- Paszkiel, S.; Szpulak, P. Methods of acquisition, archiving and biomedical data analysis of brain functioning. In Proceedings of the International Scientific Conference BCI 2018 Opole, Opole, Poland, 13–14 March 2018; Springer: Berlin/Heidelberg, Germany, 2018; pp. 158–171. [Google Scholar]
- Zero, E.; Bersani, C.; Sacile, R. EEG Based BCI System for Driver’s Arm Movements Identification. In Automation, Robotics & Communications for Industry 4.0; International Frequency Sensor Association (IFSA) Publishing: Waterloo, ON, Canada, 2021; p. 77. [Google Scholar]
- Paszkiel, S. Application of Brain-Computer Interface Technology on Robot Lines in Industry in the Field of Increasing Safety. In Applications of Brain-Computer Interfaces in Intelligent Technologies; Springer: Berlin/Heidelberg, Germany, 2022; pp. 81–90. [Google Scholar]
- Paszkiel, S. Application of Neuroinformatics in the Intelligent Automotive Industry. In Applications of Brain-Computer Interfaces in Intelligent Technologies; Springer: Berlin/Heidelberg, Germany, 2022; pp. 69–79. [Google Scholar]
- Hosseini, S.M.; Bavafa, M.; Shalchyan, V. An auto-adaptive approach towards subject-independent motor imagery bci. In Proceedings of the 2019 26th National and 4th International Iranian Conference on Biomedical Engineering (ICBME), Tehran, Iran, 27–28 November 2019; pp. 167–171. [Google Scholar]
- Douibi, K.; Le Bars, S.; Lemontey, A.; Nag, L.; Balp, R.; Breda, G. Toward EEG-based BCI applications for industry 4.0: Challenges and possible applications. Front. Hum. Neurosci. 2021, 456. [Google Scholar] [CrossRef]
- Lee, D.H.; Jeong, J.H.; Ahn, H.J.; Lee, S.W. Design of an EEG-based drone swarm control system using endogenous BCI paradigms. In Proceedings of the 2021 9th International Winter Conference on Brain-Computer Interface (BCI), Gangwon, Korea, 22–24 February 2021; pp. 1–5. [Google Scholar]
- Lins, A.A.; de Oliveira, J.M.; Rodrigues, J.J.; de Albuquerque, V.H.C. Robot-assisted therapy for rehabilitation of children with cerebral palsy—A complementary and alternative approach. Comput. Hum. Behav. 2019, 100, 152–167. [Google Scholar] [CrossRef]
- Qi, W.; Ovur, S.E.; Li, Z.; Marzullo, A.; Song, R. Multi-Sensor Guided Hand Gesture Recognition for a Teleoperated Robot Using a Recurrent Neural Network. IEEE Robot. Autom. Lett. 2021, 6, 6039–6045. [Google Scholar] [CrossRef]
- Bi, L.; Guan, C. A review on EMG-based motor intention prediction of continuous human upper limb motion for human-robot collaboration. Biomed. Signal Process. Control 2019, 51, 113–127. [Google Scholar] [CrossRef]
- Lotte, F.; Congedo, M.; Lécuyer, A.; Lamarche, F.; Arnaldi, B. A review of classification algorithms for EEG-based brain–computer interfaces. J. Neural Eng. 2007, 4, R1. [Google Scholar] [CrossRef]
- Lotte, F.; Bougrain, L.; Cichocki, A.; Clerc, M.; Congedo, M.; Rakotomamonjy, A.; Yger, F. A review of classification algorithms for EEG-based brain–computer interfaces: A 10 year update. J. Neural Eng. 2018, 15, 031005. [Google Scholar] [CrossRef]
- Lang, M. Investigating the Emotiv EPOC for Cognitive Control in Limited Training Time; University of Canterbury: Christchurch, New Zealand, 2012. [Google Scholar]
- Paszkiel, S.; Dobrakowski, P. Brain–computer technology-based training system in the field of motor imagery. IET Sci. Meas. Technol. 2021, 14, 1014–1018. [Google Scholar] [CrossRef]
- Antoniou, E.; Bozios, P.; Christou, V.; Tzimourta, K.D.; Kalafatakis, K.; G Tsipouras, M.; Giannakeas, N.; Tzallas, A.T. EEG-Based Eye Movement Recognition Using the Brain–Computer Interface and Random Forests. Sensors 2021, 21, 2339. [Google Scholar] [CrossRef]
- Jafar, F.; Fatima, S.F.; Mushtaq, H.R.; Khan, S.; Rasheed, A.; Sadaf, M. Eye controlled wheelchair using transfer learning. In Proceedings of the 2019 International Symposium on Recent Advances in Electrical Engineering (RAEE), Islamabad, Pakistan, 28–29 August 2019; Volume 4, pp. 1–5. [Google Scholar]
- Yu, X.; Qi, W. A user study of wearable EEG headset products for emotion analysis. In Proceedings of the 2018 International Conference on Algorithms, Computing and Artificial Intelligence, Sanya, China, 21–23 December 2018; pp. 1–7. [Google Scholar]
- Zhang, X.; Pan, J.; Shen, J.; Din, Z.U.; Li, J.; Lu, D.; Wu, M.; Hu, B. Fusing of Electroencephalogram and Eye Movement with Group Sparse Canonical Correlation Analysis for Anxiety Detection. IEEE Trans. Affect. Comput. 2020, 13, 958–971. [Google Scholar] [CrossRef]
- Kamińska, D.; Smółka, K.; Zwoliński, G. Detection of Mental Stress through EEG Signal in Virtual Reality Environment. Electronics 2021, 10, 2840. [Google Scholar] [CrossRef]
- Ghosh, R.; Deb, N.; Sengupta, K.; Phukan, A.; Choudhury, N.; Kashyap, S.; Phadikar, S.; Saha, R.; Das, P.; Sinha, N.; et al. SAM 40: Dataset of 40 subject EEG recordings to monitor the induced-stress while performing Stroop color-word test, arithmetic task, and mirror image recognition task. Data Brief 2022, 40, 107772. [Google Scholar] [CrossRef] [PubMed]
- Paszkiel, S. Using the LORETA Method for Localization of the EEG Signal Sources in BCI Technology. In Analysis and Classification of EEG Signals for Brain–Computer Interfaces; Springer: Berlin/Heidelberg, Germany, 2020; pp. 27–32. [Google Scholar]
- Santos, E.M.; San-Martin, R.; Fraga, F.J. Comparison of LORETA and CSP for Brain-Computer Interface Applications. In Proceedings of the 2021 18th International Multi-Conference on Systems, Signals & Devices (SSD), Monastir, Tunisia, 22–25 March 2021; pp. 817–822. [Google Scholar]
- Manoilov, P. EEG eye-blinking artefacts power spectrum analysis. In Proceedings of the International Conference on Computer and systems Technology, Las Vegas, NV, USA, 26–29 June 2006; pp. 3–5. [Google Scholar]
- Zhao, W.; Van Someren, E.J.; Li, C.; Chen, X.; Gui, W.; Tian, Y.; Liu, Y.; Lei, X. EEG spectral analysis in insomnia disorder: A systematic review and meta-analysis. Sleep Med. Rev. 2021, 59, 101457. [Google Scholar] [CrossRef]
- Yong, X.; Fatourechi, M.; Ward, R.K.; Birch, G.E. Automatic artefact removal in a self-paced hybrid brain-computer interface system. J. Neuroeng. Rehabil. 2012, 9, 1–20. [Google Scholar] [CrossRef]
- Frølich, L.; Winkler, I.; Müller, K.R.; Samek, W. Investigating effects of different artefact types on motor imagery BCI. In Proceedings of the 2015 37th Annual International Conference of the IEEE Engineering in Medicine and Biology Society (EMBC), Milan, Italy, 25–29 August 2015; pp. 1942–1945. [Google Scholar]
- Çınar, S.; Acır, N. A novel system for automatic removal of ocular artefacts in EEG by using outlier detection methods and independent component analysis. Expert Syst. Appl. 2017, 68, 36–44. [Google Scholar] [CrossRef]
- Benda, M.; Volosyak, I. Peak detection with online electroencephalography (EEG) artifact removal for brain–computer interface (BCI) purposes. Brain Sci. 2019, 9, 347. [Google Scholar] [CrossRef]
- Li, J.; Struzik, Z.; Zhang, L.; Cichocki, A. Feature learning from incomplete EEG with denoising autoencoder. Neurocomputing 2015, 165, 23–31. [Google Scholar] [CrossRef]
- Brinker, T.J.; Hekler, A.; Utikal, J.S.; Grabe, N.; Schadendorf, D.; Klode, J.; Berking, C.; Steeb, T.; Enk, A.H.; Von Kalle, C. Skin cancer classification using convolutional neural networks: Systematic review. J. Med. Internet Res. 2018, 20, e11936. [Google Scholar] [CrossRef]
- Yan, R.; Ren, F.; Wang, Z.; Wang, L.; Zhang, T.; Liu, Y.; Rao, X.; Zheng, C.; Zhang, F. Breast cancer histopathological image classification using a hybrid deep neural network. Methods 2020, 173, 52–60. [Google Scholar] [CrossRef]
- Yadav, S.S.; Jadhav, S.M. Deep convolutional neural network based medical image classification for disease diagnosis. J. Big Data 2019, 6, 1–18. [Google Scholar] [CrossRef]
- Majewski, P.; Pawuś, D.; Szurpicki, K.; Hunek, W.P. Toward Optimal Control of a Multivariable Magnetic Levitation System. Appl. Sci. 2022, 12, 674. [Google Scholar] [CrossRef]
- Gao, H.; He, W.; Zhou, C.; Sun, C. Neural network control of a two-link flexible robotic manipulator using assumed mode method. IEEE Trans. Ind. Inform. 2018, 15, 755–765. [Google Scholar] [CrossRef]
- Sokół, S.; Pawuś, D.; Majewski, P.; Krok, M. The Study of the Effectiveness of Advanced Algorithms for Learning Neural Networks Based on FPGA in the Musical Notation Classification Task. Appl. Sci. 2022, 12, 9829. [Google Scholar] [CrossRef]
- Arias-Vergara, T.; Klumpp, P.; Vasquez-Correa, J.C.; Nöth, E.; Orozco-Arroyave, J.R.; Schuster, M. Multi-channel spectrograms for speech processing applications using deep learning methods. Pattern Anal. Appl. 2021, 24, 423–431. [Google Scholar] [CrossRef]
- Lopac, N.; Hržić, F.; Vuksanović, I.P.; Lerga, J. Detection of Non-Stationary GW Signals in High Noise From Cohen’s Class of Time–Frequency Representations Using Deep Learning. IEEE Access 2021, 10, 2408–2428. [Google Scholar] [CrossRef]
- Khare, S.K.; Bajaj, V. Time–frequency representation and convolutional neural network-based emotion recognition. IEEE Trans. Neural Netw. Learn. Syst. 2020, 32, 2901–2909. [Google Scholar] [CrossRef]
Figure 1.
Presentation of electrodes configuration and one of the participants during the measurement.
Figure 1.
Presentation of electrodes configuration and one of the participants during the measurement.
Figure 2.
Presentation of disturbances occurring during measurements.
Figure 2.
Presentation of disturbances occurring during measurements.
Figure 3.
Signal analysis dashboard in EmotivPRO software.
Figure 3.
Signal analysis dashboard in EmotivPRO software.
Figure 4.
Data acquisition, analysis and classification system.
Figure 4.
Data acquisition, analysis and classification system.
Figure 5.
The observation of raw and filtered EEG signals.
Figure 5.
The observation of raw and filtered EEG signals.
Figure 6.
An example of the power spectrum estimation result for participants 1 and 2—calm.
Figure 6.
An example of the power spectrum estimation result for participants 1 and 2—calm.
Figure 7.
An example of the power spectrum estimation result for participants 3 and 4—forward.
Figure 7.
An example of the power spectrum estimation result for participants 3 and 4—forward.
Figure 8.
An example of the power spectrum estimation result for participants 5 and 6—right.
Figure 8.
An example of the power spectrum estimation result for participants 5 and 6—right.
Figure 9.
An example of the power spectrum estimation result for participants 7 and 8—left.
Figure 9.
An example of the power spectrum estimation result for participants 7 and 8—left.
Figure 10.
The observation of first-filtered and second-filtered EEG signals.
Figure 10.
The observation of first-filtered and second-filtered EEG signals.
Figure 11.
An example of a nervous tic involving the lifting of the right shoulder (shoulder muscle tightening).
Figure 11.
An example of a nervous tic involving the lifting of the right shoulder (shoulder muscle tightening).
Figure 12.
An example of a nervous tic involving the lifting of the left shoulder (shoulder muscle tightening).
Figure 12.
An example of a nervous tic involving the lifting of the left shoulder (shoulder muscle tightening).
Figure 13.
An example of a nervous tic involving the neck muscle tightening.
Figure 13.
An example of a nervous tic involving the neck muscle tightening.
Figure 14.
An example of a nervous blink tic.
Figure 14.
An example of a nervous blink tic.
Figure 15.
Expert system based on two neural networks.
Figure 15.
Expert system based on two neural networks.
Figure 16.
Neural network training confusion matrix.
Figure 16.
Neural network training confusion matrix.
Figure 17.
An example of the classification of movement commands and nervous tics—shoulder muscles tightening.
Figure 17.
An example of the classification of movement commands and nervous tics—shoulder muscles tightening.
Figure 18.
An example of the classification of movement commands and nervous tics—shoulder muscles tightening.
Figure 18.
An example of the classification of movement commands and nervous tics—shoulder muscles tightening.
Figure 19.
An example of the classification of movement commands and nervous tics—eye blinking.
Figure 19.
An example of the classification of movement commands and nervous tics—eye blinking.
Figure 20.
An example of the classification of movement commands and nervous tics—eye blinking.
Figure 20.
An example of the classification of movement commands and nervous tics—eye blinking.
Figure 21.
An example of the classification of movement commands and nervous tics—neck muscles tightening.
Figure 21.
An example of the classification of movement commands and nervous tics—neck muscles tightening.
Figure 22.
An example of the classification of movement commands and nervous tics—neck muscles tightening.
Figure 22.
An example of the classification of movement commands and nervous tics—neck muscles tightening.
Table 1.
Related works.
| |
|---|
| [36,37] | LORETA, nervous tics, EEG, biomedical signals, eliminate biological artifacts |
| [38,39] | Electro-oculographic artifacts, nervous tics, EEG, biomedical signals, power spectrum analysis, BCI, insomnia disorder |
| [40] | Artifact removal algorithm, nervous tics, EEG, biomedical signals, BCI hybrid system |
| [41] | Motor imaging, BCI system, IC MARC classifier, EEG, muscle artifacts |
| [42] | Automatic removal of artifacts, OD-ICA, EEG, ocular artifact |
| [43] | BCI system, peak detection, EEG, peak frequency detection |
| [44] | Denoising autoencoder, Lomb–Scargle periodogram, EEG |
| [45,46,47] | Convolutional neural network, skin cancer classification system, deep neural network, classification of breast cancer histopathological images |
| [48,49,50] | Artificial intelligence in the regulation of automation systems, classification system |
| [51,52,53] | Artificial intelligence, EEG, spectrogram, convolutional neural networks, classification system |
Table 2.
Names of electrodes.
Table 2.
Names of electrodes.
| LH-Fp1 | LD-FC5 | RA-C4 | LJ-Pz |
| RH-Fp2 | LC-FC1 | RB-T8 | RN-P4 |
| LG-F7 | RC-FC2 | LQ-CP5 | RO-P8 |
| LF-F3 | RD-FC6 | LP-CP1 | LM-PO9 |
| RK-Fz | RE-FT10 | RP-CP2 | LL-O1 |
| RF-F4 | LB-T7 | RQ-CP6 | RJ-Oz |
| RG-F8 | LA-C3 | LO-P7 | RL-O2 |
| LE-FT9 | LK-Cz | LN-P3 | RM-PO10 |
| Publisher’s Note: MDPI stays neutral with regard to jurisdictional claims in published maps and institutional affiliations. |
© 2022 by the authors. Licensee MDPI, Basel, Switzerland. This article is an open access article distributed under the terms and conditions of the Creative Commons Attribution (CC BY) license (https://creativecommons.org/licenses/by/4.0/).
