Abstract
To explore the existing characteristics of nitrogen and phosphorus in the main rivers of Changchun City, the overlying water and sediment were sampled and tested. The results showed that the spatial distribution of nitrogen and phosphorus contents in overlying water and sediment was diverse. In overlying water, nitrogen and phosphorus contents in the north and west of Changchun were high, while their contents in the south were low. In the sediment, their contents were high in the south and west and low in the north. The pollution of nitrogen and phosphorus was serious in most rivers. Xinkai River, Chuan Lake, and West Lake had the acutest pollution of ammonia, total nitrogen, and total phosphorus, and their contamination degree in Yongchun River was the lowest. In terms of time, with the government actively carrying out river management, the pollution control of ammonia and phosphorus has achieved remarkable results. The pollution of nitrogen and phosphorus was closely related to the quality of the water environment, and the phosphorus content in overlying water and sediment had the strongest correlation with other water quality parameters. Moreover, the change in chemical oxygen demand could be predicted by the partial least squares method on the basis of its high correlation with nitrogen and phosphorus in overlying water. This study provides a scientific reference for the investigation and treatment of nitrogen and phosphorus pollution in surface water of typical old industrial cities in China.
1. Introduction
Nowadays, our cities are suffering from a common disease—urban stream syndrome [1]. This is because urbanization has changed the hydrology, geomorphology, and ecology of surface water, reduced the functional capacity of urban watersheds [2], and then led to the general degradation of the urban aquatic ecosystem [3]. The rapid urbanization trend on Earth’s surface can affect energy consumption and natural resource utilization, and even global economic development and human well-being [4,5]. At the same time, the fast advancement of cities also increases their demand for freshwater resources. As the real God of the city, urban surface water is crucial to the future development of the city [6], and the detection, control, and treatment of its pollution are directly related to the health of the urban ecosystem.
There are many pollutants in urban surface water, including heavy metals and nutrient elements. Heavy metals are nondegradable and will directly harm aquatic organisms and human health by integrating into the food chain [7], and researchers have never let up on the study of heavy metals in surface water due to their immediate toxic effects. However, the pollution of nitrogen (N) and phosphorus (P) nutrients caused by human activities such as the global “green revolution” was neglected for a period of time, until the outbreak of cyanobacteria blooms in many places, so it is urgent to solve the problem of nutrient pollution [8].
N and P are the main nutrient elements in water; the migration and transformation of their various forms in the atmosphere, biosphere, lithosphere, and hydrosphere constitute the biogeochemical cycle of N and P. In addition, these cycle processes are being influenced by human activities at an alarming rate [9]. According to recent research, excessive N and P input from both point and non-point sources can damage surface water quality [10]. Total nitrogen (TN) and total phosphorus (TP) were the main factors influencing the ammonia-oxidizing bacterial communities in water and sediments [11]. Superabundant TN and TP lead to the formation of water eutrophication, which will make aquatic organisms (especially algae) multiply, change the species and quantity of organisms, and destroy the balance of aquatic ecosystems. Thus, the identification of N and P contents and their pollution situation in surface water is the basis for the establishment of control measures for water bodies which have been polluted by nutrients. Meanwhile, ammonia nitrogen (NH3-N) is an important part of TN in water; superabundant NH3-N will inhibit nitrification, poison aquatic organisms, and threaten human health. Therefore, the NH3-N content is also analyzed separately as the research focus.
Changchun, the spring city of Northern China, is located in the monsoon area with the largest environmental change. Its climate has the complexity of space–time variation. The per-capita freshwater resource of Changchun is 356 m3, only 16% of the national average level (2220 m3). The shortage of water resources has seriously restricted the progress of this city. On the other hand, Changchun is also an important industrial base in Northeast China. The largest production sites of China First Automobile Factory Group Corporation and Changchun Passenger Car Factory are located in this city. With the growth of the automobile industry economy, the population of Changchun are gradually migrating from rural to urban areas, which aggravates the shortage of fresh water resources [12]. This is also one of the reasons why the surface water resources are extremely important to the life of Changchun people. Due to the acceleration of urbanization in this old industrial city, the quality of surface water was once seriously damaged. Fortunately, the government has recognized the harm of excessive consumption of surface water while rapidly promoting social progress, so it has started to treat surface water since the early 21st century. However, in recent years, the surface water resources in Changchun still have serious N and P pollution problems according to the surface water environmental quality report issued by the Ecological Environment Bureau, in which only some statistical parameters rather than detailed measurements of pollutants are published. Research projects on N and P in the water system of Changchun Urban are few at present, but its systematic and thorough study is of certain value and reference significance.
The primary aim of this study is, therefore, to explore the contribution of biogenic elements (N and P) in the evolution of urban eco-geochemistry, analyze their environmental effect, migration and transformation process, deepen the research connotation about urban water environmental geochemical behavior of individual elements, and investigate the change law of element pollution in space scales with urban governance. Sampling and analysis were carried out on the main rivers flowing through Changchun Urban, the distribution pattern and pollution level of N and P were clarified, and the relationship between N, P, and water quality parameters was revealed and quantified. It is not only a basic study to understand the current situation and changes in the urban water environment and to provide accurate analysis and scientific support for its treatment and ecological protection, but also a forward-looking study to predict the regional water environmental effects caused by the long-term development and transformation of industrial cities in developing countries.
2. Materials and Methods
2.1. Study Area
The study area, in Changchun City, Jilin Province, covers the six rivers of Jingshui River, Chuan Lake, West Lake, Xinkai River, Yitong River, and Yongchun River. Its bounding geographic coordinates are 125°0′–126°0′ E, 43°05′–45°15′ N. The climate type is temperate continental semi-humid monsoon climate, with an average annual rainfall of 746.7 mm. The surface water resources account for 44.6% of total water resources in this city.
The study area is located in the transition zone from the eastern low mountains and hills to the western platform plain of the northeast plain, with a large plain area, slightly undulating platform, and flat terrain. All rivers in this area belong to the Songhua River Basin, which has three river systems, including the Second Songhua River, Yinma River, and Lalin River. Yitong River pertains in the Yinma River system. Xinkai River, Yongchun River, Chuan Lake, and Jingshui River are all tributaries of Yitong River. Xinkai River is the largest tributary of Yitong River, and West Lake is a reservoir built artificially to impound Xinkai River. Figure 1 is a map of the sampling area. Due to the influence of high terrain in the east and low terrain in the west, rivers in this area are arranged from east to west, flow to the northeast, and finally pour into the Second Songhua River, which is also the unique water system pattern of south-source and north-flow in Changchun.
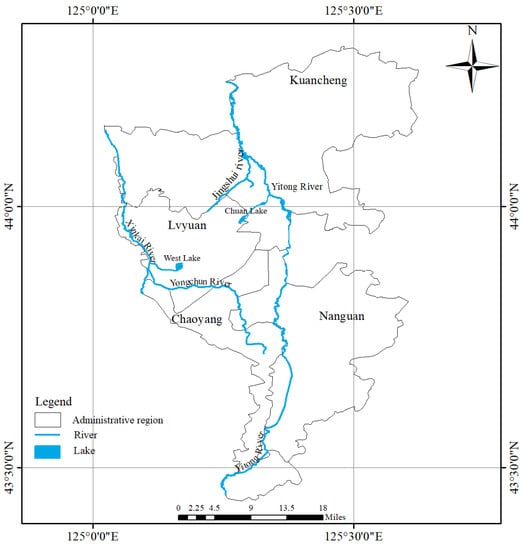
Figure 1.
Map of river distribution in Changchun City.
2.2. Sample Preparation
Under the condition that there was no rainfall for three consecutive days and the water quality was stable, the water and sediment samples were collected in accordance with the Technical Guidance of Water Quality Sampling of the People’s Republic of China (HJ 494-2009). Based on the administrative plan, samples of Jingshui River and Yitong River were collected in Kuancheng District. West Lake, Chuan Lake, and Xinkai River’s samples were collected in Lvyuan District. As for the Yongchun River, the samples were collected in Nanguan District.
A total of 164 samples, including the overlying water (82) and corresponding sediment (82), were collected in the study area. The pH, oxidation reduction potential (Eh), and temperature (T) values were measured on site during water sample collection. The water samples were acidified with sulfuric acid (H2SO4) to pH < 2, then stored in a brown glass bottle at 2~5 °C for use. The sediment samples were air-dried and then stones, plant residues, and other foreign matter were removed. The quartering method was used to obtain the required sample amount. Then, the samples were ground with an agate mortar, screened through a 200-mesh sieve, and sealed in a sample bottle for use.
2.3. Main Reagent and Equipment
H2SO4, hydrochloric acid (HCl), and nitric acid (HNO3) were of guaranteed reagent grade. The other reagents were of analytical grade. The water needed for the experiment was ultrapure deionized water with a resistivity of 18.2 MΩ·cm at 25 °C.
The national standard aqueous solutions of NH3-N (GSB04-2832-2011), TN (GSB04-2837-2011), and TP (GSB04-1741-2004) were 1000 µg/mL; the solvent was ultrapure deionized water. The certified reference material (CRM) GBW07309 was acquired from the Institute of Geophysical and Geochemical Exploration, Chinese Academy of Geological Sciences (Langfang, China).
The sediment samples were weighed using an electronic balance (ATY124, Shimadzu, Kyoto, Japan). The pH values were measured using a pH meter (PHBJ-260, Leici, Shanghai, China). A muffle furnace (KBF1400, Laibu, Nanjing, China) was applied to handle TP and organic matter in the sediment. TN and TP in overlying water were digested through an autoclave (YXQ-LS-18SI, Boxun, Shanghai, China). NH3-N, TN, and TP in overlying water and sediment were tested using an ultraviolet visible spectrophotometer (UVS) (Lambda 950, PerkinElmer, Waltham, MA, USA).
2.4. Experimental Procedure
2.4.1. Determination of NH3-N Content in Overlying Water
250.00 mL of the water sample and a few drops of 0.5 g/L bromothymol blue indicator were added into a Kjeldahl flask, and the solution pH was adjusted to 6.0–7.4 with 0.01 mol/L H2SO4. Then, 0.25 g of light magnesium oxide and several glass beads were added into the flask. Using 50.00 mL of 0.01 mol/L H2SO4 as the absorbing liquid, the solution in the flask was heated and distilled until the distillate reached 200 mL. Then, 8.00 mL of distillate, 1.00 mL of chromogenic agent I (the mixed solution of 50 g salicylic acid, 160 mL 0.2 mol/L NaOH solution, 50 g sodium potassium tartrate, and 1000 mL water), and 2 drops of sodium nitroferricyanide were accurately added into a colorimetric tube and mixed evenly. Then, 2 drops of sodium hypochlorite solution were added into the tube. The resulting solution was applied for an NH3-N test in the UVS. Meanwhile, the same method was used for the blank control experiment.
2.4.2. Determination of TN Content in Overlying Water
10.00 mL of the sample and 5.00 mL of alkaline potassium persulfate solution were added into a colorimetric tube with a plug, digested in the high-pressure steam sterilizer, cooled to room temperature, and added to 1.00 mL HCl. The mixed solution was devoted to the TN test in the UVS. At the same time, the same method was used for the blank control experiment.
2.4.3. Determination of TP Content in Overlying Water
25.00 mL of sample and 4.00 mL of potassium persulfate were accurately added into a colorimetric tube with a plug, digested in the high-pressure steam sterilizer, cooled to room temperature, and added to 1.00 mL ascorbic acid solution. After 30 s, 2.00 mL of molybdate solution was added into the tube and shaken well. The resulting solution was applied for a TP test in the UVS. Meanwhile, the same method was used for the blank control experiment.
2.4.4. Determination of NH3-N Content in Sediment
40.0000 g of sample and 200.00 mL of potassium chloride solution were precisely added into a polyethylene bottle, shaken for 1 h at 150 rpm, and centrifuged for 10 min at 3000 rpm. An amount of 50.00 mL of the supernatant was transferred to a 100 mL colorimetric tube. Then, 40.00 mL chromogenic agent II (the mixed solution of 15 mL of 0.8 g/L sodium nitroprusolate dihydrate solution, 15 mL of 70 g/L phenol solution, and 750 mL water) was added into the tube, mixed evenly with the supernatant, left to stand for 15 min, added to 1.00 mL chromogenic agent III (the mixed solution of 5.0 g sodium dichloroisocyanurate and 1000 mL buffer solution of 280 g/L sodium citrate dihydrate and 22 g/L NaOH), mixed evenly again, and left to stand for 5 h at room temperature. The mixed solution was applied for a NH3-N test in the UVS. At the same time, the same method was used for the blank control experiment.
2.4.5. Determination of TN Content in Sediment
0.2500 g of sample, 100.00 mL ultrapure deionized water, and 50.00 mL alkaline potassium persulfate solution were added into a colorimetric tube with a plug, digested for 1 h at 125 °C in the high-pressure steam sterilizer, and cooled to room temperature. The sample was filtered, transferred into a 250 mL volumetric flask, added to 10.00 mL 10% HCl, and shaken well. The resulting solution was applied for a TN test in the UVS. Meanwhile, the same method was used for the blank control experiment.
2.4.6. Determination of TP Content in Sediment
0.2500 g of sample was accurately weighed into the nickel crucible, and a few drops of anhydrous ethanol were dropped to wet the sample. After 2 g of sodium hydroxide was tiled on the sample, the crucible was put into the muffle furnace, heated to 400 °C for 15 min, and continued to be heated to 640 °C for another 15 min. After cooling, 10 mL of water at about 80 °C was added to the crucible to dissolve the molten sample. The solution in the crucible was transferred into a centrifugal cup and centrifuged at 3500 rpm for 10 min. All the supernatant was transferred into a 100 mL volumetric flask for constant volume. An amount of 10.00 mL of the above solution was moved into a 50 mL colorimetric tube, added to 3 drops of indicator I (0.2/L g 2,4-dinitrophenol solution), adjusted the pH to a slightly yellow color with sodium hydroxide solution, and added to 1.00 mL of ascorbic acid solution. After 30 s, 2.00 mL molybdate solution was added into the tube and shaken well. The resulting solution was applied for a TP test in the UVS. Meanwhile, the same method was used for the blank control experiment.
2.4.7. Determination of Water Quality Parameters
The pH, dissolved oxygen (DO), Eh, chemical oxygen demand (COD), and T of the overlying water samples were measured. When sampling, the pH, Eh, and T were measured using a pH meter, potentiometer, and water temperature meter. DO and COD were determined by the iodimetry and dichromate method, respectively.
2.4.8. Determination of Physicochemical Properties of Sediment
The pH and the content of organic matter (OM) in the sediment were measured using the electrode and gravimetric methods, respectively.
3. Results and Discussion
3.1. Calibration Curves
The standard solutions of NH3-N, TP, and TN required in the experiment were prepared by stepwise dilution. Three calibration curves are established separately in Table S1. The squares of correlation coefficients were all higher than 0.999, which indicated that a good linear regression was established between the absorbance and the concentrations.
3.2. Validation of Analytical Methods
According to the requirements of the geological and mineral industry standard DZ/T0011-2015 of the People’s Republic of China, the accuracy and precision of the experimental methods could be obtained by measuring the CRM [13]. The CRM GBW07309 was analyzed five times, and the logarithmic deviation (ΔlgC) and relative standard deviation (RSD) values between the measured mean value and the standard value of each element were calculated and listed in Table S2. The ΔlgC and RSD values of the CRM were all smaller than the standard monitoring limits (ΔlgC and RSD ≤ 7%), and the detection limits (DLs), estimated as three times standard deviation of the blank, were 0.013 mg/L for N and 0.007 mg/L for P. These indicated that the accuracy and precision of the UVS method were high and satisfied the detection requirements.
3.3. Distribution of N and P in Overlying Water and Sediment
The contents of NH3-N, TN, and TP in the overlying water and sediment were accurately tested and listed in Table S3.
In the overlying water from different rivers, the contents of TN, NH3-N, and TP had significant spatial differences, as shown in Figure 2. TN content in Jingshui River was the highest, which was 11.8 ± 4.2 mg/L (mean ± standard deviation, the same below), and that in Yongchun River was the lowest (7.4 ± 1.3 mg/L). The order of average TN content was Jingshui River > Xinkai River > West Lake > Yitong River > Chuan Lake > Yongchun River. The spatial distribution of NH3-N was similar to that of TN. The highest NH3-N content was 8.8 ± 5.2 mg/L in Jingshui River, and the lowest one was 0.9 ± 0.6 mg/L in Yongchun River. The average NH3-N content was sorted as follows: Jingshui River > West Lake > Xinkai River > Chuan Lake > Yitong River > Yongchun River. The highest content of TP was 1.3 ± 1.2 mg/L in Xinkai River, and the lowest one was 7.4 × 10⁻² ± 1.4 × 10⁻² mg/L in Yongchun River. The order of average TP content was Xinkai River > Chuan Lake > Jingshui River > West Lake > Yitong River > Yongchun River. The contents of TN, NH3-N, and TP in the overlying water were all high in the north and west of Changchun, and the lowest in the south.
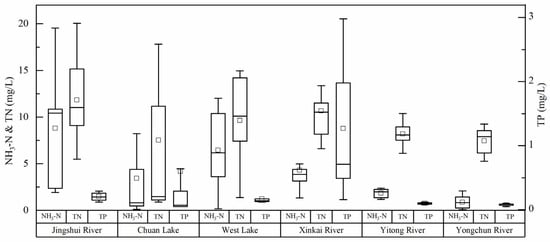
Figure 2.
The content of ammonia nitrogen (NH3-N), total nitrogen (TN), and total phosphorus (TP) in the overlying water of six rivers in Changchun City.
In the sediments of different rivers, the spatial distribution of NH3-N, TN, and TP contents varied greatly (Figure 3). TN content in Xinkai River was the highest, which was 7.3 ± 3.7 mg/L, and that in Yongchun River was the lowest (2.7 ± 1.3 mg/L). The order of average TN content was Xinkai River > Yitong River > Yongchun River > Chuan Lake > Jingshui River > West Lake. NH3-N content in Xinkai River was the highest, which was 3.2 ± 4.1 mg/g, and that in Jingshui River was the lowest (1.4 ± 0.6 mg/g). Average NH3-N content was sorted as follows: The order of average content was Xinkai River > Yongchun River > Yitong River > West Lake > Chuan Lake > Jingshui River. The highest TP content was 96.3 ± 21.1 mg/g in Yongchun River, and the lowest was 50.3 ± 17.3 mg/g in Chuan Lake. The order of average P content was Yongchun River > Yitong River > West Lake > Xinkai River > Jingshui River > Chuan Lake. The contents of NH3-N, TN, and TP in the sediment were generally high in the southern and western rivers of Changchun City, while relatively low in the north.
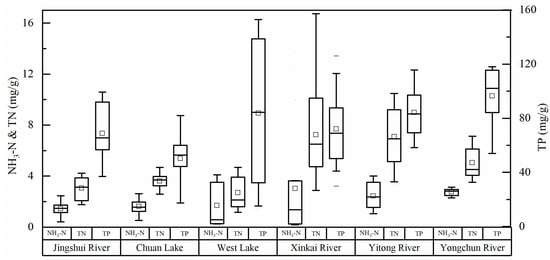
Figure 3.
The content of ammonia nitrogen (NH3-N), total nitrogen (TN), and total phosphorus (TP) in the sediment of six rivers in Changchun City.
There are significant diversities of N and P in the overlying water and sediment of six rivers from Changchun City, but whether the N and P content can further explain the different types of rivers needs to be further explored. Hence, the other physicochemical properties of overlying water and sediment were accurately tested into Table S4. All parameters were utilized for discriminant analysis of these six rivers. The classification based on the five discriminant functions is shown in Table S5; 95.1% of the cases were correctly classified. It can be seen from Table S6 that the cumulative percentage of eigenvalues of the first two discriminant functions was 75.7%, and that of the first three discriminant functions was 89.3%. The structure matrix of discriminant function is listed in Table 1. The scatter diagram of discriminant analysis is displayed in Figure 4. It can be well observed from the scatter diagram that the first and second discriminant functions separate the centroids of the six rivers.

Table 1.
Structure matrix for discriminant function of physicochemical parameters in overlying water and sediment of six rivers in Changchun City.
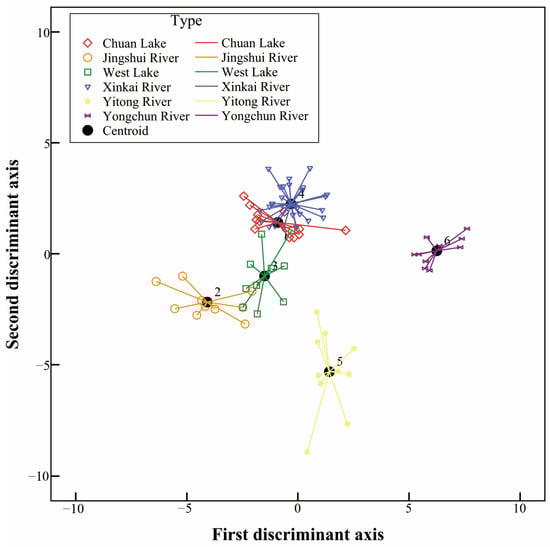
Figure 4.
Scatter diagram of discriminant analysis for six rivers in Changchun City.
From the structure matrix, the most influential factor on the first discriminant function was the TP content in sediment, while the most influential factors on the second discriminant function were the Eh and TP content in the overlying water. Thus, the TP content in the overlying water and sediment of each river was not only significantly different, but also a key parameter to distinguish the rivers. The greater the TP content in the sediment, the higher the potential of its release [14]; the TP content in the overlying water and sediment is also an important factor affecting P migration, that is, the P migration process plays a crucial role in the aquatic ecological environment [15].
3.4. Characteristics of N and P Pollution
The content of N and P in six rivers of Changchun City had extremely high variability. Through the investigation of the average chemical concentration of relevant parameters, the following characteristics of water quality were revealed. According to the environmental quality standard for surface water (GB3838-2002) of the People’s Republic of China in Table S7, the quality of NH3-N, TN, and TP in overlying water is graded in Figure 5.
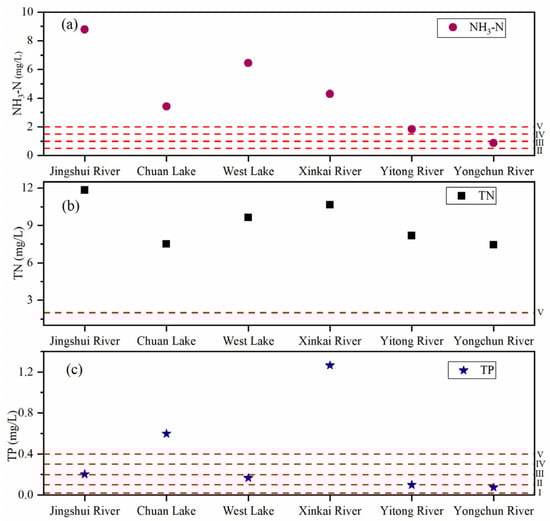
Figure 5.
The classification for average concentrations of (a) ammonia nitrogen (NH3-N), (b) total nitrogen (TN), and (c) total phosphorus (TP) in the overlying water of six rivers in Changchun City (the red dashed lines represent the classification standard values of level I~V for surface water in Table S7).
3.4.1. NH3-N
In Figure 5a, most of the average NH3-N concentrations in the overlying water of the six rivers exceeded the level V limit value of surface water in the national standard GB3838-2002. The water qualities of Jingshui River, Chuan Lake, West Lake, and Xinkai River were above the level V standard, and their mean overshoot multiples were 4.389, 1.713, 3.220, and 2.144, respectively. The water quality of Yitong River was level V, and that of Yongchun River was level III. In Changchun City, the areas with serious NH3-N pollution were as follows: Kuancheng District, where Jingshui River and Chuan Lake were located, and Lvyuan District, where West Lake and Xinkai River were located. There are industrial parks around Jingshui River, whose industrial wastewater and domestic sewage are discharged directly into the river all year round. In addition, the residual chemical fertilizers and pesticides from farmland also enter the river along with the surface runoff, which are the main reasons for its environmental destruction. Because of the urban expansion, the environment of Chuan Lake has been damaged. The area around Chuan Lake has become a garbage dump for industrial sewage discharge and construction waste landfill in the west of Changchun City during the urbanization. West Lake is a small reservoir formed by impounding the tributaries of Xinkai River. Both West Lake and Xinkai River carry the domestic sewage of Changchun City, which is also the source of their water environmental pollution.
NH3-N, a nutrient in water, can lead to eutrophication, and is also the main oxygen-consuming pollutant in water. It is toxic to fish and some aquatic organisms, and seriously endangers the health of infants and children [16]. The pollution of NH3-N in water is often ignored, but Zhao et al. [17] have proved that NH3-N is the most important factor impacting the water quality of Yellow River. Therefore, the NH3-N quality of Jingshui River, Chuan Lake, West Lake, and Xinkai River could not be neglected during the comprehensive water treatment.
3.4.2. TN
The average TN concentrations in the overlying water of the six rivers were very high in Figure 5b, and all exceeded the level V limit value of surface water in the national standard GB3838-2002. The mean over-standard multiples for Jingshui River, Chuan Lake, West Lake, Xinkai River, Yitong River, and Yongchun River were, separately, 5.913, 3.759, 4.815, 5.323, 4.091, and 3.719. The sampling points of the six rivers were concentrated in Kuancheng, Lvyuan, and Nanguan District of Changchun City. The distribution of NH3-N and TN had a certain similarity. Where the content of NH3-N was high, the TN also had a high content. To a certain extent, they have the same pollution sources, such as agricultural fertilizers and pesticides, animal husbandry organic waste, and domestic waste [18]. Besides these common N pollution sources, for the industrialized city of Changchun, industrial pollution is also one of the prime proveniences of water environment destruction. With social advancement, N runoff in rivers has become more and more serious. Excessive N content is the direct cause of river eutrophication, which leads to water quality degradation and endangers human and ecosystem health [19]. The TN content of these six rivers in Changchun City gravely surpassed the standard, which was a warning to the ongoing water environment treatment projects.
3.4.3. TP
The average TP concentrations in the overlying water of the six rivers were obviously different in Figure 5c; the water qualities of Chuan Lake and Xinkai River were above level V, and their exceeding multiples were 2.984 and 3.161, respectively. The water qualities of West Lake, Jingshui River, Yitong River, and Yongchun River were, separately, level V, level IV, level II, and level II. Compared with NH3-N and TN, the pollution degree of TP was slightly lower. The TP content was still high in Kuancheng and Lvyuan District, but the distribution pattern of PT content was disparate from that of NH3-N and TN, which indicated that there might be other pollution sources. Superfluous TP content is still the immediate cause of water eutrophication. At the same time, inappropriate TP concentration will also cause harm to human health; for example, direct contact with water which has high TP concentration will irritate and damage the skin.
To summarize, pollutants from industry, agriculture, and residents’ lives had caused quite serious N and P pollution to the major rivers in Changchun Urban, among which the TN and NH3-N pollution of Jingshui River near the industrial park was the most serious and should be treated as a key target for water pollution prevention. It should also be investigated whether the wastewater treatment process of nearby factories is qualified.
3.5. Temporal Variation of NH3-N and TP in Typical River
The spatial distribution of NH3-N, TN, and TP in the six rivers of Changchun City has been explored from the location of the sampling point and pollution rating in the previous content. To more fully understand their occurrence characteristics, it is necessary to analyze their time distribution. On the basis of the information about NH3-N and TP pollution provided in the annual surface water environmental quality report issued by the Changchun Ecological Environment Bureau, compared with the limits in national standard GB3838-2002, time analysis of the exceeding standard degree of NH3-N and TP qualities in a typical river (Yitong River) was carried out, and the result from 2014 to 2021 is displayed in Figure 6.
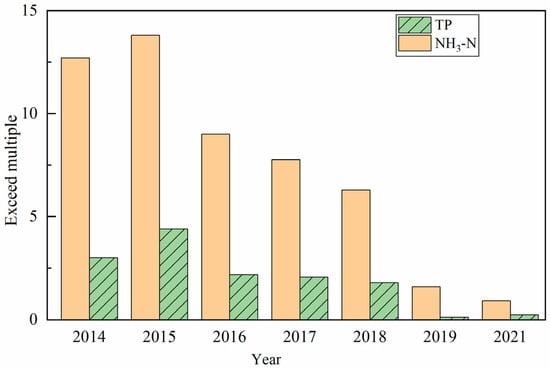
Figure 6.
Exceeding multiples of ammonia nitrogen (NH3-N) and total phosphorus (TP) in Yitong River of Changchun City from 2014 to 2021.
The over-standard multiples of NH3-N and TP pollution in Yitong River decreased markedly from 2014 to 2019, as shown in Figure 6; NH3-N and TP reduced from 12.7 to 1.6 and 3.0 to 0.13, respectively. In this experiment, NH3-N’s and TP’s exceeding multiples were, separately, 0.918 and 0.246, suggesting that the pollution situation of NH3-N and P was gradually developing in a beneficial direction. The main reason for this trend was that the government has actively implemented comprehensive governance work for Yitong River. Yitong River is the mother river of the Changchun people, which was called the largest water in Changyi in ancient times. However, the Yitong River itself gradually declined as the city grew. Fortunately, the advancement of civilization has become more and more rational. In 1997, the people’s Government of Changchun City started the management of the upper part of Yitong River, and since then, opened a new chapter for the all-sided treatment of Yitong River. As shown in Figure 6, the pollution degree of NH3-N and TP reduced dramatically in 2016. The reason was that a new round of planned treatment projects was established in 2015 and formally implemented in 2016. From the results, the project has achieved great successes.
Furthermore, when the nutrient load in water is constant, temperature, precipitation, and solar radiation will affect the eutrophication level of water. Thus, both social and climate trends must be taken into account when designing integrated management strategies for surface water.
3.6. The Relationship between N, P, and Water Quality
Water quality parameters can be devoted to expressing the degree of water environmental quality. The migration of N and P in water is inextricably related to water quality parameters, and the distribution of N and P can also affect the water quality parameters. The correlations between N, P, and water quality parameters are shown in Table 2.
Table 2.
Correlation between N, P, and other water quality parameters in overlying water and sediment.
There was a certain correlation between the environmental quality parameters (pH, COD, DO, and Eh) and the N and P contents of overlying water in Table 2. The positive correlation between pH and TP in the overlying water could be attributed to the increase in P release in sediment due to the strong alkalinity of the water body [20]. There was a significant positive correlation between COD and NH3-N, TN, and TP in overlying water, and DO was negatively correlated with TN and TP in water. The increase in nutrient (N, P, and NH3-N) contents might lead to the eutrophication of the water system; tiny plankton, protozoa, or bacteria could proliferate, consume dissolved oxygen, and accumulate organic matter. Thus, COD would increase and DO would decrease, which was consistent with the results of their correlation analysis. Eh, reflecting the redox ability of water, was only negatively correlated with TP in the sediment. Since the Eh values measured in this experiment were all positive (as shown in Table S4), the regional water bodies were considered to have a reduction reaction. With the increase in Eh, the oxidation of the water body was strengthened, and the metal ions complexing with P in the water increased, leading to the enhanced release of P and the corresponding reduction in TP content in the sediment [21]. Therefore, the water quality parameters had the strongest correlation with P content in the overlying water and sediment, while in sediment, the P absorption depended on precipitation and biological adsorption, and the P release was affected by the chemical change of the solution, biomass release, and hydrolysis of organic P [22]. This manifested in the P concentration being mutually restricted with the water environment, especially in the overlying water. Moreover, the migration and transformation of N in the water and sediment also interacted with the water environment quality [23]. Therefore, the interaction between N, P, and water quality parameters is complex, and no single parameter works alone.
COD is an important quality parameter of a water environment. It measures the amount of reducing substances that need to be oxidized in samples, and reflects the pollution degree of reducing organic matter in water. Based on the high correlation between COD and NH3-N, TN, and TP in the overlying water in Table 2, the partial least squares (PLS) method was used to explore the establishment of their regression equations, with the aim of simply estimating the COD value in water bodies from the contents of TP, TN, and NH3-N in the absence of actual COD measurements. The basic principle of this method was to extract the principal components (several comprehensive variables with the best explanatory power for both the independent variables of TP, TN, and NH3-N and the dependent variable of COD) from the independent variable system consisting of TP, TN, and NH3-N; establish the regression equation of COD to the principal components; and then restore the above equation to the PLS regression equation of COD to TP, TN, and NH3-N. In this article, the measured values of TN, TP, and NH3-N of the overlying water in Table S3 were set as predictive variables, the measured values of COD (Table S4) at corresponding points were set as response values, the calculation of the PLS regression equation was realized by invoking the “plsregress” function in MATLAB software, and the results are displayed in Figure 7.
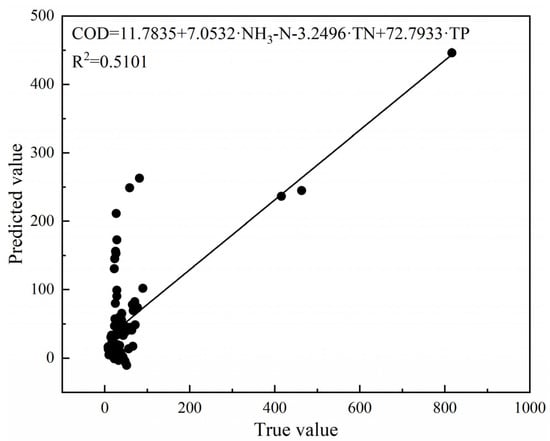
Figure 7.
True and predicted values of chemical oxygen demand (COD) predicted by partial least squares regression.
Most of the data were distributed on both sides of the trend line, and only the eight data (9.5% of the total data) with predicted values of 100–300 in the lower left corner of Figure 7 deviated significantly from the trend line. It was preliminarily judged that the COD values in the regional water bodies can be simply estimated from the measured values of TN, TP, and NH3-N in the overlying water using this regression equation. However, COD was actually influenced by complex factors in the water; it was impossible to highly accurately estimate the COD value through simple linear regression, which should be deeply studied in the future. Although, there were some errors in the regression prediction results, which also confirmed the complex relationship between N, P, and the water quality parameters.
4. Conclusions
In this study, the overlying water and sediment samples of six rivers in Changchun City were analyzed, and the content distribution of N and P was clarified. Based on the surface water environmental quality standards, the N and P contamination degree of each river was evaluated. From the time perspective, the pollution level of N and P in the key rivers of Changchun was observed and analyzed. Additionally, the relationship between N, P, and water quality was comprehensively considered.
In the main rivers of Changchun City, there were differences in the spatial distribution of N and P contents in the overlying water and sediment. Specifically, the contents of N and P in the overlying water were high in the north and west of Changchun City, but low in the south. In the south and west, the contents of N and P in the sediment were high, while those in the north were low.
The pollution of NH3-N, TN, and TP in Xinkai River and Chuan Lake was extremely serious, with a quality rating of V or above. The N pollution degree in Yitong River, Jingshui River, and West Lake was acuter than that of P pollution. In Yongchun River, the N and P environmental quality was the best. Pollution sources, mainly industrial wastewater, should be the primary treatment object of N and P pollution prevention and control of the water environment.
Through the time analysis of a crucial river in Changchun City, it was found that the N and P pollution in Yitong River gradually improved since 2016, due to the government’s vigorous comprehensive water quality control work, and the exceeding multiple of NH3-N and TP has decreased to less than 1 in 2021. Under the condition of balanced water nutrient load, the change in external environment might still lead to eutrophication. Therefore, in the comprehensive management of surface water environmental quality, climate and social trends should not be ignored.
The correlation analysis showed that there was indeed an internal correlation between the water quality and the distribution of N and P. P content in the overlying water and sediment had the most powerful correlation with the water quality parameters. However, because of the complex interaction between N, P, and water quality parameters, there was no single parameter acting alone. Based on the high correlation between COD and N and P in the overlying water, COD could be predicted to some extent using the partial least squares method.
In conclusion, with the development of social industry and urbanization, more and more surface water pollution has occurred. The pollution of nutrition elements was closely connected with water quality. Taking Changchun, a typical representative of a Chinese old industrial city, as an example, investigating the temporal and spatial distribution of N and P pollution and exposing the correlation between N, P, and water quality parameters could be used for reference in the surface water pollution control in other industrial cities.
Supplementary Materials
The following supporting information can be downloaded at: https://www.mdpi.com/article/10.3390/app122010291/s1, Table S1: Summary for the measurement results of ammonia nitrogen (NH3-N), total nitrogen (TN), and total phosphorus (TP) in standard solutions; Table S2: Measurement results of certified reference material GBW07309; Table S3: Content of ammonia nitrogen (NH3-N), total nitrogen (TN), and total phosphorus (TP) in the overlying water and sediment of six rivers in Changchun City; Table S4: Other physicochemical properties of overlying water and sediment in six rivers of Changchun City; Table S5: Classification of samples based on five discriminant functions; Table S6: The eigenvalue of canonical discriminate function; Table S7: Classification standard of ammonia nitrogen (NH3-N), total nitrogen (TN), and total phosphorus (TP) for surface water in the environmental quality standard GB3838-2002 of the People’s Republic of China.
Author Contributions
Conceptualization, Z.L. and Y.Z.; methodology, Z.L., B.L. and X.T.; software, B.Y. and Z.Z.; validation, X.T. and B.L.; formal analysis, X.T. and Y.Z.; investigation, Z.L., S.H., Z.Z. and B.Y.; resources, Y.Z.; data curation, S.H. and X.T.; writing—original draft preparation, X.T. and Z.L.; writing—review and editing, Y.Z.; visualization, S.H. and Z.L.; supervision, X.T.; project administration, Y.Z.; funding acquisition, Y.Z. All authors have read and agreed to the published version of the manuscript.
Funding
This work was supported by Science and Technology Innovation Project of the 7th Institute of Geology & Mineral Exploration of Shandong Province (QDKY202001), Environmental Protection Research Project of Ecology and Environment Department of Jilin Province (No. 2019-12), and Fundamental Research Funds for the Central Universities (451180304165).
Institutional Review Board Statement
Not applicable.
Informed Consent Statement
Not applicable.
Data Availability Statement
Data are contained within the article or Supplementary Material.
Conflicts of Interest
The authors declare no conflict of interest.
References
- Steele, M.K. The scaling of urban surface water abundance and impairment with city size. Geomorphology 2018, 305, 231–241. [Google Scholar] [CrossRef]
- Beaulieu, J.J.; Golden, H.E.; Knightes, C.D.; Mayer, P.M.; Kaushal, S.S.; Pennino, M.J.; Arango, C.P.; Balz, D.A.; Elonen, C.M.; Fritz, K.M.; et al. Urban Stream Burial Increases Watershed-Scale Nitrate Export. PLoS ONE 2015, 10, e132256. [Google Scholar] [CrossRef] [PubMed]
- Broadhead, A.T.; Horn, R.; Lerner, D.N. Finding lost streams and springs captured in combined sewers: A multiple lines of evidence approach. Water Environ. J. 2015, 29, 288–297. [Google Scholar] [CrossRef]
- Brown, R.R.; Keath, N.; Wong, T.H.F. Urban water management in cities: Historical, current and future regimes. Water Sci. Technol. 2009, 59, 847–855. [Google Scholar] [CrossRef] [PubMed]
- Elmqvist, T.; Fragkias, M.; Goodness, J.; Güneralp, B.; Marcotullio, P.J.; McDonald, R.I.; Parnell, S.; Schewenius, M.; Sendstad, M.; Seto, K.C.; et al. Urbanization, Biodiversity and Ecosystem Services: Challenges and Opportunities; Springer: Dordrecht, The Netherlands, 2013. [Google Scholar] [CrossRef]
- McDonald, R.I.; Weber, K.; Padowski, J.; Flörke, M.; Schneider, C.; Green, P.A.; Gleeson, T.; Eckman, S.; Lehner, B.; Balk, D.; et al. Water on an urban planet: Urbanization and the reach of urban water infrastructure. Glob. Environ. Chang. 2014, 27, 96–105. [Google Scholar] [CrossRef]
- Wulan, D.R.; Marganingrum, D.; Yoneda, M. Distribution, source identification, and assessment of heavy metal pollution in the surface and pore waters of Cipeles River, West Java, Indonesia. Environ. Sci. Pollut. Res. 2020, 27, 39123–39134. [Google Scholar] [CrossRef] [PubMed]
- Kovalyshyna, S.; Chuzhekova, T.; Grandova, M.; Onishchenko, E.; Zubcov, E.; Ukrainskyy, V.; Goncharov, O.; Munjiu, O.; Nabokin, M.; Ene, A. Ecological Conditions of the Lower Dniester and Some Indicators for Assessment of the Hydropower Impact. Appl. Sci. 2021, 11, 9900. [Google Scholar] [CrossRef]
- Song, Y.; Liu, H. Typical urban gully nitrogen migration in Changchun City, China. Environ. Geochem. Health 2013, 35, 789–799. [Google Scholar] [CrossRef] [PubMed]
- Barreto, P.; Dogliotti, S.; Perdomo, C. Surface Water Quality of Intensive Farming Areas Within the Santa Lucia River Basin of Uruguay. Air Soil Water Res. 2017, 10, 1–8. [Google Scholar] [CrossRef]
- Fan, L.; Qiu, L.; Hu, G.; Song, C.; Meng, S.; Li, D.; Chen, J. Ammonia-Oxidizing Bacterial Communities in Tilapia Pond Systems and the Influencing Factors. Appl. Sci. 2022, 12, 3438. [Google Scholar] [CrossRef]
- You, Q.; Chai, Y.; Jiang, C. Assessment of the spatial distribution of surface water resources in Changchun, China using remote sensing. J. Water Supply Res. T 2018, 67, 490–497. [Google Scholar] [CrossRef]
- Zhao, Y.; Li, H.; Li, B.; Lai, Y.; Zang, L.; Tang, X. Process design and validation of a new mixed eluent for leaching Cd, Cr, Pb, Cu, Ni, and Zn from heavy metal-polluted soil. Anal. Methods 2021, 13, 1269–1277. [Google Scholar] [CrossRef] [PubMed]
- Yang, C.; Yang, P.; Geng, J.; Yin, H.; Chen, K. Sediment internal nutrient loading in the most polluted area of a shallow eutrophic lake (Lake Chaohu, China) and its contribution to lake eutrophication. Environ. Pollut. 2020, 262, 114292. [Google Scholar] [CrossRef] [PubMed]
- Huang, L.; Fang, H.; Reible, D. Mathematical model for interactions and transport of phosphorus and sediment in the Three Gorges Reservoir. Water Res. 2015, 85, 393–403. [Google Scholar] [CrossRef] [PubMed]
- Wang, M.; Gu, H.; Wang, H.; Chi, B. Evaluation of three different types of nitrogen, heavy metals, and endocrine disruptors in water and sediments of Wenyu River. Hum. Ecol. Risk Assess 2017, 23, 1906–1927. [Google Scholar] [CrossRef]
- Zhao, M.M.; Chen, Y.-p.; Xue, L.-g.; Fan, T.T. Three kinds of ammonia oxidizing microorganisms play an important role in ammonia nitrogen self-purification in the Yellow River. Chemosphere 2020, 243, 125405. [Google Scholar] [CrossRef]
- Li, L.; Li, G.; Liao, X. Assessment on the pollution of nitrogen and phosphorus of Beijing surface water based on GIS system and multivariate statistical approaches. J. Environ. Sci. 2004, 16, 981–986. [Google Scholar] [CrossRef]
- Sinha, E.; Michalak, A.M.; Calvin, K.V.; Lawrence, P.J. Societal decisions about climate mitigation will have dramatic impacts on eutrophication in the 21st century. Nat. Commun. 2019, 10, 939. [Google Scholar] [CrossRef]
- Hu, Q.-h.; Zhu, Y.-m.; Song, J.; Li, Z.-y.; Wen, J.-j. Effects of pH andEh on release of nitrogen and phosphorus from sediments of West Lake. J. Zhejiang Univ. Sci. A 2003, 4, 358–362. [Google Scholar] [CrossRef]
- Peng, J.-f.; Wang, B.-z.; Song, Y.-h.; Yuan, P.; Liu, Z. Adsorption and release of phosphorus in the surface sediment of a wastewater stabilization pond. Ecol. Eng. 2007, 31, 92–97. [Google Scholar] [CrossRef]
- Evans, D.J.; Johnes, P.J.; Lawrence, D.S. Physico-chemical controls on phosphorus cycling in two lowland streams. Part 2–The sediment phase. Sci. Total Environ. 2004, 329, 165–182. [Google Scholar] [CrossRef] [PubMed]
- Zhao, H.; Zhang, L.; Wang, S.; Jiao, L. Features and influencing factors of nitrogen and phosphorus diffusive fluxes at the sediment-water interface of Erhai Lake. Environ. Sci. Pollut. Res. 2018, 25, 1933–1942. [Google Scholar] [CrossRef] [PubMed]
Publisher’s Note: MDPI stays neutral with regard to jurisdictional claims in published maps and institutional affiliations. |
© 2022 by the authors. Licensee MDPI, Basel, Switzerland. This article is an open access article distributed under the terms and conditions of the Creative Commons Attribution (CC BY) license (https://creativecommons.org/licenses/by/4.0/).