1. Introduction
As air traffic volume increases, air traffic controller (ATC) fatigue has become a major cause of air traffic accidents. This state makes the operating ability of the controller decline, which makes it easy for them to cause work errors and even lead to accident symptoms or accidents. According to data from the American Aviation Safety Voluntary Reporting System, there are 52,000 unsafe incidents caused by fatigue, accounting for 21% of operational errors. According to data from the British Aviation Safety Voluntary Reporting System, 13% of the operational errors were directly related to controller fatigue, and according to data from China’s ATC Safety Reporting System, 18% of work errors are related to controller fatigue [
1,
2]. It can be seen that nearly one-fifth of the unsafe events in the operation of civil aviation are related to the fatigue of controllers. For this reason, it has become a hot topic in recent years to detect the fatigue state of ATC quickly and accurately.
Fatigue detection usually judges the fatigue state according to some features related to the tested person [
3]. At present, fatigue state detection methods of air traffic controllers can be divided into subjective detection methods and objective detection methods, according to different implementation paths. The subjective test method is mainly in the form of filling in a fatigue scale by the tested personnel [
4,
5,
6,
7,
8,
9,
10]. According to the score on the fatigue scale, the fatigue state can be judged. This method is easy to implement but has poor applicability. The objective detection method refers to the use of auxiliary tools to record the changes in some indicators related to the human body, or human factor engineering, in order to judge the fatigue state. Wang Lili et al. [
4] evaluated the fatigue state of controllers under different shift scheduling modes through the analysis and research of EEG signals. The study found that when the EEG frequency of the controller decreased to a certain extent, it appeared to be θ wave, the ATC experienced decreased alertness and weakened operational ability. Mandal et al. proposed a fatigue classification method based on eyelid closure using simulation tower control software and an eye tracker. Jin Huibin [
8] and others extracted six indicators, such as the rate of a saccade, the time span of fixation and the percentage of eye closure time (PERCLOS) as the discrimination index of fatigue. The disadvantage of this method is that an image acquisition device needs to be set in front of the subject’s face to collect facial images. On the one hand, it will make the subject more prone to fatigue under psychological pressure. On the other hand, it needs to process the image, and the detection results will be delayed to a certain extent.
In recent years, the fatigue detection method based on speech has become a research hotspot of fatigue detection methods because of its high detection accuracy and strong applicability [
11,
12,
13]. Speech signal data from the controller can be directly obtained by embedding a sensor in the controller’s radio communication device. In the process of speech signal processing, compared with the linear analysis method, the application of the speech nonlinear dynamics analysis method can more completely obtain the impact of fatigue on speech signaling. Specifically, the fatigue state detection method based on speech features will not have any impact on the normal work of controllers, and it can greatly save the detection cost. The most important point is that the fatigue state detection method based on speech features can effectively improve the accuracy of the detection results. At present, the research on the fatigue state detection method based on speech features mainly focuses on time domain and frequency domain features. The commonly used time domain features include pitch, short-time energy, short-time zero crossing rate, average amplitude, harmonic noise ratio, autocorrelation coefficient, etc. Frequency domain features include formant frequency, Mel frequency cepstrum coefficient (MFCC), linear prediction cepstrum coefficient (LPCC) and line spectrum pair (LSP) [
14,
15]. In this paper, we chose the MFCC as the detection feature.
Fatigue detection, in essence, can be attributed to a two-classification problem: normal/fatigue. At present, the main research direction in the field of fatigue detection is the machine learning method. Some typical machine learning methods, such as k-nearest neighbor (KNN), back propagation neural network (BPNN) and deep learning, have been successfully applied in this field [
16,
17,
18,
19,
20,
21,
22,
23,
24]. However, for machine learning, in order to obtain an ideal detection model, an unavoidable problem is the parameter setting. Although many scholars have performed a lot of work on parameter selection, it is difficult to find the optimal parameters. A poor parameter may affect the detection effect and has become a bottleneck in the application of machine learning methods. In recent years, an ensemble learning algorithm has attracted more and more attention [
25,
26]. The ensemble learning algorithm improves the generalization performance of the whole algorithm by integrating multiple base classifiers. In ensemble learning, in order to obtain a good generalization ability, the decision accuracy of each base classifier is required to be higher than that of a random guess. In this condition, the SVM, KNN, Bayesian and other methods with good generalization ability almost do not need to consider the parameter problem, thus avoiding parameter selection. In this way, the current bottleneck problem can be broken through. So, this paper chooses ensemble learning to research fatigue detection.
The process of ensemble learning mainly includes two parts: the construction of a base classifier and the fusion method of multi-classifier results [
27]. The greater the difference in each base classifier, the stronger the overall performance that can be obtained. In order to improve the differences between the base classifiers, this paper adopts the method of heterogeneous integration and multi-sampling. In addition, the fusion method of the base classifier is the other key problem affecting the detection model. At present, the most commonly used and effective methods are the voting method and the weighting method. In contrast, the weighted method is an improvement on the voting method. It weighs the decision-making output according to the classification performance of different base classifiers. However, how much weight is assigned and whether the result is optimal is another problem. In order to solve this problem, this paper uses a quantum genetic algorithm to optimize the weights of each base classifier and improve the accuracy of the detection model.
To sum up, this paper takes the ensemble learning method as the core detection algorithm and improves the detection accuracy by optimizing the construction of the base classifier and result fusion methods. The specific arrangement of the paper is as follows:
In the second section, the speech feature extraction method MFCC is introduced. The third section introduces the whole algorithm, heterogeneous integration and sampling are introduced to improve the difference in base classifiers, and then optimizes the weighted method of decision-making with SQGA; the fourth section tests the proposed algorithm on some basic datasets to verify the effectiveness of the algorithm; in the fifth section, this method is applied to ATC fatigue detection to test the performance of the algorithm; and finally, the full text is summarized.
2. ATC Speech Extract by MFCC
Speech-based fatigue-state detection is a new hotspot in the research on fatigue state management. The implementation process of this method is similar to that of speech emotion recognition. The research on speech-based fatigue-detection technology first needs to establish a speech fatigue database.
When the human body is tired, attention and reaction ability decline. The direct manifestation of controller fatigue is that when issuing control instructions, the controller often gets stuck, hesitates, or even issues the wrong instructions, or cannot find the error in the pilot’s repeated instructions in time. Therefore, when the controller’s voice is stuck, fuzzy and wrong, the controller’s state corresponding to the voice is labeled as “fatigue”.
Figure 1 shows the waveform of the same command sent by controllers in different statuses.
In recent years, the most widely used feature parameters in speech recognition are spectral correlation features. The commonly used spectral correlation feature is the Mel cepstrum coefficient (MFCC). MFCC was proposed by Stevens, Volkman and Newman in 1937. It is a perceptual scale judged by the audience at an equal distance from each other. Mel is a measure of perceived tone or tone frequency. Above about 500 Hz, the listener judges larger and larger intervals to produce equal pitch increments. The four octaves on the hertz scale above 500 Hz are judged to include about two octaves on the scale. The Mel scale is approximately linear below 1 kHz and logarithmic above. The following formula is used to calculate the hertz (in Hz) of a given frequency
f. MFCC has a strong anti-noise ability, and the relationship between its Mel frequency (
) and the actual frequency
of voice is:
The MFCC feature extraction process is as follows:
The
Figure 2 shows the MFCC feature extraction process. The specific process is as follows:
(1) Sample continuous signal (voice) at sampling frequency: In the first stage of MFCC, feature extraction is performed to increase the energy at high frequency. This pre-emphasis is accomplished by a digital filter, and the equation is:
where α represents the pre-weighting factor.
(2) Framing: The speech signal is divided into frames and the short-time characteristics of the speech signal are extracted. It is a process of dividing speech samples obtained from analog-to-digital conversion (ADC) into small frames with a time length in the range of 20~40 ms. Framing enables the non-static speech signal to be segmented into quasi-static frames, and the speech signal can be Fourier transformed because the speech signals exhibit quasi-static behavior in a short time of 20~40 ms. The smoothening of the voice signal is performed with the Hamming window:
(3) Add windows: The windowing step is used to windowize each individual frame, to minimize signal discontinuities at the beginning and end of each frame.
(4) FFT: The Fast Fourier transform (FFT) algorithm is ideally used to evaluate the spectrum of speech. FFT converts each frame of n samples from time domain to frequency domain. The linear spectrum of speech signal is obtained by discrete Fourier transform:
(5) Extract the spectrum, Mel filter bank and frequency envelope through Mel frequency filter: Mel filter bank is composed of overlapping triangular filters, and the cut-off frequency is determined by the center frequency of two adjacent filters. The filter has a linearly spaced center frequency and a fixed bandwidth on the Mel scale. Mel frequency filter is designed as follows:
where
p is the index of filters. Each filter has triangular filtering characteristics, and its center frequency is
:
where
and
are the highest frequency and the lowest frequency of the filter banks, respectively;
is the sampling frequency,
;
is the number of filter banks, here
; and
N is the number of points of FFT transformation, and
N = 4096.
(6) Take the logarithm of Mel spectrum: This has the effect of changing multiplication into addition. Therefore, this step simply converts the multiplication of amplitude in Fourier transform into addition to obtain logarithmic spectrum
. Its transfer function is:
(7) Discrete cosine transforms (DCT): Orthogonalize the energy vector of the filter. Due to this orthogonalization step, the information of the filter energy vector is compressed. The MFCC parameter
is obtained by discrete cosine transform of
:
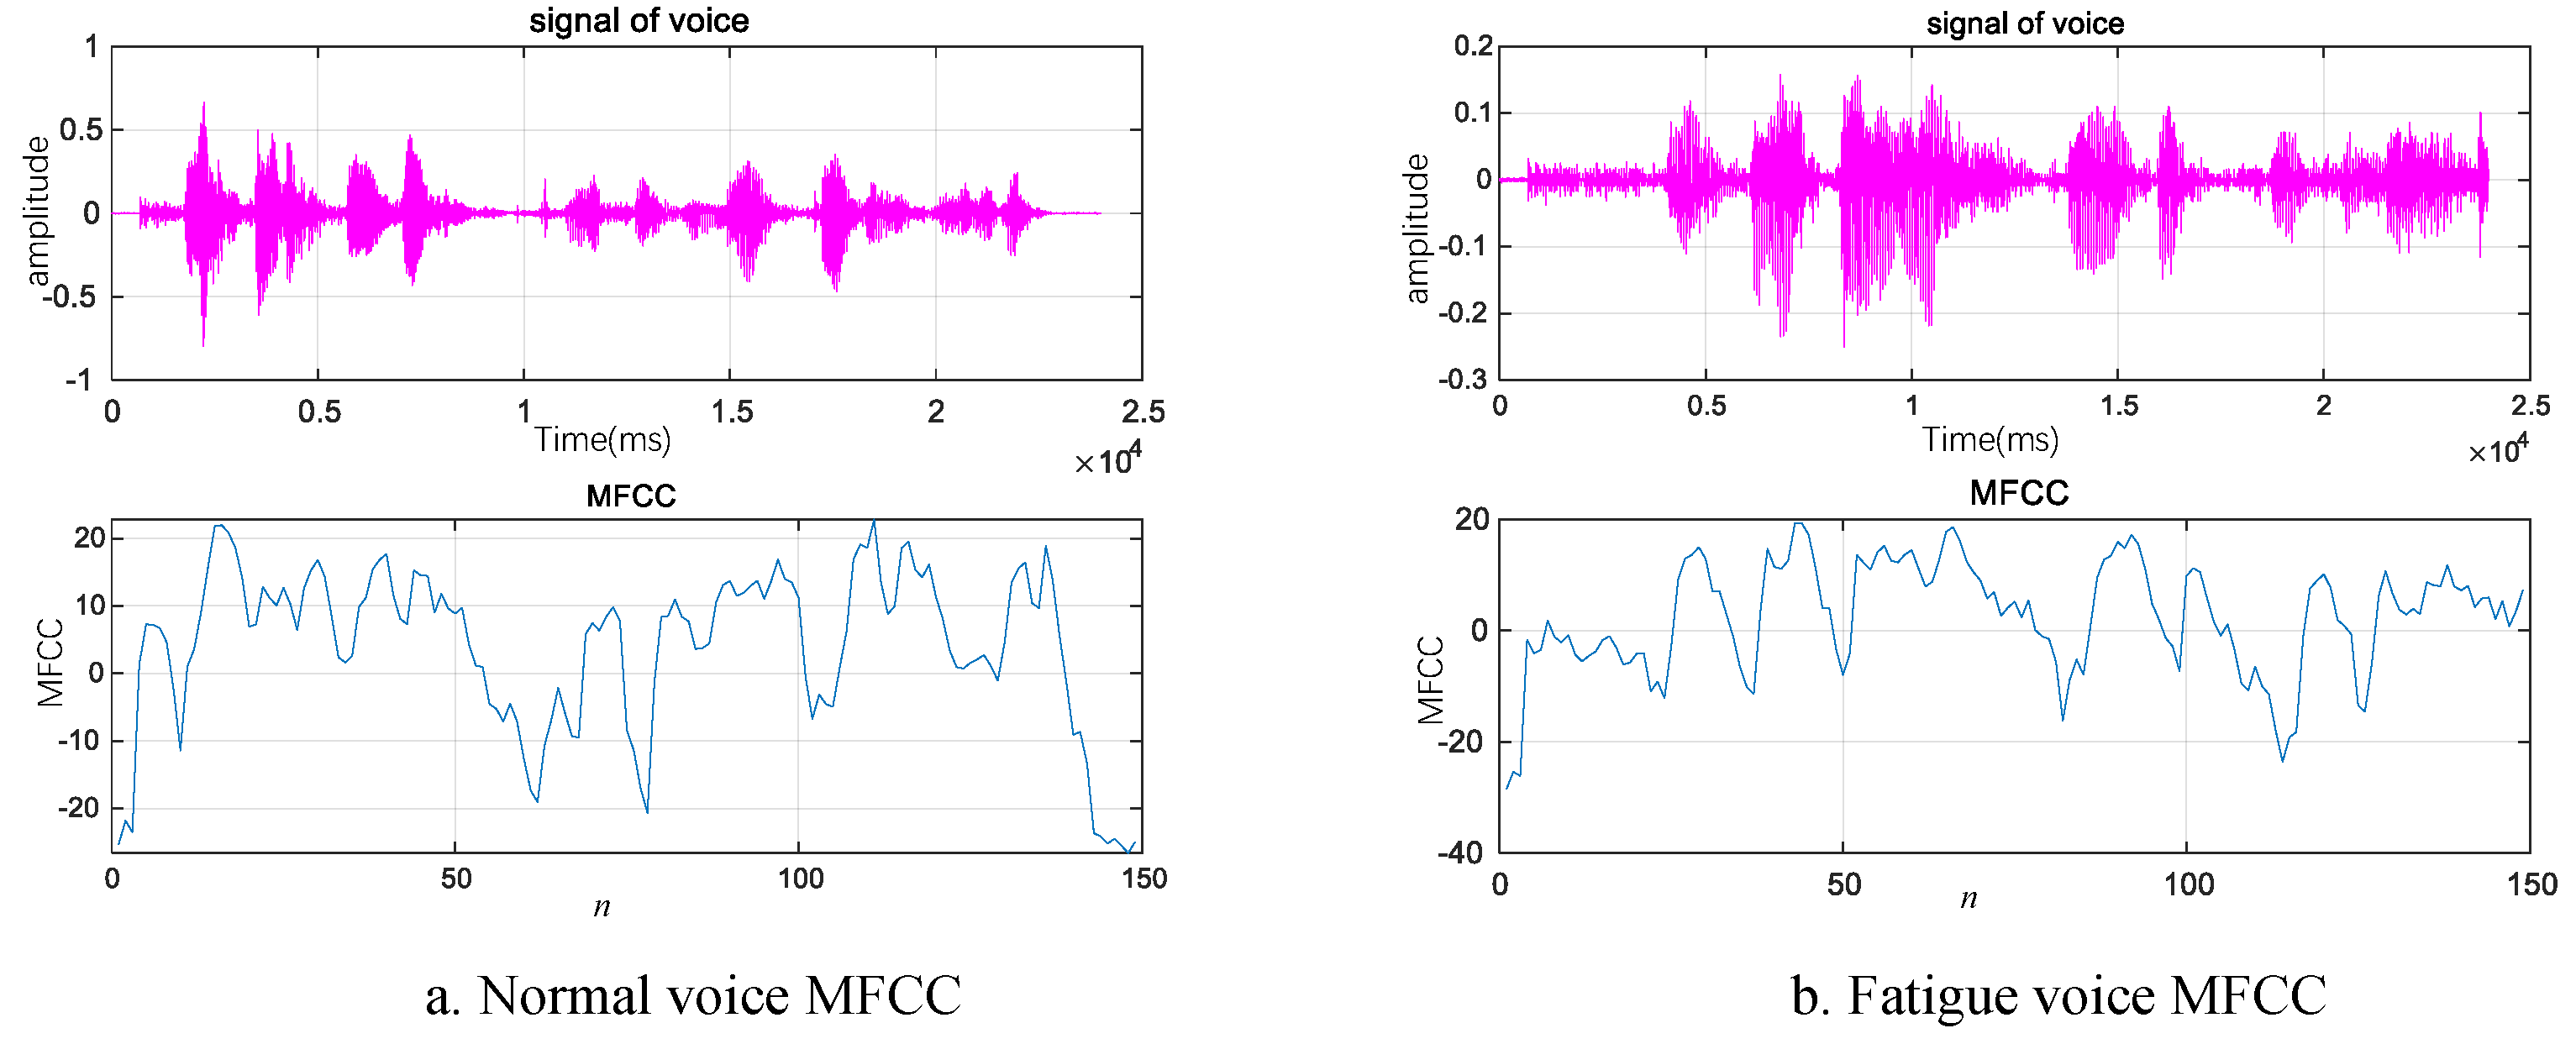
From
Figure 3, we can see that the speech signal in the time domain with 24,000-dimensional features is extracted by MFCC to only 150-dimensional features. The dataset of fatigue detection can be obtained by processing the voice of controllers in different statuses.
3. Heterogeneous Ensemble Learning by SQGA
After obtaining the characteristic, the fatigue is detected by the ensemble learning method. In order to improve the effect of ensemble learning, this paper uses the heterogeneous ensemble learning method to integrate a variety of learning machines. In addition, different sample methods are adopted to improve the differences between training samples. These methods can improve the generalization of ensemble learning and ensure detection accuracy.
3.1. Heterogeneous Base Classifiers
Ensemble learning is combining multiple learned models to solve a problem. The final output of input is determined by the output of each learning machine in this input [
27]. In reference [
27], the necessary and sufficient condition for the ensemble classifier to be more accurate than the individual classifier is given: the individual classifier is accurate and diverse. As we mentioned earlier, the current machine learning methods with good generalization can meet the accuracy requirements without considering the parameter selection. Here we need to focus on how to improve the differences between base classifiers.
According to the similarities and differences of their own classification algorithms, ensemble learning can be divided into isomorphic and heterogeneous ensembles. In an isomorphic ensemble, all base classifiers adopt the same learning algorithm, but the parameters and samples selected by the algorithm are different. A heterogeneous ensemble uses different classifiers, and different learning algorithms can effectively ensure the differences between base classifiers. Therefore, in this paper, a heterogeneous ensemble is chosen to study fatigue detection.
In addition to the classification method, the selection of training datasets for base classifiers influences the learning machine significantly. According to the method of dataset selection, ensemble learning can be divided into pattern-level integration and feature-level ensemble. Pattern-level ensemble uses simple repeated sampling or changes the distribution of samples to resample the original dataset so that each base classifier can obtain different training sets to improve the differences between them. At present, the common bagging and boosting methods are pattern-level ensembles. Feature-level ensemble mainly aims at the scene with more features. It selects feature subsets reflecting different properties of the problem to form the training set for the base classifier. Generally, the sample dimension of fatigue detection is high. It is feasible to use a feature-level ensemble here. In order to improve the accuracy of the base classifier, we combine the pattern level and feature level to construct the heterogeneous ensemble.
3.2. Weight Optimization by SQGA
On the basis of obtaining the output of multiple base classifiers, it is necessary to fuse these outputs to get the final detection result. Because fatigue detection is a binary classification problem, we set the output results of each base classifier to +1 and −1, respectively, indicating normal and fatigue detection. Suppose there are n base classifiers, the detection result of the
i-th base classifier is
and the weight of fusion is
, then the final detection result is:
We need to find the optimal
to ensure the highest detection accuracy of the model, the optimization objective function should be:
Among them,
acc represents the test accuracy of the whole ensembled model under different weights, vector
. In order to solve this problem, we choose quantum genetic algorithm (QGA) to solve it. QGA is an optimization method combining quantum computing with a genetic algorithm [
28], which has the advantages of fast convergence speed and strong global optimization ability.
The difference between quantum genetic algorithm and traditional genetic algorithm is mainly reflected in two aspects:
(1) chromosome is represented by qubit code, and gene is expressed in the form of probability amplitude.
The m-bit qubit code can be expressed as:
where (
,
) is the
i-th qubit in the chromosome, which is a pair of complex numbers, representing the probability amplitude of the corresponding bit, and satisfying
,
and
represent two different bit states. When the qubit is not observed, the qubit is in the basic state. After observing the qubit, the qubit will collapse to 0 or 1 with the probability of
or
.
(2) The quantum rotation gate is used to replace the selection, crossover and mutation operations, and the population is updated by changing the quantum rotation angle. The qubit is updated to
where: (
,
) denotes the updated
i-qubit;
is the quantum rotation angle.
A Quantum genetic algorithm has the characteristics of fast convergence speed and strong global optimization ability; however, the quantum angle rotation strategy can only rotate at a fixed size, it is easy to fall into local optimization. In this paper, we use adaptive adjustment of quantum rotation angle to improve the quantum genetic algorithm. When the individual fitness approaches the optimal individual, the quantum rotation angle decreases, which makes the individual evolve in a good direction; when the individual fitness is far away from the optimal individual, the quantum rotation angle increases, expands the search space and jumps out of the local optimum.
In the process of quantum gate rotation and update, it cannot reach the global optimal solution with probability “1”, which can easily fall into premature convergence. Therefore, this paper introduces crossover and mutation operations in traditional GA to increase the search space and avoid falling into the local optimal solution. The selection of crossover probability and mutation probability in the genetic algorithm is the key to affecting the behavior and performance of the genetic algorithm. If the crossover probability is too large, the probability of a genetic mode being destroyed is greater, which makes the individual structure with high fitness be destroyed quickly; if the crossover probability is too small, the search process is slow, so as to stagnate. For the mutation probability, if the value is too small, it is not easy to produce a new structure; if the value is too large, it will become a pure random search algorithm. The adaptive algorithm can solve this problem well, and the crossover probability and mutation probability can be adjusted automatically with the fitness. For the individuals whose fitness is higher than the average fitness of the population, the lower crossing probability and mutation probability should be adopted to protect the individual into the next generation, while the individual with fitness lower than the average value should be selected with a higher cross probability and mutation probability to make the individual eliminated.
In the adaptive strategy, the quantum rotation angles
, the crossover probability
and the mutation probability
are calculated as follows:
where:
is the maximum fitness of the population;
is the maximum fitness of the population; is the average fitness of the population;
is the larger fitness of the two individuals to be crossed;
is the fitness of the mutant individual;
is the current individual fitness;
is the maximum value of
interval;
is the minimum value of
interval; and
,
,
and
are constants. Compared with QGA, the SQGA’s crossover and mutation probabilities are generated adaptively by Formulas (14) and (15) to perform quantum crossover mutation operation. The algorithm can dynamically adjust the key parameters of the algorithm, improve the search efficiency and find the optimal solution conveniently, which is suitable for determining the weight of decision-making level.
3.3. Algorithm Flow
According to the previous analysis and the actual situation of fatigue detection, this paper adopts heterogeneous integration. The current mature machine learning methods with better generalization performance: SVM, KNN, Bayesian network (BN) and BPNN are selected as the learning methods of the base classifier. In order to further improve the differences between base classifiers, pattern-level and feature-level selection training set methods are adopted. An ensemble learning detection algorithm based on SQGA optimized weights is proposed. The specific algorithm process is shown in
Figure 4.
The specific steps of the algorithm are as follows:
Step 1: According to the bagging method, samples are resampled to determine multiple sample subsets;
Step 2: Feature-level method is used to randomly select features of the previously obtained sample subsets;
Step 3: Use different learning methods to learn the subsets obtained in step 2. The parameters of each base classifier are arbitrarily set;
Step 4: Weight the results of each base classifier. The weights are obtained by SQGA in
Section 3.2, and the final detection results are determined by symbolic function.
4. Algorithm Verification
In order to verify the effectiveness of the proposed method, the general dataset [
29] is applied to investigate the classification performance. Here, we select Thyoid, Ionosphere, Image and German datasets. The performance comparison between the adopted method and the traditional classification methods, as well as the bagging and boosting ensemble algorithms, are investigated.
In reference [
27], the paper selects 40 base classifiers and constructs the base classifiers based on the proposed method, bagging and boosting, respectively. Samples are resampled in the first layer five times. On this basis, the feature selection is carried out twice for each subset at the proportion of 80%. We obtained 10 training sets, SVM, KNN, BN and BPNN were adopted, and 40 base classifiers were obtained. Finally, the majority voting method was used to get the final classification results.
Firstly, the convergence performance of SQGA was investigated. The parameters of each base classifier were arbitrarily set, as the learning ability of the selected learning machine is strong. In the SQGA optimization algorithm, the number of populations was set to 50 and iterations set to 100. The experimental results are shown in
Figure 5.
From
Figure 5, we can see that, at the beginning, the classification accuracy of each dataset is relatively high. This shows that the ensemble learning algorithm can achieve better learning results, and the whole algorithm is stable. On different datasets, the algorithm converges rapidly, which shows that the convergence of the SQGA algorithm is better, and each algorithm is finally stable at a relatively high classification accuracy.
In order to verify the SQGA’s advantages of convergence, the QGA, genetic algorithm (GA) [
30] and self-adaptive genetic algorithm (SAGA) [
31,
32] were selected for comparison. The Image dataset was picked for testing, and the convergence curves are shown in
Figure 5.
From
Figure 6, we can find that: SQGA converges in 20 generations, accuracy is 99.2, GA converges in the 52th generation, and accuracy is 98.8. Compared with the other three methods, SQGA has the characteristics of fast convergence and good search results.
Next, we compared the results of the proposed method with other single classification methods. The single classifier adopts the base classifier method in this paper: SVM, KNN, BN and BPNN. Both SVM and BPNN select Gaussian function as kernel function and activation function, and the parameters of each learner were determined by the 5-fold cross-validation and grid search methods. The classification results are given in
Table 1.
From the experimental results, we can see that the classification accuracy of KNN is basically the lowest. Compared with other learning methods, the KNN algorithm is simple and efficient but it extracts the least classification information. SVM, BN and BPNN achieve similar classification results. These three methods use different learning mechanisms to learn samples from different angles, and they can better deal with nonlinear classification problems. The proposed method can achieve optimal classification accuracy, which is because the errors and omissions of some individual classifiers can be compensated by other individual classifiers through the ensemble of each classifier. This ensemble learning method can further improve the generalization ability of the overall classification.
Then, we analyzed the performance between the proposed method and the traditional ensemble learning algorithm. The traditional ensemble algorithm selects the classical bagging and boosting algorithms, and the number of base classifiers was 40. The differences between base classifiers can reflect the effect of ensemble learning. Reference [
33] gives the definition of difference degree: the calculation formula of the difference degree of
T base classifiers on
N samples is as follows:
where
is the prediction label of the
-th individual classifier on sample
, and
is the prediction result after integrating all individual classifiers. The difference threshold is not less than 80% of the difference degree of the previous individual SVM classifiers. The larger the difference degree is, the smaller the correlation between the base classifiers is, and the final integration effect will be better. We calculated the average difference of the three ensemble algorithms on different datasets, and the results are shown in
Table 2.
As can be seen from
Table 2, the difference degree of the bagging and boosting integration methods is not particularly large. In comparison, the average difference degree of the proposed method is significantly higher than that of the previous two methods. This is because the method in this paper uses heterogeneous integration. Next, we compared the classification accuracy of several ensemble algorithms to investigate their generalization performance. Here, we focused on the SQGA optimization and decision fusion results only by voting.
Table 3 shows the classification accuracy of the four methods:
From the experimental results, we can see that the classification accuracy of ensemble algorithms is improved. The classification accuracy of voting fusion is higher than traditional bagging and boosting, due to the increased differences between base classifiers. Compared with the simple voting method, the SQGA optimization method can obtain the highest classification accuracy, which shows that the method in this paper can further improve the performance of ensemble learning. This also lays a foundation for its application in fatigue detection.
5. The Application in Fatigue Detection
The above experiments verify that the SQGA optimized ensemble learning algorithm proposed in this paper can obtain better accuracy in dealing with the binary classification problem. In this section, the algorithm is applied to real fatigue detection.
The
Figure 7 gives the flow chart of fatigue detection. The whole process is mainly divided into four stages: MFCC extraction, training dataset acquisition, ensemble learning to establish the detection model and detection stage.
MFCC extraction stage: collect the voice of controllers and extract the speech by MFCC.
Training dataset acquisition: label the MFCC processed information according to the controller’s own feelings and obtain the original training dataset.
Ensemble learning stage: use the ensemble learning method proposed in
Section 3 for establishing the detection model.
Detection stage: Collect real-time voice data from the controller and extract it by MFCC. Input the processed data into the detection model, which then judges the controller’s fatigue state.
The voice data from land–air communication used in this paper comes from a front-line control unit in China, including the voice data from the unit’s tower, approach and controllers of regional control positions. The date of voice data recordings is from 3–7 April 2022 and from 16–21 April 2022, from 2:00 to 24:00 every day. According to the structural characteristics of land–air communication, the voice data from the controller in the land–air communication data was intercepted. Then, the corresponding MFCC was obtained by speech preprocessing technology. The fatigue state of voices and the relevant information corresponding to the controllers are marked according to the controllers’ own feelings.
The original dataset includes 158,620 samples. The ratio of normal samples and fatigue samples is about 10:1. In this experiment, the training samples were selected according to the ratio of 10:1. A total of 5000 normal samples and 500 fatigue samples were randomly selected from the training set. The test samples consisted of 1000 normal samples and 200 fatigue samples. The detection experiments were carried out based on the single machine learning method (SVM is selected here), ensembled learning algorithms, bagging and boosting and the method in this paper. The base classifiers ensembled by bagging and boosting algorithms are SVM. The false positive rate, false negative rate and detection accuracy of the whole body were compared.
Table 4 shows the test results:
From the detection results obtained in the above table, it can be seen that the false positive rate and false negative rate of fatigue detection with the SVM algorithm are higher than those of the ensembled algorithm. We can also see the advantages of ensemble learning. Among the three ensemble algorithms, the proposed algorithm can achieve the best detection effect, which is consistent with the experimental results obtained on the UCI dataset. By increasing the differences between base classifiers, the generalization performance of the algorithm is improved. The training time of SVM is 3.2 s, and the grid search to find the optimal parameters costs a lot of time. Ensemble learning methods are not sensitive to parameters and can greatly reduce computational complexity. For the testing time, as the single SVM obtains the simplest model, it only cost 0.13 s, while the proposed method cost 0.36 s. This is also good proof of the “no free lunch” theory. Nevertheless, we still feel that the cost is acceptable.
Next, we analyzed the performance of the detection algorithm from the receiver operation characteristic curve (ROC) [
34]. The ROC curve is used to judge whether the detection model is good or bad, mainly from the curve shape and AUC (area under the curve). If the curve is closer to the upper left corner, the better the detection effect is. On the contrary, it means that the detection effect of the model is worse. AUC refers to the area under the ROC curve, which can reflect the diagnostic value of the detection model. The closer the AUC value is to 1, the better the performance of the model is.
Figure 6 shows the ROC curves of several algorithms.
From
Figure 8, we can see that, on the whole, the ROC curves of the previous algorithms are more inclined to the upper left corner, indicating that they are better detectors. Among them, the algorithm proposed in this paper has the best bias, which is obviously better than other detection methods. In terms of AUC, the offline area of this method is larger, reaching 0.992, which is higher than the other three methods. In conclusion, the advantages of the proposed method can be seen from the ROC curve.
In the detection method proposed in this paper, there is a certain randomness in the construction of base classifiers and the optimization of weights. In order to verify the stability of the algorithm, we used SQGA to do 50 Monte Carlo simulation experiments and analyzed the experimental results with a box diagram. In the same way, we made a box diagram for bagging, boosting and vote, respectively. We counted the Monte Carlo simulation experiments’ false positive rates, false negative rates and detection accuracy of these methods, respectively. The experimental results are shown in
Figure 9,
Figure 10 and
Figure 11.
The horizontal line in the box diagram represents the statistical median, the height of the box represents the distribution interval, and ‘+’ stands for abnormal value in different methods. From the experimental results, we can clearly see that the height of the proposed method box is the lowest among the three statistics, which shows that the method proposed in this paper is very stable. Compared with bagging and boosting, the vote method can also achieve better stability, which also reflects that the heterogeneous integration method in this paper can increase the diversity of base classifiers. The experimental results show that the SQGA can not only obtain good search results (minimum false positive rate, false negative rate and maximum detection accuracy) but also has good convergence characteristics and minimal outliers.
In reality, there may be more fatigue happening during some periods and less during other periods. Corresponding to the dataset, it shows the proportion of normal samples and fatigue samples. This also poses some challenges to the training data collection process. In theory, the larger the dataset, the better the detection effect of the model. However, it is also possible that in the early detection stage, the number of fatigue events collected is relatively small. In this case, can this detection model perform well? Here, we investigate the detection effects of various detection models under different fatigue intensities (the ratio of fatigue samples to normal samples). The values of 5%, 10%, 15% and 20% are used to simulate the samples under different fatigue intensities, and the detection model is trained with these four fatigue samples. The detection accuracy under different learning modes is shown in
Figure 12.
It can be seen from
Figure 10 that under different fatigue intensities, the training detection model can detect fatigue events better. The detection accuracy of SVM is 92.5% when there are fewer fatigue samples (fatigue intensity is 5%) and the miss detection rate is relatively high. This is mainly due to the imbalance of samples, which makes the classification plane of SVM shift. The imbalance of samples affects the effect of machine learning. Compared with other algorithms, the detection accuracy of this method can be maintained at a relatively high level (the lowest is 98.6%), which shows that the proposed algorithm is stable and can also obtain better detection results in the case of unbalanced samples.
6. Discussion
In this paper, speech-based fatigue-state detection is proposed. Compared to other objective detection methods using auxiliary tools, the speech-based method is more applicable due to its convenient collection method.
The speech signal is extracted by MFCC. On this basis, fatigue is detected by the ensemble learning method. The experiment result shows that the method proposed in this paper can detect fatigue of ATC effectively. Because the idea of ensemble learning is adopted, the disadvantage of a single learning machine is overcome. The following stability analysis and asymmetric training set experiments prove the superiority of the method. However, due to the multiple base classifiers, establishing the complexity of computation in the training process is increased. Overall, the experiment results verify that the proposed method can accurately monitor the fatigue state of controllers and realizes the original intention of the method design.
The data used in the experiment is from only one control unit. To improve the generalization of the detection model, more data needs to be collected. Anyway, for the future, we are ready to further explore the methods of speech signal extraction, hoping to find better features and improve detection accuracy.
7. Conclusions
In order to improve the practicability of the controller’s fatigue state detection, the paper detects the controller’s fatigue state through the controller’s radiotelephony communications voice. ATC fatigue detection is a typical binary classification problem, and the detection accuracy of a single learning machine is not high, so we adopted the heterogeneous ensemble learning method. By increasing the differences between the training set and the training method in base classifiers, the overall integration effect was improved. At the same time, in order to further improve the detection accuracy, we improved the result of the fusion part of ensemble learning. This was achieved through SQGA algorithm optimization, to find the best base classifier weights, and through the weighting to get the final demerit detection. The experimental results show that the proposed method is stable and accurate. Therefore, this method has a certain practical value in the practical application of ATC fatigue detection.


