1. Introduction
The use of radars in the automotive industry has gained momentum with time, leading to diverse implementations intended to increase safety and offer assistance in driving [
1,
2]. Vehicles made in the past decade most likely contain some use of radar, including vehicle detection, adaptive cruise control, and range-based collision alerts. Radar is one of the critical sensors for automotives, because it operates regardless of weather and light conditions, unlike optical systems. Furthermore, radar is less expensive than lidar systems.
Radar technology is advancing to improve self-driving vehicles’ safety features through accurate target detection and classification. Radar-based object detection and tracking were addressed in [
3,
4], especially for multiple target detection purposes. In [
5], the automotive use of radar systems for classification was discussed. In the paper, vehicles, clutter, roadside objects, and humans were classified through time-varying features in the range-Doppler diagram. Data from radar, as well as lidar, are considered together for better object detection through data fusion algorithms [
6]. In addition, an approach that employed both radar and a camera was studied to improve target detection accuracy [
7,
8]. However, further improvements to classification are needed when self-driving vehicles face unknown and nonvisual objects during a trip, using the material-based classification of sealed objects to decide whether a vehicle should avoid the object for the safety of passengers and other drivers. Knowing the composition of the sealed object can greatly increase safety by allowing the classification of contact with an unknown object as harmful. Generally, a self-driving vehicle will stop under such circumstances, but a sudden stop can endanger other vehicles. Even though the classification of concealed materials is impossible for human drivers or optical systems, electromagnetic waves have the ability to penetrate visually opaque objects such as a cardboard box and provide information pertaining to the materials inside the box.
Previous work has been done on material classification by incorporating comb-based millimeter-wave detectors, which focused on material and thickness classification that correlates with our classification for lighter and denser materials [
9]. Similarly, FMCW radars have been used to classify materials including carpet, tile, liquid, and laminate based on range cross-range images [
10]. There has also been prior work that concludes material classification based on unique power dissipation because of a material’s exclusive dielectric properties [
11]. Furthermore, radar systems have already been used in specific environments to classify objects that are not visible. Ground-penetrating radars have been used to detect land mines due to their ability to penetrate through the soil and concealed object classification has been used to detect hazardous material for security purposes [
12,
13]. Such uses are practical for radar, which can classify materials and substances without relying on visual indications. However, to the best of the authors’ knowledge, radar has not been attempted for the classification of sealed objects in automotive applications.
In this paper, we investigate the feasibility of classifying a sealed paper box through range profiles measured using an FMCW radar operating at 77 GHz. We use a range profile to differentiate between different materials by analyzing attenuation over distance as an incident wave propagates through the material. Similarly, this concept of range profile has been used in [
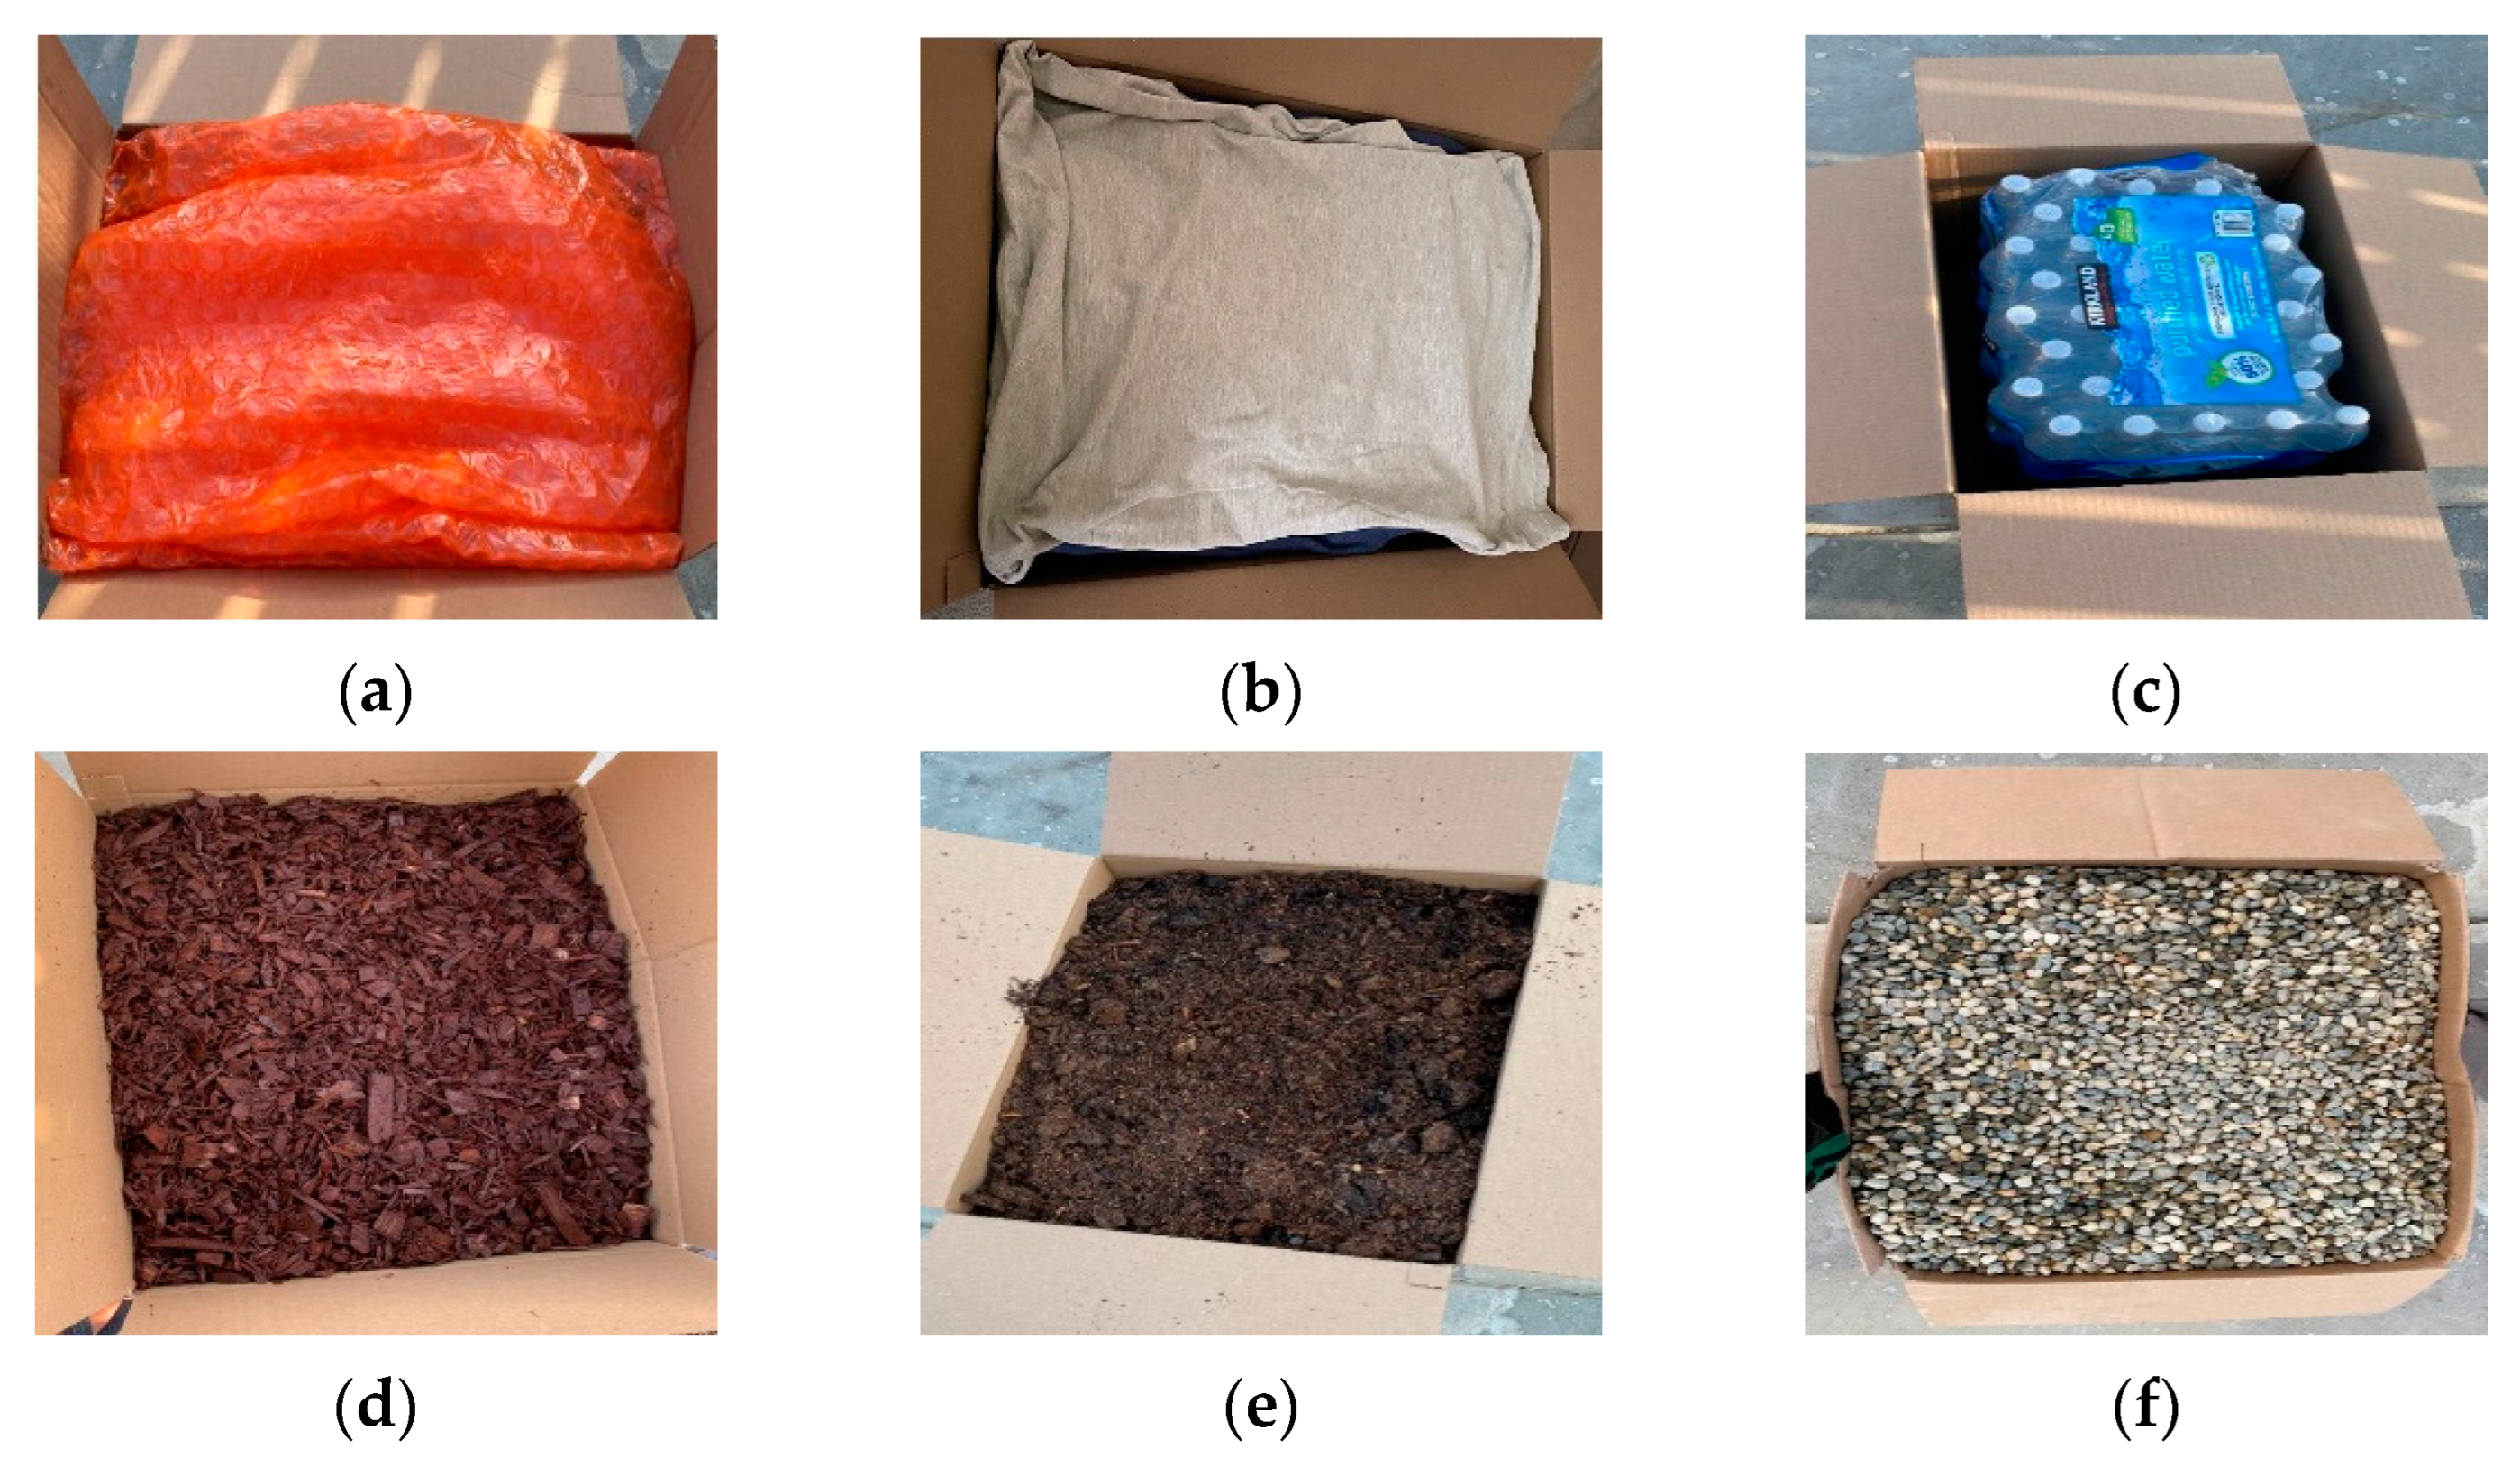
14] to determine a pipe wall’s thickness. This experiment is conducted using a 56 cm × 40.6 cm × 38.1 cm packaging box filled with five different quantities of paper, corresponding to the five stages. We use crumpled papers because it is convenient to control the paper density of the box. The range profile of each stage is unique in its dissipation of the incident wave. The range profile provides the reflected wave at the front and back ends of the box. The front provides the initial reflected wave, which is then compared with the second peak, the reflected wave at the back of the box. Depending on the material inside the box, attenuation differs. If a light, low-density material is enclosed in the box, the attenuation between the two reflections at the front and back end of the box will be low, whereas a dense or heavy material that has generally high permittivity or high conductivity produces larger attenuation over the same distance. Accordingly, we use a range profile to classify the box with a material that is to be avoided. A theoretical approach is also conducted to further verify the obtained measurement results. Plane-wave propagation/reflection provides a theoretical background for later comparison with measurements made using the FMCW radar. After checking the feasibility of classifying different densities of the papers, we also investigate other materials: bubble wrap, clothes, water bottles, garden soil, mulch, and granite pebbles. The range profiles of these different materials are analyzed to further investigate the feasibility of determining the potentially dangerous materials on the road.
This paper is organized as follows:
Section 2 defines the theoretical approach, focusing on deriving the equations for reflections in the front and back ends of the box.
Section 3 compares measurements obtained from the radar measurements with calculations made using the theoretical approach.
Section 4 focuses on other materials, and
Section 5 provides a discussion.
Section 6 offers our conclusion.
2. Theoretical Approach
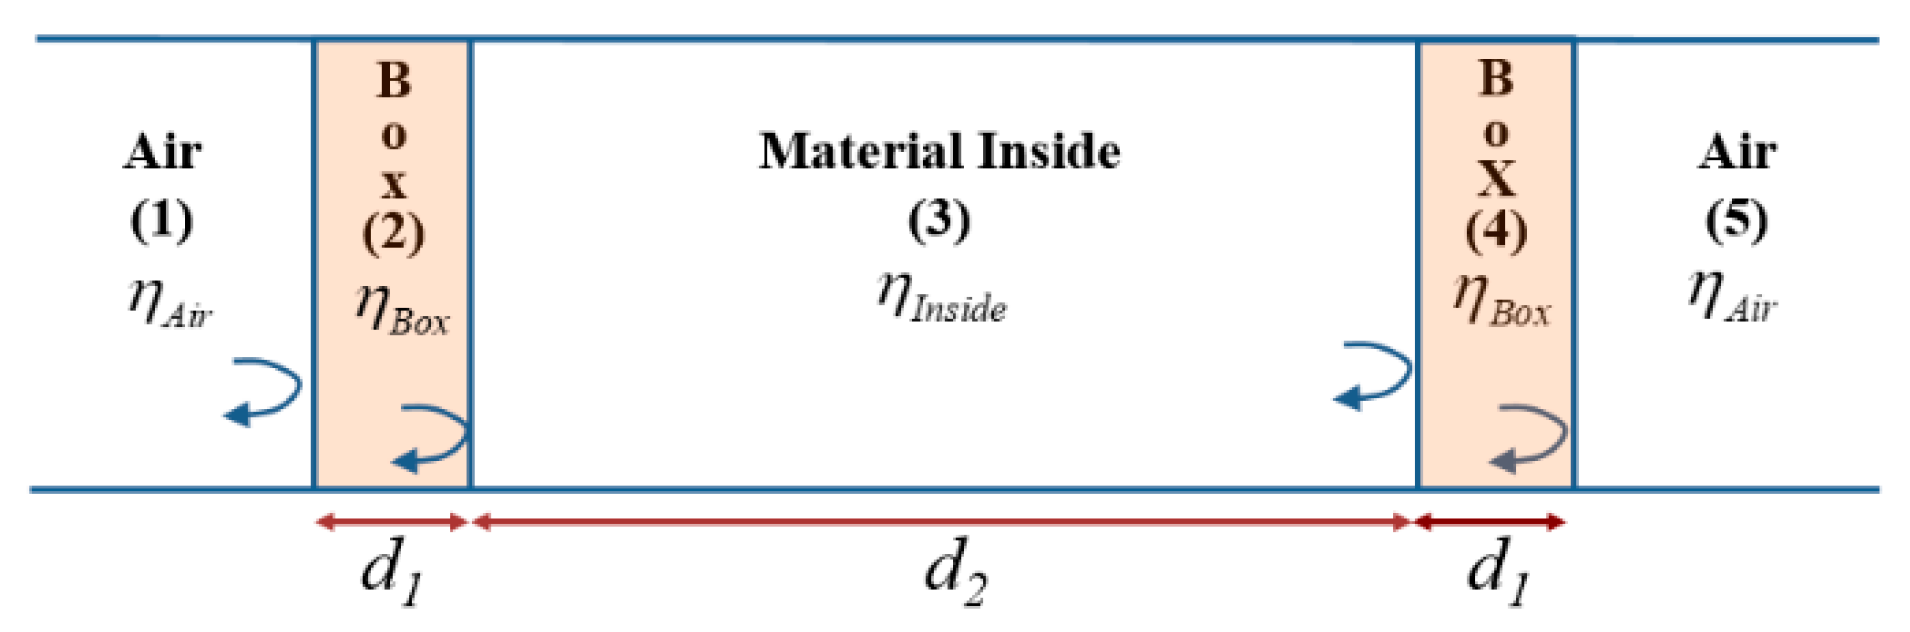
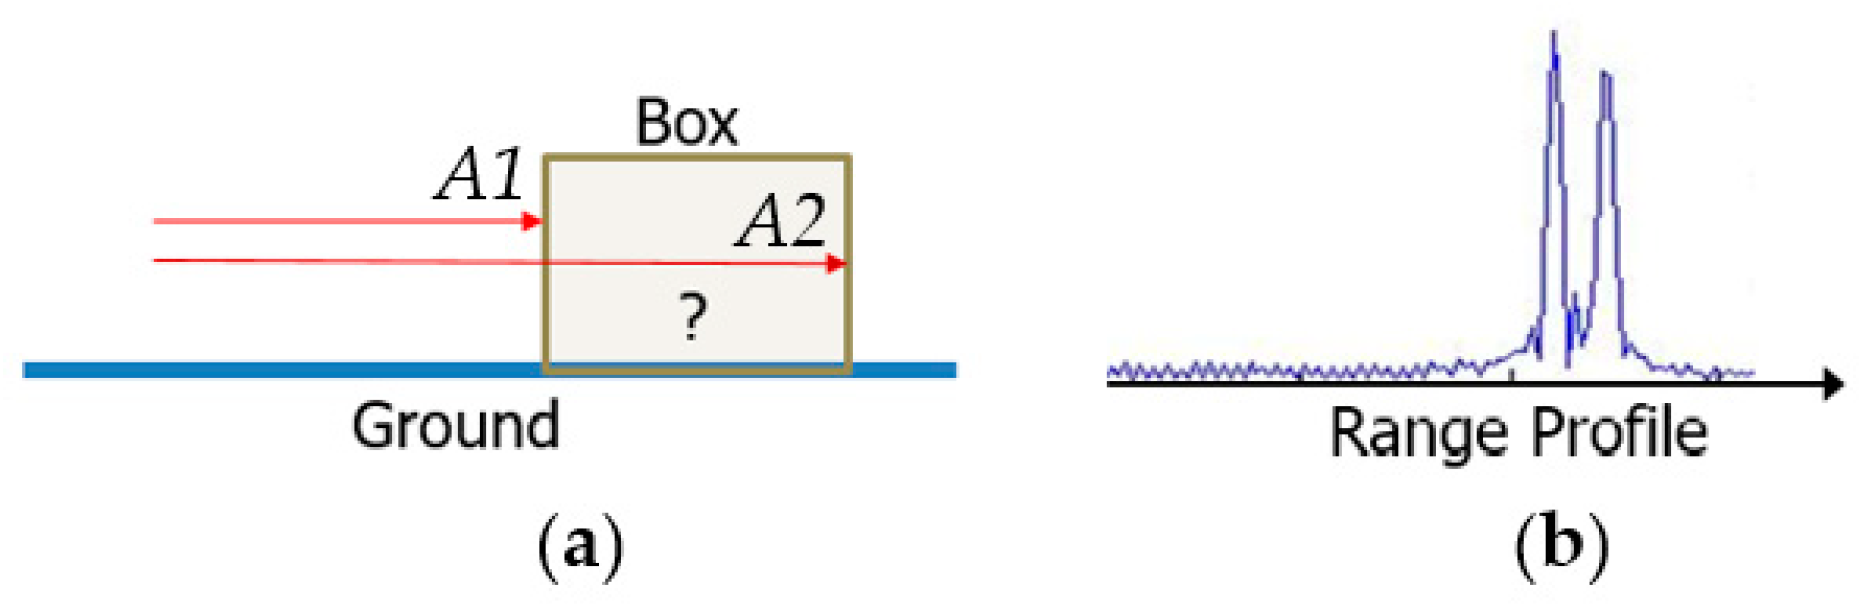
To investigate the feasibility of estimating material density inside a cardboard box for the purposes of automobile safety, we use crumpled paper, whose density can easily be controlled by using different numbers of sheets. In addition, we can simulate light materials to heavy materials depending on the quantity of paper. We assume that randomly accumulated papers are uniformly distributed in the box. It is necessary to analyze the radar returns theoretically to later verify measurement results by calculating the magnitude of reflections from the sealed box. When the electromagnetic wave from the radar impinges the box located on the road, it is expected that the major reflections will occur in two boundaries, (i) from air to box and (ii) from box to air, as noted in
Figure 1a. These reflections produce two corresponding peaks in the range profile, as demonstrated in
Figure 1b. Even though there are multiple peaks from multiple reflections, two peaks are dominantly observed in the range profile because other echoes from multiple reflections experience severe attenuation due to a long pathway. To calculate the magnitudes of the peaks,
A1 and
A2, that are related to the material characteristics inside, we used a five-layer model consisting of air, cardboard box, enclosed material, cardboard box, and air. The problem setup is demonstrated in
Figure 2.
For the theoretic estimation of the magnitudes of
A1 and
A2, the reflection coefficient and the transmission coefficient should be calculated at each boundary. The reflection coefficients are found using the intrinsic impedance values that are the respective values for permeability and permittivity.
where
is intrinsic impedance,
is the reflection coefficient between the
Mth and
Nth layers, and
is the transmission coefficient between the
Mth and
Nth layers. The electromagnetic characteristics of the material, the permittivity, and the permeability of five layers are required to calculate wave impedance, the propagation constant, and the attenuation constant. Because the materials considered are nonmagnetic, the relative permeability is set to 1 for all layers. The relative permittivity of the cardboard box was found to be 1.78 [
15]. The dielectric constant of paper can range from 1.7 to 4.0 depending on the manufacturing characteristics, humidity, and paper composition [
16]. In this study, the permittivity values were unique in each case because of the different densities of paper at each stage. The dielectric constant for the last stage, the densest, was found by calculating a value that provided high attenuation, resulting in a negligible magnitude for the second reflection. The last stage, which had the most paper, dissipated the most energy from the incident wave. The
values for the first four stages were calculated under the assumption that they are linearly proportional to the paper quantity per stage, referring to stage five. Besides, the cardboard and paper exhibited conductivity, producing complex permittivity.
The complex component
ε″ can be found using the operating frequency of the radar and the electric conductivity of the material. The cardboard and printer paper are both made of wood, whose conductivity varies from 10
−4 to 10
−3 (S/m) depending on humidity and the manufacturing of the material [
17]. The electric conductivity value of 10
−3 was used for the cardboard box. The conductivity value of
σ = 0.000468 (S/m) was chosen for the last stage. For other stages, it was assumed that the number of papers inside the box per stage was linearly proportional to conductivity.
Table 1 shows paper quantity, dielectric constant, and conductivity values per stage used in the simulation.
Materials with
will dissipate energy when the wave propagates. Each of the five stages contains a different amount of paper or quantity of lossy material inside the box, for a unique amount of energy dissipation at each stage. For low-lossy material, the propagation constant,
β, and the attenuation constant,
α, are found using the Binomial expansion:
As we have all the material parameters, we can calculate the magnitude of two peaks. The magnitude of the first peak,
A1, is calculated by summing the two echoes. The first echo is from the boundary between air (1) and the cardboard box (2), and the second echo is from the boundary between the cardboard box (2) and the material inside (3). These two echoes overlap in the range profile because the thickness of the cardboard box (1 cm) is less than the range resolution (5.02 cm) of the radar. It should be noted that the phase delay and attenuation factor are considered in the equation:
where
M is the magnitude of the incident wave,
d1 is the thickness of the box, and
d2 is the length of the box inside. The magnitude,
A2, of the second peak in the range profile comes from the third boundary between the material inside (3) and the cardboard box (4), as well as the fourth boundary between the cardboard box (4) and air (5). Again, because the thickness of the cardboard is less than the range resolution of the radar, we observe only one peak from the two reflections.
A2 can be calculated as:
where the subscript of m means the material inside. It is expected that the difference between
A1 and
A2 comes mainly from the attenuation in the material, as the reflection coefficient between air and box is small.
Based on the material properties at each stage and the physical size of the cardboard box, the magnitudes of the two peaks are calculated. The results for attenuation per stage, the ratio between the second peak and the first peak, were obtained, as shown in
Table 2. It is observed that the higher conductance results in a higher attenuation constant. These ratios of attenuation are compared with the measurement results in the next section.
3. Measurements and Results
To obtain the measured range profile, a millimeter-wave FMCW radar made by TI Co., Ltd. was used. An FMCW radar is an ideal choice for short and medium-range applications, being low-cost and easy to use. The AWR1243 radar we used operates at 77 GHz. For our case, the most important factor was range resolution, which is affected by the bandwidth swept by the chirp and the sampling rate. A better range resolution can differentiate between two targets at a smaller distance but also shortens the range in view for the radar because of the limited sampling rate. A range resolution of 5.02 cm and a range of 6.4 m were obtained using the following parameters: operating frequency of 77 GHz, bandwidth swept by 2987 MHz, A/D sampling rate of 3 MHz, chirp rate of 70.006 MHz/s, 128 chirps per frame, and 24 frames per burst.
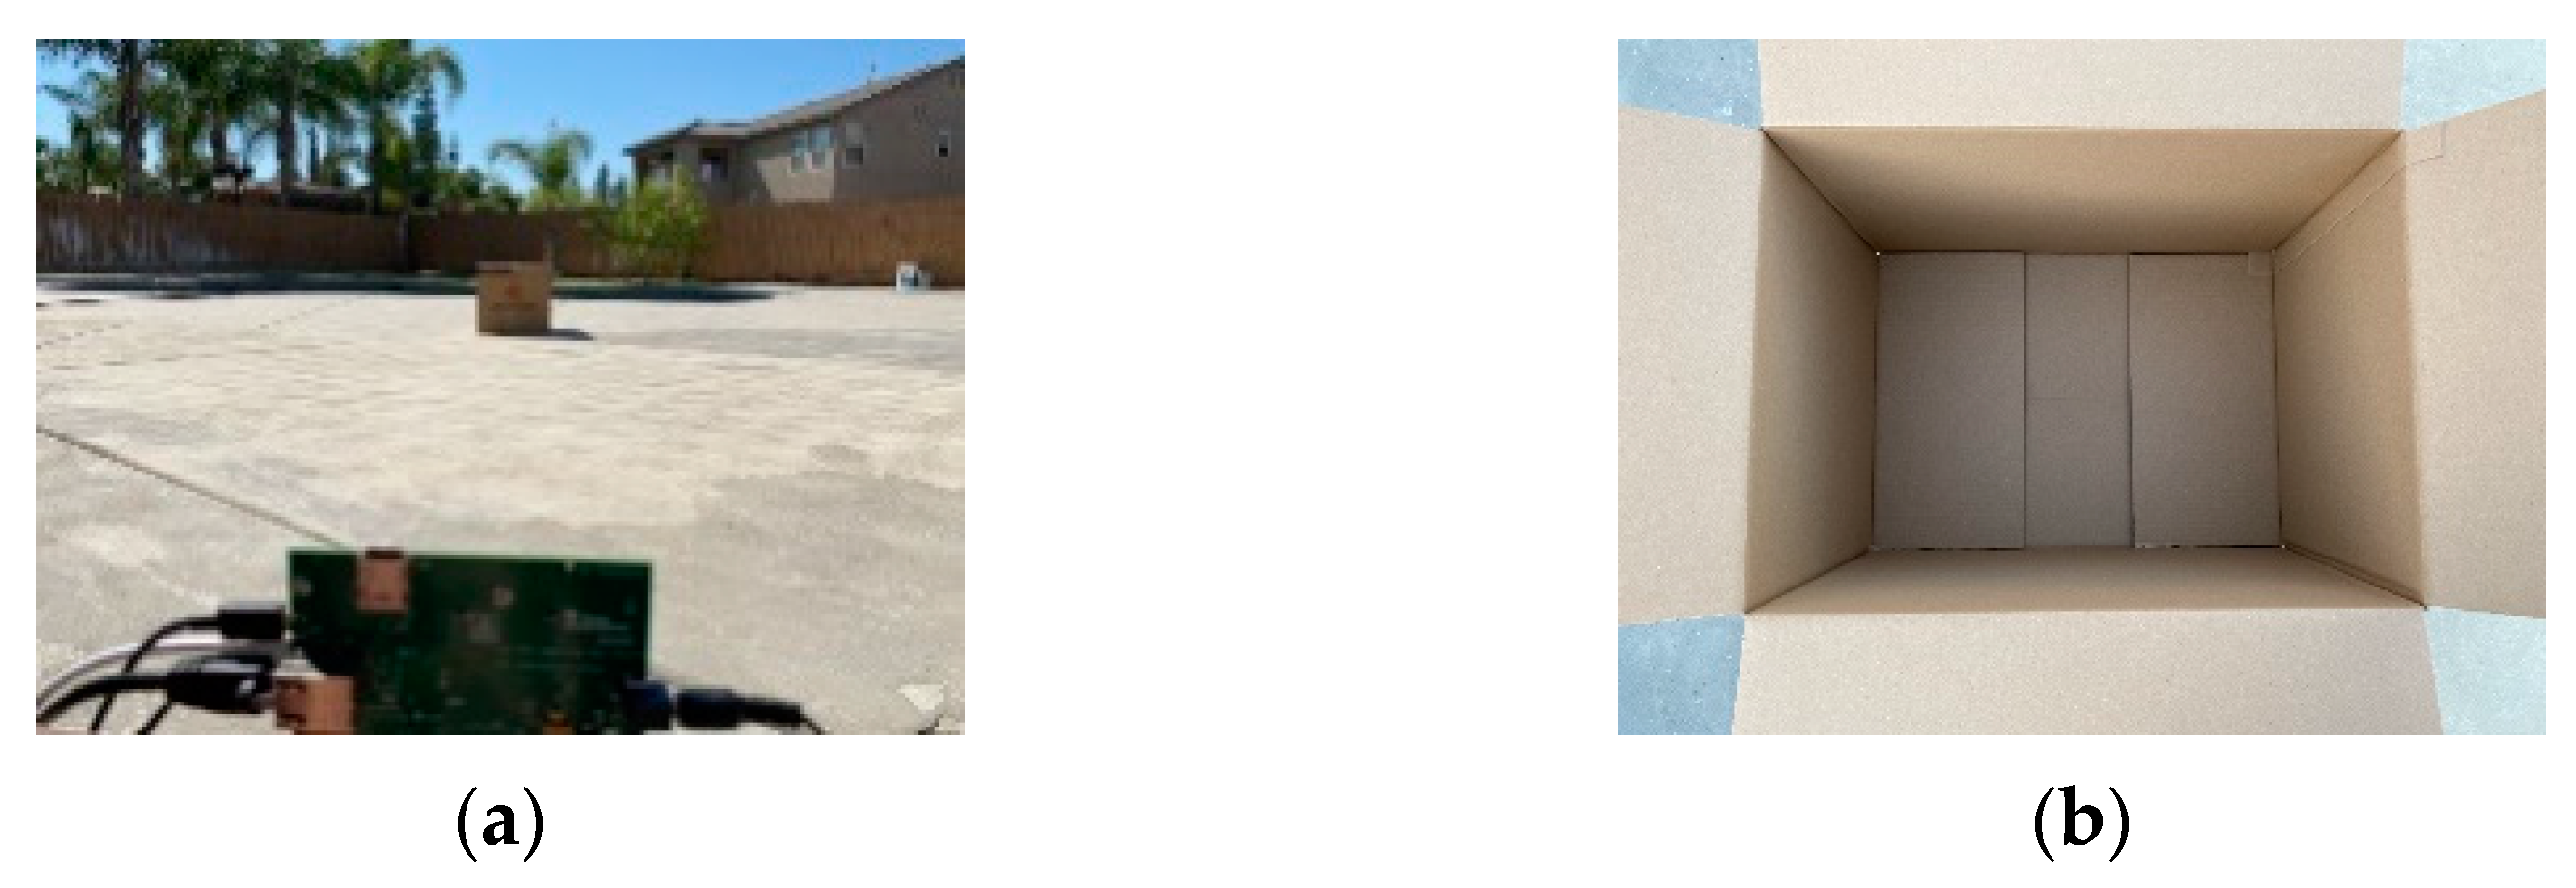
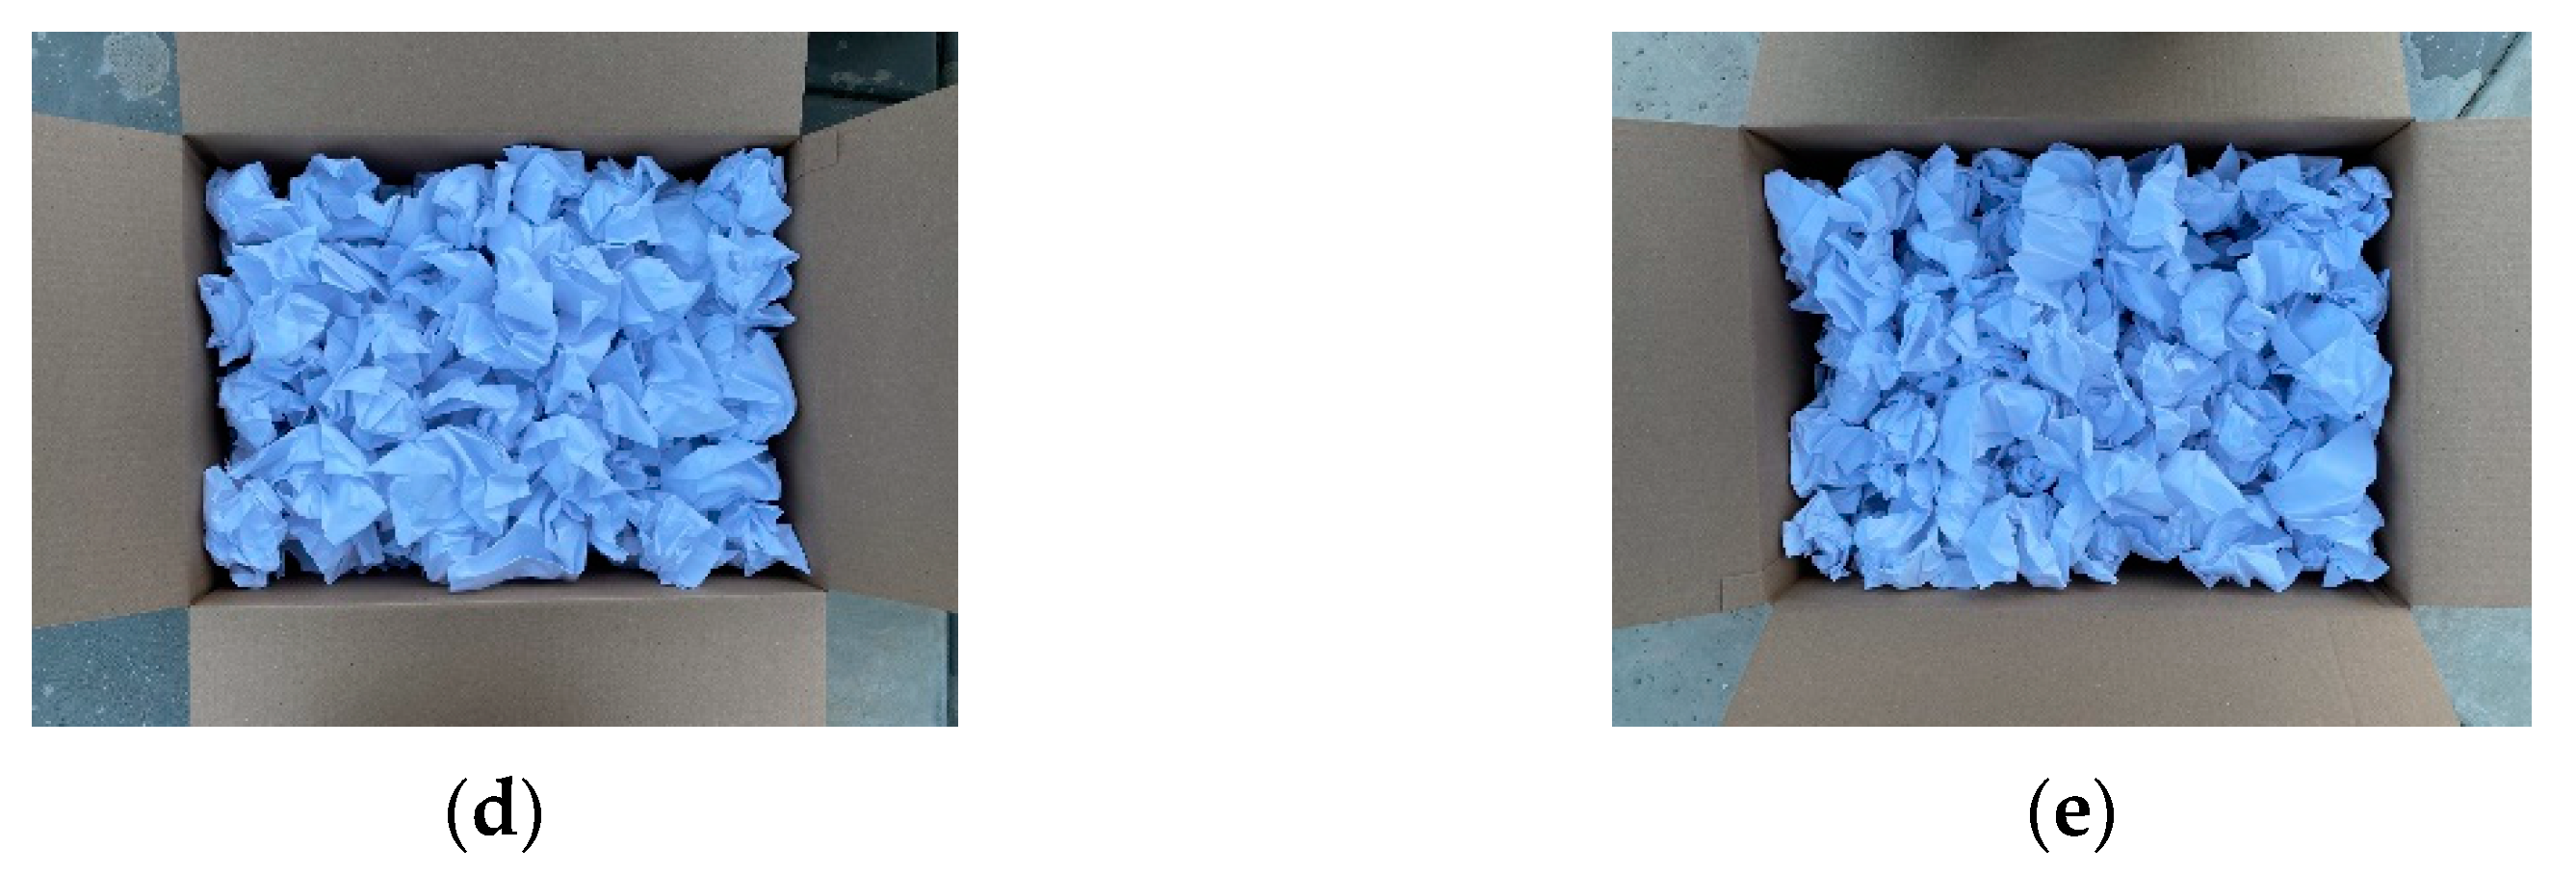
The five different stages of enclosed printer paper quantity are shown in
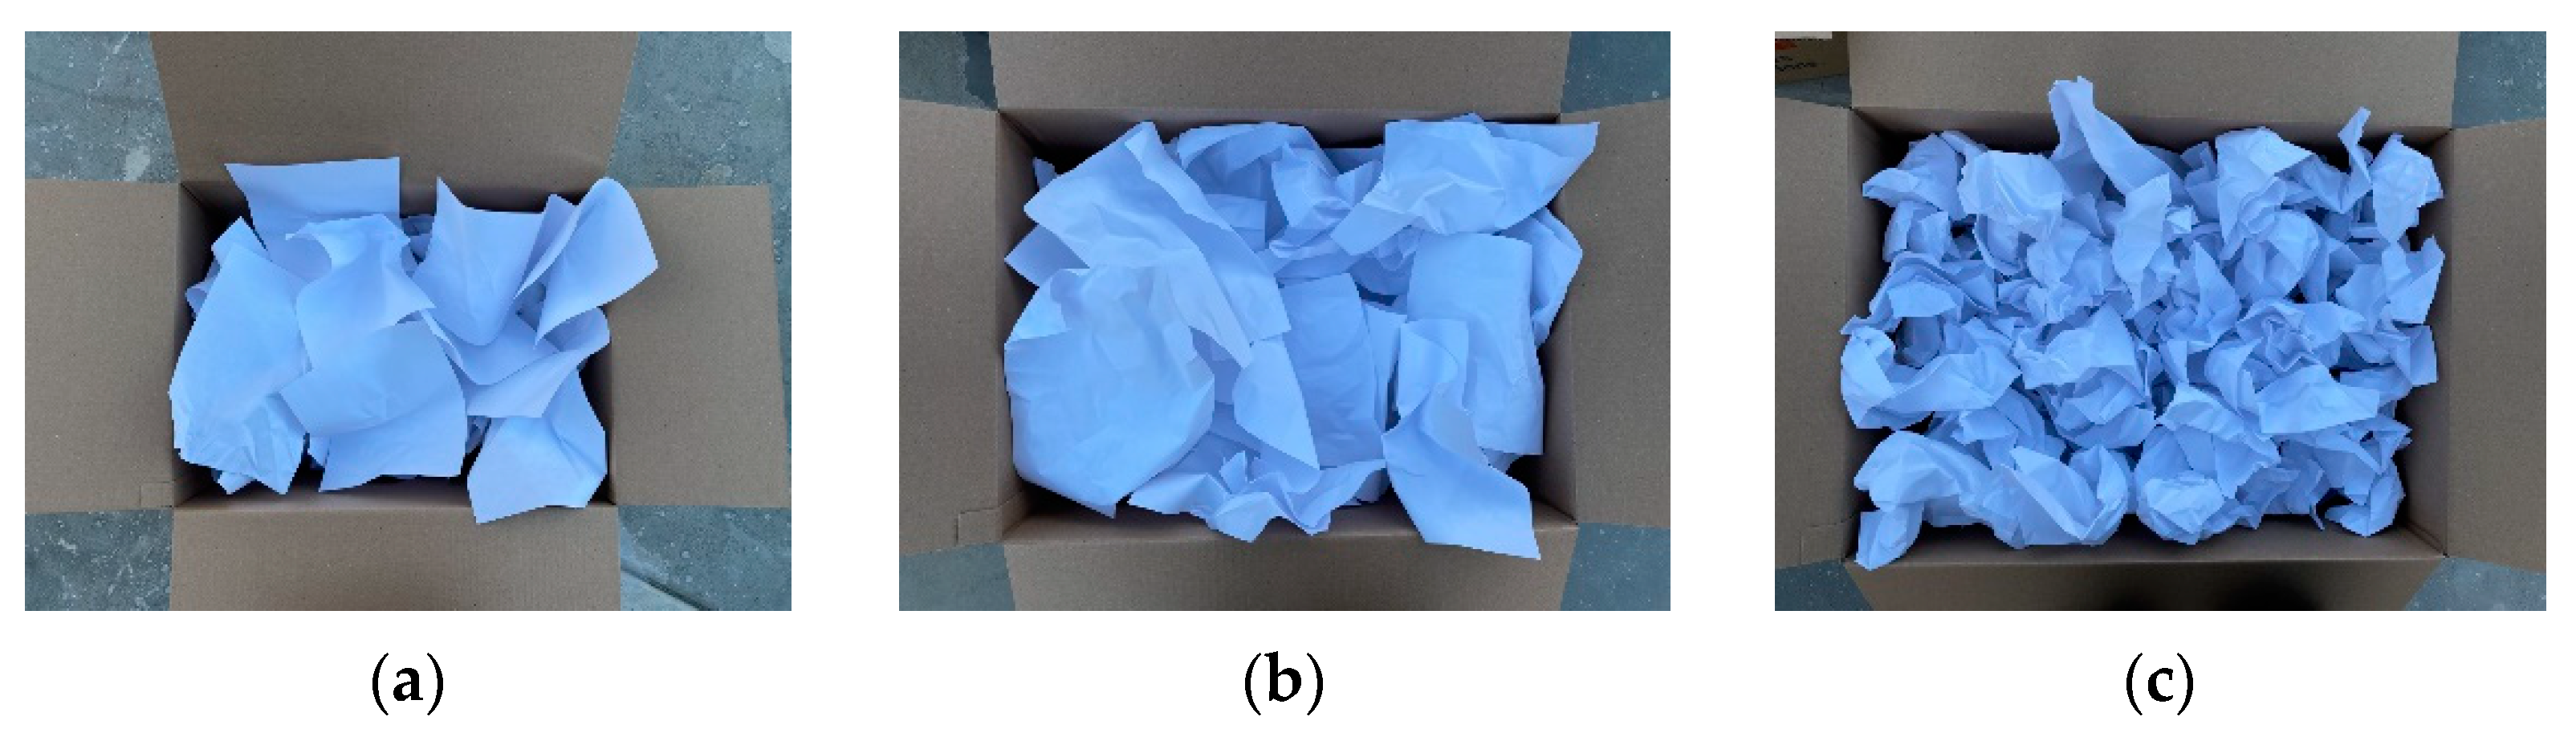
Table 1. For each stage, the target box was placed at the same spot to avoid any discrepancies from changing the target location and orientation. The target box’s front end was 3 m from the radar for each stage. The distance between the two ends of the box, 56 cm, was confirmed by the distance between the two peaks in the range profile. Each stage of the box was entirely filled with crumpled paper. The increasing density of paper per stage was achieved by crumpling the papers into smaller wads.
Figure 3 shows the placement of the box in front of the radar, and
Figure 4 shows a top view of the five different stages of paper density.
After the target box was placed, the mmWave Studio provided by TI Co. Ltd (Dallas, TX, USA). was used to input the discussed parameters to obtain the radar data. As all data were captured for every stage, the data were then processed in MATLAB to obtain each range profile. Zero-padding was used in the FFT process to obtain a detailed range profile. The resulting plot formulates the two peaks of reflection magnitudes required to obtain an attenuation ratio, which is obtained by comparing the magnitudes of the two peaks. The magnitude of the first peak is roughly in the same range for all stages, but we are only focusing on the attenuation for the two peaks because the second peak will be affected by the paper density of the box.
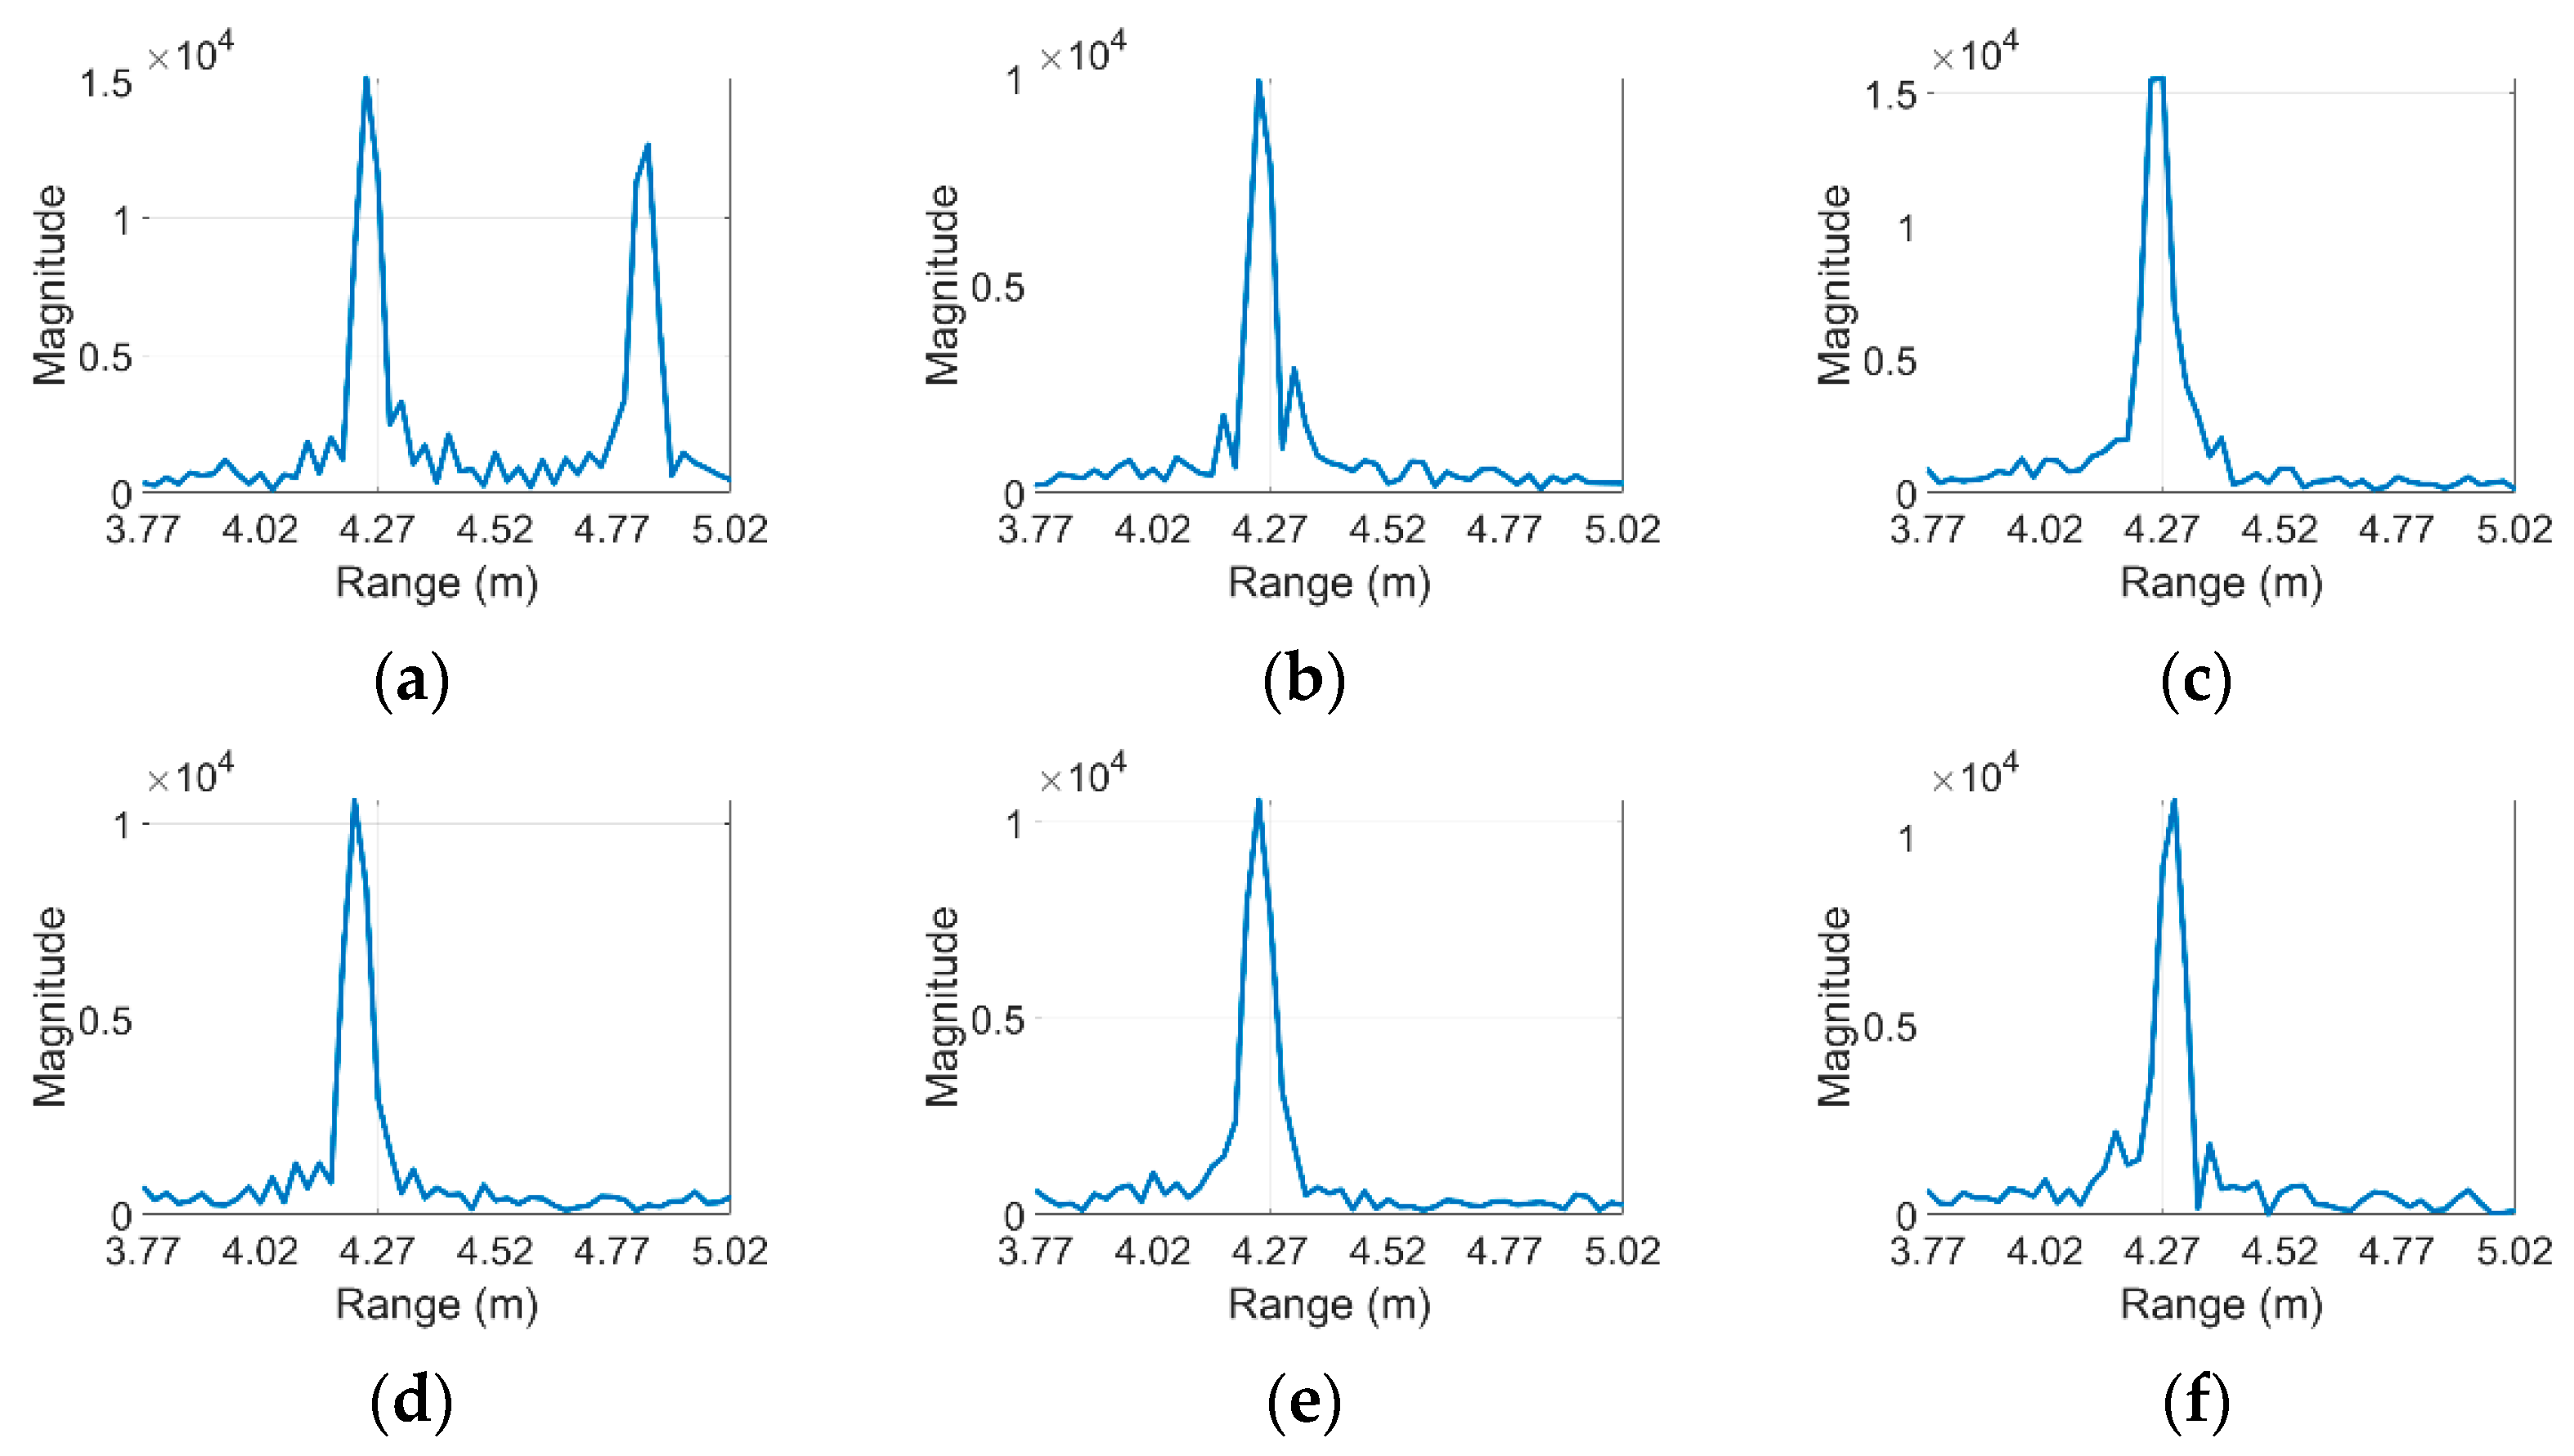
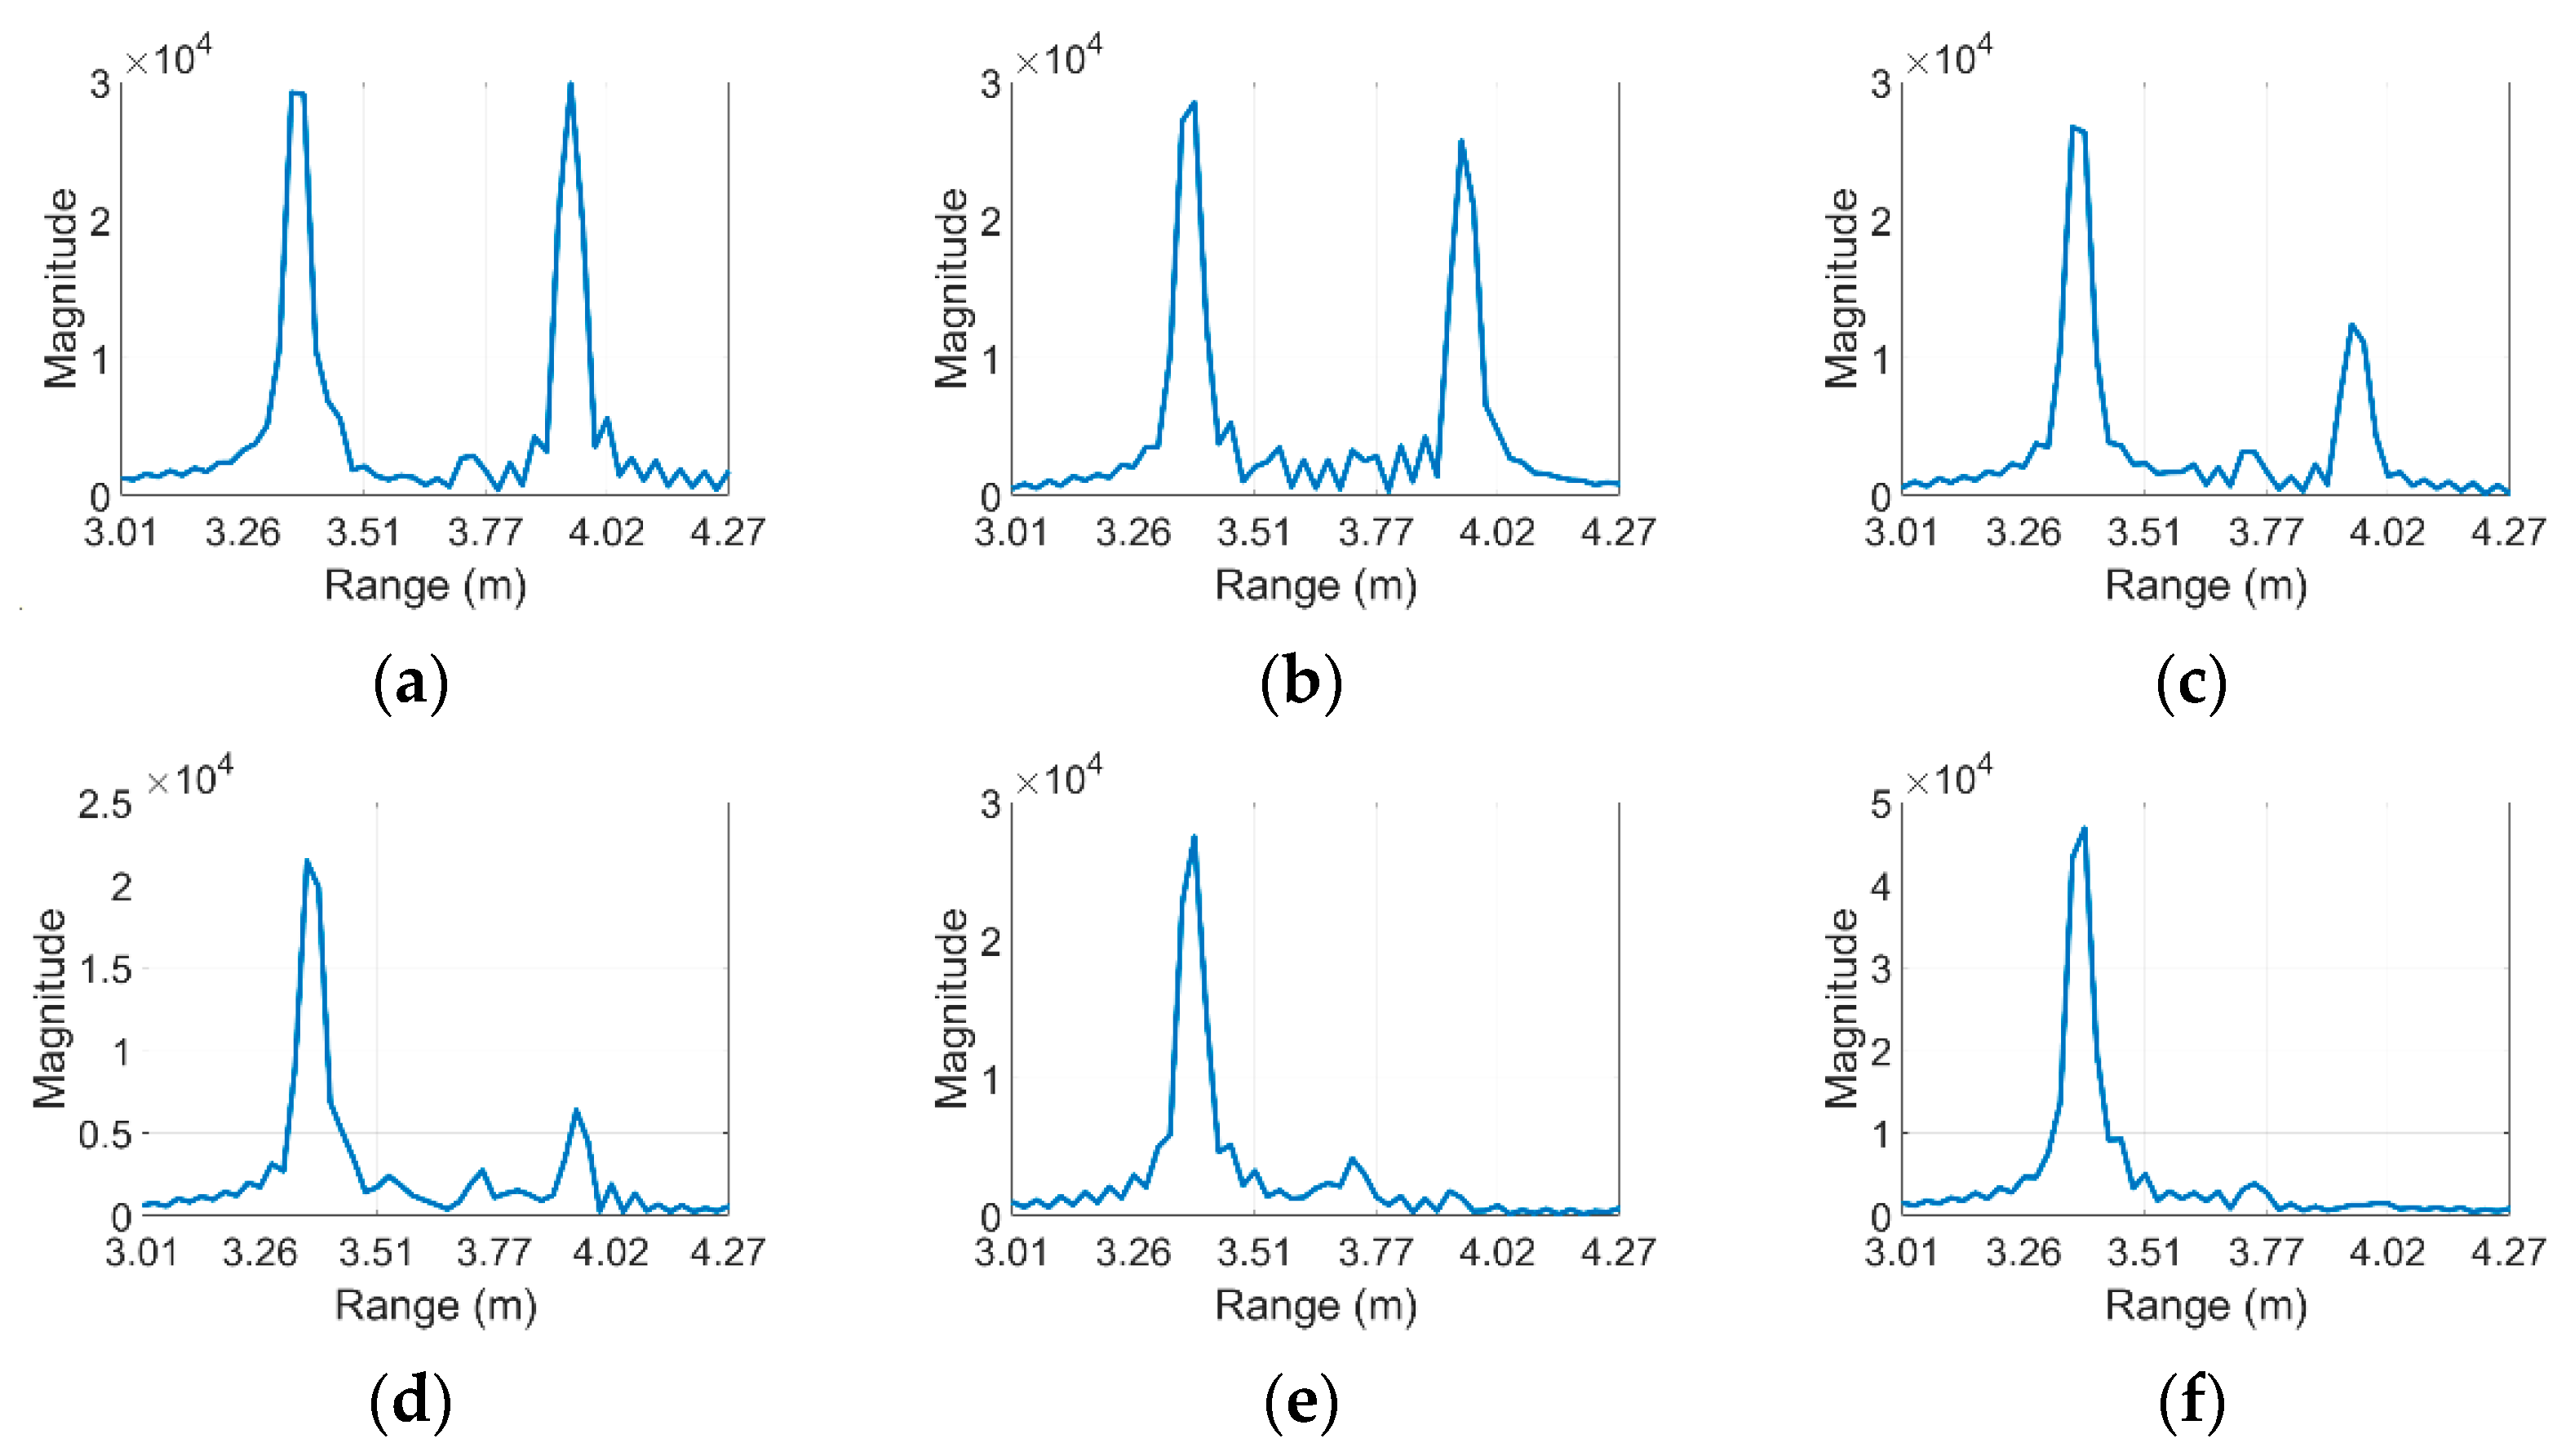
Figure 5 presents the results obtained for the empty box as well as the five stages.
The empty stage, presented in
Figure 5a, shows both reflection magnitudes roughly equal to each other because the attenuation of the electromagnetic wave inside the box is negligible. The only effect of power dissipation occurs from the two thin layers of the cardboard box, which introduce complex permittivity. Each of the following five stages shows power dissipation with increased paper quantity. Stage V was packed with the highest amount of paper for almost 100% power dissipation, with the second peak absent.
Table 2 shows the attenuation ratio between the two peaks for every stage. It is noted that adding permittivity in between shifts the second peak due to the different propagation time delay. However, the amount is so small that we could not observe it in our experiments.
The results obtained for measurements and calculations were close for most stages. Differences in attenuation might result from the general makeup of the material, including factors relating to humidity and the specific species of wood used, which produce unique degrees of permittivity and conductivity. However, both datasets agree in demonstrating the concept of material classification based on power dissipation as a result of the material makeup, with similar trends in attenuation.
5. Discussion
There are a few limitations to be addressed when the suggested method is applied in realistic scenarios. For the measurements made during the five stages shown in
Table 2, we placed the box perpendicular to the radar’s boresight. However, it is also important to study measurement results when a box is placed at several different angles. We found that orientation changes of more than about 15 degrees lowered the magnitudes close to the noise levels in measurements as the RCS became small. Accordingly, the proposed concept is valid when the incident angle of the radar wave is near 90 degrees.
The use of this technique will be limited if the box is partially filled with materials. In principle, there will be two returns that arrive at the Rx of the radar; one that passes through the air and the other that passes through the material. If the time delay difference between the air and the material is not significant, the two returns will be co-located in the range profile, which makes it hard to discern them. In the range profile, the return that passes air will be dominant, as its amplitude is higher.
In addition, there are cases where the reflection from the box is not strongly related to the mass of the material, for example, an empty box covered by aluminum foil. While aluminum foils will produce a strong return, the mass is small. The suggested method may cause an erroneous decision as to whether or not to collide with an object.
It is also noted that scattering and penetration characteristics are a function of the carrier frequency. With the increase in frequency, the amount of penetration decreases while reflection/scattering becomes more significant. Therefore, the lower frequency is preferable in this scenario as the suggested approach uses the penetration characteristic.


