Article

Effects of Humic Acids on Size and Species Composition of Phytoplankton in a Eutrophic Temperate Estuary

1
Department of Environmental Engineering & Biotechnology, Mokpo National Maritime University, Mokpo 58628, Korea
2
Department of Chemistry, Kyungpook National University, Daegu 41566, Korea
*
Author to whom correspondence should be addressed.
Appl. Sci. 2022, 12(20), 10223; https://doi.org/10.3390/app122010223
Submission received: 31 August 2022 / Revised: 7 October 2022 / Accepted: 8 October 2022 / Published: 11 October 2022

Abstract

:
The Yeongsan River estuary was divided into freshwater and seawater zones by a sea dike constructed at its mouth in 1981. The freshwater zone, which flows through a metropolitan area, is eutrophic, causing frequent algal blooms with an expected increase in the concentration of refractory organic compounds such as humic substances (HS). Herein, the in situ freshwater zone phytoplankton community size and taxonomic composition were investigated in response to the addition of humic acids (HA) using seasonal mesocosm experiments. Phytoplankton (chlorophyll a) were fractionated into nano-(<20 µm) and net-size (>20 µm) classes and identified by species or genus. Their response to HA treatment was examined by repeated measures analysis of variance (RM-ANOVA). With the addition of HA, the concentrations of total and nanosized chlorophyll a increased significantly (p < 0.05), whereas that of net-sized chlorophyll a did not change significantly through the seasons. The abundance of Stephanodiscus sp. (diatoms) also increased significantly when this genus dominated the phytoplankton community. This suggests that the management of HS may be crucial in mitigating algal blooms in estuaries, such as in the Yeongsan River estuary, that are subjected to anthropogenic disturbances by engineered structures.

1. Introduction

Humic substances (HS) are complex mixtures of biogenic, heterogeneous, and refractory organic compounds with high molecular weights and yellow to black colors that have been extensively transformed after their production in terrestrial and aquatic environments [1]. HS can be categorized into humic acids (HA; insoluble below pH 2), fulvic acids (soluble at any pH), and humin (insoluble in water) based on their solubility. HS are a major component of material cycling in aquatic systems (especially freshwater) accounting for 50–80% of the dissolved organic matter (DOM) in freshwater [2].
Although HS have been characterized as compounds recalcitrant to microbial degradation, dissolved HS have been established to interact with freshwater microorganisms and affect microbial growth in freshwater and estuarine systems [3,4,5,6]. For instance, the biomass of heterotrophic bacteria incubated in a culture based on humic lake water was double that of bacteria incubated in clear lake water [7], and pelagic bacterial yield increased with increasing humic content [8], indicating that HS form an important carbon source for heterotrophic bacteria. However, the behavior or ecological effect of HS on pelagic microbes in estuaries, including phytoplankton, is not well understood owing to the chemical complexity of HS and the highly limited information available for these systems [9].
It has been reported that HS addition stimulated the growth of Pseudokirchneriella subcapitata in cultures owing to the supply of bioavailable Fe from HS [10]. This species is used as a phytoplankton test species in aquatic toxicity bioassays. Humic nitrogen (N) derived from Spartina has also been reported to be taken up by estuarine phytoplankton isolates in non-axenic and axenic cultures, suggesting that humic N is an important source for phytoplankton growth [11]. The cultures in the studies were designed to be limited by nutrients such as Fe or N. However, it has not been fully explored how phytoplankton communities above the species level, especially in eutrophic estuaries (in situ), respond to HS addition.
The Yeongsan River estuary, one of the five major river estuaries in South Korea, is located in the southwestern part of the country (34° N, 126° E; Figure 1). Temperate estuaries are affected by Asian monsoons that record high rainfall in summer but low rainfall in other seasons. A sea embankment was formed in 1981 at the river mouth, which physically divided the system into freshwater and seawater zones. In 2012, two weirs were constructed in the upper regions of the freshwater zone, and subsequently harmful algal blooms developed more frequently [12]. The freshwater reservoir within the sea embankment is eutrophic compared to other freshwater systems in adjacent areas [13]. Freshwater is discharged into the seawater zone in wet seasons, affecting its trophic status and phytoplankton dynamics [14,15,16]. The aim of the present study was to investigate the response of the phytoplankton communities in situ in terms of size and taxonomic structure to the addition of a generic HS (commercially available) in the freshwater zone using mesocosm experiments. It was hypothesized that phytoplankton communities do not respond to HS addition because the dissolved inorganic nutrients available to phytoplankton remain relatively sufficient in the freshwater zone of the estuary.

2. Materials and Methods

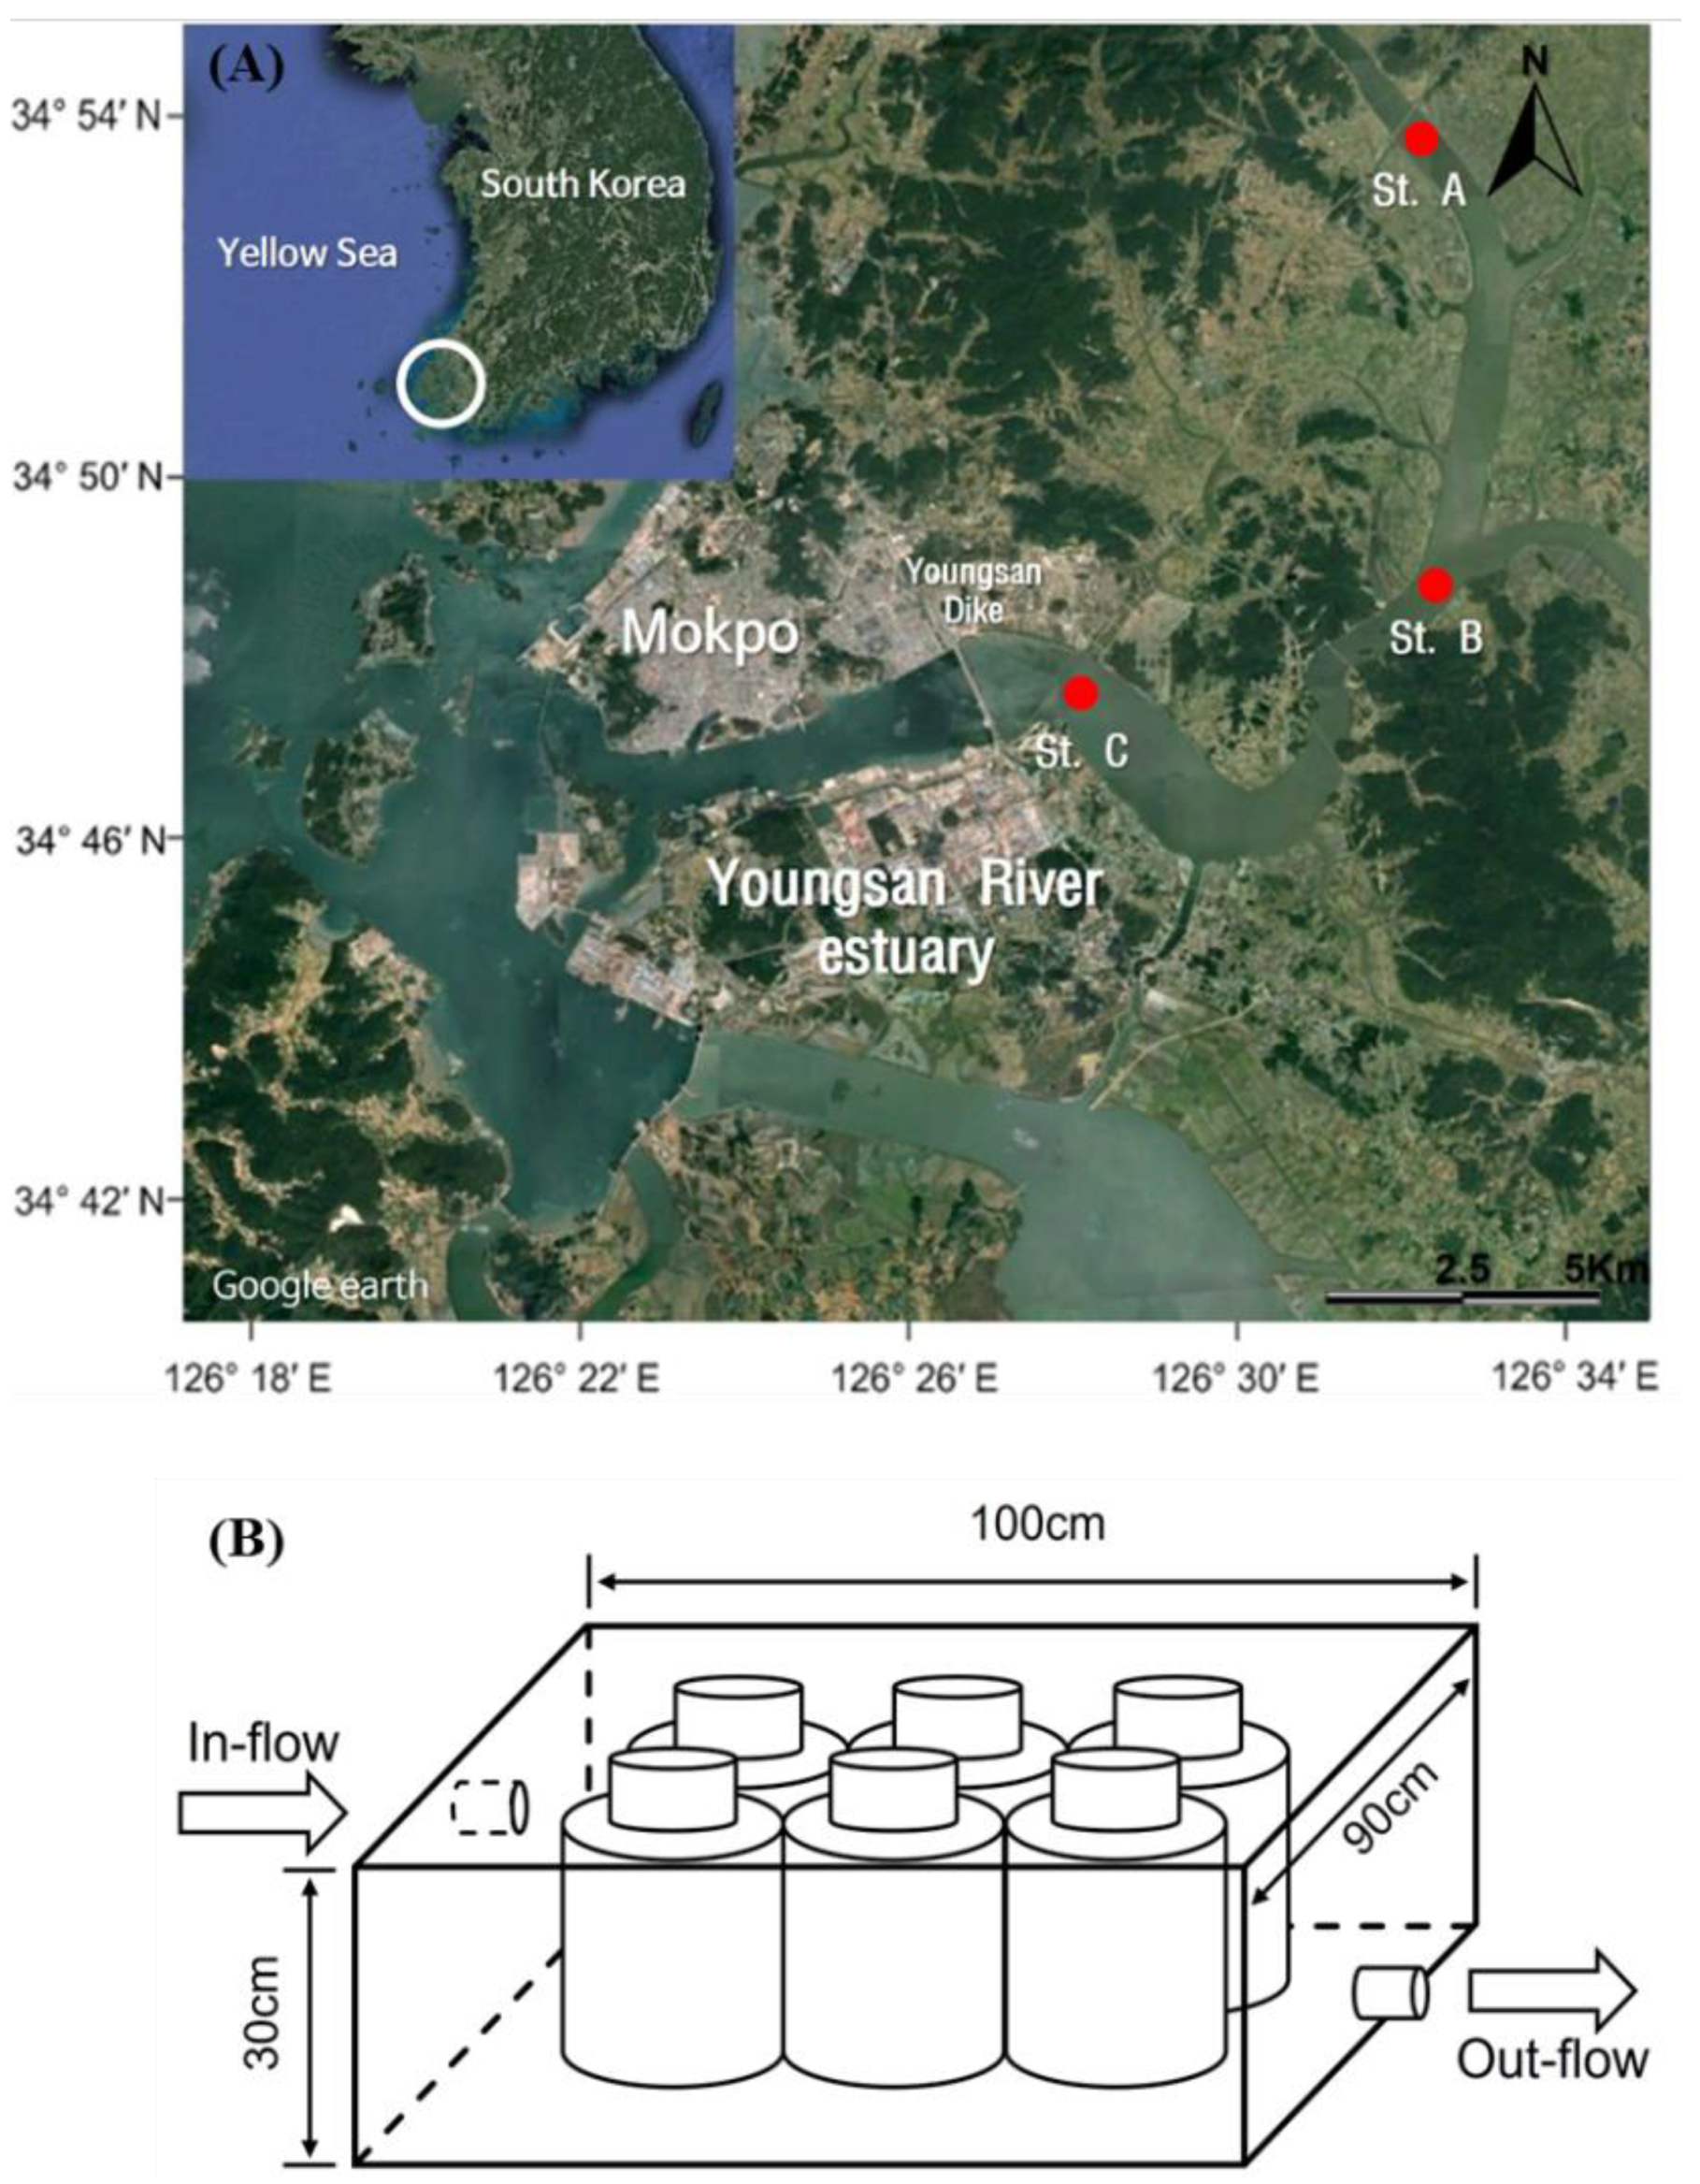
2.1. Sampling and Experimental Designs

Water samples for incubation were collected from the surface water (0.5 m depth) at three stations along the channel of the freshwater zone (Figure 1A) in May, August, and November 2009, and in January 2010 based on the seasons. In addition, water samples were collected from one or two stations during March 2010 (Sts. A and C), and February 2011 (St. A). Water properties, including in situ water temperature (°C), turbidity (NTUs), and pH, were measured to examine the initial conditions before incubation using a YSI Model 6600 multiparameter probe. Water samples (15 mL) for dissolved inorganic nutrient analysis were filtered through Whatman® 25 mm GF/F glass microfiber filters (0.7 µm). Subsamples for ammonium (NH4+), nitrite + nitrate (NO2 + NO3), orthophosphate (PO43−), and dissolved silica (DSi) analyses were frozen (<−20 °C) for storage. The ratios of dissolved inorganic N (DIN) to P (DIP) and DSi were analyzed to estimate the potential nutrient limitation, where DIN and DIP represent the sum of NH4+ and NO2 + NO3 and soluble reactive phosphate (SRP; PO43−), respectively.
The water samples were filtered through a 70 µm mesh to remove herbivores and were transported to the Mokpo National Maritime University, Mokpo, S. Korea. Incubation water (2 L) was placed in a transparent polycarbonate ester container for the mesocosm experiments. Two sets (replicates) of the control group containing natural water with no HA addition (control) and the HA treatment group containing HA (Sigma-Aldrich®, St. Louis, MO, USA) were incubated in the incubation pools made of transparent acrylic sheets (Figure 1B) for 9–20 days depending on the season. Incubation experiments were conducted at various concentrations (2.5, 5, and 10 ppm) of HA in March 2010. HA (5 ppm) obtained from the International Humic Substance Society (IHSS) and HS from Sigma-Aldrich® were used for the incubation experiment in February 2011. Minimum volumes (<10 mL) of subsamples were collected from the containers to investigate the changes in phytoplankton community structure and nutrient levels over the course of incubation.

2.2. Measurement of Nutrients and Phytoplankton Community

Subsamples (10 mL) were taken from the incubation container six times between the beginning and the end of the incubation period to measure dissolved inorganic nutrients by the method described earlier. Phytoplankton in the subsamples (10 mL) were filtered through a 20 µm Nytex® mesh and classified into two size classes: net (>20 µm) and nano (<20 µm). To measure the chlorophyll a (chl a) concentration, 10 mL of whole water and 10 mL of 20 µm filtrate were filtered through Whatman® 25 mm GF/F glass microfiber filters (with a 0.7 µm nominal pore size). The filters were placed in dark test tubes prefilled with 8 mL extraction solution (90% acetone and 10% distilled water). After storage for 12 h at 4 °C, chl a concentration was measured using a Turner Designs® 10 AU fluorometer. The concentration of chl a in each size fraction was estimated by subtracting the <20 µm fractions from the chl a concentration of the entire water sample. It was assumed that humic acids were not retained in the filters to interfere with the chlorophyll a measurement.
To identify phytoplankton species, subsamples (10 mL) were collected and fixed with Lugol’s solution (final I2 concentration: 250 µg mL−1). After mixing, 1 mL of the sample was dropped into a Sedgewick–Rafter counting chamber (50 × 20 × 1 mm), and phytoplankton species were identified and counted using a ZEISS® Axioskop 2 MAT microscope. Phytoplankton species were categorized into five distinct taxonomic groups: Bacillariophyta (diatoms), Cyanobacteria (blue-green algae), Cryptista/Cryptophyceae (cryptophytes), Chlorophyta (green algae), and others. Ambient concentrations of dissolved inorganic nutrients and phytoplankton communities in situ at the sampling stations were analyzed using the methods described by Sin et al. [15].

2.3. Statistical Analysis

Phytoplankton responses in terms of size and taxonomic composition to HA addition were analyzed by repeated measures analysis of variance (RM-ANOVA) using the statistical analysis program R software (ver. 6). Phytoplankton cell count data were transformed using log(x + 1) before statistical analysis.

3. Results

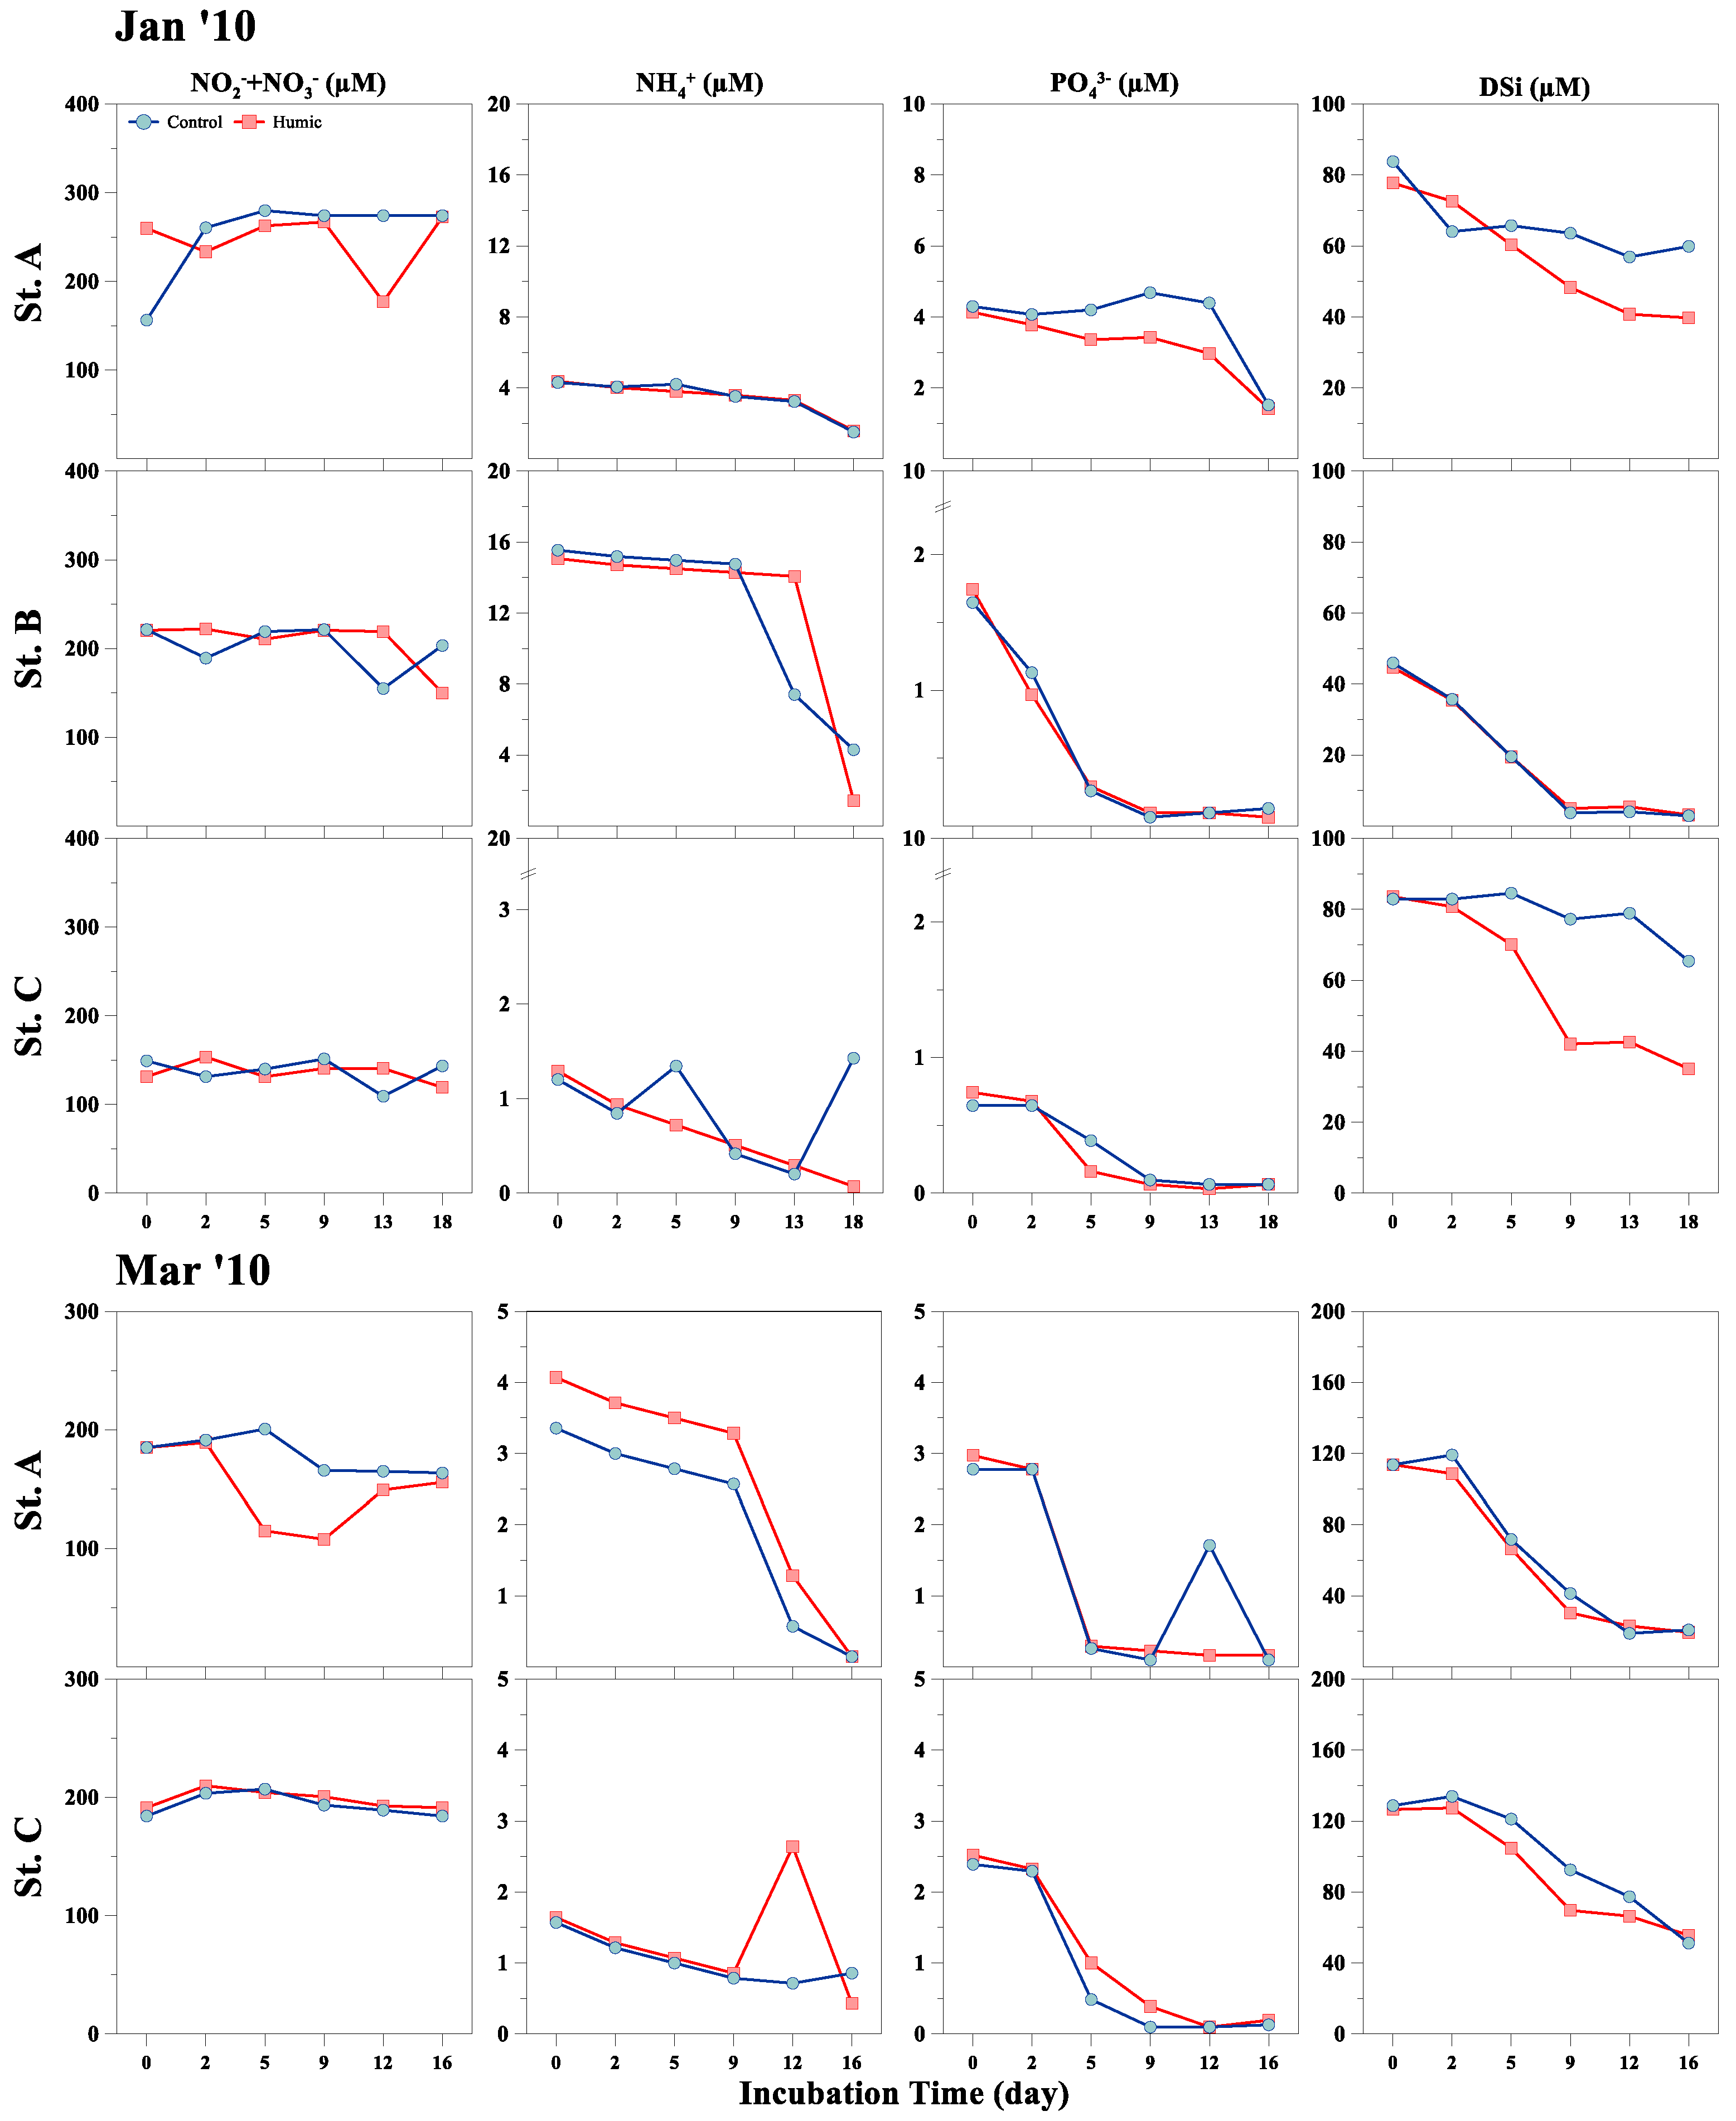
3.1. Physical, Chemical, and Phytoplankton Properties (In Situ)

The surface water temperature ranged from 3.41 to 27.60 °C during the water sampling, and spatial variations were relatively low (<1.61 °C) compared with other properties (Table 1). Turbidity in the water column ranged from 4.70 to 114.90 NTU with values in the upper region higher than in the lower region, except for samples taken in November 2009. PAR at 1.1 m water depth ranged from 1.07 to 363.40 (μmol m−2 s−1), and increased as turbidity decreased.
DIN and DIP concentrations ranged from 119.47 to 297.66 μM and from 0.19 to 6.13 μM, respectively, decreasing downstream except for DIP in May 2009. The DSi concentrations ranged from 15.93 to 168.96 μM with no clear spatial variability. DIN/DIP ratios ranged from 41.63 to 1050.75 higher than the Redfield ratio (16:1), and DIN/DSi ratios ranged from 0.89 to 12.78. DIP and DSi concentrations were low in May 2009 compared to other seasons, which contributed to the high DIN/DIP and DIN/DSi ratios.
Total chl a concentration ranged from 3.26 to 109.04 µg L−1 decreasing downstream (Table 2). The net-sized chl a concentration ranged from 0.10 to 9.44 µg L−1. Nanosized chl a concentration ranged from 1.38 to 99.60 µg L−1 decreasing downstream, similar to total chl a, and the nanosized class dominated (65–99%) the size structure except at St. C in May 2009 (34%). Diatoms are the most ubiquitous taxonomic group in the freshwater zone. They displayed relatively high cell abundance and contribution percentages (>67%) during the dry and cold seasons (January–March), except at St. C in March 2010 (37%). The most dominant species was Stephanodiscus sp. (Bacillariophyta) during this period, especially in January 2010 at St. A (84%). Cell abundances of chlorophytes and cyanobacteria were high during the warm seasons, especially in May 2009. Cryptophytes abundance was consistently high during the sampling periods, except in August 2009, with the most dominant species being Teleaulax acuta (formerly Cryptomonas acuta), especially in November 2009. A list of genera/species that appeared at the stations during the sampling period is presented in Table S1.

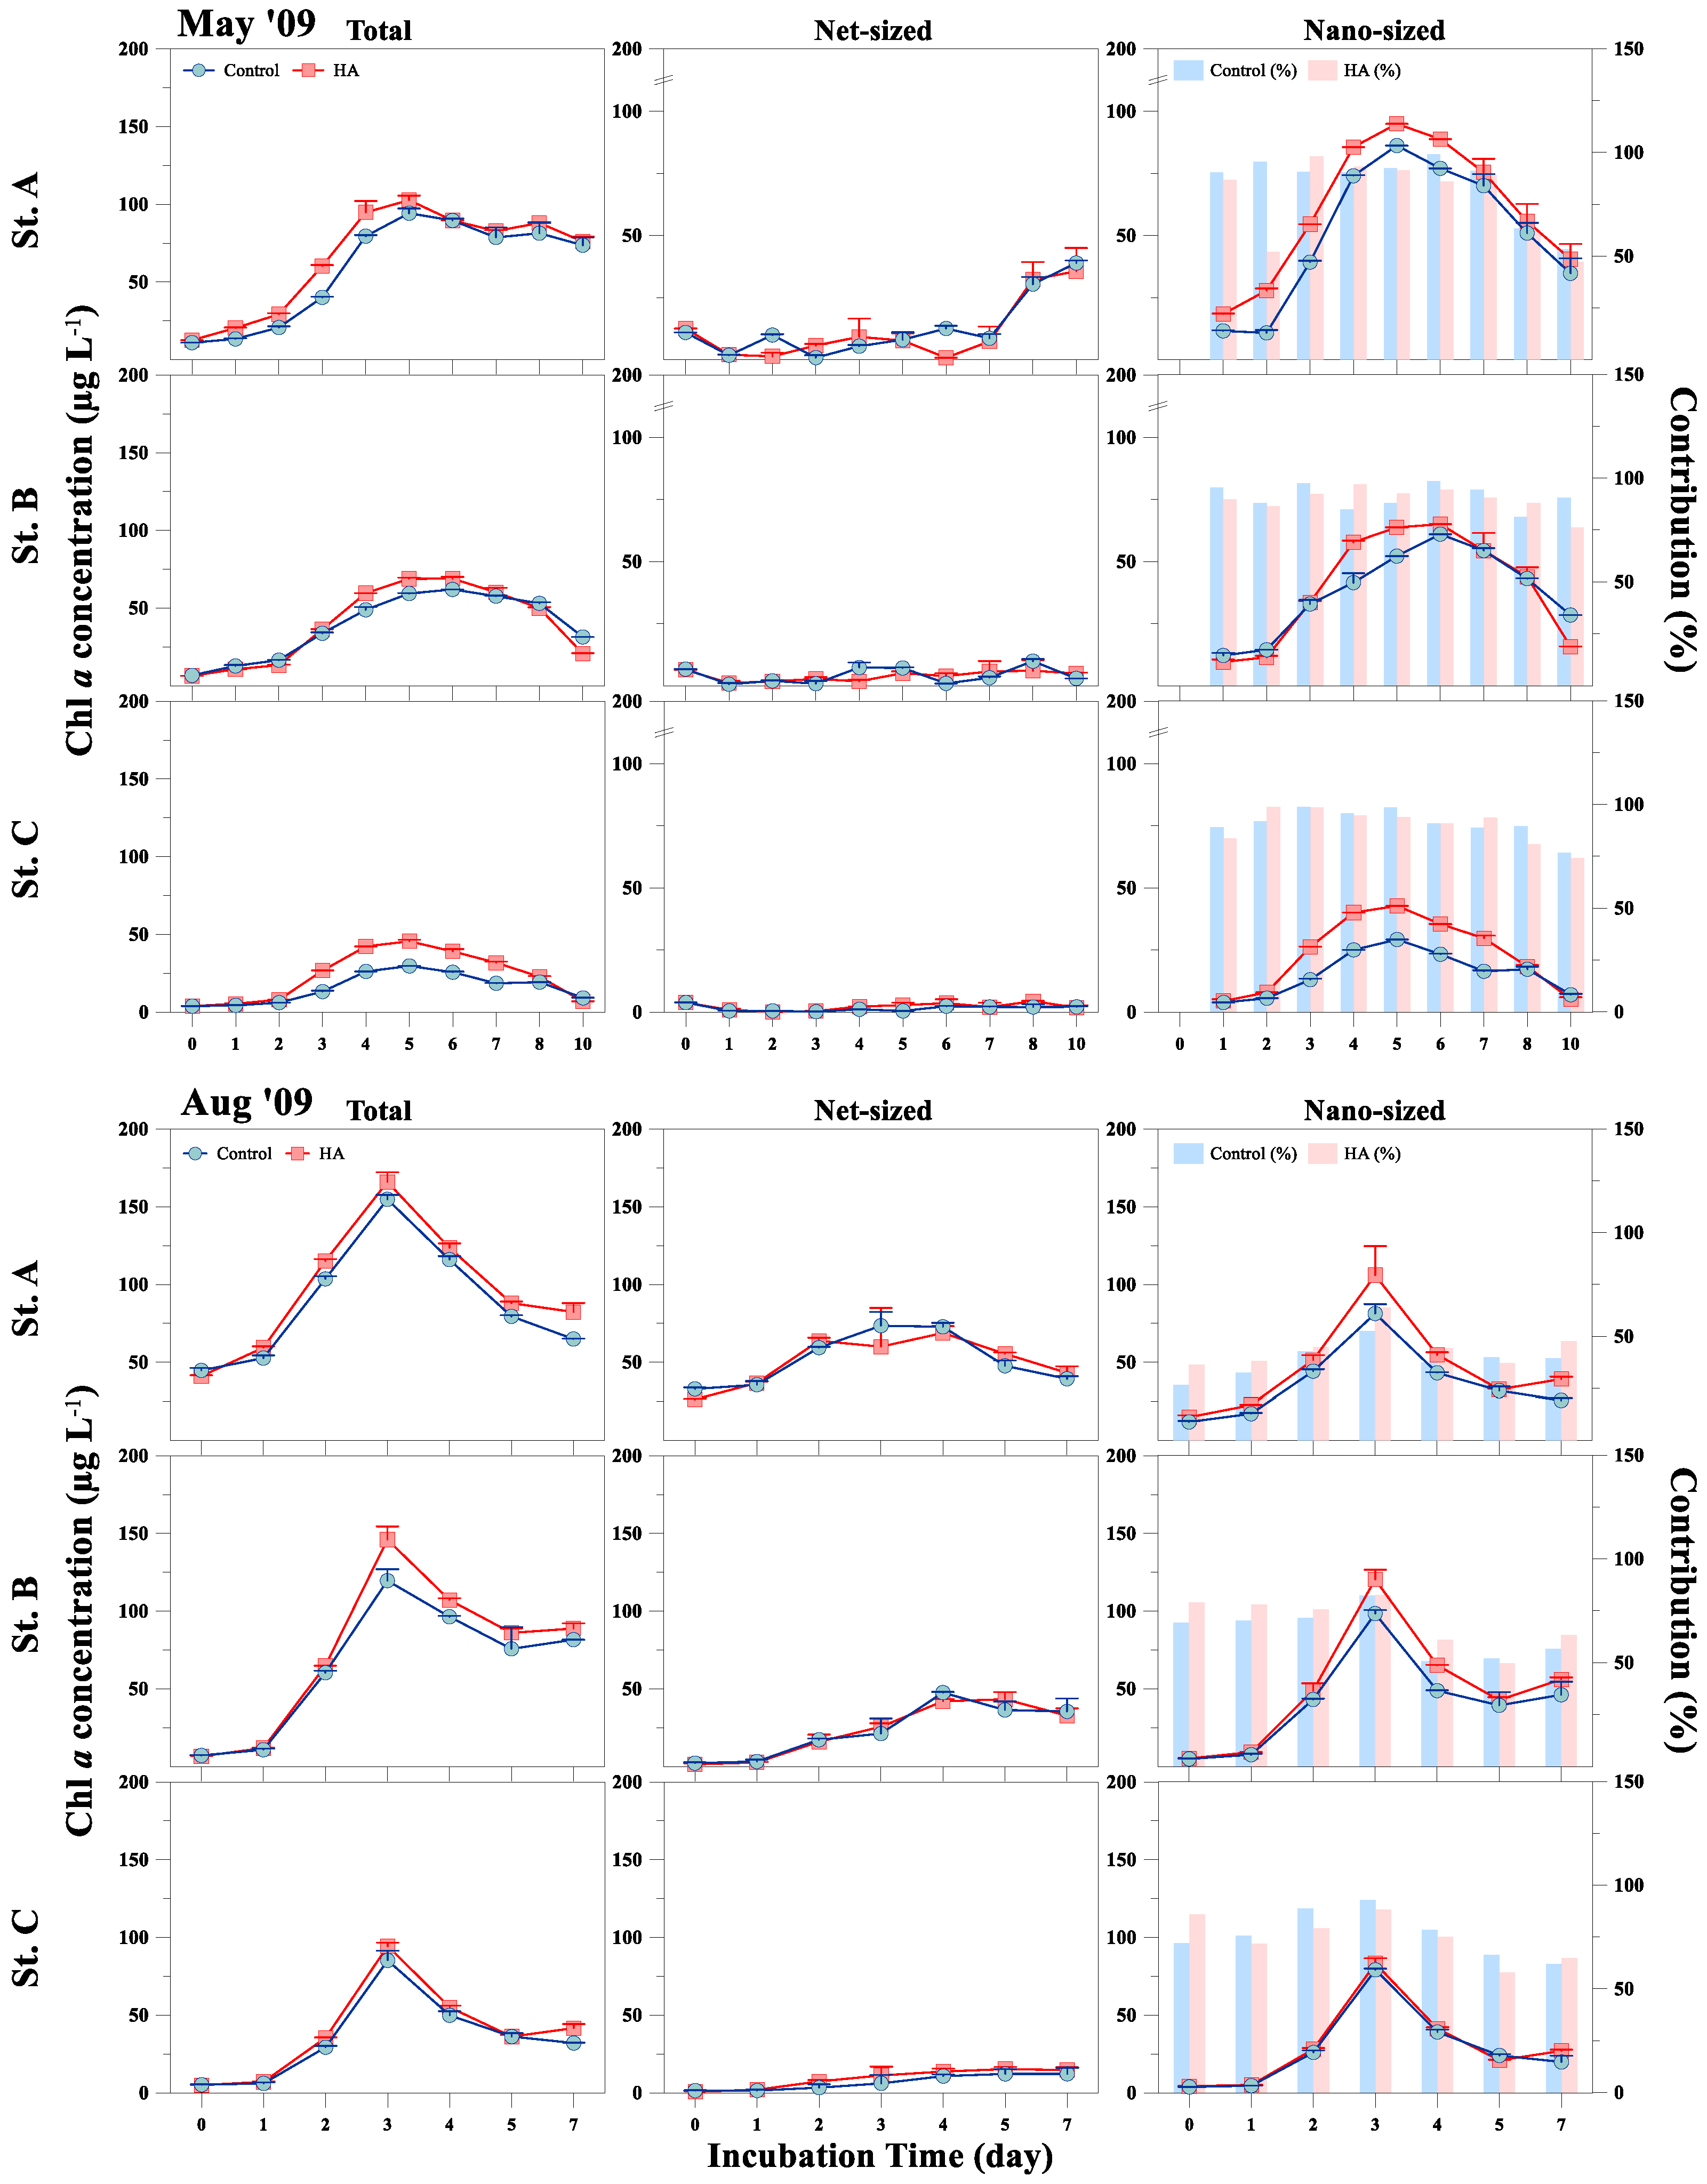
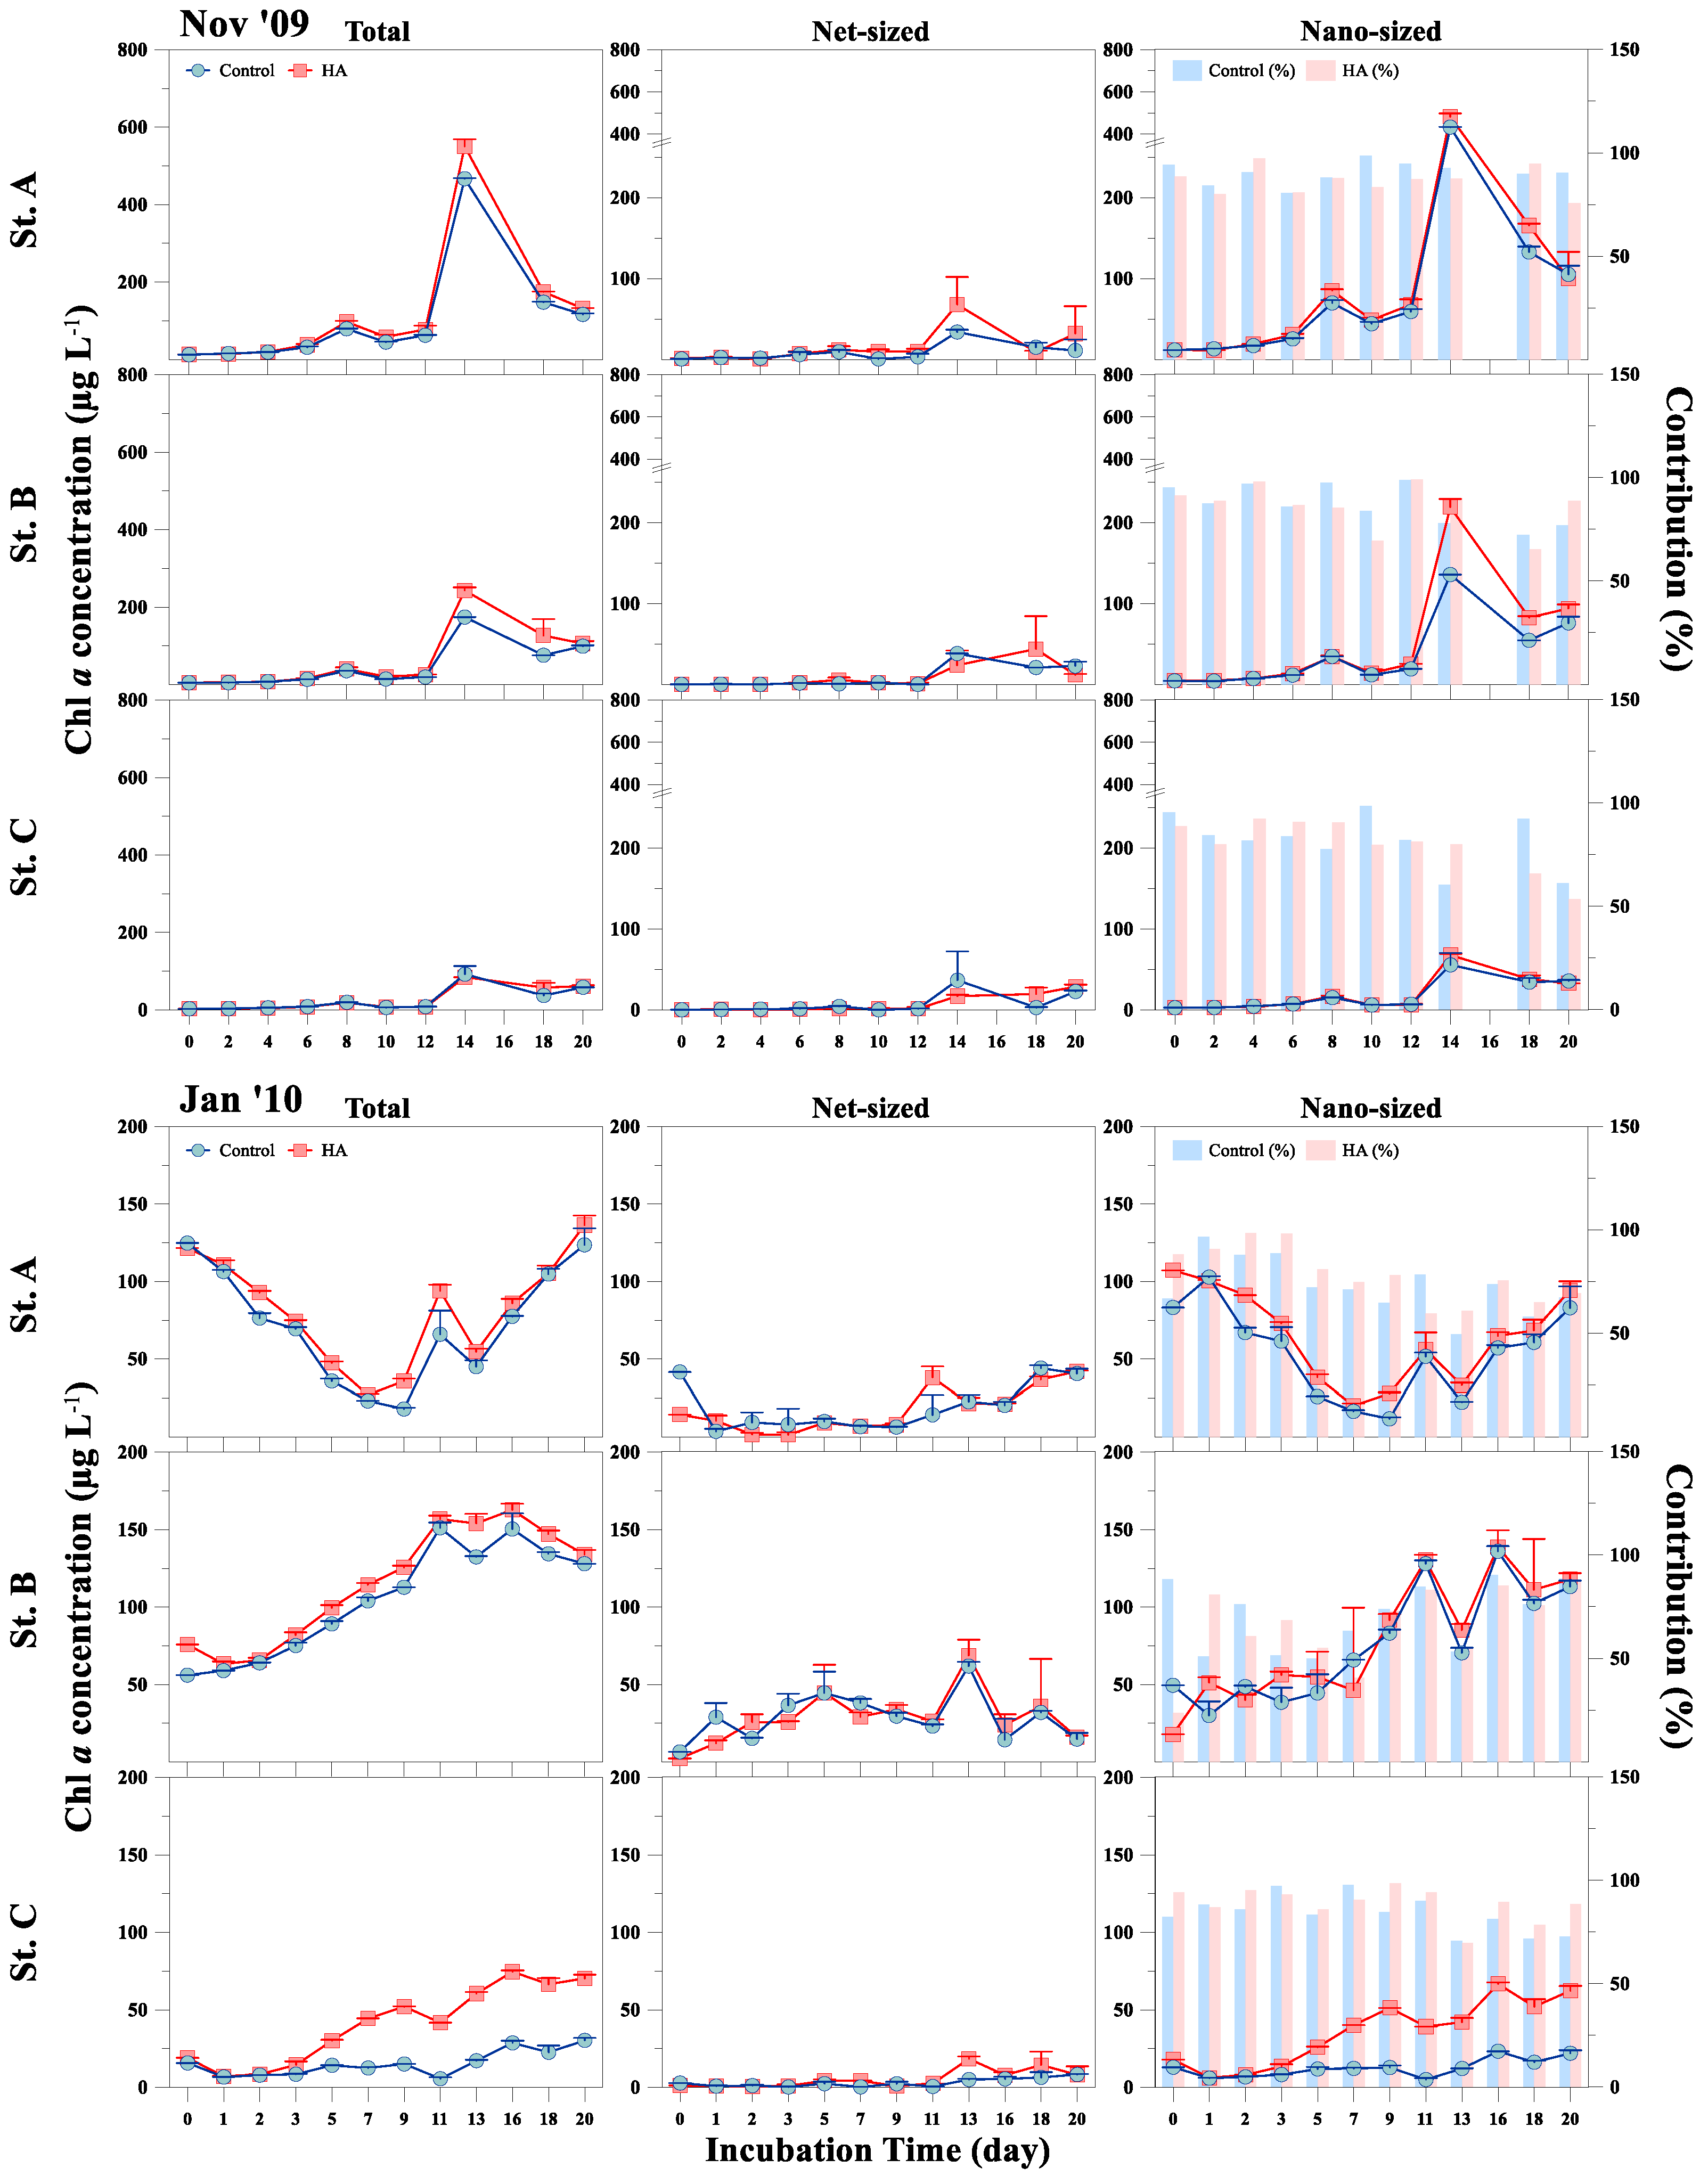
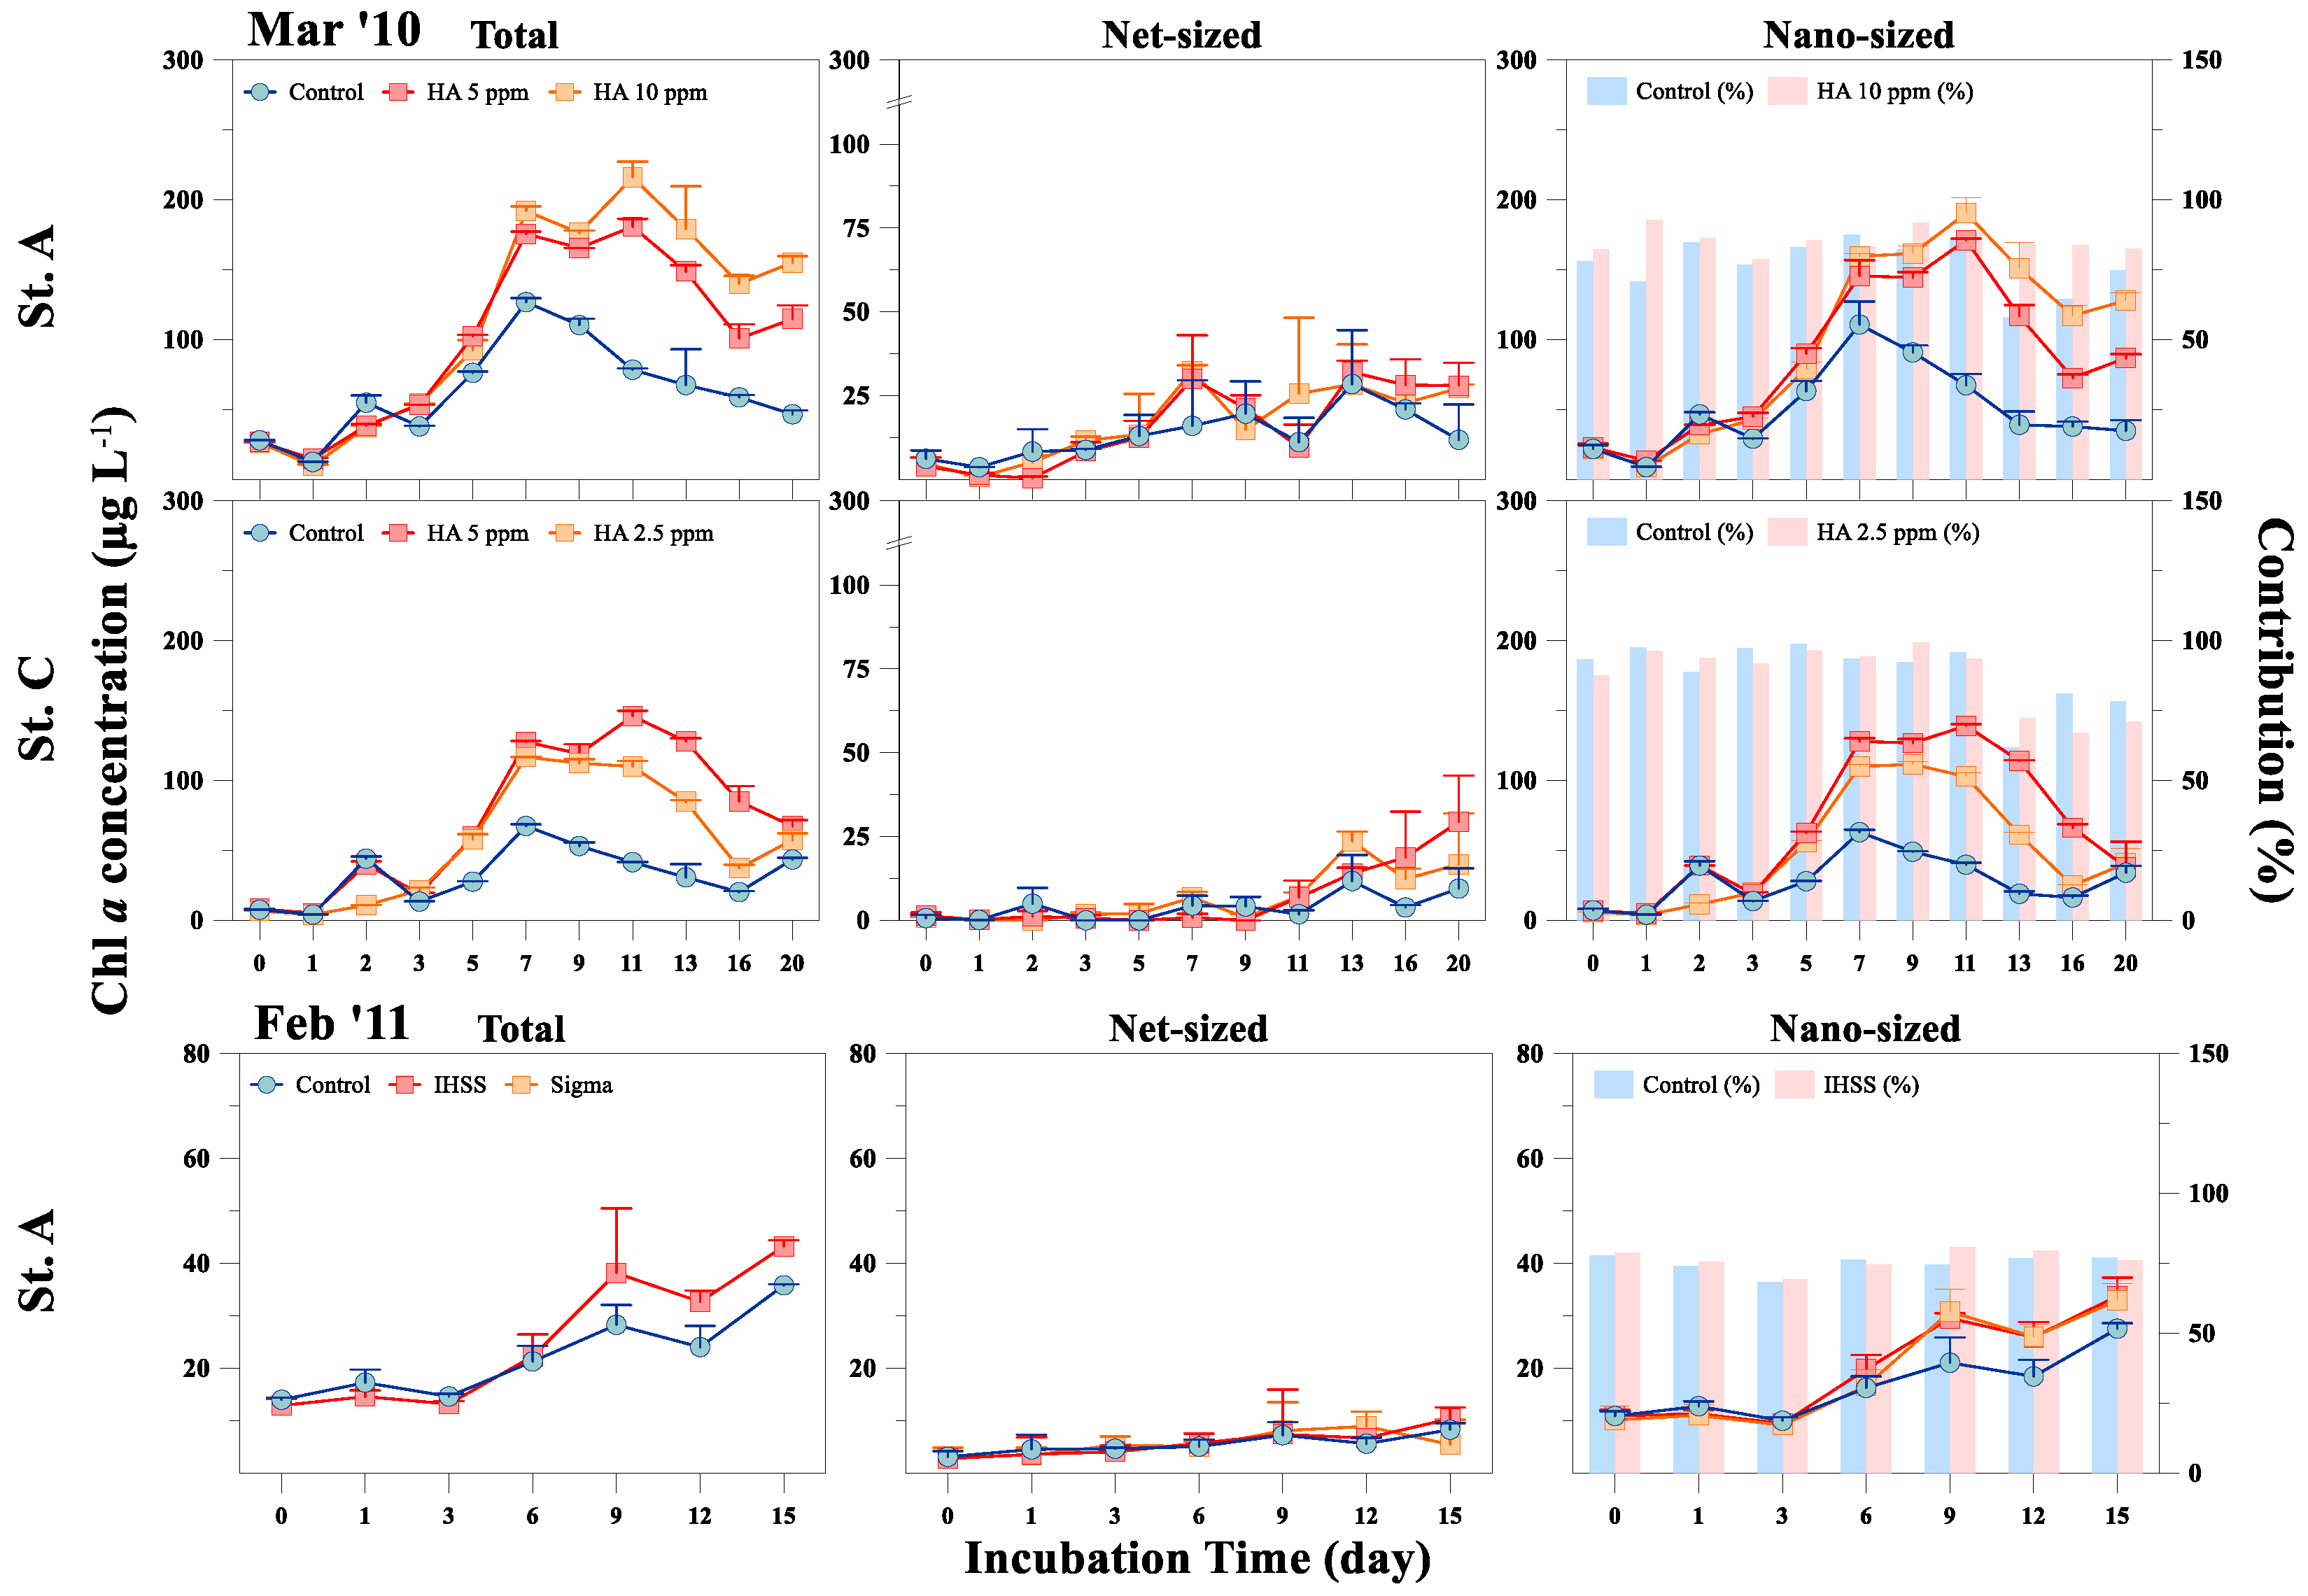
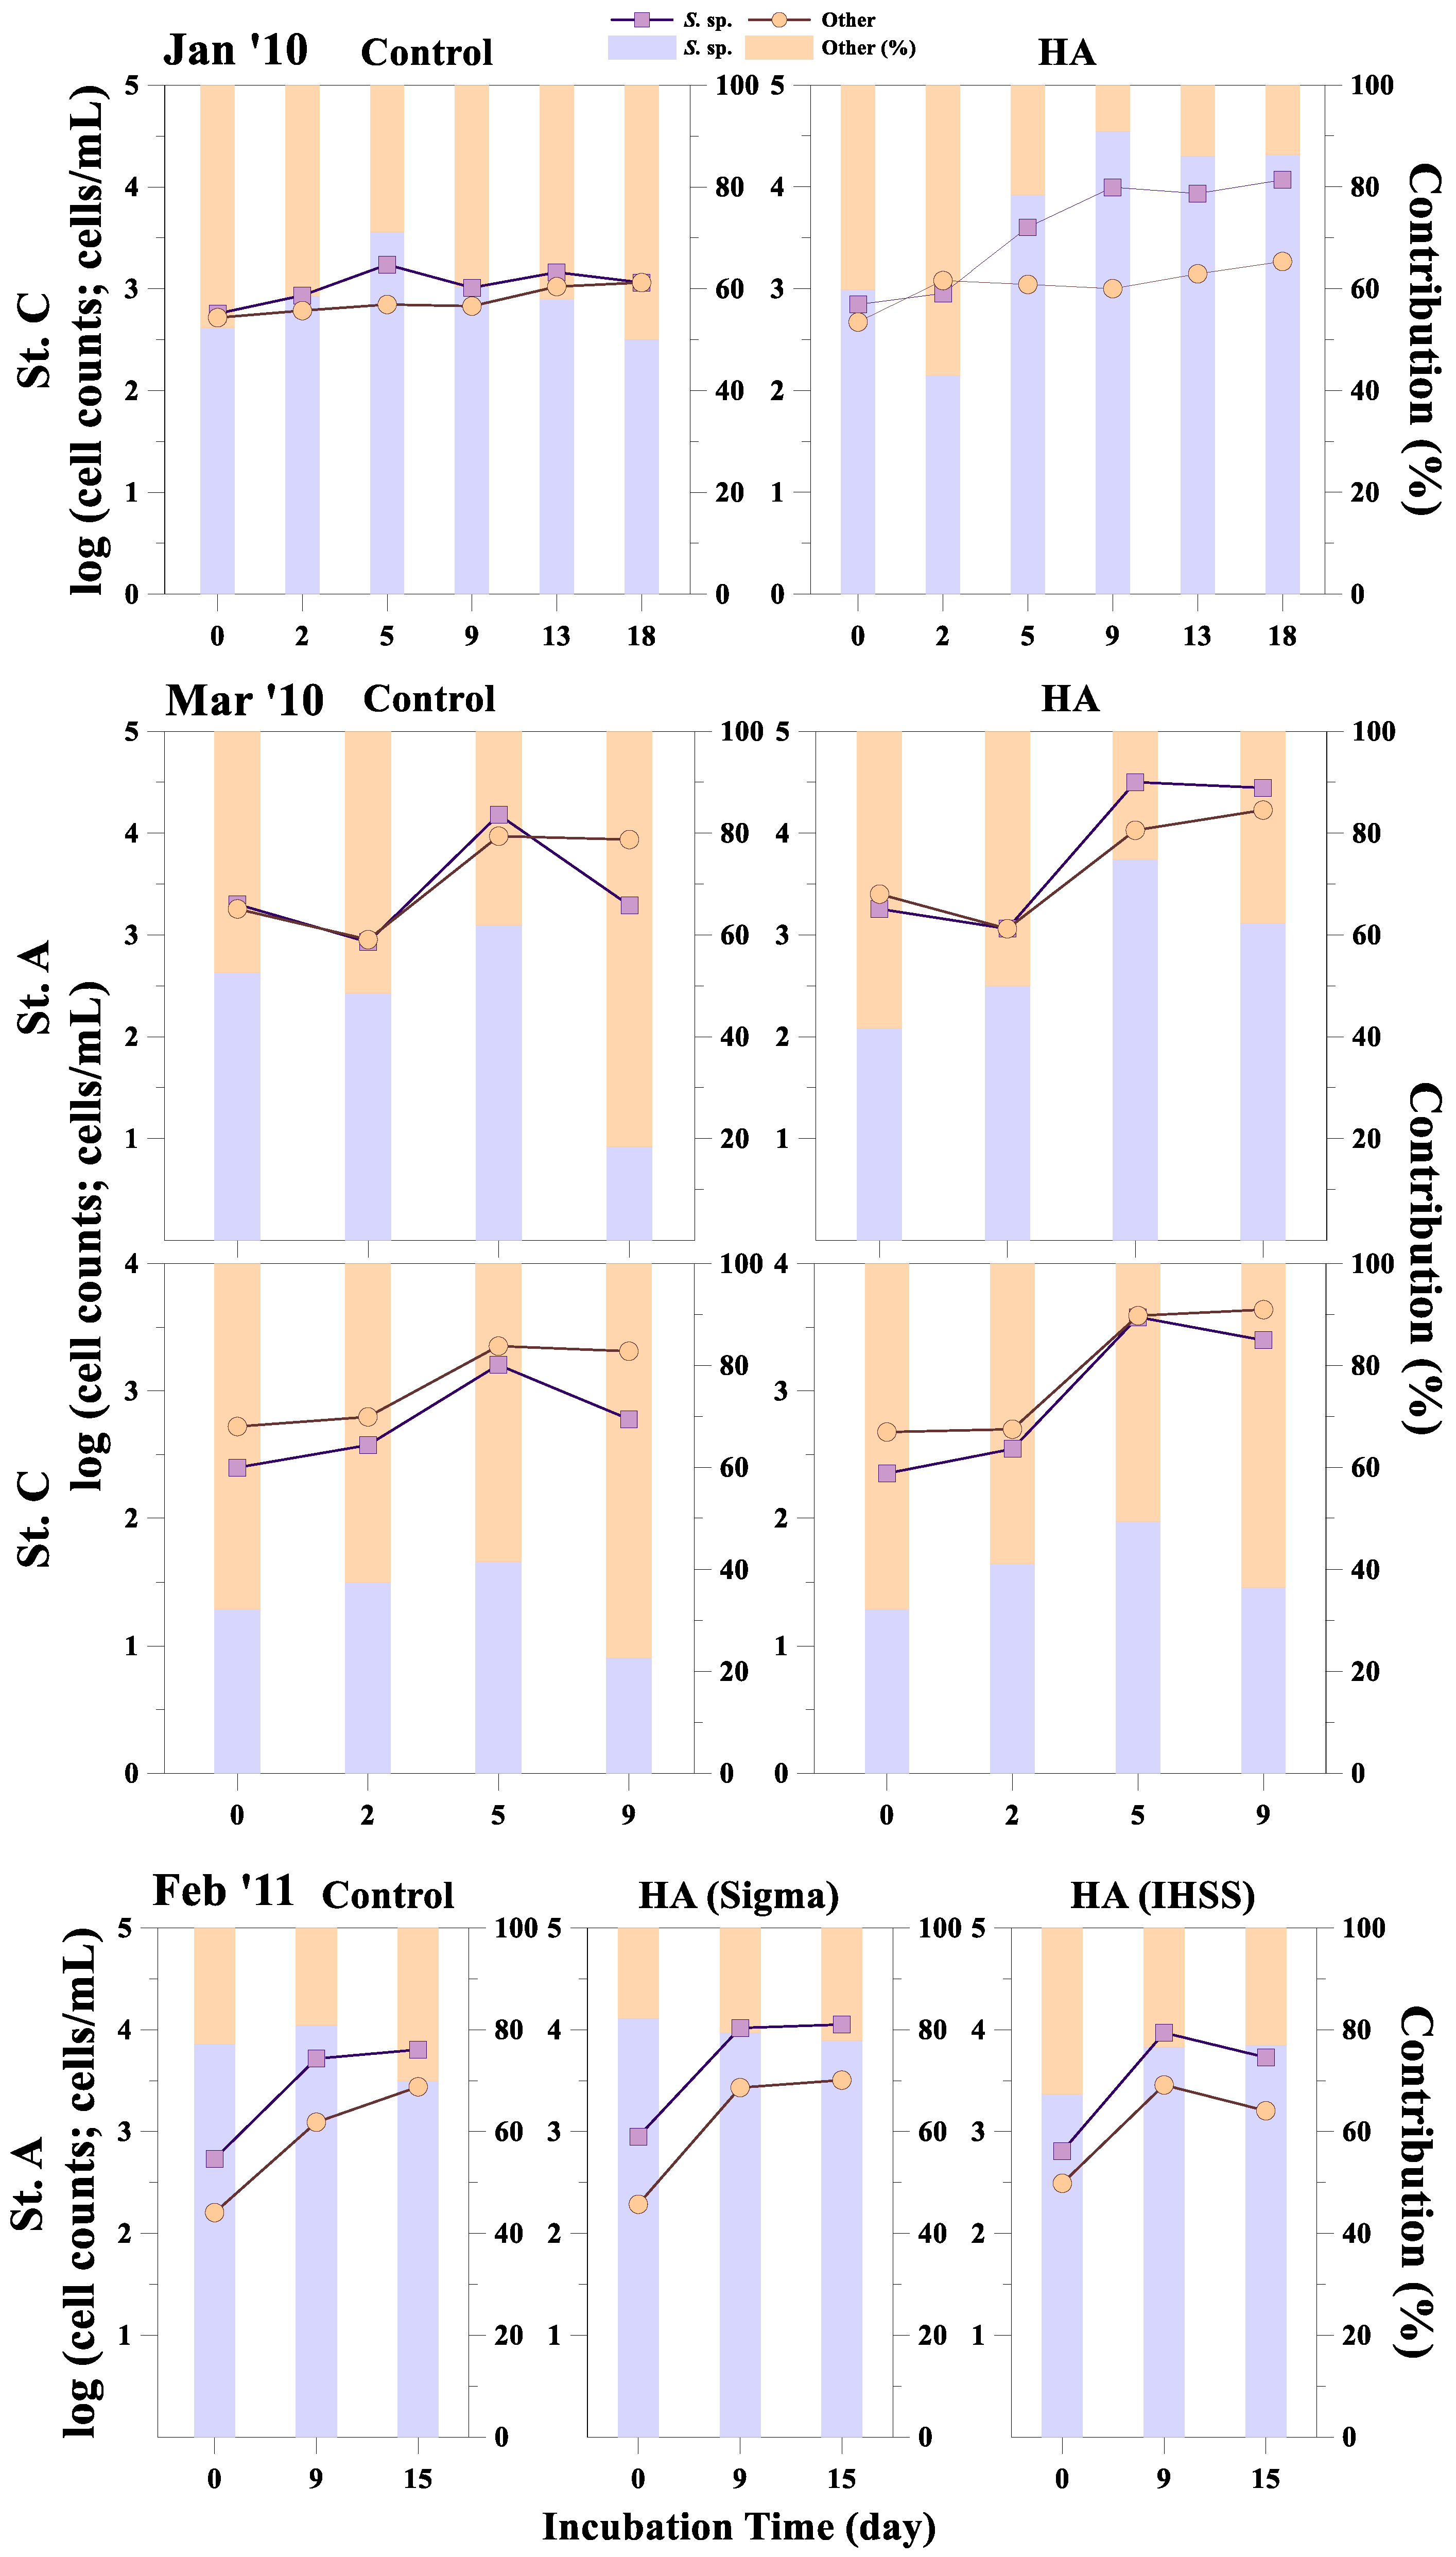
3.2. Response of Phytoplankton Size and Taxonomic Classes to HA Addition

Phytoplankton biomass measured as fractionated chl a was stimulated by HA addition (Figure 2, Figure 3 and Figure 4 and Table 3). In May and August 2009, total and nanosized chl a increased significantly (p < 0.05) when HA was added, except nanosized chl a at St. B in May and St. C in August (Figure 2, Table 3). The net-sized chl a showed no significant increase during this period.
In November 2009 and January 2010, phytoplankton responded differently to HA addition depending on size class and location (Figure 3 and Table 3). In November 2009, total and net-sized chl a increased significantly at St. A with HA addition, whereas total and nanosized chl a increased at St. B. Total chl a increased significantly at Sts. B and C, whereas nanosized chl a increased at Sts. A and C in January 2010. In March 2010, total and nanosized chl a increased significantly (p < 0.05) with HA addition (Figure 4 and Table 3). Higher chl a levels were observed in the HA 10 ppm treatment compared to the 5 ppm treatment, which in turn had higher chl a levels than the 2.5 ppm treatment (Figure 4). In February 2011, total and nanosized chl a also increased with HA addition, especially after 5 days of incubation (Figure 4), although the increase was not statistically significant (p < 0.1; Table 3). The pattern of response was similar between the treatments of HA from IHSS and from Sigma-Aldrich® (Figure 4).
The abundance of total cells and diatoms increased significantly (p < 0.05; Table 4) with HA addition at St. C in January 2010, when diatoms dominated the phytoplankton community in situ (92%; Table 3). In particular, the abundance of Stephanodiscus sp. (Bacillariophyta), a dominant species among the diatoms (82%), increased significantly (p < 0.05; Table 4), whereas the abundance of other species did not increase (Figure 5). There was no significant increase in any of the phytoplankton groups or in Stephanodiscus sp. with HA addition between March 2010 and February 2011.
Nutrient levels were examined during the incubation period in January and March 2010 (Figure 6). NO2 + NO3 did not change significantly during incubation, whereas other nutrients, including NH4+, PO43−, and DSi, decreased over time. The preference of NH4+ to NO2 + NO3 was inferred from the different patterns of depletion. Depletion of DIP (PO43−) was apparent and initiated earlier than that of other nutrients during the experiment. However, no significant difference in nutrient measurement was observed between the HA treatment and control groups (Table 4). DSi levels showed a significant decrease in the HA treatment compared with the other nutrients and relative to the control groups, especially at St. C.

4. Discussion

In estuaries, nutrient inputs from river discharge are a major source of inorganic nutrients, especially NO2 + NO3 and DSi [17]. Riverine nutrients contribute to the production of new phytoplankton in coastal areas [18]. In the Yeongsan River estuary, nutrients are supplied mainly from riverine inputs that are affected by discharge water from urban wastewater treatment [19]. Despite the trophic state of the estuary being classified as hypereutrophic during the wet seasons based on Nürnberg’s criteria [20] because of riverine inputs, the freshwater zone has been reported to be subject to P limitations during dry seasons [21] similar to other freshwater systems. A significant increase in chlorophyll a resulted from the addition of phosphate in the mesocosm experiments conducted in the freshwater zone of the estuary.
In this study, DIN and DSi in situ reached high levels and generally decreased downstream, whereas orthophosphate (DIP) levels were relatively low (Table 1), which could be attributed to the effect of riverine inputs. Seasonally, the ambient nutrient concentrations of DIP and DSi were relatively low during the dry season, especially in May 2009, compared to the wet season in August 2009. DIP was especially low (≤0.40 µM) in May 2009. This resulted in a high N:P molar ratio of ambient nutrients available to phytoplankton (>16:1, Redfield ratio), suggesting that phytoplankton growth at the sampling sites was potentially limited by P.
HS are mixtures of complex chemical compounds with different functional groups and molecular configurations that exert abiotic and biotic interactions in water [22]. Among these, HS are known to modulate P uptake by phytoplankton by stimulating or inhibiting P regeneration resulting from alkaline phosphatase activity (microbiologically mediated) and UV light photorelease in the epilimnetic water of lakes [23]. HS also interact with orthophosphates bound to high molecular weight HS aggregates in the presence of Fe [24]. Colloidal aggregates can release orthophosphates into water via displacement reactions. Additionally, Fe can be transferred to larger molecular weight fractions to form HS–Fe–P complexes through complexation reactions, and orthophosphate can be released into the water via UV radiation, as reviewed by Steinberg [22]. However, the importance of HS as stimulators or inhibitors depends on water systems, and further studies are needed to elucidate their interaction with orthophosphate and microbes in water [9,22].
In this study, HA addition resulted in a significant increase in phytoplankton biomass through the seasons, especially nanosized chl a, possibly by stimulating (not inhibiting) the regeneration and uptake of P by phytoplankton. This can be inferred from the observation that, unlike other nutrients, such as DSi (Table 4), no significant decrease in DIP levels resulted from the significant increase in chl a levels. The positive algal response was also similar to that of phytoplankton to DIP addition during the dry season in mesocosm experiments conducted in January and April 2011 [21]. In the present study, among the phytoplankton taxonomic groups, the nanosized diatoms, Stephanodiscus sp. which is dominant during the cold and dry seasons, responded to HA addition, whereas no significant response of Stephanodiscus sp. to DIP addition was observed [21].
Martine et al. [25] reported that HS naturally stimulated the growth rates of marine benthic diatoms, probably because of the enhanced bioavailability of trace metals or other nutrients. HA extracted from Spartina-derived humic nitrogen also stimulated the growth of estuarine and marine species through photochemical and microbial regeneration rather than direct uptake [11]. HA extracted from the Yeongsan River also increased the growth of Raphidocelis subcapitata (formerly Pseudokirchneriella subcapitata) (Chlorophyta), a common test species for aquatic toxicology because of its complexation reactions with Fe [10]. The direct HS uptake of Miozoa (dinoflagellates) through pinocytosis has also been reported [26,27]; however, this has not been considered in the present study because dinoflagellates did not appear at the study sites.
HS can also affect phytoplankton growth by changing light availability in the water column through light absorption, especially at high concentrations [28,29]. The Yeongsan River estuary study sites showed high turbidity, where the Secchi disk depth was low (0.88 ± 0.30 m) during water sampling. The chl a levels increased as the concentration of HA increased from 2.5 to 10 ppm (Figure 4), suggesting that HA addition probably changed the light regime slightly to the extent of no effect on phytoplankton growth during incubation. No apparent effect of HS on the light regime has also been reported for a shallow lake with a similar latitude to the study sites, where the algal community was dominated by phytoplankton growing well at low light levels [30]. The intracellular inhibitory effects of HA on photosynthesis have also been studied but remain controversial. Extracellular and stimulating effects are now emphasized more than before [31]. In this context, HA was probably capable of stimulating phytoplankton growth, possibly by increasing the regeneration or algal uptake rate of P in the mesocosm experiments. Further studies are required to elucidate the mechanisms of P regeneration and algal uptake of P based on the interaction with HS in the estuary.
Recently, the concentrations of orthophosphate have decreased significantly in the freshwater zone of the Yeongsan River estuary because of the improved P treatment of municipal sewage, although DIN nutrients did not decrease significantly [19]. However, the significant decrease in orthophosphate concentrations did not lead to the mitigation of algal blooms. The N:P ratios increased and resulted in more potential P limitation than before. The algal bloom magnitude and frequency have considerably increased, particularly after the construction of weirs in the upper region of the freshwater zone [32]. Furthermore, HS fractions are expected to increase in the estuary, considering the significant increase in COD relative to BOD in the freshwater zone [32]. Therefore, in the freshwater zones of the estuary, a reduction in HS, as well as dissolved inorganic nutrient (P) levels, may be required to control algal biomass, especially that of nanosized phytoplankton, such as Stephanodiscus sp., which are sensitive to HS inputs. Thus, the management of HS based on a better understanding of HS behavior may be crucial in mitigating algal blooms in eutrophic estuaries, such as the Yeongsan River estuary, that are subjected to anthropogenic disturbance by engineered structures such as weirs and sea embankments.

5. Conclusions

The response of an in situ phytoplankton community in terms of size and taxonomy to humic acid (HA) addition was investigated using enclosed mesocosms for a eutrophic freshwater zone, physically divided by a sea embankment, within the Yeongsan River estuary. Phytoplankton biomass estimated by chl a, especially nanosized (<20 µm), increased significantly (p < 0.05) with HA addition through the seasons. The abundance of nanosized Stephanodiscus sp. also significantly increased when the species dominated phytoplankton taxonomy (67%). Because the zone generally maintained its eutrophic status during the wet seasons, this response was unexpected. The pattern of phytoplankton response is similar to the results of a previous mesocosm study of DIP addition which showed a significant increase in phytoplankton biomass (chl a) during dry seasons. The results suggest that HA can contribute to algal blooms in estuaries where HS levels are expected to increase, although the underlying mechanisms remain to be explored. The management of HS and a better understanding of HS behavior may be vital in mitigating algal blooms in eutrophic estuaries that are disturbed by engineered structures, such as the Yeongsan River estuary.

Supplementary Materials

The following supporting information can be downloaded at: https://www.mdpi.com/article/10.3390/app122010223/s1, Table S1: Phytoplankton genera/species that appeared at the sampling stations during the sampling period in the Yeongsan River estuary.

Author Contributions

Conceptualization, Y.S. and S.K.; methodology, Y.S.; software, Y.S.; validation, Y.S.; formal analysis, Y.S.; investigation, Y.S and S.K.; resources, Y.S. and S.K.; data curation, Y.S.; writing—original draft preparation, Y.S.; writing—review and editing, S.K.; visualization, Y.S.; supervision, Y.S.; project administration, Y.S and S.K.; funding acquisition, Y.S. All authors have read and agreed to the published version of the manuscript.

Funding

This research received no external funding.

Data Availability Statement

Data are contained within the article.

Acknowledgments

We would like to thank the laboratory staff for participating in the water sampling and mesocosm experiments.

Conflicts of Interest

The authors declare no conflict of interest.

References

  1. Aiken, G.R.; McKnight, D.M.; Wershaw, R.L.; MacCarthy, P. An introduction to humic substances in soils, sediments and waters. In Humic Substances in Soil, Sediment, and Water: Geochemistry, Isolation, and Characterization; Aiken, G.R., McKnight, D.M., Wershaw, R.L., MacCarthy, P., Eds.; Wiley: New York, NY, USA, 1985; pp. 1–9. [Google Scholar]
  2. Thurman, E.M. Aquatic humic substances. In Organic Geochemistry of Natural Waters; Thurman, E.M., Ed.; Martinus Nijhof/Dr. W. Junk Publishers: Dordrecht, The Netherlands, 1985; pp. 273–361. [Google Scholar]
  3. Carlsson, P.; Granéli, E.; Tester, P.; Boni, L. Influences of riverine humic substances on bacteria, protozoa, phytoplankton, and copepods in a coastal plankton community. Mar. Ecol. Prog. Ser. 1995, 127, 213–221. [Google Scholar] [CrossRef]
  4. Carlsson, P.; Edling, H.; Béchemin, C. Interactions between a marine dinoflagellate (Alexandrium catenella) and a bacterial community utilizing riverine humic substances. Aquat. Microb. Ecol. 1998, 16, 65–80. [Google Scholar] [CrossRef] [Green Version]
  5. Carlsson, P.; Granéli, E.; Segatto, A.Z. Cycling of biologically available nitrogen in riverine humic substances between marine bacteria, a heterotrophic nanoflagellate and a photosynthetic dinoflagellate. Aquat. Microb. Ecol. 1999, 18, 23–36. [Google Scholar] [CrossRef] [Green Version]
  6. Steinberg, C.E.W.; Meinelt, T.; Timofeyev, M.A.; Bittner, M.; Menzel, R. Humic substances. Part 2: Interactions with organisms. Environ. Sci. Pollut. Res. 2008, 15, 128–135. [Google Scholar] [CrossRef] [Green Version]
  7. Tranvik, L.J.; Höfle, M.G. Bacterial growth in mixed cultures on dissolved organic carbon from humic and clear waters. Appl. Environ. Microbiol. 1987, 53, 482–488. [Google Scholar] [CrossRef] [PubMed] [Green Version]
  8. Tranvik, L.J.; Sieburth, J.M.N. Effects of flocculated humic matter on free and attached pelagic microorganisms. Limnol. Oceanogr. 1989, 34, 688–699. [Google Scholar] [CrossRef]
  9. Lipczynska-Kochany, E. Humic substances, their microbial interactions and effects on biological transformations of organic pollutants in water and soil: A review. Chemosphere 2018, 202, 420–437. [Google Scholar] [CrossRef] [PubMed]
  10. Lee, J.; Park, J.H.; Shin, Y.S.; Lee, B.C.; Chang, N.I.; Cho, J.; Kim, S.D. Effect of dissolved organic matter on the growth of algae, Pseudokirchneriella subcapitata, in Korean lakes: The importance of complexation reactions. Ecotoxicol. Environ. Saf. 2009, 72, 335–343. [Google Scholar] [CrossRef] [PubMed]
  11. See, J.H.; Bronk, D.A.; Lewitus, A.J. Uptake of Spartina-derived humic nitrogen by estuarine phytoplankton in nonaxenic and axenic culture. Limnol. Oceanogr. 2006, 51, 2290–2299. [Google Scholar] [CrossRef]
  12. Malazarte, J.M.; Lee, H.; Kim, H.; Sin, Y. Spatial and temporal dynamics of potentially toxic cyanobacteria in the riverine region of a temperate estuarine system altered by weirs. Water. 2017, 9, 819. [Google Scholar] [CrossRef]
  13. Yi, S.; Sin, Y.; Jang, N.; Kim, J.; Kim, H.; Cho, Y.; Jeong, J. Trophic state and water quality in major lakes of the Sumjin and Youngsan river systems. Korean J. Limnol. 2006, 39, 296–309. [Google Scholar]
  14. Sin, Y.; Hyun, B.; Jeong, B.; Soh, H.Y. Impacts of eutrophic freshwater inputs on water quality and phytoplankton size structure in a temperate estuary altered by a sea dike. Mar. Environ. Res. 2013, 85, 54–63. [Google Scholar] [CrossRef] [PubMed]
  15. Sin, Y.; Lee, E.; Lee, Y.; Shin, K. The river–estuarine continuum of nutrients and phytoplankton communities in an estuary physically divided by a sea dike. Estuarine Coast. Shelf Sci. 2015, 163, 279–289. [Google Scholar] [CrossRef]
  16. Sin, Y.; Jeong, B. Short-term variations of phytoplankton communities in response to anthropogenic stressors in a highly altered temperate estuary. Estuarine Coast. Shelf Sci. 2015, 156, 83–91. [Google Scholar] [CrossRef]
  17. Murrell, M.C.; Hagy, J.D., III; Lores, E.M.; Greene, R.M. Phytoplankton production and nutrient distributions in a sub-tropical estuary: Importance of freshwater flow. Estuar. Coast. 2007, 30, 390–402. [Google Scholar] [CrossRef]
  18. Saeck, E.A.; Hadwen, W.L.; Rissik, D.; O’Brien, K.R.; Burford, M.A. Flow events drive patterns of phytoplankton distribution along a rivereestuaryebay continuum. Mar. Freshwater Res. 2013, 64, 655–670. [Google Scholar] [CrossRef]
  19. Shin, Y.; Yu, H.; Lee, H.; Lee, D.; Park, G. The Change in patterns and conditions of algal blooms resulting from construction of weirs in the Yeongsan River: Long-term data analysis. Korean J. Environ. Ecol. 2015, 48, 238–252. [Google Scholar] [CrossRef]
  20. Nürnberg, G.K. Trophic state of clear and colored, soft- and hardwater lakes with special consideration of nutrients, anoxia, phytoplankton and fish. Lake Reserv. Manag. 1996, 12, 432–447. [Google Scholar] [CrossRef]
  21. Yoon, B. A Study of Nutrient Limitation in Estuary Using Bioassay Experiment. Master’s Thesis, Mokpo National Maritime University, Mokpo, Korea, 2012. [Google Scholar]
  22. Steinberg, C.E.W. Ecology of Humic Substances in Freshwaters. In Determinants from Geochemistry to Ecological Niches; Springer: Berlin, Germany, 2003. [Google Scholar]
  23. Francko, D.A. Epilimnetic phosphorus cycling: Influence of humic materials and iron on coexisting major mechanisms. Can. J. Fish. Aquat. Sci. 1986, 43, 302–310. [Google Scholar] [CrossRef]
  24. Salonen, K.; Jones, R.I.; De Haan, H. Phosphorus Transformations in the Epilimnion of Humic Lakes: Abiotic Interactions Between Dissolved Humic Materials and Phosphate. Freshw. Biol. 1988, 19, 357–369. [Google Scholar]
  25. Martin, M.V.; Gebühr, C.; Mártire, D.O.; Wiltshire, K.H. Characterization of a humic acid extracted from marine sediment and its influence on the growth of marine diatoms. J. Mar. Biol. Assoc. 2014, 94, 895–906. [Google Scholar] [CrossRef]
  26. Legrand, C.; Carlsson, P. Uptake of high molecular weight dextran by the dinoflagellate Alexandrium catenella. Aquat. Microb. Ecol. 1998, 16, 81–86. [Google Scholar] [CrossRef]
  27. Lewitus, A.J. Osmotrophy in marine microalgae. In Algal Cultures, Analogues of Blooms and Applications; Subba Rao, D.V., Ed.; Science Publishers: Enfield, CT, USA, 2006; pp. 343–383. [Google Scholar]
  28. Jones, R.I. Phytoplankton, primary production and nutrient cycling. In Aquatic Humic Substances-Ecological Studies; Hessen, D.O., Tranvik, L.J., Eds.; Springer: New York, NY, USA, 1998. [Google Scholar]
  29. Eloranta, P. Light penetration in water. In Limnology of Humic Waters; Keskitalo, J., Eloranta, P., Eds.; Backhuys Publishers: Kerkwerve, The Netherlands, 1999; pp. 61–63. [Google Scholar]
  30. Rodríguez, P.; Pizarro, H. Phytoplankton productivity in a highly colored shallow lake of a South American floodplain. Wetlands 2007, 27, 1153–1160. [Google Scholar] [CrossRef]
  31. Gilbert, M.; Bährs, H.; Steinberg, C.E.W.; Wilhelm, C. The artificial humic substance HS1500 does not inhibit photosynthesis of the green alga Desmodesmus armatus in vivo but interacts with the photosynthetic apparatus of isolated spinach thylakoids in vitro. Photosynth. Res. 2018, 137, 403–420. [Google Scholar] [CrossRef]
  32. Sin, Y.; Lee, H. Changes in hydrology, water quality, and algal blooms in a freshwater system impounded with engineered structures in a temperate monsoon river estuary. J. Hydrol. Reg. Stud. 2020, 32, 100744. [Google Scholar] [CrossRef]
Figure 1. Sampling stations in the freshwater zone of the Yeongsan River estuary (A) and incubation bath (B) used in the mesocosm experiments to simulate the natural environments by circulating estuarine water inside the bath using an electric pump. Two baths were interconnected for the experiments.
Applsci 12 10223 g001
Figure 2. Size-fractionated chl a concentration (µg L−1) and contribution percentage (%) of nanosize class during the mesocosm experiments (control vs. HA treatment) for water samples collected at Sts. A, B, and C in May and August 2010.
Applsci 12 10223 g002
Figure 3. Size-fractionated chl a concentration (µg L−1) and contribution percentage (%) of nanosize class during the mesocosm experiments for water samples collected at St. A, B, and C in November 2009 and January 2010.
Applsci 12 10223 g003
Figure 4. Size-fractionated chl a concentration (µg L−1) and contribution percentage (%) of nanosize class during the mesocosm experiments for water samples collected at Sts. A and C in March 2010 and at St. A in February 2011. Treatments of 2.5, 5, and 10 ppm HA (Sigma-Aldrich®) and 5 ppm HA obtained from IHSS were designed for the experiments in March 2010 and February 2011, respectively.
Applsci 12 10223 g004
Figure 5. Size-fractionated cell abundance of a dominant species, Stephanodiscus sp. and other species in log scale and their contribution percentage (%) for treatments of control and HA addition (5 ppm) designed for the mesocosm experiments in January 2010, March 2010, and February 2011.
Applsci 12 10223 g005
Figure 6. Nutrient concentrations, including nitrite + nitrate (NO2 + NO3), ammonium (NH4+), orthophosphate (PO43−; DIP), and dissolved silica (DSi), over the incubation periods of experiments conducted in January and March 2010.
Applsci 12 10223 g006
Table 1. Physical properties of, and nutrient concentrations in surface water at the sampling stations (Sts A, B, and C) in the freshwater zone of the Yeongsan River estuary: Temp, water temperature; Turb, turbidity; PAR, photosynthetically active radiation at 1.1 m; DIN, dissolved inorganic nitrogen (NO2 + NO3 + NH4+); DIP, dissolved inorganic phosphate (PO43−); DSi, dissolved inorganic silicate.
Sampling
Date
StationTemp
(°C)
Turb (NTU)PAR
(μmol m−2 s−1)
DIN
(µM)
DIP
(µM)
DSi
(µM)
DIN/DIPDIN/DSi
May 2009A19.7612.3038.01272.630.3123.23888.7611.74
B19.648.90219.80214.450.4020.47531.3310.48
C19.086.50224.40203.570.1915.931050.7512.78
Aug 2009A26.6836.201.07205.484.20124.1748.951.65
B27.6023.1052.38150.053.33168.9645.120.89
C27.0715.30146.53137.923.07148.0244.960.93
Nov 2009A9.4514.7020.41255.436.13116.0641.632.20
B10.22114.9078.33155.881.74131.7289.401.18
C11.0612.50272.70119.471.16127.95102.770.93
Jan 2010A3.6911.406.36297.664.5280.4265.853.70
B3.629.2025.22251.741.7838.59141.756.52
C3.414.70363.40157.820.9084.69174.561.86
Mar 2010A9.6411.8023.04219.043.00120.7272.941.81
C8.948.7098.78216.092.52131.4785.801.64
Feb 2011A3.569.807.25329.412.26231.22145.741.42
Table 2. Total, net- and nanosized chl a concentrations (µg L−1) and cell abundance (cells mL−1) in taxonomic groups and their contribution percentages (% in parenthesis) in the surface water at stations A, B, and C in the freshwater zone of the Yeongsan River estuary: S Date, Sampling date; Chloro, Chlorophytes; Cyano, Cyanobacteria; Crypto, Cryptophytes; Others, Other groups.
Sampling DateStationTotalNetNanoDiatomsChloroCyanoCryptoOtherDominant Species
May 2009A10.840.76 (7.0)10.08 (93.0)370
(24.3)
510 (33.6)170
(11.2)
260 (17.1)210 (13.8)Coelastrum microporum
(18.4)
B6.700.10 (1.5)6.60 (98.5)60
(11.3)
100 (18.9)120
(22.6)
250 (47.2)0Teleaulax acuta
(34.0)
C4.102.72 (66.3)1.38 (33.7)65
(21.3)
45
(14.8)
65
(21.3)
130 (42.6)0Microcystis aeruginosa
(21.3)
Aug 2009A14.363.96
(27.6)
10.40
(72.4)
149
(46.9)
22
(6.9)
120
(37.7)
027
(8.5)
Microcystis aeruginosa
(21.1)
B
6.50
1.06
(16.3)
5.44
(83.7)
63
(66.3)
19
(20.0)
0013
(13.7)
Discostella stelligera (formerly Cyclotella stelligera)
(24.2)
C4.681.66
(35.3)
3.03
(64.7)
60
(55.0)
6
(5.5)
40
(36.7)
03
(2.8)
Microcystis sp.
(36.7)
Nov 2009A13.241.36
(10.3)
11.88
(89.7)
57
(17.0)
00153
(45.5)
126
(37.5)
Teleaulax acuta
(35.7)
B5.540.16
(2.9)
5.38
(97.1)
40
(21.9)
00130
(71.0)
13
(7.1)
Teleaulax acuta
(50.8)
C3.260.18
(5.6)
3.08
(94.4)
73
(39.5)
3
(1.6)
3
(1.6)
103
(55.7)
3
(1.6)
Cryptomonas erosa
(37.8)
Jan 2010A109.049.44
(8.7)
99.60
(91.3)
2550
(94.4)
00110
(4.1)
40
(1.5)
Stephanodiscus sp.
(84.1)
B50.961.60
(3.1)
49.36
(96.9)
1240
(91.2)
10
(0.7)
080
(5.9)
30
(2.2)
Stephanodiscus sp.
(35.3)
C7.080.95
(13.4)
6.12
(86.6)
1720
(91.5)
20
(1.1)
0130
(6.9)
10
(0.5)
Stephanodiscus sp.
(42.0)
Mar 2010A26.124.88
(18.7)
21.24
(81.3)
1310
(78.9)
70
(4.2)
0250
(15.1)
30
(1.8)
Stephanodiscus sp.
(35.5)
C8.081.26
(15.6)
6.82
(84.4)
230
(36.5)
80
(12.7)
10
(1.6)
180
(28.6)
130
(20.6)
Stephanodiscus sp.
(17.5)
Feb 2011A8.281.48
(17.9)
6.80
(82.1)
580
(66.7)
25
(2.9)
0205
(23.5)
60
(6.9)
Stephanodiscus sp.
(29.9)
Table 3. Results of the RM-ANOVA analyses on HA addition treatments for total, net-, and nanosized phytoplankton at a significance level of 0.05. Time and Trt (treatment) represent the differences over time and between the treatments (control vs. HA (5 ppm) addition), respectively and T*Trt represents differences between the treatments and over time. Significant p-values (<0.05) are highlighted in gray.
Sampling
Date
StationTotalNet-sizedNanosized
TimeTrtT*TrtTimeTrtT*TrtTimeTrtT*Trt
May 2009A0.0020.0280.1780.0140.6450.2050.0030.0260.279
B<0.0010.0160.0190.0890.7340.1990.0030.1680.060
C<0.0010.0010.0040.0730.0210.281<0.001<0.0010.005
Aug 2009A0.0010.0230.1330.0520.7160.4300.0110.0140.296
B0.0030.0180.2270.0170.9740.4450.0030.0490.157
C0.0010.0190.2000.0520.1940.5140.0010.1330.165
Nov 2009A<0.0010.0060.0390.1300.0010.4240.0010.0660.169
B0.0060.0150.1390.1300.8270.4460.0010.0010.016
C0.0080.5870.3170.1230.9760.3910.0090.2230.388
Jan 2010A0.0030.0620.1650.0260.0960.1220.0060.0340.223
B0.0020.0090.1780.0680.9850.4260.0370.1610.401
C0.002<0.0010.0060.0730.0980.1960.003<0.0010.007
Mar 2010A0.001<0.0010.0170.0660.3810.541<0.001<0.0010.011
C<0.001<0.0010.0020.0500.0310.354<0.001<0.0010.004
Feb 2011A0.0220.0900.0930.2610.9560.371<0.0010.0520.077
Table 4. Results of the RM-ANOVA analyses on HA addition treatments for total, net-, and nanosized phytoplankton at a significance level of 0.05. Time and Trt represent the differences over time and between the treatments (control vs. HA (5 ppm) addition), respectively, and T*Trt represents differences between the treatment and over time. Significant p-values (<0.05) are highlighted in gray. Chloro, Chlorophytes; Cyano, Cyanobacteria; Crypto, Cryptophytes; Others, Other groups; NA, No appearance; ND, No data.
Phytoplankton GroupJan 2010 (St. C)Mar 2010 (St. A)Mar 2010 (St. C)Feb 2011 (St. A)
TimeTrtTimeTrtTimeTrtTimeTrt
Total abundance0.3780.0420.0310.1730.0250.1850.0190.412
Diatoms0.3890.0450.0460.1840.0370.2090.0210.431
Chlorophytes0.0320.2220.0060.2480.0070.3800.0290.391
Cyanobacteria0.1210.809NANA0.4970.381NANA
Cryptophytes0.0050.3630.6080.9830.5410.2030.0160.161
Others0.7270.7820.5940.9750.7280.31100
Stephanodiscus sp.0.4450.0490.0810.1880.0930.2300.0230.374
NO2 + NO30.7880.8930.0170.0800.1660.127NDND
NH4+0.3360.324<0.0010.0040.0130.417NDND
DIP (PO43−)<0.0010.571<0.0010.582<0.0010.884NDND
DSi0.1470.034<0.0010.461<0.0010.032NDND
Publisher’s Note: MDPI stays neutral with regard to jurisdictional claims in published maps and institutional affiliations.

