Article

7-Score Function for Assessing the Strength of Association Rules Applied for Construction Risk Quantifying

Department of Production Engineering and Construction Management, Faculty of Civil Engineering, Institute of Building Engineering, Warsaw University of Technology, 00-637 Warsaw, Poland
*
Author to whom correspondence should be addressed.
Appl. Sci. 2022, 12(2), 844; https://doi.org/10.3390/app12020844
Submission received: 5 December 2021 / Revised: 4 January 2022 / Accepted: 11 January 2022 / Published: 14 January 2022

Abstract

:
There are several factors influencing the time of construction project execution. The properties of the planned structure, the details of an order, and macroeconomic factors affect the project completion time. Every construction project is unique, but the data collected from previously completed projects help to plan the new one. The association analysis is a suitable tool for uncovering the rules—showing the influence of some factors appearing simultaneously. The input data to the association analysis must be preprocessed—every feature influencing the duration of the project must be divided into ranges. The number of features and the number of ranges (for each feature) create a very complicated combinatorial problem. The authors applied a metaheuristic tabu search algorithm to find the acceptable thresholds in the association analysis, increasing the strength of the rules found. The increase in the strength of the rules can help clients to avoid unfavorable sets of features, which in the past—with high confidence—significantly delayed projects. The new 7-score method can be used in various industries. This article shows its application to reduce the risk of a road construction contract delay. Importantly, the method is not based on expert opinions, but on historical data.

Graphical Abstract

1. Introduction

The early stage of a construction project planning process is characterized by a high level of uncertainty. Although every construction project is unique, the data collected from previously completed projects help to plan the new one. The problem of estimating the time necessary to complete a project becomes more complicated if “design & build” orders are applied. There are several factors influencing the completion time of construction projects, including the properties of the planned structure, the details of an order, macroeconomic factors, and prices of materials. The delayed completion date of the construction contract makes the contractor’s costs much higher than expected [1,2,3]. The negative impact of such a delay also concerns the client and the community for whom the built object serves [4]. This is why identifying the most important causes of delays is crucial. Different methods are applied for identifying and validating their importance [4,5]. Lowering the possibility of delay occurrence can concentrate on either proper planning of work execution (planning the duration of the execution of work [1,2,3,4,5,6]), scheduling [7], or on avoiding unfavorable circumstances for project execution [8]. As the contractors base their decisions on their experience [9,10] (carrying out decisions about participation in a given tender procedure), completed projects can be analyzed to avoid circumstances that have resulted in a significant delay in the completion of projects in the past. The field of project management aimed at reducing the impact of threats of implementation not in accordance with the adopted plan is the interdisciplinary science of risk management. It is often reduced to the application of qualitative and quantitative risk analysis. The construction industry in general, as well as individual construction projects, deal with various risks [11,12]. Especially, infrastructure projects, as they are large in the volume of works and results, involve huge budgets. This means that failures may result in huge monetary losses, which are caused by the various risks linked with such projects [13]. This is why risk must be properly identified and mitigated [14,15].
The risk assessment process requires the introduction of several important assumptions regarding, inter alia, the distribution of the probabilities of occurrence and the occurrence costs of individual risk factors, as well as assumptions regarding the efficiency and costs related to the implementation of activities provided for in the schedule. At the preparatory stage of an investment project, a risk matrix is often created, which is a graphic representation of the risk analysis process (Table 1).
Over the course of years, many approaches to construction project risk management have been developed by various researchers. Wang et al. [16] developed an alien eyes’ risk (AER) model, which uses hierarchical levels of risk and the mutual relationships between the risks and a qualitative risk mitigation framework. Schieg [17] proposed a risk management process in construction project management, which puts more emphasis on personal area risks. Choudhry and Iqbal [18] identified and prioritized common risks, management techniques to address them, the current status of the risk management systems implemented in organizations, and barriers for effective risk management in the construction industry. Taroun and Yang [19] introduced a combination of the Dempster–Shafer theory of evidence, a reasoning algorithm for structuring personal experience and professional judgment, and a classic spreadsheet-based decision support system. Serpella et al. [20] used a knowledge-based approach. The approach addresses project risks in the construction management industry based on a threefold arrangement and risk management function. Ebrat and Ghodsi [21] proposed the adaptive neuro-fuzzy inference system and stepwise regression model as a means of identifying and evaluating the risks in construction projects. Iqbal et al. [22] developed a risk management framework that allows for reporting the significance of different types of risks and the effectiveness of various risk management techniques commonly practiced in the construction industry. Vafadarnikjoo et al. [23] proposed the use of an intuitive fuzzy decision-making trial and evaluation laboratory (DEMATEL) to prioritize the risks associated with construction projects by using the risk breakdown structure (RBS). Kao et al. [24] suggested using an integrated fuzzy ANP (analytical network process)-based balanced scorecard system for the evaluation of relevant bilateral factors for the Taiwanese construction sector collaborating with local Chinese contractors. Ahmadi et al. [25] analyzed the criteria, prioritized potential risk events, and used the fuzzy AHP technique to quantify them. Li et al. [26] adopted text mining methods to identify safety risk factors and participants in urban rail projects. Chatterjee et al. [11] developed a hybrid D-ANP-MABAC model including the ANP methodology in the D numbers domain and extended multi-attributive border approximation area comparison (MABAC) method.
Anysz et al. [27] have found the set of unfavorable conditions usually accompanying the significant delays of construction projects with the use of association analysis. This tool is suitable for uncovering the rules in data, i.e., unusually frequent simultaneous appearance of factors or phenomena [28,29]. Although the speed of calculation is high, because of the use of dedicated software, the input data to the association analysis have to be preprocessed—every feature influencing, e.g., the duration of the project, has to be divided into ranges. The number of features and the number of ranges (for each feature) can create a very complicated combinatorial problem. The authors decided to use a metaheuristic algorithm to find the acceptable thresholds in association analysis, increasing the strength of the rules found. The sequence of the previous and current findings is presented in Figure 1.
The increase in the strength of the rules can help clients to avoid unfavorable sets of features, which in the past—with high confidence—significantly delayed projects. Data presented in the previous article [27] serve as a base to this work and concern the road construction projects (express roads and highways) completed between 2009 and 2013 in Poland. After presenting materials and methods, the invented 7-Score function is defined. It combines, in one formula, the typical ratios assessing the rules. The 7-Score assesses the strength of rules, so their importance can be ranked. Creating a 7-Score function is necessary to apply the tabu search algorithm that maximizes the objective function (it must be a single one). As a result, the most powerful and the most informative rules can be found. They are presented and discussed in the Section 4. Based on them, it is possible to assess the risk of delay in the completion of a road construction contract that meets the criteria applied in the analysis. This is to emphasize that the introduced innovative method of quantitative risk assessment is not based on the experts’ opinions, but rather on evidence concerning the collected and completed construction contracts of the same kind.

2. Materials and Methods

2.1. Association Analysis

Association analysis was invented to increase sales in supermarkets. The contents of clients’ trolleys were analyzed to find the rules for the appearance of specific goods in a trolley by a cash desk. Thus, the synonym for association analysis is market basket analysis [30]. Each rule found consists of a predecessor (body of the rule) and the consequent (head of the rule). The rule can be presented as i f   b o d y ,   t h e n   h e a d   o r   b o d y h e a d . Having a dataset comprising many cases consisting of their bodies and heads, it is possible to assess the meaning of the rule by three ratios called confidence ( c o n f ), support ( s u p ), and lift (marked with its full name). They can be calculated as follows:
c o n f = n b h n b
s u p = n b h N
l i f t = c o n f P ( h )
where
n b h
is the number of cases where the criteria for body (predecessor) are met and simultaneously the criterium (or criteria) for head are also met;
n b
is the number of cases where the criteria for body are met;
N
is the total number of cases in the database;
P ( h )
is the probability of appearing head meeting the criteria set for head.
This probability can be calculated as follows:
P ( h ) = n h N
where n h is the number of cases with heads meeting the criteria (set for heads). The rule with 100% confidence means that, every time a specific predecessor appears, then the specific consequent also always appears. This kind of rule is even more informative when there is a significant number of cases meeting the rule. Then, the support of the rule is relatively high (the total range of support values is (0, 1)). If the support is at a minimum, this means that there is only one case meeting the rule in the whole database of the cases. The lift has a secondary function. It protects against considering the rules (even of high confidence) for which the probability of a specific head is higher than the calculated confidence. If lift < 1, the rule is useless [28,29,30,31]. The importance of rules is further discussed in Section 3.1., where the total measure of the importance of rules is introduced. The body of the rule can be described by several features and conditions to be met, formulated with any logic expression (with OR, AND operators). That, and the simplicity of parameters describing each rule, allow association analysis to be used in a variety of applications. Nowadays, association analysis is still applied for the designed purpose ([32] as an example). However, smart applications can be found in several areas, e.g., for the following:
-
precipitation prediction [33];
-
insurance risk assessment [34];
-
traffic safety analysis [35,36,37];
-
assessment of construction project risk [27];
-
assessment of risk in construction disputes [38];
-
a variety of problems in biology [39,40,41];
-
preferences’ discovering in social sciences [42];
-
collusion detection in tender procedures [43];
-
quality management problem-solving in production [44].
The rule-finding processes have to be computer-aided as the number of rules is usually huge even if the database searched is not large. It is a common case where, within several thousand rules found, only several are meaningful.

2.2. The Analysed Case and Its Database

This paper is based on previous research that analyzed the studies on all projects of building express roads and highways completed in Poland between January 2009 and December 2013 [2,27]. Additional Polish and international literature research for possible reasons for delays in construction contracts was summarized in [2]. The result of the aforementioned research was the list of 142 possible reasons for delays. A huge number of them were reduced, mainly according to the fact that the moment of analysis took place before the choice of the contractor (by the client), before the start of building works. The final list is presented in Table 2 [27].
Label D is left for marking a delay. Its integer value is calculated for each project based on the following formula:
D i = { T i ( r ) T i ( p l ) 0 T i ( r ) > T i ( p l ) T i ( r ) T i ( p l )
where
  • T i ( p l ) is a planned duration of the project given in days;
  • T i ( r ) is an observed real duration of the project given in days;
  • i is an index of analyzed project.
The twelve factors listed in Table 2 that may influence the delay of the completion date of road construction projects can be categorized into three main groups by origin. That is, client-decision-dependent (B, C, E, H), contractor-dependent (A, G, L, M), or based on macroeconomic factors (I, J, K). Factor F arises from the technical matters and the standing of the national economy. The majority of data were provided by the Polish General Directorate for National Roads and Highways (GDDKiA) at the request of the Warsaw University of Technology. Macroeconomic factors were found in the Polish Central Statistical Office (GUS). For the real completion dates, approximately 500 websites were scraped. The data concerning the number of employees and the yearly sales of contractors were obtained commercially. The complete set of twelve feature values was completed for 139 projects, and only these were analyzed further in previous studies [27].

2.3. The Problem to Solve

As association analysis works well for dichotomous types of bodies and dichotomous types of head, the collected data (their types are presented in Table 2) as well as each type of body and head need to be divided into two subsets. In [27], the thresholds were assumed as median values. However, it is possible that, if other thresholds are set, the rules found can then be more informative. The problem is illustrated in Figure 2.

2.4. Tabu Search

Some practical problems in construction can be easily qualified as NP-hard (non-deterministic polynomial-time hard) problems. The time needed to solve these problems grows exponentially with the increase in the problem’s size [45]. This is why mathematical methods do not allow for finding solutions for complicated construction problems in an acceptable time. For the same reasons, metaheuristic algorithms seem to be the most appropriate measures for scheduling and task sequencing. These algorithms do not guarantee finding the optimal solution to the given problem; however, they are very useful when it comes to solving NP-hard problems because they allow for finding suboptimal solutions in an acceptable time [46]. Finding the number of features and the number of ranges (for each feature) proved to be such a combinatorial problem.
It was decided to use the tabu search algorithm. Its advantages have been proven in many scientific publications [47,48,49,50]. Like many other IT solutions used in various industries, it can be adopted to construction problems [51]. The basic idea behind this algorithm is to search the solution space by a sequence of moves [50]. In this sequence, some moves are considered tabu moves—they are forbidden. The TS algorithm avoids getting stuck in local optima by storing the information about previously checked solutions in the form of tabu lists. The list grows as the algorithm proceeds. However, when it reaches its maximum capacity, the oldest entries of the tabu list are overwritten by the new ones. The simplified tabu search pseudocode in Table 3 presents its principles. It was decided to use the tabu search algorithm to find the thresholds in association analysis, which provides an increase in the strength of the rules found. It is a new approach and has never been applied before.

3. Results

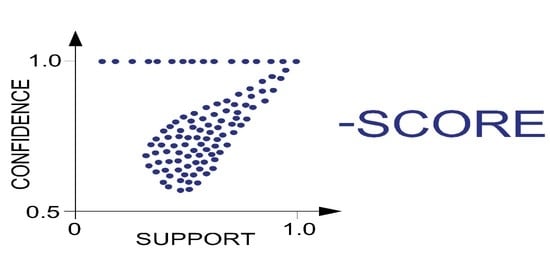
3.1. Assessing the Strength of Association Rules with 7-Score

Considering the three basic ratios describing the rules, i.e., confidence, support, and lift, the most powerful is confidence. If a certain type of predecessor appears, a certain type of a consequent appears too every time. The confidence of this kind of rule is 100%. This kind of information gathered by a user of association analysis is very strong. The collected data provide the user with a high likelihood of a certain result if the same type of predecessor appears again. However, not every rule of 100% confidence gives the same level of certainty of appearing to be a specified consequent. The three examples of phenomena that can be described with 100% confidence are presented in Figure 3.
As presented in Figure 3b, predicting the effect—dark green—based on this dataset seems more powerful than in the case presented in Figure 3a. There, the rule is based on one case only. It is unknown if the case is caused by the nature of the analyzed phenomenon, or if it has happened by chance. The rule seems to be the most powerful in the case presented in Figure 3c. Support calculated for the rule, for cases (a), (b), and (c), is 1/6, 3/6, and 5/6, respectively. It can be concluded that, for the rules of the same confidence, the more powerful (meaningful) is the rule with higher support. Then, the following question can be asked: which rule is stronger of the following two: rule 1: conf = 100% and sup = 33.3%, rule 2: conf = 75% and sup = 66.7%? To answer this, the large database should be considered. Then, if the rule of 100% confidence is supported by 33.3% of cases, it still a large number of cases where the appearance of a light green body always makes the head dark green. For much smaller databases being analyzed, it seems sufficient if support is higher than its minimum value, i.e., 1/N (where N is a total value of cases in the database). Minimum support means that the rule is based on one case meeting the conditions of the rule. It can be stated that, for the rules with support higher than the minimum of one, confidence is more meaningful than support. The rules of sup = 1/N should be excluded from the analysis.
The influence of lift on the strength of the rule should also be considered, as two rules of identical confidence and support can have different lifts (as presented in Figure 4).
Aiming at predicting a dark green head, based on a light green appearance, the rule for the dataset presented in Figure 4a seems to be a bit stronger, as the dark green head appears only if the light green body has appeared earlier. In case (b), dark green heads can also appear for bodies other than light green ones, but in case (a), the rule gives the full explanation for the appearance of the dark green bodies. For both cases, conf = 100% and sup = 33.3%; however, lift = 3 for (a) and lift = 1.2 for (b). It can be concluded that, for two rules of the same confidence and the same support, the stronger is the rule with the higher lift. When comparing the rules of different confidences and different supports, considering a lift seems unreasonable as—as discussed earlier—the meaning of confidence is higher than the meaning of support.
The next issue is assessing the rules of low confidence. Please observe the two examples illustrated in Figure 5.
In case (a), the heads are multi-colored and the rule—if light green, then dark green—seems meaningless. In case (b), where the head is dichotomous, it seems that finding the opposite rule (if light green, then blue) brings a better result (conf = 80%, sup = 66.7%, lift = 1). The same result will be achieved in case (a) if the rule will be stated as follows: if light green, then not dark green. It can be concluded that the rules of low confidence are meaningless. To assess the strength of rules, the following aim function is created:
strength   of   rule = lift + N 2 × sup + N 2 × conf
where N is for the total number of cases in a database. Equation (6) considers the following assumptions. Assumption 1:
I ( sup ) > I ( lift )
where I is a function of the importance of the rule. Equation (7) is achieved by making the sum component of support equal or higher than lift, as follows:
sup × N = n bh
where n b h is the number of cases meeting the rule and, as the maximum lift is N and the minimum support is 1 N , the following Equation is met:
N 2 × sup lift
Meeting assumption 2 presented in Equation (10), using Equation (6),
I ( c o n f ) > I ( s u p )
is achieved by multiplying the confidence by the same number as the support, i.e., by N 2 , as the confidence is greater than the support for each rule (as the number of bodies meeting the rule is always lower than N ). Equation (6) for the strength of rule introduces possible cases where the joint impact of lift and support is greater than the impact of confidence on the strength of the rule. These kinds of cases are partially limited by excluding from the analysis the cases of low confidence (below 50%). To observe how the rules are assessed, the exemplary database is created of 10 bodies and 10 heads. The number of bodies meeting the rule n b changes from 1 to 9, and the number of heads meeting the rule n h also changes from 1 to 9. The number of cases meeting the rule n b h changes from 1 to a number defined as m i n ( n b ,   n h ) . All possible combinations are assumed, and all rules are found in the created cases. Confidence, support, lift, and the strengths of the rules are calculated. From the full set of rules, regardless of the rules of confidence lower than 0.5, the cases with lift lower than 1 are excluded too. When the lift is lower than 1, this means that, when predicting the head, the better result can be achieved by applying the probability of appearance of a specific head, rather than basing it on a specific body appearance. The remaining data and results (scores) are presented in Appendix A Table A1. As it is difficult to present a 4-dimentional chart in a 2D figure, Figure 6 is prepared. Support and confidence are on the horizontal axes and 7-Score values are on the vertical axis.
It can be observed that, for several pairs of identical conf and sup, there are several values of 7-Score. This is because of the influence of lift—which is also considered in 7-Score and in Figure 6. Lift differentiates 7-Score for the cases of the same support and confidence, as was assumed while the formula for 7-Score was created. Observing Figure 6 and, especially, Figure 7 i.e., the 2-dimentional scatter-plot for support and confidence, the shape of the 7 sign can be recognized—the basis of the name of the proposed method for scoring the strength of rules.
The database assumed to create the 7-Score is 10 × 10, considering that
-
every combination of n b , n h , n b h is assumed for creating the exemplary database and rule finding (presented in Table A1 and Figure 6 and Figure 7);
-
the values of sup and conf are always ≤1.
It can be stated that, for more numerous databases, the general shape of the scatter-plot will remain unchanged. It will be denser, especially between the points of very similar confidence (as the impact of confidence on the 7-Score is the highest). The plane presented in Figure 8 is an approximation of the 7-Score of the rules; however, it is presented to better explain the areas of the highest importance of the rules.
The aim of introducing the 7-Score measure is to compare the rules found based on a specific database (comprising bodies and heads) concerning a specific, analyzed phenomenon. For that reason, it can be used as is (not as a percentage of the highest 7-Score value). In order to compare the rules calculated for the databases of a different size, the relative 7-Score measure should be applied, as the values of 7-Score defined in (1) strongly depend on N , i.e., on the number of cases in a database.

3.2. Solving the Analysed Case

The previous results presented in [27] were very promising; however, only median values were used as bodies’ thresholds. Testing different thresholds even for 139 projects proved to be a complex combinatorial problem, with up to 7.5 × 1031 potential variants. However, finding the right solution could improve the support and confidence parameters, thus providing better outcomes for the clients. This is why it was decided to use a metaheuristic algorithm. Such an approach proved to be very useful and might be used even for bigger databases.
Metaheuristic optimization of thresholds was done for three cases: two best sets of criteria established by [27] ( C r E J L and A E K ), and for all 12 criteria from Table 2. The best results are presented below in Table 4, Table 5 and Table 6. The presented results were obtained with the use of commercial software OptQuest® Engine package, OptTek Systems, Inc., based on the tabu search algorithm. However, additional tests showed that similar results can be obtained by other applications of tabu search. The decision variables were the thresholds of criteria, and the objective function (SCORE) is as follows:
Max :   SCORE = lift + N 2 × sup + N 2 × conf
The results are presented in following Table 4, Table 5 and Table 6 together with the comparison to the results achieved in the previous study [27].
The rule wherein all features of the body are considered is excluded from further analysis according to its low support (even if this formula is found—as in the two other rules—with the use of metaheuristic). This makes its 7-Score much lower than the 7-Score of the two other rules. The maximum informativeness is found for the following rules:
-
if (Cr and E and J and L), then D; that is, if (planned duration is lower than 1126 days and the contract is not “design & built” and price index in the construction industry is decreasing and the contractor has the form of consortium), then the contract is delayed;
-
if (A and E and K), then D; that is, if (the contract value is over 5.77 million PLN and the contract is not “design & built” and the total sales in Polish construction industry is decreasing), then the contract is delayed.

4. Discussion

The most promising two rules for the appearance of delayed completion of construction were found in [27] with the use of association analysis. The bodies of these rules consist of several parameters, and it was decided to make their value dichotomous. The same is made with the head, i.e., the size of delay. Through the use of the tabu search algorithm, the settings of the thresholds (necessary to make the sets of values dichotomous) are found, making the two rules (if Cr-R-J-L, then D; if A-E-K, then D) the most informative. As can be seen in the tables presented (Table 4 and Table 5), the determination of thresholds using the metaheuristic algorithm significantly improved the parameters describing the rules (in comparison with the median values used in [27]). There was a drastic improvement in the support for the rules in every case. Moreover, the scores for each case were significantly higher. The results obtained using the tabu search algorithm are significantly better than those obtained in the traditional way with the use of median values. The proposed innovative solution may be particularly useful when analyzing larger databases, where it is even more difficult to select the threshold levels. As already mentioned, metaheuristic algorithms are currently the best way to find solutions to particularly complex combinatorial problems. The results of the study only confirmed this thesis.
The assessment of the level of informativeness of the rules is possible because of the created measure named 7-Score. A significant improvement is achieved. For the rule with the body Cr-E-J-L, the confidence is lowered from 100% to 90%. However, support for these rules is increased from 8.5% to 25.9%. This means that there are three times more cases supporting the rule. Despite that the confidence and the lift are slightly lowered, owing to the significant support increase, 7-Score is approximately 10% higher than for median thresholds. For the most informative rule with A-E-K body, the increase is noted for both support (22.3% to 50.4%) and confidence (75.6% to 84.3%). Despite the lowered lift (1.460 to 1.046), 7-Score is more than 37% higher (up to 2,239,305). For these two very informative rules, the same threshold was found—zero. The head of this rule is defined as follows: the delay of a construction completion greater than the threshold. It has to be stated that there are several contracts (cases) in the database completed on time (not delayed, i.e., delay = 0). Considering the values of the thresholds found of 5,765,055.35 for A, 0 for E, and 0 for K, the rule if A-E-K, then D brings the following information based on the passed construction contract:
If:
-
the contract value was above 5.77 million PLN,
-
the contract scope was to build (design provided by a client), and
-
the total sales of the Polish construction industry were decreasing (year to year),
then the completion of this type of contract was delayed with conf = 90%, sup = 25.9%, and lift = 1.191. This is to emphasize that such a calculation can be done before any new contract that is ordered and signed. Shifting the threshold for the head (the size of delay) from 0 to its maximum value, the set of results (conf, sup. lift, 7-Score) can be achieved for the rule if A-E-K, then the delay greater than the threshold value. This scenario is presented in Figure 9.
It can be observed that, the higher the threshold of the head, the lower the confidence in the delay appearance being greater than the threshold. It is to be noted that the thresholds of the body parameters (A, E, K) are left on the unchanged levels (as found for the highest 7-Score). As a natural result of shifting to the right, the thresholds of the head, supports, and 7-Scores lower, with the head threshold increasing. The full set of parameters of the rules (for the threshold D of the head being set from 0 to 800) is presented in Table 7 (and Table 8 for Cr-E-J-L body).
Let us analyze the opposite rule, i.e., if A-E-K, then delay is not greater than the threshold for the head. The number of bodies meeting the original rule n b remains unchanged in the opposite rule. The parameters of the opposite rule are calculated just for the unchanged body. It can be written as follows:
c o n f ( b h ( ) ) = n b h ( ) n b
where
-
h ( ) is the opposite side of the dichotomous head;
-
n b h ( ) is the number of cases meeting the opposite rule (where the head is inverted).
There are several (or even hundreds of) types of bodies, but only one type of body is analyzed. There are n b bodies of this kind. From this subset, only n h b bodies meet the rule, i.e., the number of heads is greater than the threshold. This means that the rest of the subset meets rule that the head values are not greater the threshold. Thus, the number of bodies meeting the inverted head can be calculated as follows:
n b h ( ) = n b n b h
Considering Equation (12),
c o n f ( b h ( ) ) = n b n b h n b = 1 n b h n b = 1 c o n f ( b h )
The confidences of the rules found for the same body and upper and lower part of a dichotomous head are complementary, i.e., their sum equals 1. The confidence of the appearance of delay in completion of a construction contract can be read as a risk of the delay appearance being greater than the threshold (number of days). This kind of confidence has identical features to risk (risk as a probability of appearing unfavorable conditions or phenomena). Their values are 0 to 1. The probability of favorable conditions added to risk gives 1, and is identical for confidences for original and inverted heads. Therefore, the risk values (of the delay appearance being greater than a certain number of days) can be read from Figure 9. It is consistent with common sense. The greater the delay, the lower possibility of its occurrence. However, it must be emphasized that the content of Figure 9 is created based on real data.
There is also another rule found based on the Cr-E-J-L body, and it has the same head. The confidences for these two rules are presented in Figure 10.
Confidence is a discrete function, as the nominator and denominator (defining confidence) are discrete by nature. However, confidence can be calculated for the continuous threshold (time), but is useless for the cases from the construction industry. Despite that, the lines in Figure 10 are presented as continuous. The blue line based on A-E-K body is continuous for the whole domain presented in Figure 9 and Figure 10. The orange one (based on the Cr-E-J-L body) has two breaks (discontinuities). For days ranging from 370 to 386 and from 495 to 524, as the lift calculated for these rules is below 1, the rules are useless. There are no cases supporting this rule being delayed for more than 533 days, so the orange line ends there. In order to read the risk of delay greater than a certain threshold (given in days) and if there is more than one body for the rules found (as in Figure 10), it is recommended to use the confidence of a higher 7-Score. The calculated 7-Scores are higher for the rules based on the A-E-K body (blue line), except for the range from day 159 to day 196, as presented in Figure 11.
This range is marked with black vertical lines in Figure 10 and Figure 11. There, the rule with the other body (Cr-E-J-L) should be used (confidence read based on the orange line that has a higher 7-Score in this range).
The traditional approach to a construction contract risk estimation is based on statistics and on experts’ opinions. It requires the experience of experts gained before a new assessment. The proposed method omits involving human’s opinions. It is purely based on data. The experience—that is, past construction contracts completed—is necessary, but the risk is calculated based on formulas, algorithms, and a set of data collected. The higher the experience, i.e., the more cases serving as a source data, the more reliable the risk estimation. This statement points to the possible weakness of the proposed method. Analysis based on small databases can produce unreliable risk estimation. The other limitation of the invented method is the necessity of basing the risk estimation on the information gathered from the construction contracts of a similar scope of works. Assessing the risk of a road construction contract based on several completed apartment buildings is irrelevant and improper. Thus, the method can be applied by specialized contractors or clients (e.g., in the road construction, as in the analyzed case). Thirdly, the new, analyzed contract may not meet the criteria of the predecessors of the rules found to be the most informative. Then, the risk assessment is not possible. Considering the limitations of the invented method, it can be stated that the traditional approach to risk assessment (also based on experts’ opinions) and the invented method should be used complementarily. If it is impossible to assess the risk with the invented method (owing to the limitation described above), the traditional method of risk assessment should be applied.

5. Conclusions

A typical software or a software package enables one to search for the rules in a database. The proposed method extends the scope of analysis by modifying the dataset. If values of any feature of a predecessor or a consequent are continuous or discrete, it is proposed to make them binary, and search—for a certain rule—for the set of thresholds dividing features’ values into 0 and 1 (see Figure 2). The aim is to find the combination of these thresholds making the analyzed rule the most informative. As the three basic ratios (sup, conf, and lift) describe every rule, based on them, the measure is created and named as 7-Score. It was also necessary, owing to the need for applying the selected metaheuristic algorithm, to find the setup of thresholds maximizing the 7-Score for the analyzed rule. The results are superior when compared with the previous study. Moreover, the most informative rules are for the threshold of a construction project delay set to 0. As there are also projects in the database that were not delayed, it was decided to shift the threshold of the consequent up and observe the confidence (and other parameters) of the rule (or the set of the rules). It is concluded that the read-out is the construction risk of a delay in completion greater than the threshold (given in days). This risk decreases together with an increasing number of days. The 7-Score (the level of informativeness of the rule) decreases too. It is proved that, together with the threshold rising, the opposite rule, i.e., based on inverted consequent, is complementary to the basic rule. The sum of their confidences is 1. It can be read that the likelihood of completing a construction project (that meets the conditions of the predecessor) with the delay not greater than the threshold rises as the threshold increases. This innovative method of assessing the construction risk can be applied by clients and contractors. The results depend on the quality and size of the database being analyzed. The quality of data also refers to types of features creating the predecessor. They will be different for a contractor and for a client. Moreover, the consequent can describe a cost overrun, not exclusively delay. The invented method of risk assessment will be developed. The presented method of risk assessment is more accurate when more past cases are collected in the database. A given entity (a client or a contractor) with a rather short business history cannot expect precise quantitative risk estimations with the invented method. It is recommended to apply it to assess the risk of a contract for similar types of works. Despite that the type of contracted works can serve as an independent variable, the results will then be based on the limited number of cases. This lowers the accuracy of the method. However, the invented measure of the informativeness of association rules, i.e., 7-Score, can be broadly applied if the market basket analysis is applied.

Author Contributions

Conceptualization, H.A. and J.R.; methodology, H.A. and J.R.; software, J.R.; validation, H.A., J.R. and A.F.; formal analysis, A.F.; resources, H.A.; data curation, H.A., J.R. and A.F.; writing—original draft preparation, H.A. and J.R.; writing—review and editing, A.F. and J.R.; visualization H.A. and A.F.; supervision, A.F. and J.R.; project administration, A.F.; funding acquisition, H.A. All authors have read and agreed to the published version of the manuscript.

Funding

This research received no external funding.

Institutional Review Board Statement

Not applicable.

Informed Consent Statement

Not applicable.

Data Availability Statement

The database is published in [2]. As there is no electronic version of the Ph.D. thesis, data are available on request.

Conflicts of Interest

The authors declare no conflict of interest.

Appendix A

Table A1. Parameters and scores of the rules for the 10 × 10 database.
Lbl n b n h n b h SupConfLift7-Score
19990.911.111191.1
28880.811.25181.3
38980.811.111181.1
47770.711.429171.4
57870.711.25171.3
67970.711.111171.1
79880.80.8891.111170
86660.611.667161.7
96760.611.429161.4
106860.611.25161.3
116960.611.111161.1
128770.70.8751.25158.8
138870.70.8751.094158.6
145550.512152
155650.511.667151.7
165750.511.429151.4
175850.511.25151.3
185950.511.111151.1
199770.70.7781.111148.9
207660.60.8571.429147.1
217760.60.8571.224146.9
227860.60.8571.071146.8
234440.412.5142.5
244540.412142
254640.411.667141.7
264740.411.429141.4
274840.411.25141.3
284940.411.111141.1
298660.60.751.25136.3
308760.60.751.071136.1
316550.50.8331.667135
326650.50.8331.389134.7
336750.50.8331.19134.5
346850.50.8331.042134.4
353330.313.333133.3
363430.312.5132.5
373530.312132
383630.311.667131.7
393730.311.429131.4
403830.311.25131.3
413930.311.111131.1
429660.60.6671.111127.8
432220.215125
442320.213.333123.3
457550.50.7141.429122.9
467650.50.7141.190122.6
472420.212.5122.5
487750.50.7141.020122.4
492520.212122
505440.40.82122
512620.211.667121.7
525540.40.81.6121.6
532720.211.429121.4
545640.40.81.333121.3
552820.211.25121.3
565740.40.81.143121.1
572920.211.111121.1
581110.1110120
591210.115115
608550.50.6251.25113.8
618650.50.6251.042113.5
621310.113.333113.3
631410.112.5112.5
641510.112112
651610.111.667111.7
661710.111.429111.4
671810.111.25111.3
681910.111.111111.1
696440.40.6671.667108.3
706540.40.6671.333108
716640.40.6671.111107.8
724330.30.752.5107.5
734430.30.751.875106.9
749550.50.5561.111106.7
754530.30.751.5106.5
764630.30.751.25106.3
774730.30.751.071106.1
787440.40.5711.42998.6
797540.40.5711.14398.3
805330.30.6292
815430.30.61.591.5
825530.30.61.291.2
833220.20.6673.33390
843320.20.6672.22288.9
853420.20.6671.66788.3
863520.20.6671.33388
873620.20.6671.11187.8

References

  1. Anysz, H. Managing Delays in Construction Projects Aiming at Cost Overrun Minimization. IOP Conf. Ser. Mater. Sci. Eng. 2019, 603, 032004. [Google Scholar] [CrossRef]
  2. Anysz, H. Wykorzystanie Sztucznych Sieci Neuronowych Do Oceny Możliwości Wystąpienia Opóźnień w Realizacji Kontraktów Budowlanych. Ph.D. Thesis, Oficyna Wydawnicza PW, Warsaw, Poland, 2017. [Google Scholar] [CrossRef]
  3. Kulejewski, J.; Ibadov, N.; Rosłon, J.; Zawistowski, J. Cash Flow Optimization for Renewable Energy Construction Projects with a New Approach to Critical Chain Scheduling. Energies 2021, 14, 5795. [Google Scholar] [CrossRef]
  4. Gluszak, M.; Leśniak, A. Construction Delays in Clients Opinion–Multivariate Statistical Analysis. Procedia Eng. 2015, 123, 182–189. [Google Scholar] [CrossRef] [Green Version]
  5. Ibadov, N. Determination of the Risk Factors Impact on the Construction Projects Implementation Using Fuzzy Sets Theory. Acta Phys. Pol. A 2016, 130, 107–111. [Google Scholar] [CrossRef]
  6. Juszczyk, M. A concise review of methods of construction works duration assessment. Tech. Trans. 2014, 2014, 193–202. [Google Scholar]
  7. Krzemiński, M. KASS v.2.2. Scheduling Software for Construction with Optimization Criteria Description. Acta Phys. Pol. A 2016, 130, 1439–1442. [Google Scholar] [CrossRef]
  8. Ibadov, N. Selection of Construction Project Taking into Account Technological and Organizational Risk. Acta Phys. Pol. A 2017, 132, 974–977. [Google Scholar] [CrossRef]
  9. Leśniak, A. Classification of the Bid/No Bid Criteria–Factor Analysis. Arch. Civ. Eng. 2015, 61, 79–90. [Google Scholar] [CrossRef] [Green Version]
  10. Ibadov, N.; Kulejewski, J. The assessment of construction project risks with the use of fuzzy sets theory. Czas. Tech. 2014, 2014, 175–182. [Google Scholar]
  11. Chatterjee, K.; Zavadskas, E.K.; Tamosaitiene, J.; Adhikary, K.; Kar, S. A Hybrid MCDM Technique for Risk Management in Construction Projects. Symmetry 2018, 10, 46. [Google Scholar] [CrossRef] [Green Version]
  12. Kowalski, J.; Połoński, M.; Lendo-Siwicka, M.; Trach, R.; Wrzesiński, G. Method of Assessing the Risk of Implementing Railway Investments in Terms of the Cost of Their Implementation. Sustainability 2021, 13, 13085. [Google Scholar] [CrossRef]
  13. Nawaz, A.; Waqar, A.; Shah, S.A.R.; Sajid, M.; Khalid, M.I. An innovative framework for risk management in construction projects in developing countries: Evidence from Pakistan. Risks 2019, 7, 24. [Google Scholar] [CrossRef] [Green Version]
  14. PMI. Guide to the Project Management Body of Knowledge (PMBoK Guide); Project Management Institute: Newtown Square, PA, USA, 2019. [Google Scholar]
  15. Yaseen, Z.M.; Ali, Z.H.; Salih, S.Q.; Al-Ansari, N. Prediction of Risk Delay in Construction Projects Using a Hybrid Artificial Intelligence Model. Sustainability 2020, 12, 1514. [Google Scholar] [CrossRef] [Green Version]
  16. Wang, S.Q.; Dulaimi, M.F.; Aguria, M.Y. Risk management framework for construction projects in developing countries. Constr. Manag. Econ. 2004, 22, 237–252. [Google Scholar] [CrossRef]
  17. Schieg, M. Risk Management in Construction Project Management. J. Bus. Econ. Manag. 2006, 7, 77–83. [Google Scholar] [CrossRef] [Green Version]
  18. Choudhry, R.M.; Iqbal, K. Identification of Risk Management System in Construction Industry in Pakistan. J. Manag. Eng. 2013, 29, 42–49. [Google Scholar] [CrossRef]
  19. Taroun, A.; Yang, J.-B. A DST-based approach for construction project risk analysis. J. Oper. Res. Soc. 2013, 64, 1221–1230. [Google Scholar] [CrossRef]
  20. Serpella, A.F.; Ferrada, X.; Howard, R.; Rubio, L. Risk management in construction projects: A knowledge-based approach. Procedia Soc. Behav. Sci. 2014, 119, 653–662. [Google Scholar] [CrossRef] [Green Version]
  21. Ebrat, M.; Ghodsi, R. Construction project risk assessment by using adaptive-network-based fuzzy inference system: An empirical study. KSCE J. Civ. Eng. 2014, 18, 1213–1227. [Google Scholar] [CrossRef]
  22. Iqbal, S.; Choudhry, R.M.; Holschemacher, K.; Ali, A.; Tamošaitienė, J. Risk management in construction projects. Technol. Econ. Dev. Econ. 2015, 21, 65–78. [Google Scholar] [CrossRef]
  23. Vafadarnikjoo, A.; Mobin, M.; Firouzabadi, S.M.A.K. An intuitionistic fuzzy-based DEMATEL to rank risks of construction projects. In Proceedings of the 2016 International Conference on Industrial Engineering and Operations Management, Kuala Lumpur, Malaysia, 8–10 March 2016; pp. 23–25. [Google Scholar]
  24. Kao, C.H.; Huang, C.H.; Hsu, M.S.C.; Tsai, I.H. Success factors for Taiwanese contractors collaborating with local Chinese contractors in construction projects. J. Bus. Econ. Manag. 2016, 17, 1007–1102. [Google Scholar] [CrossRef] [Green Version]
  25. Ahmadi, M.; Behzadian, K.; Ardeshir, A.; Kapelan, Z. Comprehensive risk management using fuzzy FMEA and MCDA techniques in highway construction projects. J. Civ. Eng. Manag. 2016, 23, 300–310. [Google Scholar] [CrossRef] [Green Version]
  26. Li, J.; Wang, J.; Xu, N.; Hu, Y.; Cui, C. Importance Degree Research of Safety Risk Management Processes of Urban Rail Transit Based on Text Mining Method. Information 2018, 9, 26. [Google Scholar] [CrossRef] [Green Version]
  27. Anysz, H.; Buczkowski, B. The association analysis for risk evaluation of significant delay occurrence in the completion date of construction project. Int. J. Environ. Sci. Technol. 2018, 16, 5369–5374. [Google Scholar] [CrossRef] [Green Version]
  28. Morzy, T. Eksploracja Danych. Metody i Algorytmy; Wydawnictwo Naukowe PWN: Warsaw, Poland, 2013. [Google Scholar]
  29. Larose, D.T.; Larose, C.D. Discovering Knowledge in Data; John Wiley & Sons: Hoboken, NJ, USA, 2016; ISBN 978-81-265-5834-6. [Google Scholar]
  30. Statsoft Electronic Statistics Textbook. Available online: https://www.statsoft.pl/textbook/stathome.html (accessed on 20 November 2021).
  31. Hahsler, M.; Grün, B.; Hornik, K. Introduction to arules–Mining Association Rules and Frequent Item Sets. SIGKDD Explor 2007, 4, 1–28. [Google Scholar]
  32. Ünvan, Y.A. Market basket analysis with association rules. Commun. Stat.-Theory Methods 2020, 50, 1615–1628. [Google Scholar] [CrossRef]
  33. Ahmed, A.M.; Bakar, A.A.; Hamdan, A.R.; Abdullah, S.M.S.; Jaafar, O. Sequential Pattern Discovery Algorithm for Malaysia Rainfall Prediction. Acta Phys. Pol. A 2015, 128, B324–B326. [Google Scholar] [CrossRef]
  34. Roodpishi, M.V.; Nashtaei, R.A. Market basket analysis in insurance industry. Manag. Sci. Lett. 2015, 5, 393–400. [Google Scholar] [CrossRef]
  35. Geurts, K.; Wets, G.; Brijs, T.; Vanhoof, K. Profiling of High-Frequency Accident Locations by Use of Association Rules. Transp. Res. Rec. J. Transp. Res. Board 2003, 1840, 123–130. [Google Scholar] [CrossRef]
  36. Xu, C.; Bao, J.; Wang, C.; Liu, P. Association rule analysis of factors contributing to extraordinarily severe traffic crashes in China. J. Saf. Res. 2018, 67, 65–75. [Google Scholar] [CrossRef]
  37. Anysz, H.; Włodarek, P.; Olszewski, P.; Cafiso, S. Identifying factors and conditions contributing to cyclists’ serious accidents with the use of association analysis. Arch. Civ. Eng. 2021, LXVII, 197–211. [Google Scholar] [CrossRef]
  38. Anysz, H.; Apollo, M.; Grzyl, B. Quantitative Risk Assessment in Construction Disputes Based on Machine Learning Tools. Symmetry 2021, 13, 744. [Google Scholar] [CrossRef]
  39. Shi, A.; Mou, B.; Correll, J.C. Association analysis for oxalate concentration in spinach. Euphytica 2016, 212, 17–28. [Google Scholar] [CrossRef]
  40. Klimanek, T.; Szymkowiak, M.; Józefowski, T. Analiza koszykowa w badaniu zjawiska niepełnosprawności biologicznej. Pr. Nauk. Uniw. Ekon. Wrocławiu 2018, 95–105. [Google Scholar] [CrossRef]
  41. Atluri, G.; Gupta, R.; Fang, G.; Pandey, G.; Steinbach, M.; Kumar, V. Association Analysis Techniques for Bioinformatics Problems. In Bioinformatics and Computational Biology; Rajasekaran, S., Ed.; Springer: Berlin/Heidelberg, Germany, 2009; Volume 5462, pp. 1–13. ISBN 978-3-642-00726-2. [Google Scholar]
  42. Lasek, M.; Pęczkowski, M. Analiza Asocjacji I Reguły Asocjacyjne W Badaniu Wyborów Zajęć Dydaktycznych Dokonywanych Przez Studentów. Zastosowanie Algorytmu Apriori. Ekon. J. 2013, 34, 67–88. [Google Scholar]
  43. Anysz, H.; Foremny, A.; Kulejewski, J. Comparison of ANN Classifier to the Neuro-Fuzzy System for Collusion Detection in the Tender Procedures of Road Construction Sector. IOP Conf. Ser. Mater. Sci. Eng. 2019, 471, 112064. [Google Scholar] [CrossRef]
  44. Nicał, A.; Anysz, H. The quality management in precast concrete production and delivery processes supported by association analysis. Int. J. Environ. Sci. Technol. 2020, 17, 577–590. [Google Scholar] [CrossRef]
  45. Rosłon, J. The multi-mode resource constrained project scheduling problem in construction. State of the art review and research challenges. Tech. Trans. 2017, 5, 67–74. [Google Scholar]
  46. Rosłon, J.; Zawistowski, J. Construction Projects’ Indicators Improvement Using Selected Metaheuristic Algorithms. Procedia Eng. 2016, 153, 595–598. [Google Scholar] [CrossRef] [Green Version]
  47. Sroka, B.; Rosłon, J.; Podolski, M.; Bożejko, W.; Burduk, A.; Wodecki, M. Profit optimization for multi-mode repetitive construction project with cash flows using metaheuristics. Arch. Civ. Mech. Eng. 2021, 21, 1–17. [Google Scholar] [CrossRef]
  48. Tang, F.; Zhou, H.; Wu, Q.; Qin, H.; Jia, J.; Guo, K. A Tabu Search Algorithm for the Power System Islanding Problem. Energies 2015, 8, 11315–11341. [Google Scholar] [CrossRef] [Green Version]
  49. Choi, J.; Xuelei, J.; Jeong, W. Optimizing the Construction Job Site Vehicle Scheduling Problem. Sustainability 2018, 10, 1381. [Google Scholar] [CrossRef] [Green Version]
  50. Fridgeirsson, T.V.; Rosłon, J. Optimisation of Construction Processes; Civil Engineering Faculty of Warsaw, University of Technology: Warsaw, Poland, 2017. [Google Scholar]
  51. Böde, K.; Różycka, A.; Nowak, P. Development of a Pragmatic IT Concept for a Construction Company. Sustainability 2020, 12, 7142. [Google Scholar] [CrossRef]
Figure 1. The sequence of the findings introduced and presented in the article.
Applsci 12 00844 g001
Figure 2. The problem: how to set the thresholds (red and blue) to allow finding the most powerful and most informative rules (if body then head) based on a specific database.
Applsci 12 00844 g002
Figure 3. Three different exemplary datasets (ac) with the rules of the same confidence of 100%. The rule: if light green, then dark green.
Applsci 12 00844 g003
Figure 4. Two different exemplary datasets (a,b) with the rules of the same confidence of 100% and support of 33.3%. The rule: if light green, then dark green.
Applsci 12 00844 g004
Figure 5. Two different exemplary datasets (a,b) with the rules of the same confidence of 20% and support of 16.7%, and lift of 1. The rule: if light green, then dark green.
Applsci 12 00844 g005
Figure 6. 7-Score values are presented for every combination of important rules presented in Table A1.
Applsci 12 00844 g006
Figure 7. Two-dimensional scatterplot of sup and conf for all rules presented in Appendix A Table A1.
Applsci 12 00844 g007
Figure 8. The approximate plane of 7-Score values.
Applsci 12 00844 g008
Figure 9. The confidence of the rule if A-E-K, then D for different number days as the threshold of the head (delay).
Applsci 12 00844 g009
Figure 10. The confidences of the rules for A-E-K and CrEJL for different numbers of days as the threshold of the head (delay).
Applsci 12 00844 g010
Figure 11. The 7-Score values of the rules for A-E-K and Cr-E-J-L for different numbers of days as the threshold of the head (delay).
Applsci 12 00844 g011
Table 1. Sample risk matrix of a construction project [2].
The Likelihood of a Hazard Occurring
Small
(0–33%)
Medium
(34–66%)
Large
(67–100%)
Consequences of the threat to the projectSmallProtests of
environmentalists
Protests of the local populationUnfavorable contracts with contractors
MediumChanges in regulations
Lack of renewable
resources
Lack of non-renewable resources
Construction
equipment failure
Interruptions in access to the media
Availability of key employees
Low performance of work teams
Late delivery of materials
LargeNo building permit
Investor’s financial problems
Bad weather conditions
Design errors
Loss of financial liquidity
Lack of funds
Subcontractor errors
Table 2. Possible causes of delays and their values [28].
IDThe Cause of DelayValues
AValue of worksrational number (in PLN)
BLength of the section builtrational number (in km)
CPlanned duration of the projectinteger number (in days)
EProject scopebinary: design & build = 1;
build = 0
FProject typebinary: build = 1; modernize etc. = 0
GThe total, average number of employees employed by contractor 1integer number (no. of persons)
HHalf of the year of works commencementbinary: first half = 0;
second half = 1
IThe trend of unemployment rate in Poland 2binary: decreasing = 0;
increasing = 1
JThe trend of price index in Polish construction industry 2binary: decreasing = 0;
increasing = 1
KThe trend of total sales in Polish construction industry 2binary: decreasing = 0;
increasing = 1
LNumber of partners in consortium (acting as contractor)integer number
MSummarized yearly total sales of consortium partners 1rational number (in PLN)
1 Calculated for the year preceding the commencement of works. 2 Calculated year to year (the year preceding the commencement of works, to the year before).
Table 3. Simplified tabu search pseudocode.
Line of CodeCode
1sBest = s0
2bestCandidate = s0
3tabuList = []
4tabuList.push(s0)
5repeat (loop)
6sNeighborhood ← getNeighbors(bestCandidate)
7for (sCandidate in sNeighborhood)
8if ((not tabuList.contains(sCandidate)) and
(fitness(sCandidate) > fitness(bestCandidate)))
9bestCandidate = sCandidate
10end
11end
12if (fitness(bestCandidate) > fitness(sBest))
13sBest = bestCandidate
14end
15tabuList.push(bestCandidate)
16if (tabuList.size > maxTabuSize)
17tabuList.removeFirst()
18end
19until stopping-criteria satisfied
20return sBest
Table 4. Optimization results for criteria set Cr—E—J—L.
Support (%)Confidence (%)LiftScoreCase
8.61002.0442,098,263Median threshold
25.9901.1912,239,305Metaheuristic
Table 5. Optimization results for criteria set A—E—K.
Support (%)Confidence (%)LiftScoreCase
22.375.61.4601,891,527Median threshold
50.484.31.0662,602,540Metaheuristic
Table 6. Optimization results for all (presented in Table 2) criteria considered as the predecessor.
Support (%)Confidence (%)LiftScoreCase
----Median threshold
5.8100.01.3902,044,163Metaheuristic
Table 7. Parameters of the rule with A-E-K body calculated for several thresholds of delay.
Support (%)Confidence (%)LiftScoreD
50.4%83.3%1.03426,2050
37.4%61.9%1.19519,467100
27.3%45.2%1.33814,226200
16.5%27.4%1.3128611300
7.9%13.1%1.3004119400
5.8%9.5%1.2032996500
4.3%7.1%1.2412247600
2.9%4.8%1.6551499700
1.4%2.4%3.310752800
Table 8. Parameters of the rule with Cr-E-J-L body calculated for several thresholds of delay.
Support (%)Confidence (%)LiftScoreD
26.6%92.5%1.14823,0160
20.1%70,0%1.35117,418100
15.1%52.5%1.55313,064200
7.9%27.5%1.3186844300
3.6%12.5%1.2413111400
2.2%7.5%0.9481867500
0.7%2.5%0.434622600
0.0%0.0%00700
0.0%0.0%00800
Publisher’s Note: MDPI stays neutral with regard to jurisdictional claims in published maps and institutional affiliations.

