
Evaluation of the Strength Characteristics of Silty-Clayey Soils during Freezing-Thawing Cycles

 ,
, 
 ,
,  and
and
Abstract
:1. Introduction
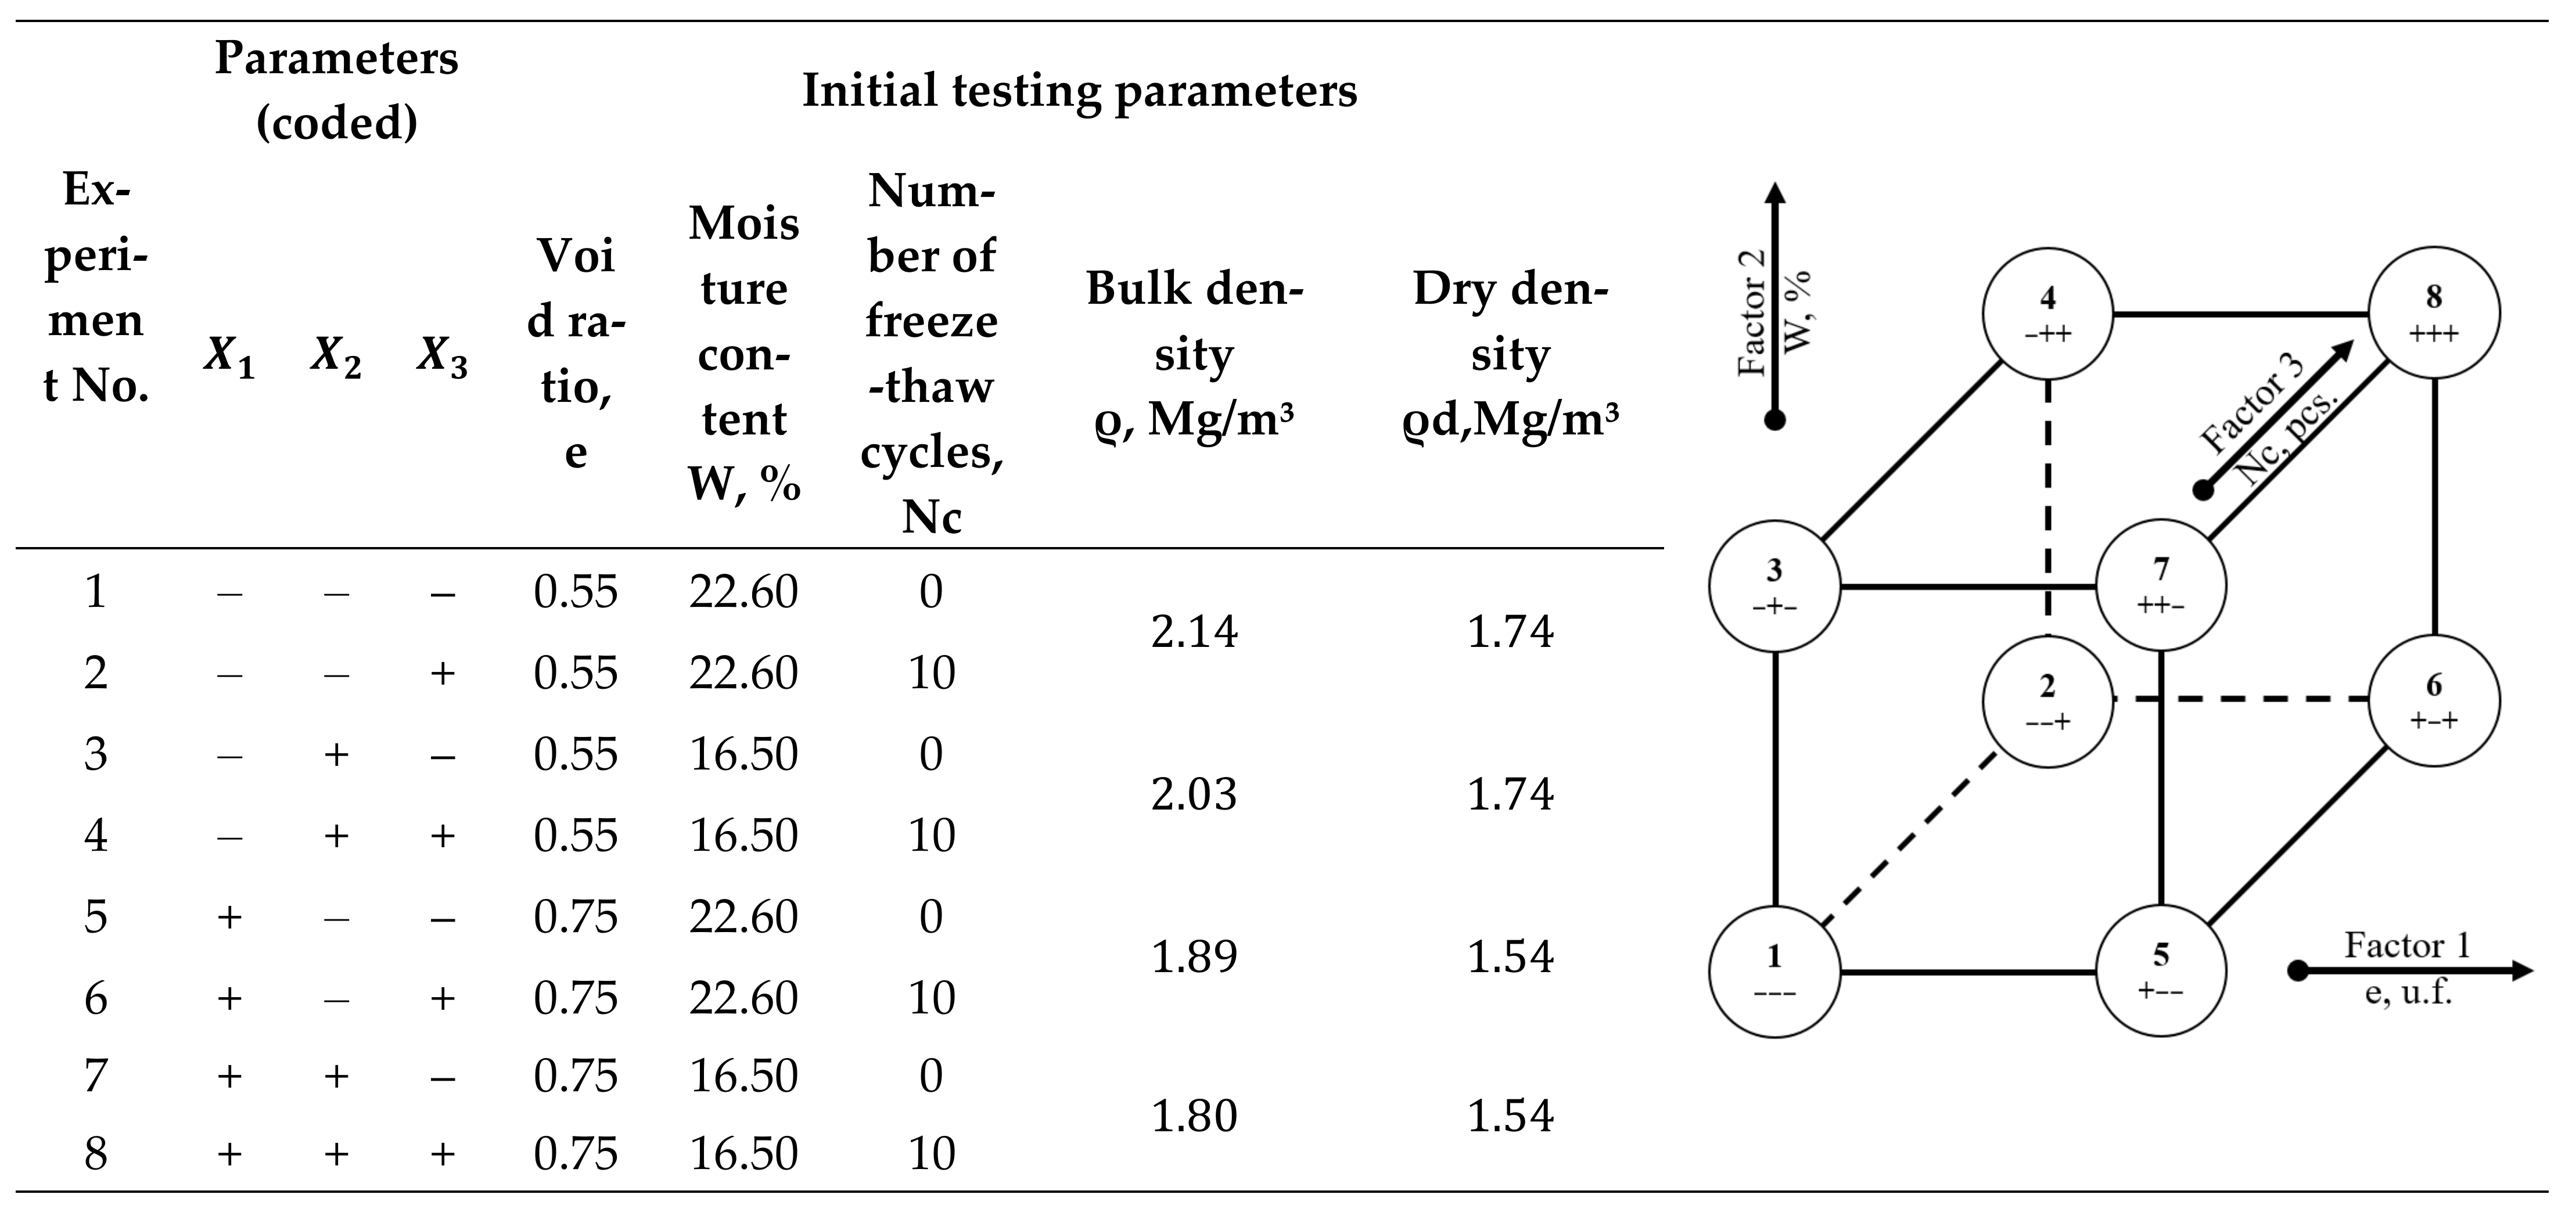
2. Materials and Methods
- Soil void ratio: low level at 0.55 unit fractions (“−” level) and high level at 0.75 unit fractions (“+” level);
- Initial soil moisture content: conventionally designated as low level at 22.6% (“−” level) and high level at 19.5% (“+” level), which corresponds to the high-plastic and semi-solid consistency of soil;
- Number of freezing-thawing cycles: low level at 0 cycles (“−” level) and high level at 10 cycles (“+” level).
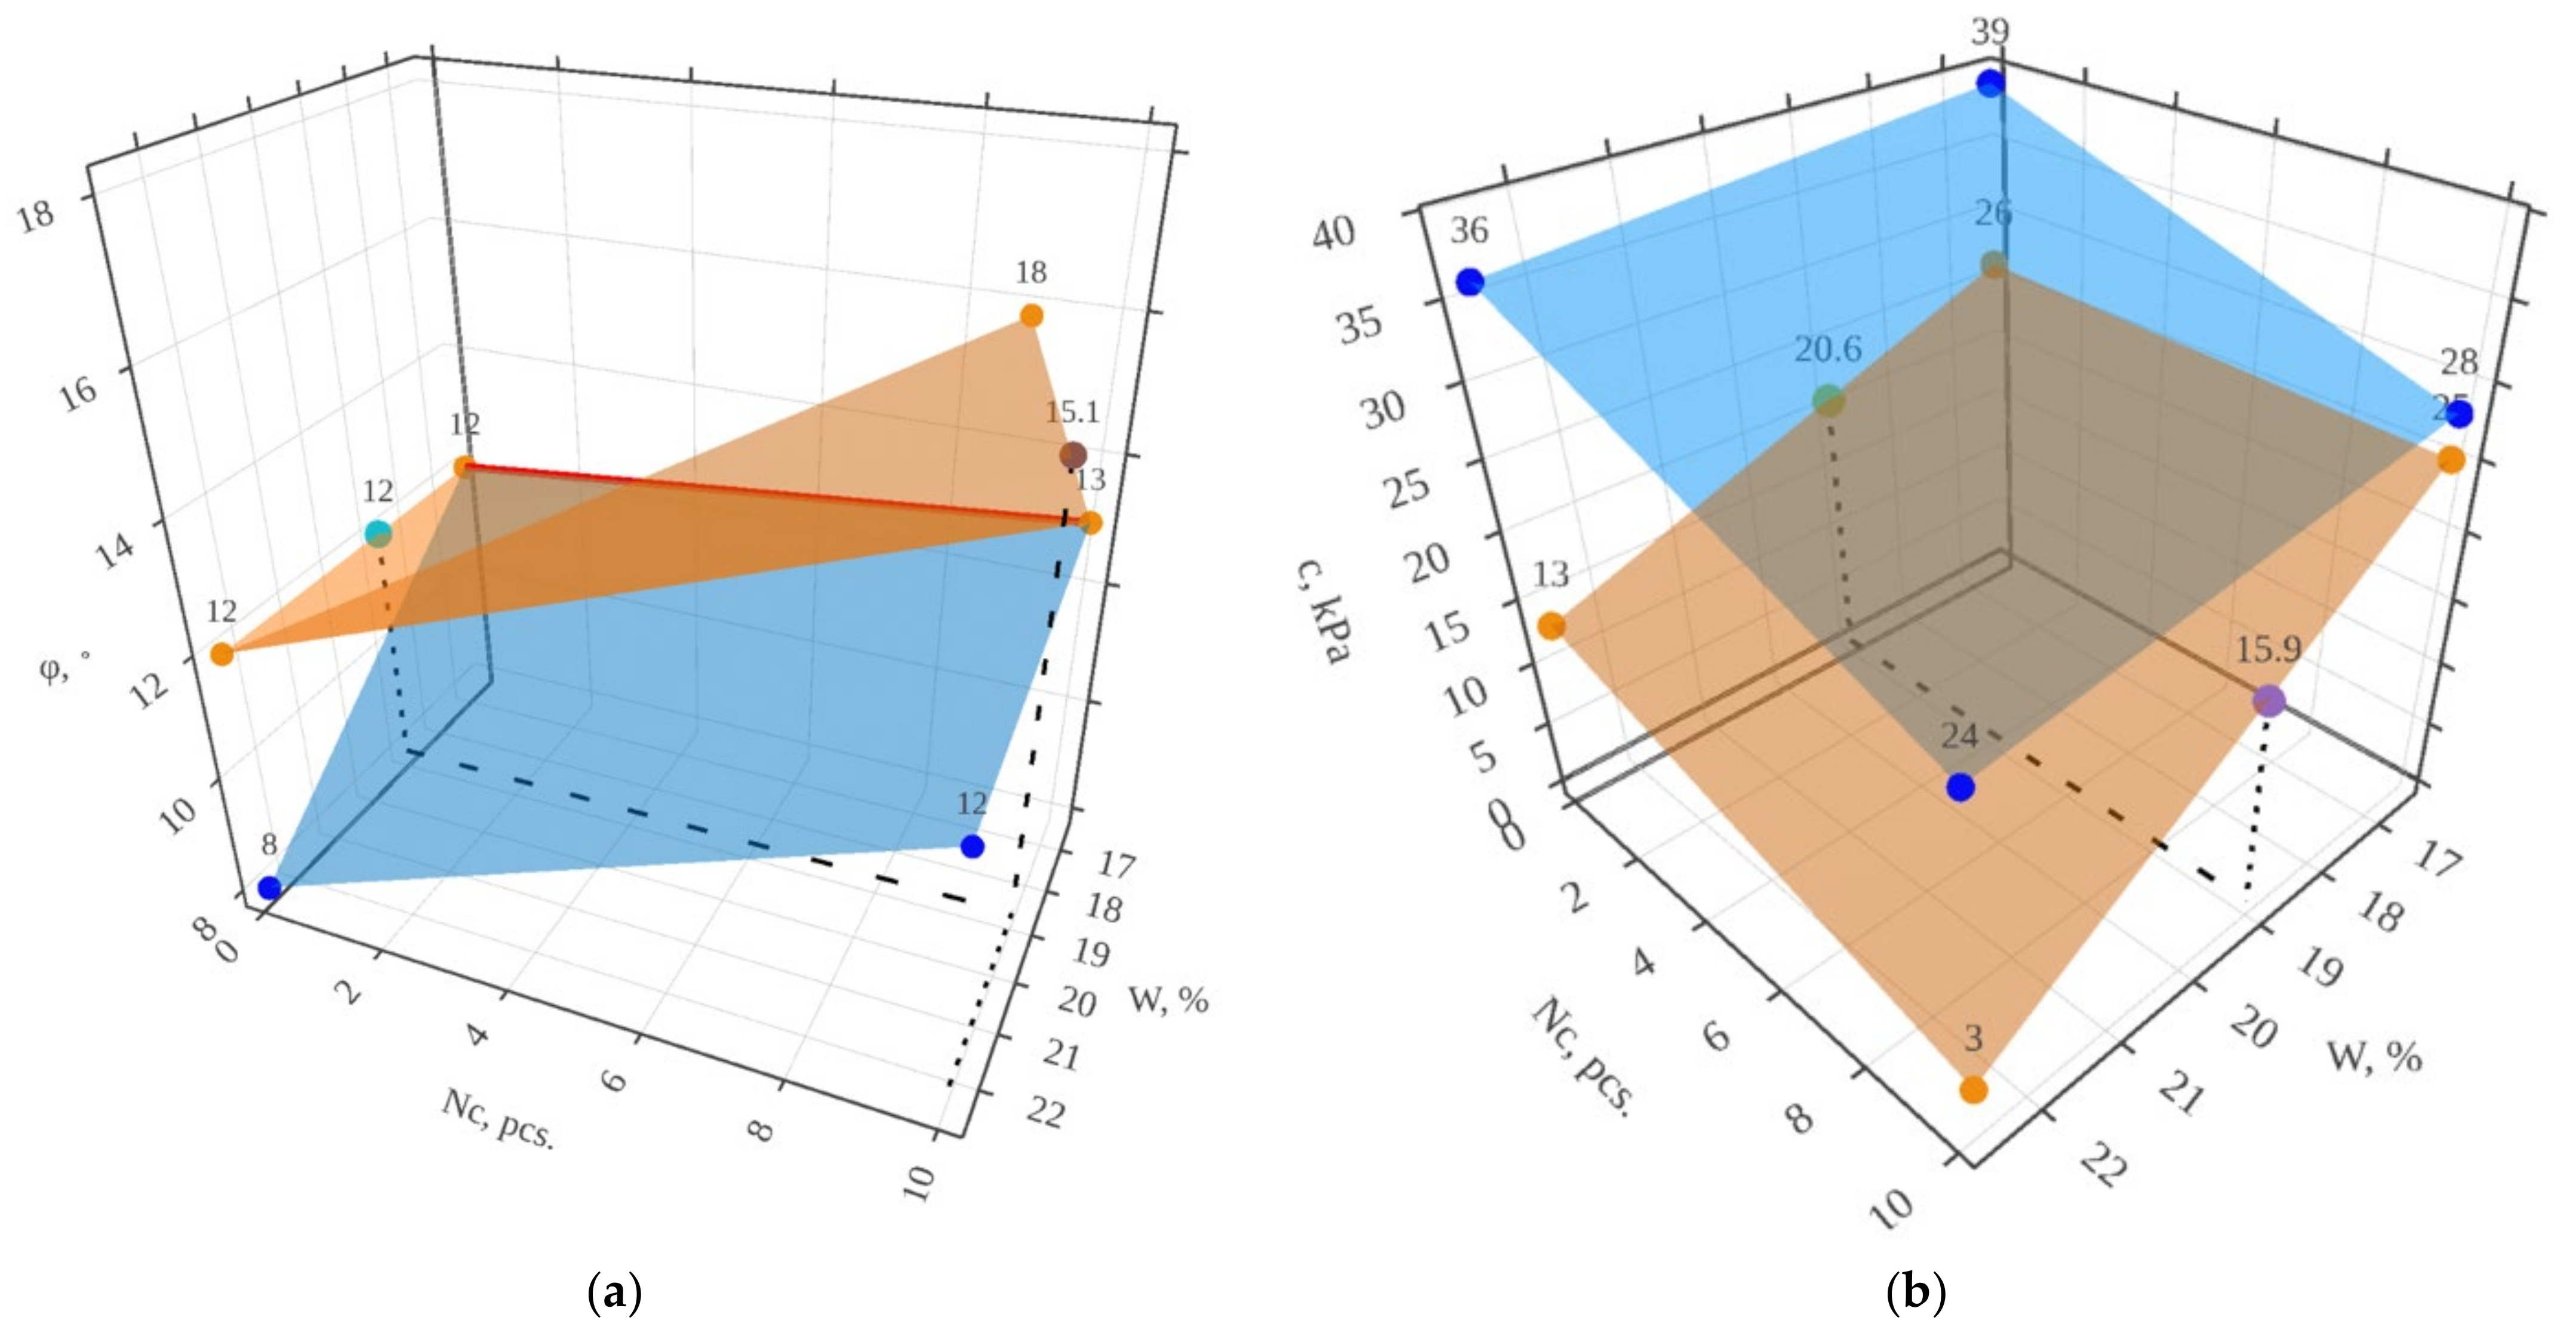
3. Results
4. Discussion
5. Example Calculation of Engineering Characteristics of Soil Bases by the Proposed Analytical Method
- The foundation footing width , therefore .
- The foundation depth .
- The basement depth is assumed equal to 2 m in accordance with SP 22.13330.2016 [18].
- The building has a rigid structure; the ratio of the length of the structure to its height L/H is less than 1.5.
- The strength characteristics of the soil are determined by direct tests, therefore .
- Depending on the calculated angle of internal friction, coefficients , and are taken according to SP 22.13330.2016 [18].
- The soil base is homogeneous, i.e., .
- Coefficients and are accepted according to SP 22.13330.2016 [18], depending on the type of soil and its initial moisture content.
6. Conclusion
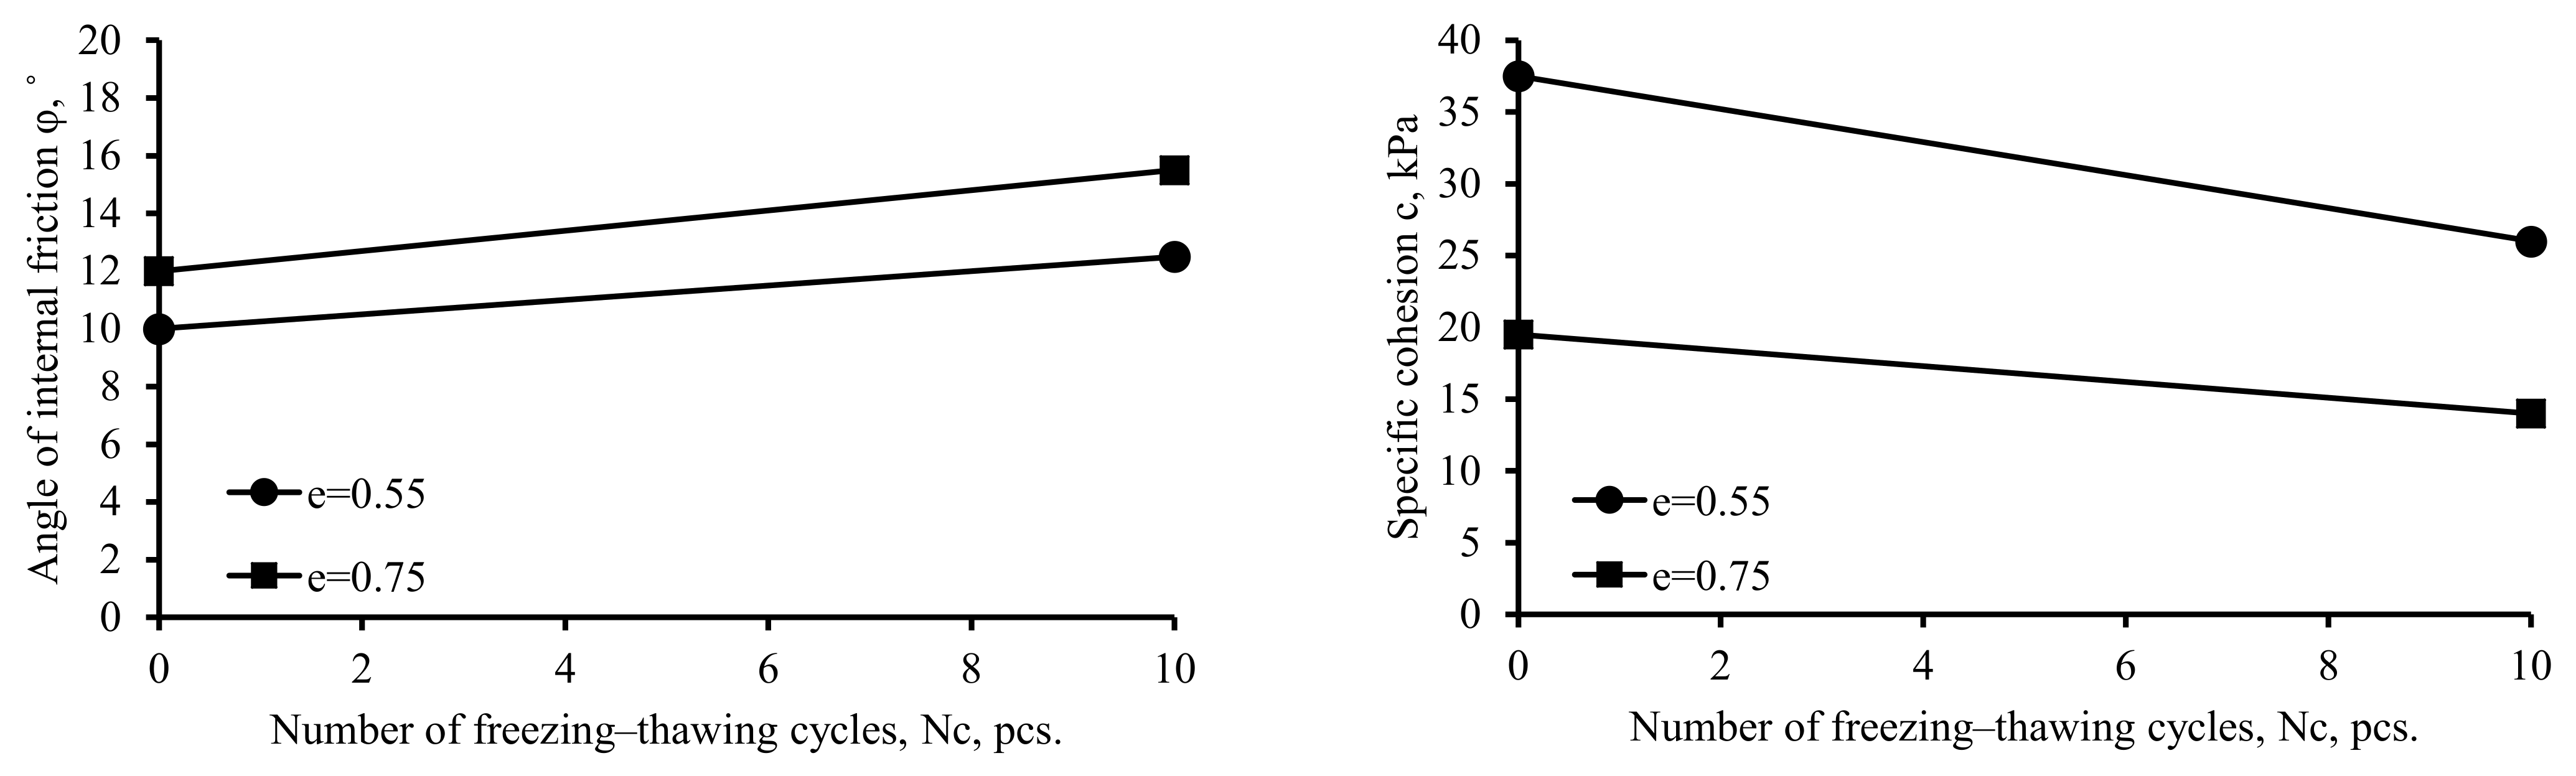
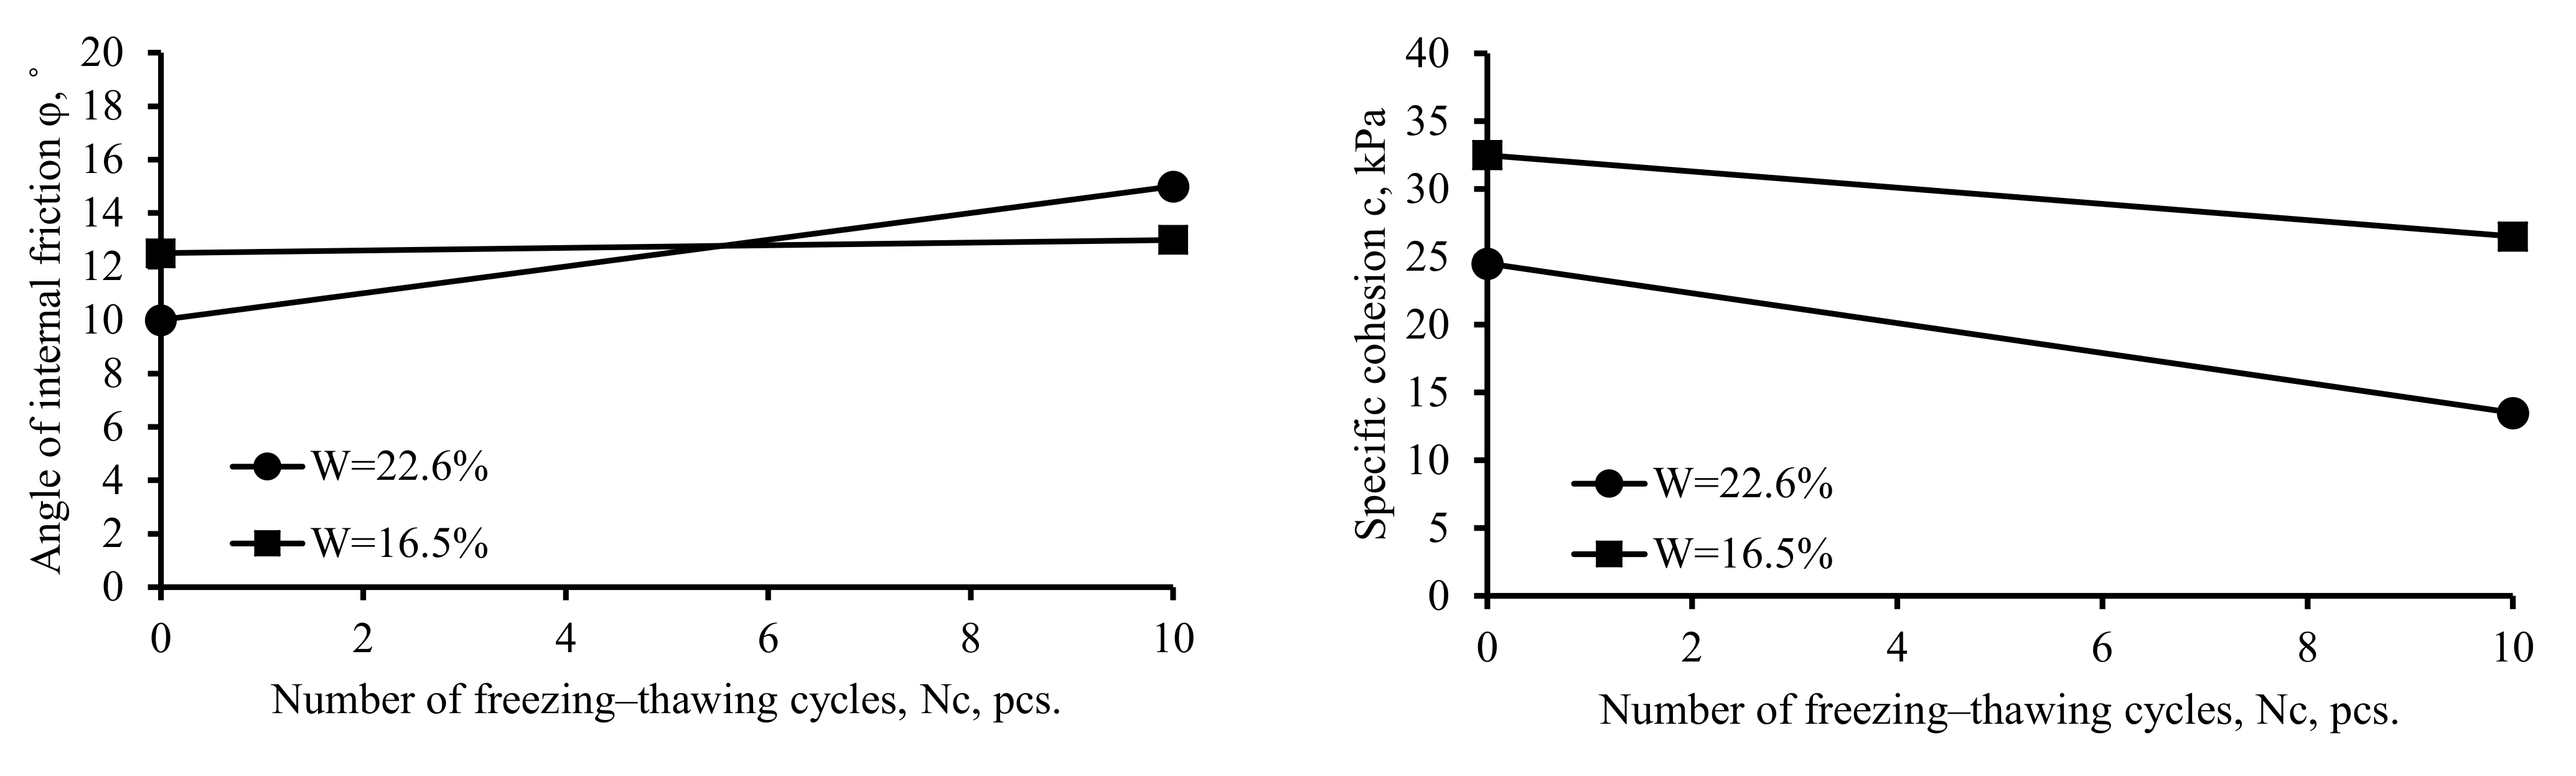
- The factors under study greatly affect the cohesion of the soil and, together, can decrease it by up to three times. The angle of internal friction has an indefinite behavior when the parameters under study change, which is confirmed by the literature review. Consequently, taking into account the reduction in cohesion is mandatory in engineering practice, whereas taking into account the change in the angle of internal friction is only recommended.
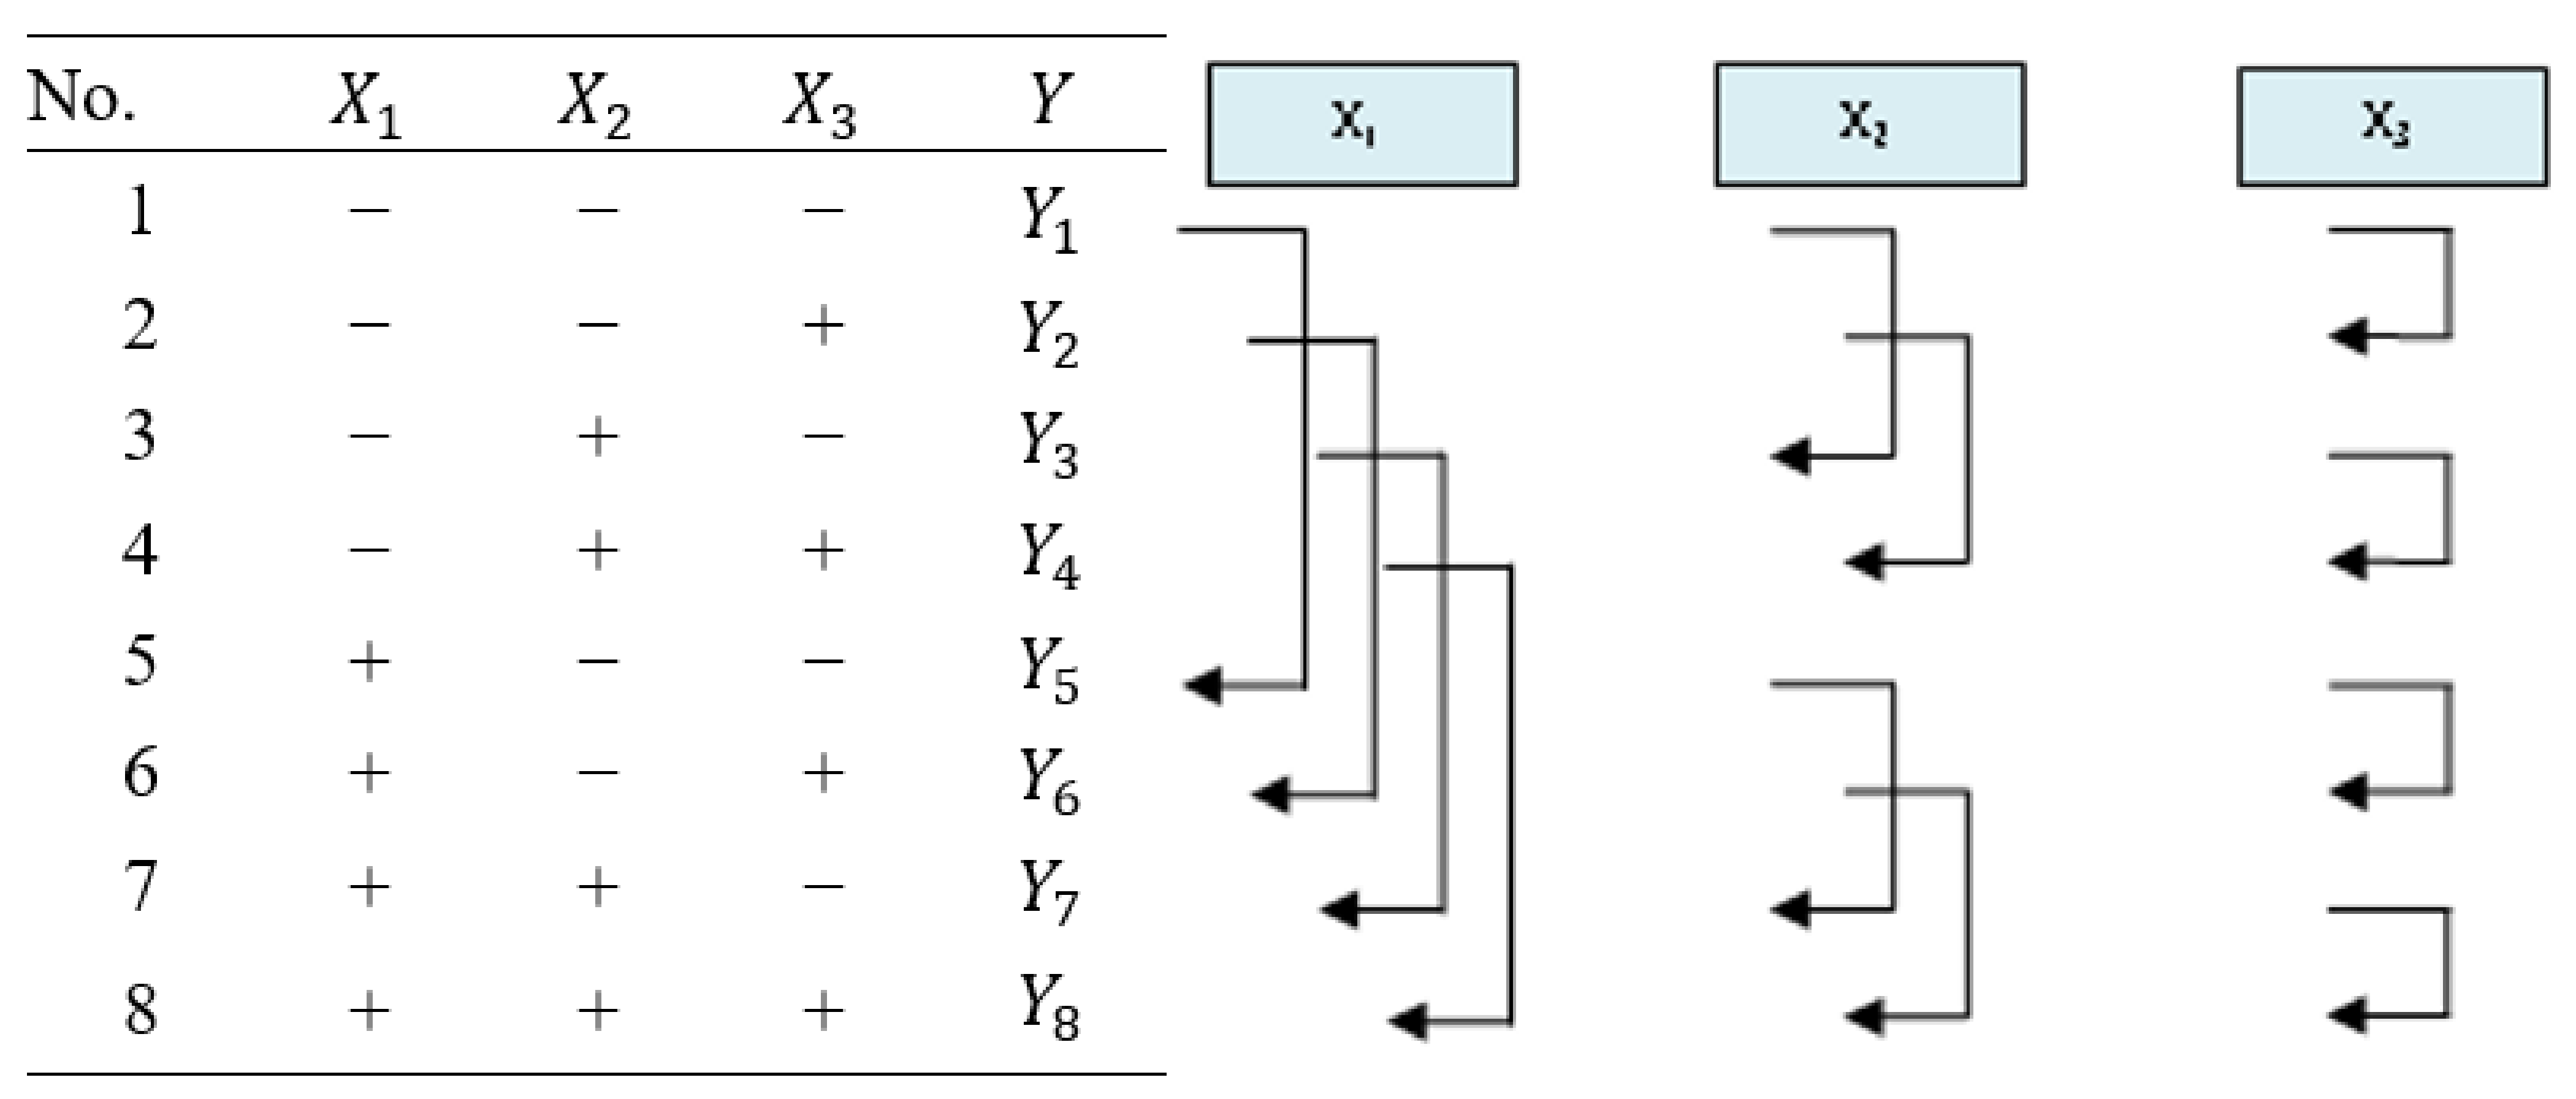
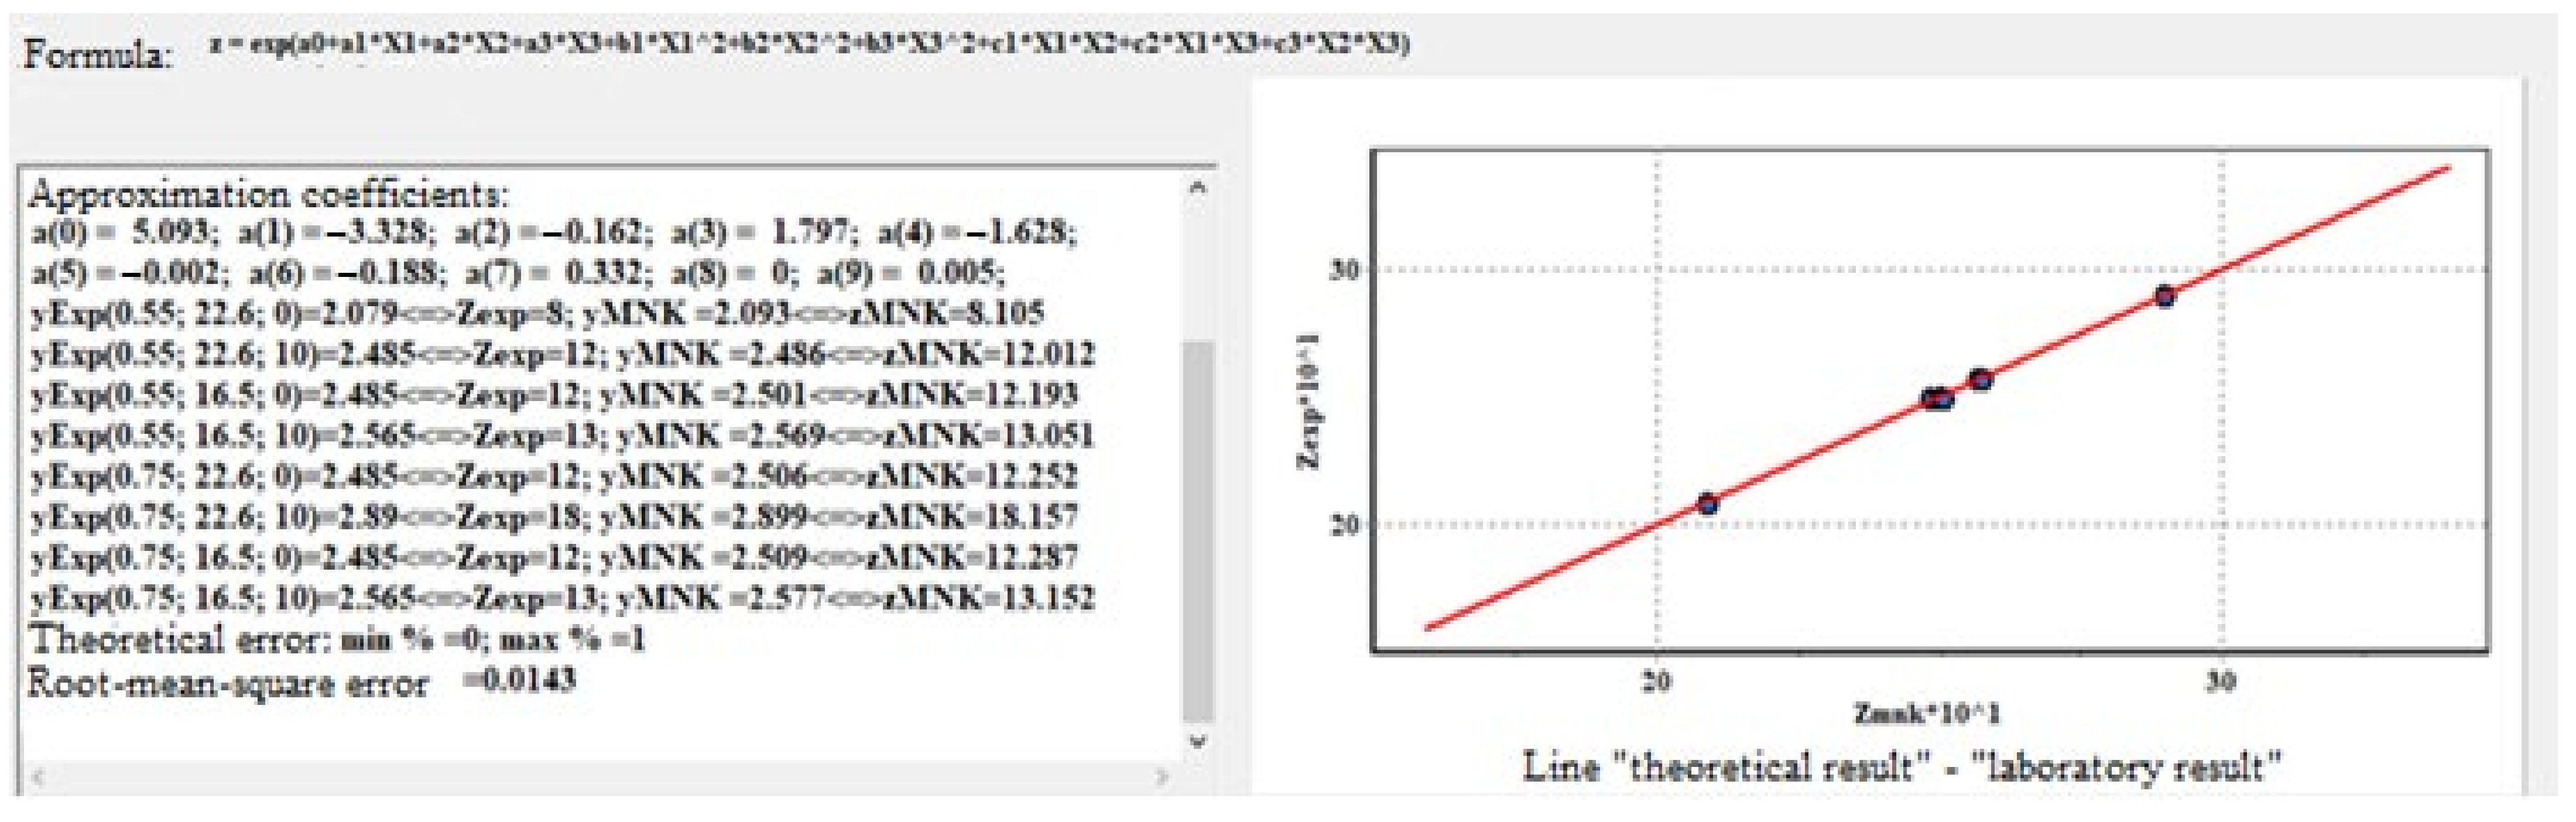
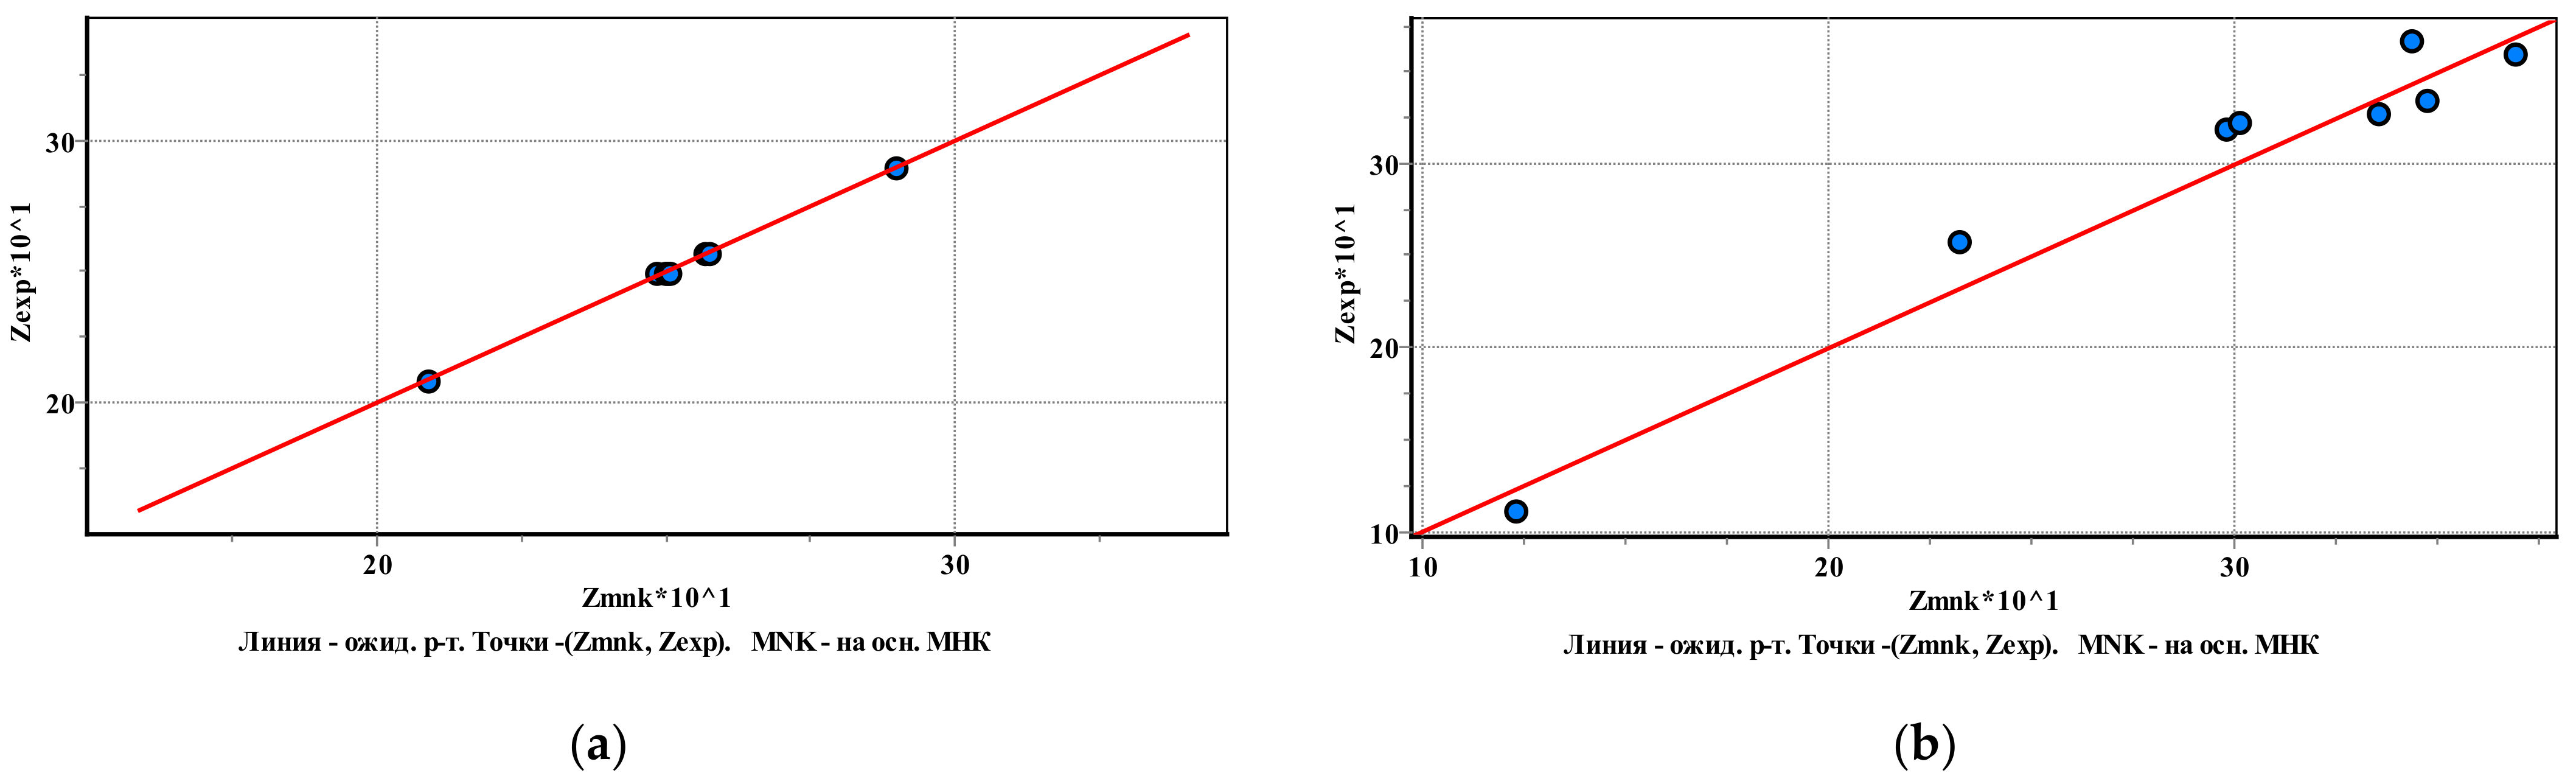
- A program based on the least-squares method was used to calculate the approximation coefficients of the dependence describing the changes in strength characteristics from the abovementioned parameters under study based on experiment results. Thus, by setting the values of void ratio, initial soil moisture, and number of freeze–thaw cycles, it became possible to calculate the angle of internal friction and/or cohesion for each type of soil.
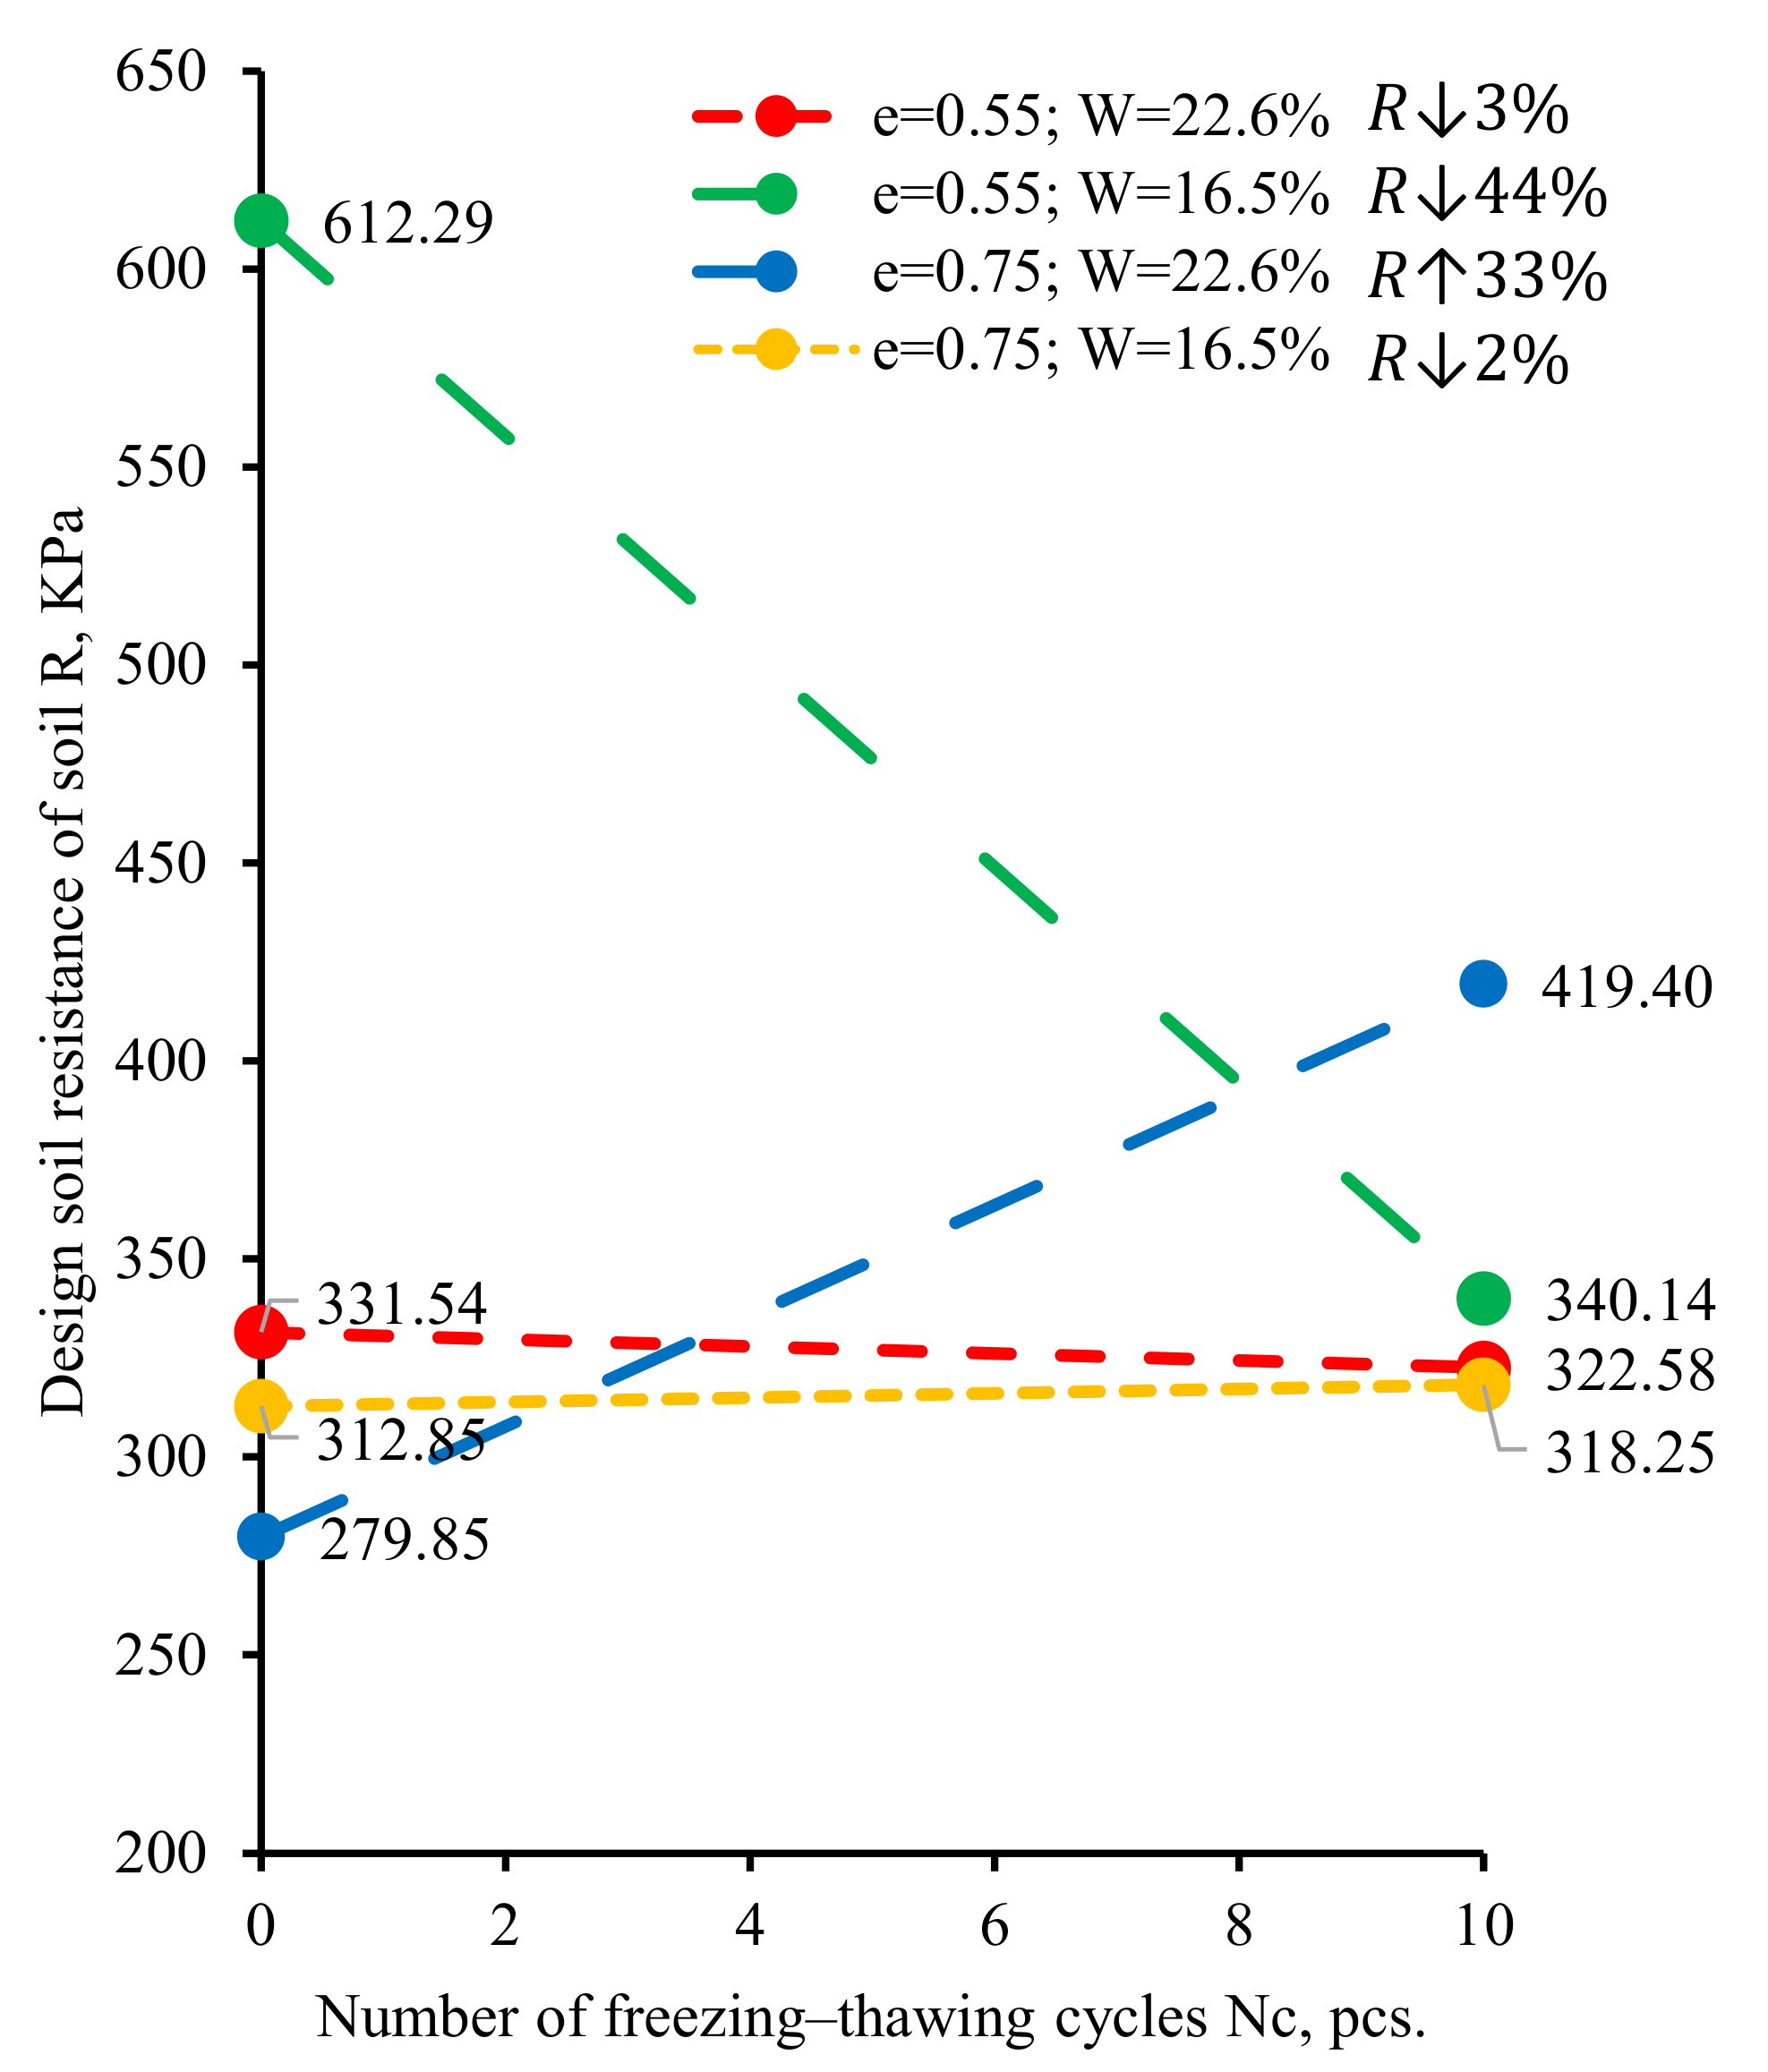
- Freezing–thawing cycles significantly decreased the bearing capacity of the soils: by 44% after 10 freezing-thawing cycles for soil with e = 0.55 and w = 16.5%. However, in the case of e = 0.75 and w = 22.6%, the bearing capacity of the soils increased by 33%, exceeding all expectations. Such changes in strength characteristics must be taken into account when designing structures, as they can lead to additional settlement or even subsidence of the foundations during the freezing-thawing cycles while exploiting.
Author Contributions
Funding
Institutional Review Board Statement
Informed Consent Statement
Data Availability Statement
Conflicts of Interest
Appendix A
References
- Wang, T.; Luo, S.; Liu, X. Testing Study of Freezing-Thawing Strength of Unsaturated Undisturbed Loess Considering Influence of Moisture Content. Rock Soil Mech. 2010, 31, 2378–2382. [Google Scholar]
- Sarsembayeva, A.; Zhussupbekov, A. Experimental study of deicing chemical redistribution and moisture mass transfer in highway subsoils during the unidirectional freezing. Transp. Geotech. 2021, 26, 100426. [Google Scholar] [CrossRef]
- Qi, J.; Ma, W.; Song, C. Influence of Freeze–Thaw on Engineering Properties of a Silty Soil. Cold Reg. Sci. Technol. 2008, 53, 397–404. [Google Scholar] [CrossRef]
- Yarbaşı, N.; Kalkan, E.; Akbulut, S. Modification of the geotechnical properties, as influenced by freeze–thaw, of granular soils with waste additives. Cold Reg. Sci. Technol. 2007, 48, 44–54. [Google Scholar] [CrossRef]
- Kalkan, E. Effects of silica fume on the geotechnical properties of fine-grained soils exposed to freeze and thaw. Cold Reg. Sci. Technol. 2009, 58, 130–135. [Google Scholar] [CrossRef]
- Ghazavi, M.; Roustaie, M. The Influence of Freeze–Thaw Cycles on the Unconfined Compressive Strength of Fiber-Reinforced Clay. Cold Reg. Sci. Technol. 2010, 61, 125–131. [Google Scholar] [CrossRef]
- Goldstein, M.N. Deformation of the Subgrade and Foundations of Structures during Freezing and Thawing; Transzheldorizdat: Moscow, Russia, 1948; 212p. [Google Scholar]
- Pchelintsev, A.M. Structure and Physical and Mechanical Properties of Frozen Soils; Publishing House “Nauka”: Moscow, Russia, 1964; 260p. [Google Scholar]
- Tsytovich, N.A. Mechanics of Frozen Soils; Study Guide; Vysshaya Shkola: Moscow, Russia, 1973; 448p. [Google Scholar]
- Tsytovich, N.A. Foundations on Frozen Ground; USSR Academy of Sciences Publishing House: Moscow, Russia, 1958; 168p. [Google Scholar]
- Shusherina, E.P.; Rachevsky, B.S.; Otroshchenko, O.P. Study of temperature deformations of frozen rocks. In Permafrost Research; MSU Publishing House: Moscow, Russia, 1970; pp. 273–283. [Google Scholar]
- Medvedev, S.N. Technology of Construction of Foundations of Buildings on Seasonally Freezing Soils: Author’s Abstract of the Dissertation for the Degree of Candidate of Technical Sciences: 05.23.08/Sergey Nazarovich Medvedev; MGSU: Moscow, Russia, 2007; 22p. [Google Scholar]
- Kiselev, M.F. Prevention of Soil Deformation from Frost Heaving; Leningrad: Stroyizdat, Russia, 1985; 131p. [Google Scholar]
- Ling, X.; Zhang, F.; Zhu, Z. Field Experiment of Subgrade Vibration Induced by Passing Train in a Seasonally Frozen Region of Daqing. Earthq. Eng. Eng. Vib. 2009, 8, 149–157. [Google Scholar] [CrossRef]
- Li, Q.; Ling, X.; Sheng, D. Elasto-Plastic Behaviour of Frozen Soil Subjected to Long-Term Low-Level Repeated Loading, Part I: Experimental Investigation. Cold Reg. Sci. Technol. 2016, 125, 138–151. [Google Scholar] [CrossRef]
- Tebaldi, G.; Orazi, M.; Orazi, U.S. Effect of Freeze—Thaw Cycles on Mechanical Behavior of Lime-Stabilized Soil. J. Mater. Civ. Eng. 2016, 28, 06016002. [Google Scholar] [CrossRef]
- Magushev, R.A.; Karlov, V.D.; Sakharov, I.I.; Osokin, A.I. Foundation Engineering: Textbook for Bachelors of Construction; ASV Publishing House: Moscow, Russia; SPbGASU: Saint Petersburg, Russia, 2011; 394p. [Google Scholar]
- Code of Practice SP 22.13330.2016. Soil Bases of Buildings and Structures; Updated Edition of SNiP 2.02.01-83*(2014); Standartinform: Moscow, Russia, 2016; 227p. [Google Scholar]
- Chang, D.; Liu, J.; Li, X.; Yu, Q. Experiment Study of Effects of Freezing-Thawing Cycles on Mechanical Properties of Qinghat-Tibet Silty Sand. Chin. J. Rock Mech. Eng. 2014, 33, 1496–1502. [Google Scholar]
- Wang, D.Y.; Ma, W.; Chang, X.X.; Sun, Z.Z.; Feng, W.J.; Zhang, J.W. Physico-Mechanical Properties Changes of Qinghai—Tibet Clay due to Cyclic Freezing and Thawing. Chin. J. Rock Mech. Eng. 2005, 24, 4313–4319. [Google Scholar]
- Wang, M.; Meng, S.; Sun, Y.; Fu, H. Shear strength of frozen clay under freezing-thawing cycles using triaxial tests. Earthq. Eng. Eng. Vib. 2018, 17, 761–769. [Google Scholar] [CrossRef]
- Yu, J. Design of Low Temperature Triaxial Testing Machine and Experimental Study on Cyclic Freeze-Thaw on the Mechanical Properties of Silty Clay. Ph.D. Dissertation, Wuhan Insitute of Rock and Soil Mechanics, The Chinese Academy of Sciences, Wuhan, China, 2007. [Google Scholar]
- Liu, J.; Chang, D.; Yu, Q. Influence of freeze-thaw cycles on mechanical properties of a silty sand. Eng. Geol. 2016, 210, 23–32. [Google Scholar] [CrossRef]
- Zhang, H.; Wang, T.; Luo, Y. Freezing-Thawing Strength of Unsaturated Undisturbed Loess. J. Northwest AF Univ. (Nat. Sci. Ed.) 2015, 43, 1–6. [Google Scholar]
- Fang, L.; Qi, J.; Ma, W. Freeze-Thaw Induced Changes in Soil Structure and its Relationship with Variations in Strength. J. Glaciol. Geocryol. 2012, 34, 435–440. [Google Scholar]
- Su, Q.; Tang, D.; Liu, S. Test on Physico-Mechanical Properties of Qinghai—Tibet Slope Clay under Freezing-Thawing Cycles. Chin. J. Rock Mech. Eng. 2008, 27, 2990–2994. [Google Scholar]
- Dong, X.; Zhang, A.; Lian, J.; Guo, M. Laboratory Study on Shear Strength Deterioration of Loess with Long-Term Freezing-Thawing Cycles. J. Eng. Geol. 2010, 18, 887–893. [Google Scholar]
- Wang, J. Research on the Mechanical Properties of Pavement Soil after Several Freeze Thaw Cycles in Seasonally Frozen Soil Region and Microscopic Mechanism Analysis. Ph.D. Dissertation, Jilin University, Changchun, China, 2012. [Google Scholar]
- GOST 30416-2012. Soils. Laboratory Testing. General. Available online: https://docs.cntd.ru/document/1200096093 (accessed on 2 December 2021).
- GOST 25100-2020. Soils. Classification. Available online: https://docs.cntd.ru/document/1200174302 (accessed on 2 December 2021).
- GOST 12248-2010. Soils. Laboratory Methods for Determining the Strength and Strain Characteristics. Available online: https://docs.cntd.ru/document/1200084869 (accessed on 2 December 2021).
- Lawson, J.; Erjavec, J. Basic Experimental Strategies and Data Analysis for Science and Engineering; CRC Press, Taylor & Francis Group: Boca Raton, USA, 2017; 445p. [Google Scholar]


| No. | Designation | Indicator | Unit | Value |
|---|---|---|---|---|
| 1 | Density of soil particles | g/cm3 | 2.70 | |
| 2 | Plastic limit | - | 0.15 | |
| 3 | Liquid limit | - | 0.27 | |
| 4 | Plasticity index | - | 12.1 | |
| 5 | Liquidity index | - | 0.375 |
| Sample No. | Angle of Internal Friction φ, ° | Cohesion c, kPa |
|---|---|---|
| 1 | 8 | 36 |
| 2 | 12 | 24 |
| 3 | 12 | 39 |
| 4 | 13 | 28 |
| 5 | 12 | 13 |
| 6 | 18 | 3 |
| 7 | 12 | 26 |
| 8 | 13 | 25 |
| No. | Factor | Parameters (Coded) | Additional Calculations | Result | ||||||||
|---|---|---|---|---|---|---|---|---|---|---|---|---|
| e, u.f. | W, % | Nc, pcs | φ, ° | c, kPa | ||||||||
| 1 | 0.55 | 22.6 | 0 | − | − | − | 1 | 1 | 1 | −1 | 8 | 36 |
| 2 | 0.55 | 22.6 | 10 | − | − | + | 1 | −1 | −1 | 1 | 12 | 24 |
| 3 | 0.55 | 16.5 | 0 | − | + | − | −1 | 1 | −1 | 1 | 12 | 39 |
| 4 | 0.55 | 16.5 | 10 | − | + | + | −1 | −1 | 1 | −1 | 13 | 28 |
| 5 | 0.75 | 22.6 | 0 | + | − | − | −1 | −1 | 1 | 1 | 12 | 13 |
| 6 | 0.75 | 22.6 | 10 | + | − | + | −1 | 1 | −1 | −1 | 18 | 3 |
| 7 | 0.75 | 16.5 | 0 | + | + | − | 1 | −1 | −1 | −1 | 12 | 26 |
| 8 | 0.75 | 16.5 | 10 | + | + | + | 1 | 1 | 1 | 1 | 13 | 25 |
| Actual effect | ||||||||||||
| Δφ, ° | 2.50 | 0.00 | 3.00 | −2.50 | 0.50 | −2.00 | −0.50 | |||||
| Δc, kPa | −15.00 | 10.50 | −8.50 | 7.00 | 3.00 | 2.50 | 2.00 | |||||
| Factor (Coded) | Level (−) | Level (+) | Effect | |||
|---|---|---|---|---|---|---|
| E, u.f. | 0.55 | 0.75 | ||||
| W, % | 22.6 | 16.5 | ||||
| Nc | 0 | 10 | ||||
| Indicator | Experiment No. | |||||||
|---|---|---|---|---|---|---|---|---|
| No.1 | No.5 | No.3 | No.7 | No.2 | No.6 | No.4 | No.8 | |
| No Freezing–Thawing Cycles | 10 Freezing–Thawing Cycles | |||||||
(High-Plastic) | (Semi-Solid) | (High-Plastic) | (Semi-Solid) | |||||
| , º | 8 | 12 | 12 | 12 | 12 | 18 | 13 | 13 |
| 1.217 | 1.196 | 1.049 | 1.539 | 1.298 | 1.042 | 1.630 | 1.585 | |
| , kPa | 36 | 13 | 39 | 26 | 24 | 3 | 28 | 25 |
| 1.161 | 1.887 | 1.055 | 2.448 | 1.670 | 5.59 | 2.716 | 2.08 | |
| , º | 6 | 10 | 12 | 8 | 9 | 17 | 8 | 8 |
| , kPa | 31 | 7 | 37 | 11 | 14 | 1 | 10 | 12 |
| 1.1 | 1.25 | 1.1 | 1.25 | |||||
| 1 | 1.1 | 1 | 1.1 | |||||
| 0.10 | 0.18 | 0.23 | 0.14 | 0.16 | 0.39 | 0.14 | 0.14 | |
| 1.39 | 1.73 | 1.94 | 1.55 | 1.64 | 2.57 | 1.55 | 1.55 | |
| 3.71 | 4.17 | 4.42 | 3.93 | 4.05 | 5.15 | 3.93 | 3.93 | |
| 21.35 | 18.91 | 20.3 | 17.98 | 21.35 | 18.91 | 20.3 | 17.98 | |
| R, kPa | 331.54 | 279.85 | 612.29 | 312.85 | 322.58 | 419.40 | 340.14 | 318.25 |
Publisher’s Note: MDPI stays neutral with regard to jurisdictional claims in published maps and institutional affiliations. |
© 2022 by the authors. Licensee MDPI, Basel, Switzerland. This article is an open access article distributed under the terms and conditions of the Creative Commons Attribution (CC BY) license (https://creativecommons.org/licenses/by/4.0/).
Share and Cite
Bragar, E.; Pronozin, Y.; Zhussupbekov, A.; Gerber, A.; Sarsembayeva, A.; Muzdybayeva, T.; Sarabekova, U.Z. Evaluation of the Strength Characteristics of Silty-Clayey Soils during Freezing-Thawing Cycles. Appl. Sci. 2022, 12, 802. https://doi.org/10.3390/app12020802
Bragar E, Pronozin Y, Zhussupbekov A, Gerber A, Sarsembayeva A, Muzdybayeva T, Sarabekova UZ. Evaluation of the Strength Characteristics of Silty-Clayey Soils during Freezing-Thawing Cycles. Applied Sciences. 2022; 12(2):802. https://doi.org/10.3390/app12020802
Chicago/Turabian StyleBragar, Elena, Yakov Pronozin, Askar Zhussupbekov, Alexander Gerber, Assel Sarsembayeva, Tymarkul Muzdybayeva, and Ulbossyn Zhangabilkyzy Sarabekova. 2022. "Evaluation of the Strength Characteristics of Silty-Clayey Soils during Freezing-Thawing Cycles" Applied Sciences 12, no. 2: 802. https://doi.org/10.3390/app12020802
APA StyleBragar, E., Pronozin, Y., Zhussupbekov, A., Gerber, A., Sarsembayeva, A., Muzdybayeva, T., & Sarabekova, U. Z. (2022). Evaluation of the Strength Characteristics of Silty-Clayey Soils during Freezing-Thawing Cycles. Applied Sciences, 12(2), 802. https://doi.org/10.3390/app12020802