Article

Study on the Non-Steady-State Wear Characteristics and Test of the Flow Passage Components of Deep-Sea Mining Pumps

1
College of Mechanical and Electrical Engineering, Central South University, Changsha 410083, China
2
National Key Laboratory of Deep Sea Mineral Researches Development and Utilization Technology, Changsha 410083, China
*
Author to whom correspondence should be addressed.
Appl. Sci. 2022, 12(2), 782; https://doi.org/10.3390/app12020782
Submission received: 13 December 2021 / Revised: 27 December 2021 / Accepted: 9 January 2022 / Published: 13 January 2022

Abstract

:
In the process of conveying coarse-grained minerals, the internal flow-through passage components of mining pumps are subject to wear. The flow of coarse particles in such pumps is complex and changes constantly, making it necessary to study the non-steady-state wear characteristics and test the flow passage components. The evolution of the surface wear rate for the flow passage components during one third of a rotation cycle (120°) of a mining pump impeller with small, design, and large flow rates was analyzed in this study based on a discrete phase model (DPM). The flow that occurs during an entire rotation cycle of the impeller was investigated. The wear test was carried out with a small test pump with the same specific speed as and a similar structure to that of the deep-sea mining pump. The test results were compared with the numerical calculation results of the deep-sea mining pump obtained by using the same numerical calculation method and wear model, and the test wear area was found to be more consistent with the numerical calculation wear area. The results show that the numerical calculation method used in this article can more accurately predict the surface wear of the passage components of the mining pump and provides a suitable method for the prediction of the wear characteristics of the mining pump.

1. Introduction

The wear due to particles on materials is extremely complicated as it is affected by the particle size, density, concentration, and impact angle and different operating conditions. The different particle parameters and operating conditions can lead to different degrees of wear [1,2,3]. Similarly, particles will also cause different degrees of wear in a pump, which wear is mainly manifested on the surface and inside of the flow passage components. In practical engineering applications, the wear characteristics of particles on a pump under different operating conditions cannot be ignored as they are directly related to the service life and reliability of the pump [4,5,6].
There are many influencing factors involved in the wear of particles on pump materials. To optimize a centrifugal slurry pump impeller, Peng et al. [7] analyzed the wear characteristics of the solid–liquid two-phase flow in the pump based on a Euler–Euler mixture model and compared the performance of the original pump and the optimized pump. The results showed that the optimized pump had a lower wear rate and a smaller loss of mass than the original pump. Song et al. [8] analyzed the wear of the double-suction centrifugal pump by particles, which provided a reference for predicting the wear of the centrifugal pump. Liu et al. [9] studied the wear due to particles of different sizes on the material of a pump, analyzed the wear mechanism, established a relationship between the wear rate and particle shape, and carried out an experimental verification. Takaffoli et al. [10] also studied the wear mechanism of particles colliding with pump materials at multiple angles. Grant et al. [11] used a Monte Carlo simulation of the physical process to study the wear of solid particles on turbomachinery. Arabnejad et al. [12] proposed a semi-mechanistic model for the erosion of different target materials due to solid particles and tested it using 150-μm sand particles to verify its effectiveness. Their results showed that the particles caused cutting and deformation wear on the tested material. Huang et al. [13] analyzed the wear of the impeller caused by various sediment types and particle trajectories at the entrance, and they found that the wear of the impeller was mainly concentrated on the back cover and working surface. Nguyen et al. [14] studied the wear of materials using sand particles of different sizes and flow rate conditions. Their test results showed that as the size of the sand particles increases, the wear profile changes from a “W”-shape to a “U”-shape. Peng et al. [15] also studied the wear of solid particles on the elbow of a pump.
Solid particles that are being conveyed will inflict wear on the flow passage components in pumps [16]. Wang et al. [17] studied the wear associated with sludge concentration and particle size on a double-suction centrifugal pump. Their results showed that, compared with pure water, the pump head and shaft power were lower due to the presence of sludge. Moreover, the pump head and shaft power decreased as the sludge concentration and particle size increased. Liao et al. [18] analyzed the wear due to sand particles of various sizes on the surface of pump blades based on a two-phase flow model. Shen et al. [19] studied the wear of the impeller of a double-suction centrifugal pump as a result of the particle size, particle shape, and concentration of sediment from the Jingtai Yellow River Irrigation Project. Their results showed that the erosion and wear were mainly distributed near the leading and trailing edges of the impeller. Serrano et al. [20] analyzed the wear of the impeller of a pump as a result of the particle concentration of the sediment in the Ake River, Brazil, and conducted an experimental study. They demonstrated that the wear of the impeller increased linearly as the sediment concentration increased. Several researchers have also studied the movement characteristics of solid particles in centrifugal pumps from different points of view through experiments while analyzing the influence of the slurry concentration and particle size on the slurry pump head, efficiency, and wear of the flow passage components [21,22,23].
The flow process in an electric pump is very irregular considering the actual operating conditions. Therefore, it is of practical significance to analyze the unsteady flow characteristics in electric pumps. Huang et al. [24] simulated the transient cavitation flow in a jet pump with a non-uniform inflow in an attempt to reveal correlations between the jet pump cavitation, vortex diffusion, and outlet pressure fluctuations. Their results showed that acceleration in the cavity is the main source of internal pressure fluctuations in mixed-flow water jet pumps. In the study of Su et al. [25], the time-dependent flow rate was captured and analyzed in computational fluid domains by Lagrangian and Eulerian viewpoints. They showed that starting from the 1–8 section of the volute, the time-averaged velocity decreased overall, and the accuracy of the simulation results was verified using experiments. Zhang et al. [26,27,28] studied the unsteady flow, pressure pulsation, eddy current, and other phenomena in a pump based on the delayed detached eddy simulation (DDES) model, which provides an important reference for analyzing the unsteady flow characteristics in pumps.
In specific engineering applications, cases have occurred in which deep-sea mining tests have been terminated due to the wear of coarse particles on the deep-sea pumps, thereby indicating the importance of analyzing the wear of electric pumps. In particular, the non-steady-state wear characteristics of the over-current components in electric pumps under different operating conditions should be studied [29,30,31], as these components are extremely important to the design, optimization, testing, and application of these pumps.
In order to realize the analysis of the non-steady-state wear characteristics of the mining pump, this paper uses the DPM wear model to analyze the evolution characteristics of the surface wear of the flow passage components under three flow rates. In addition, a wear area test was performed on the test pump, and the test results were compared with the numerical analysis results to verify the rationality and applicability of the numerical calculation method and the wear model. The research results of this paper have important practical significance for predicting the wear characteristics of deep-sea mining pumps.

2. Methods: Modeling and Numerical Calculation Method

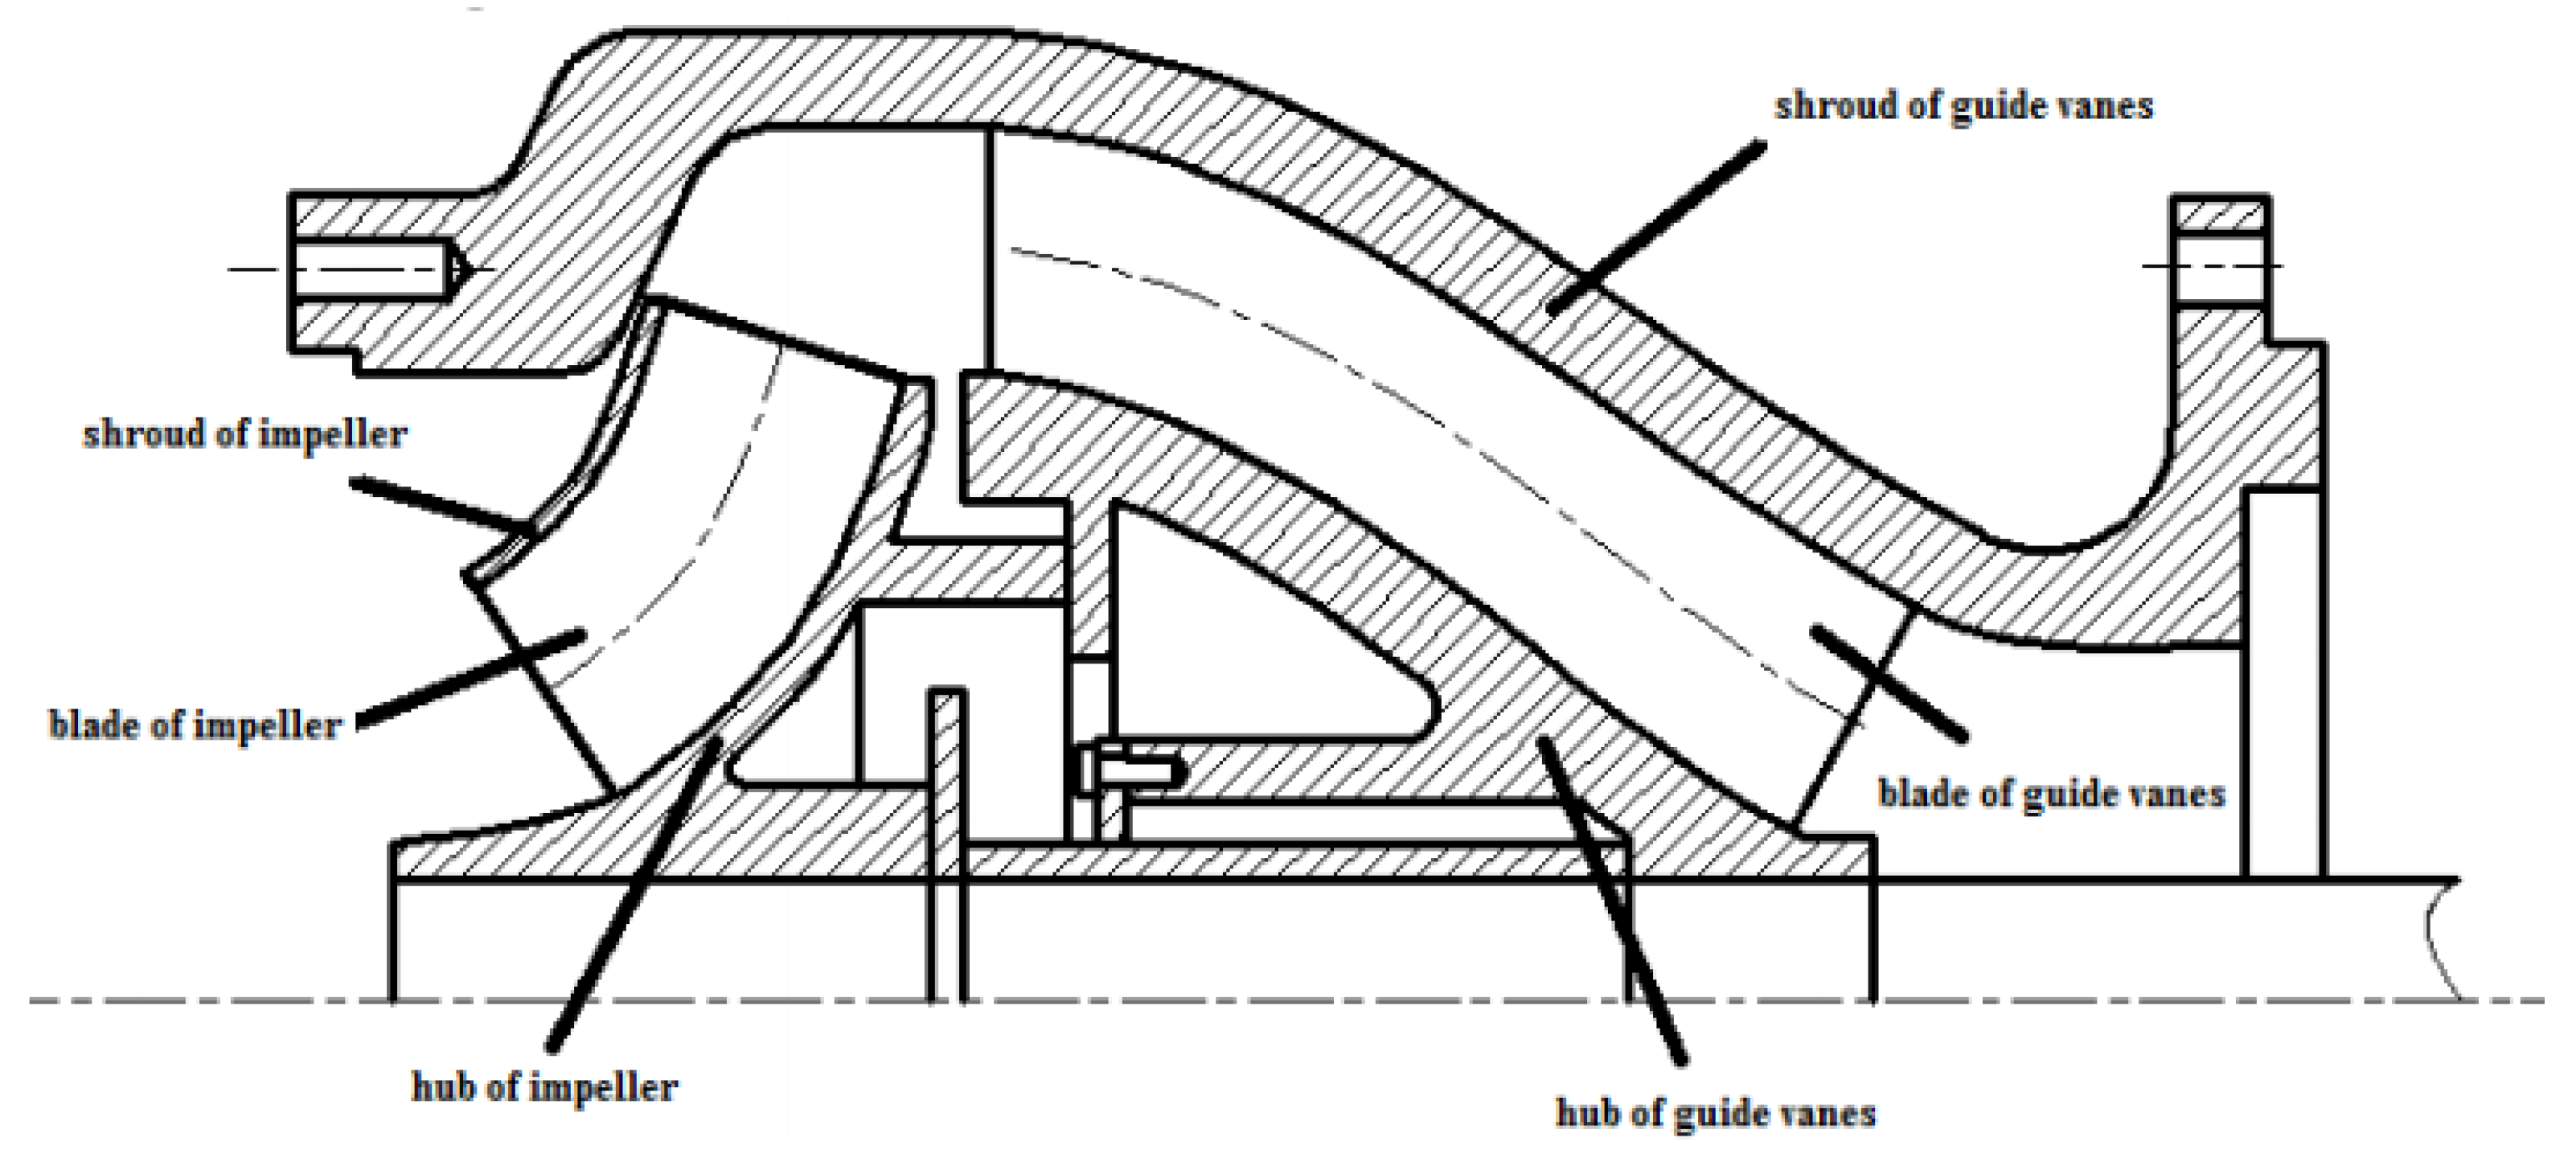
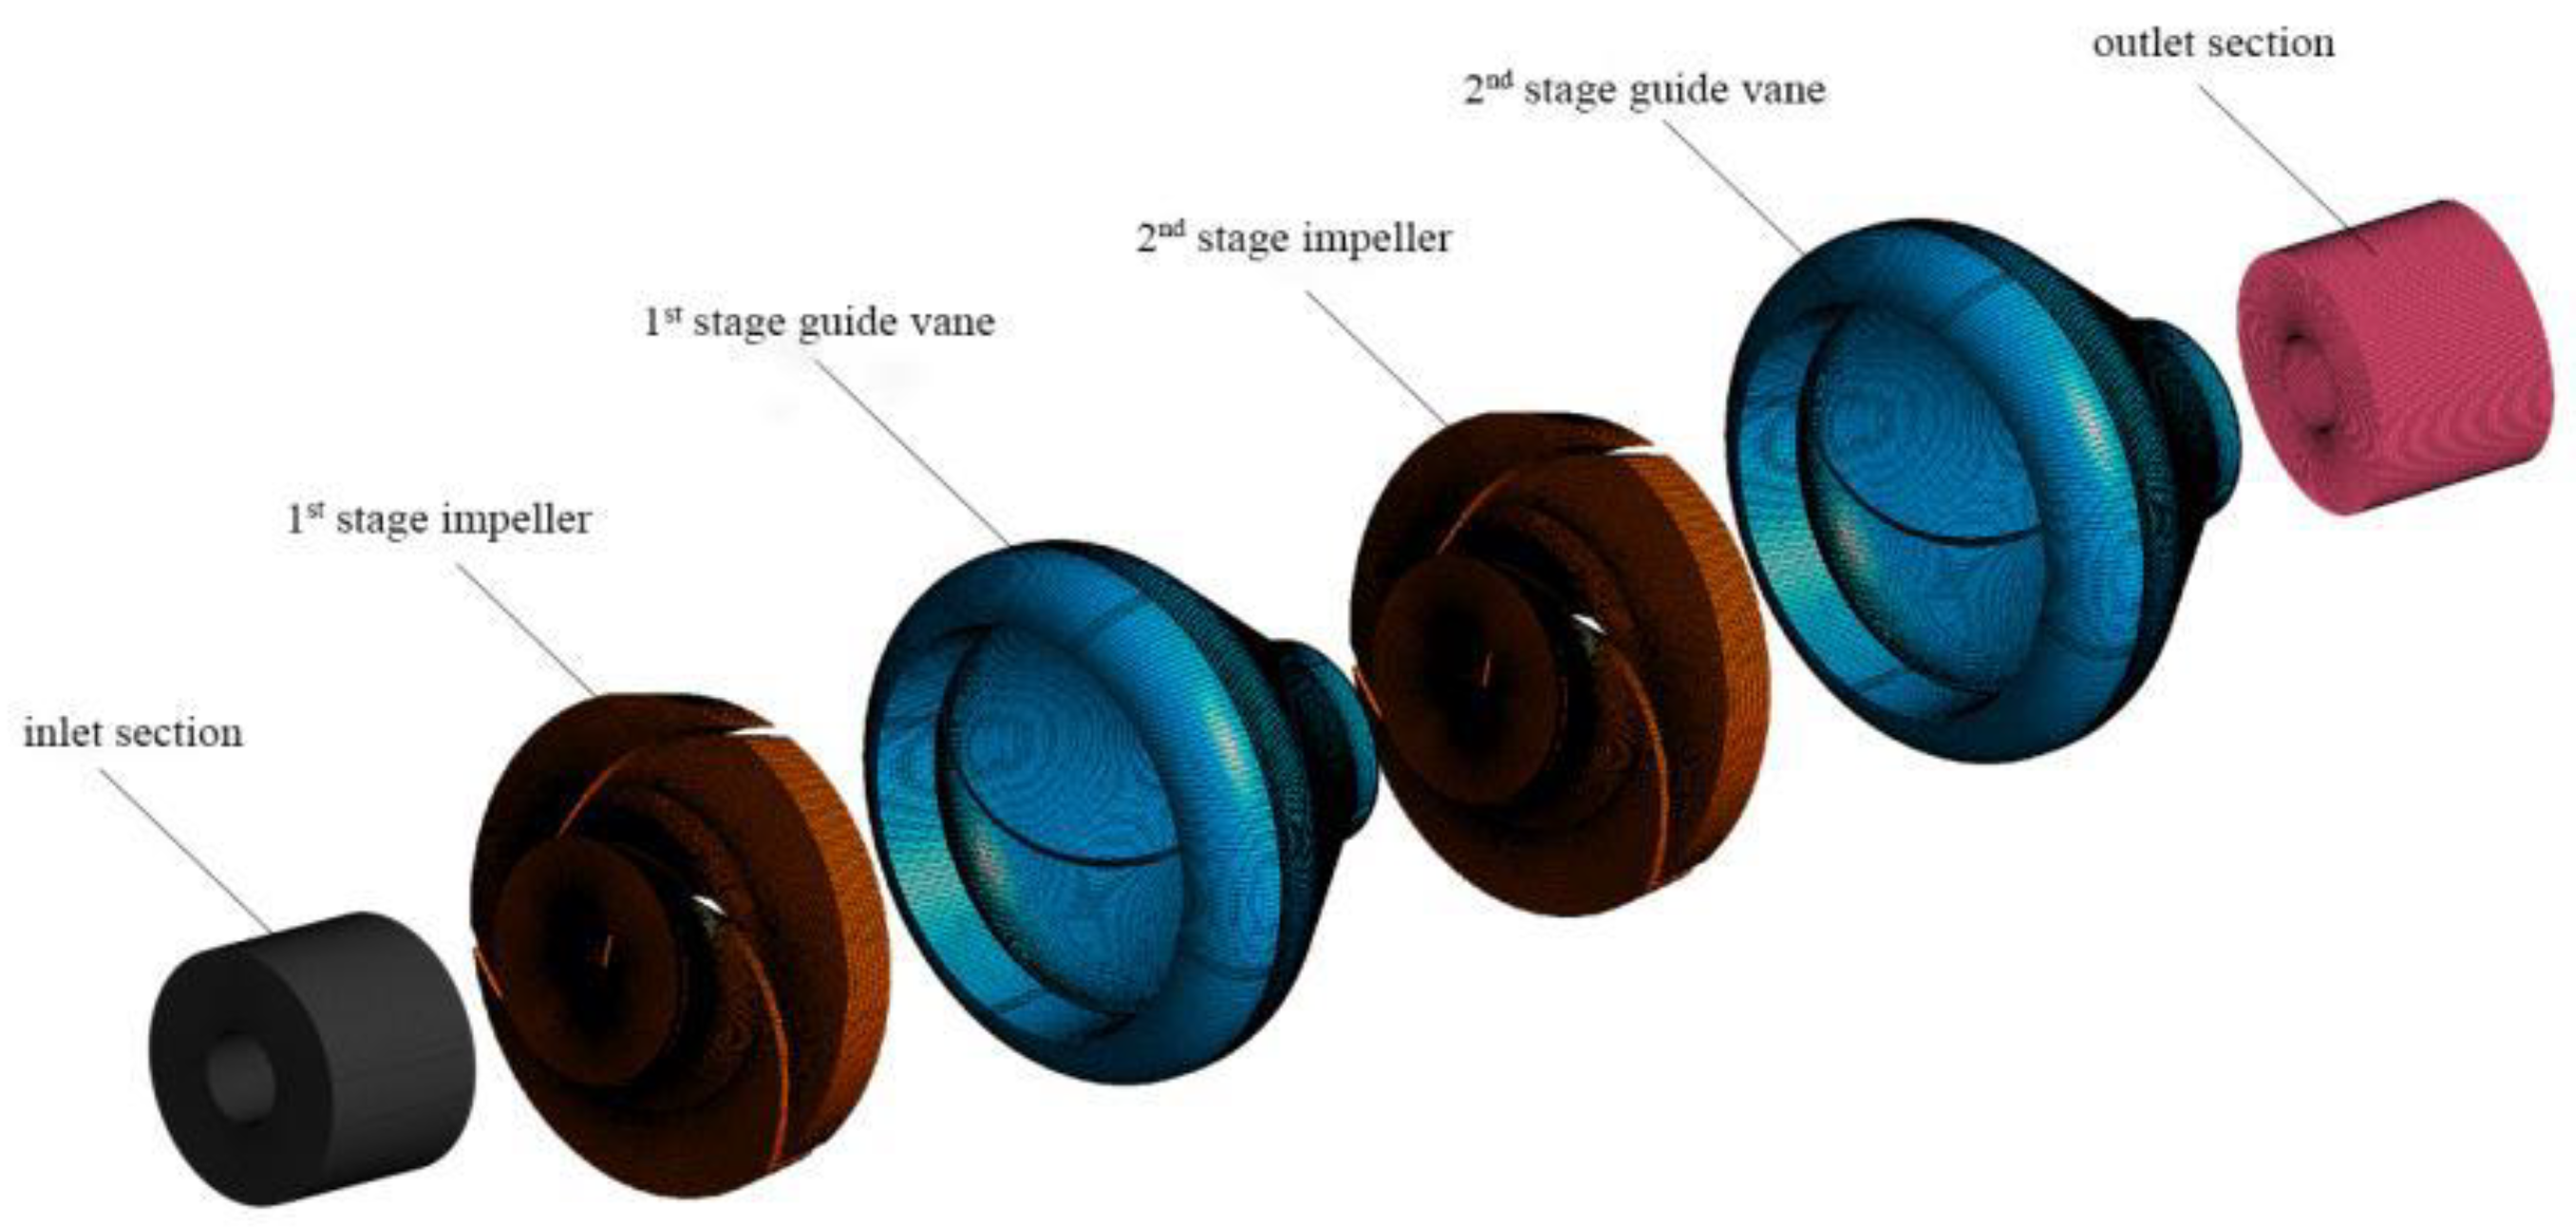
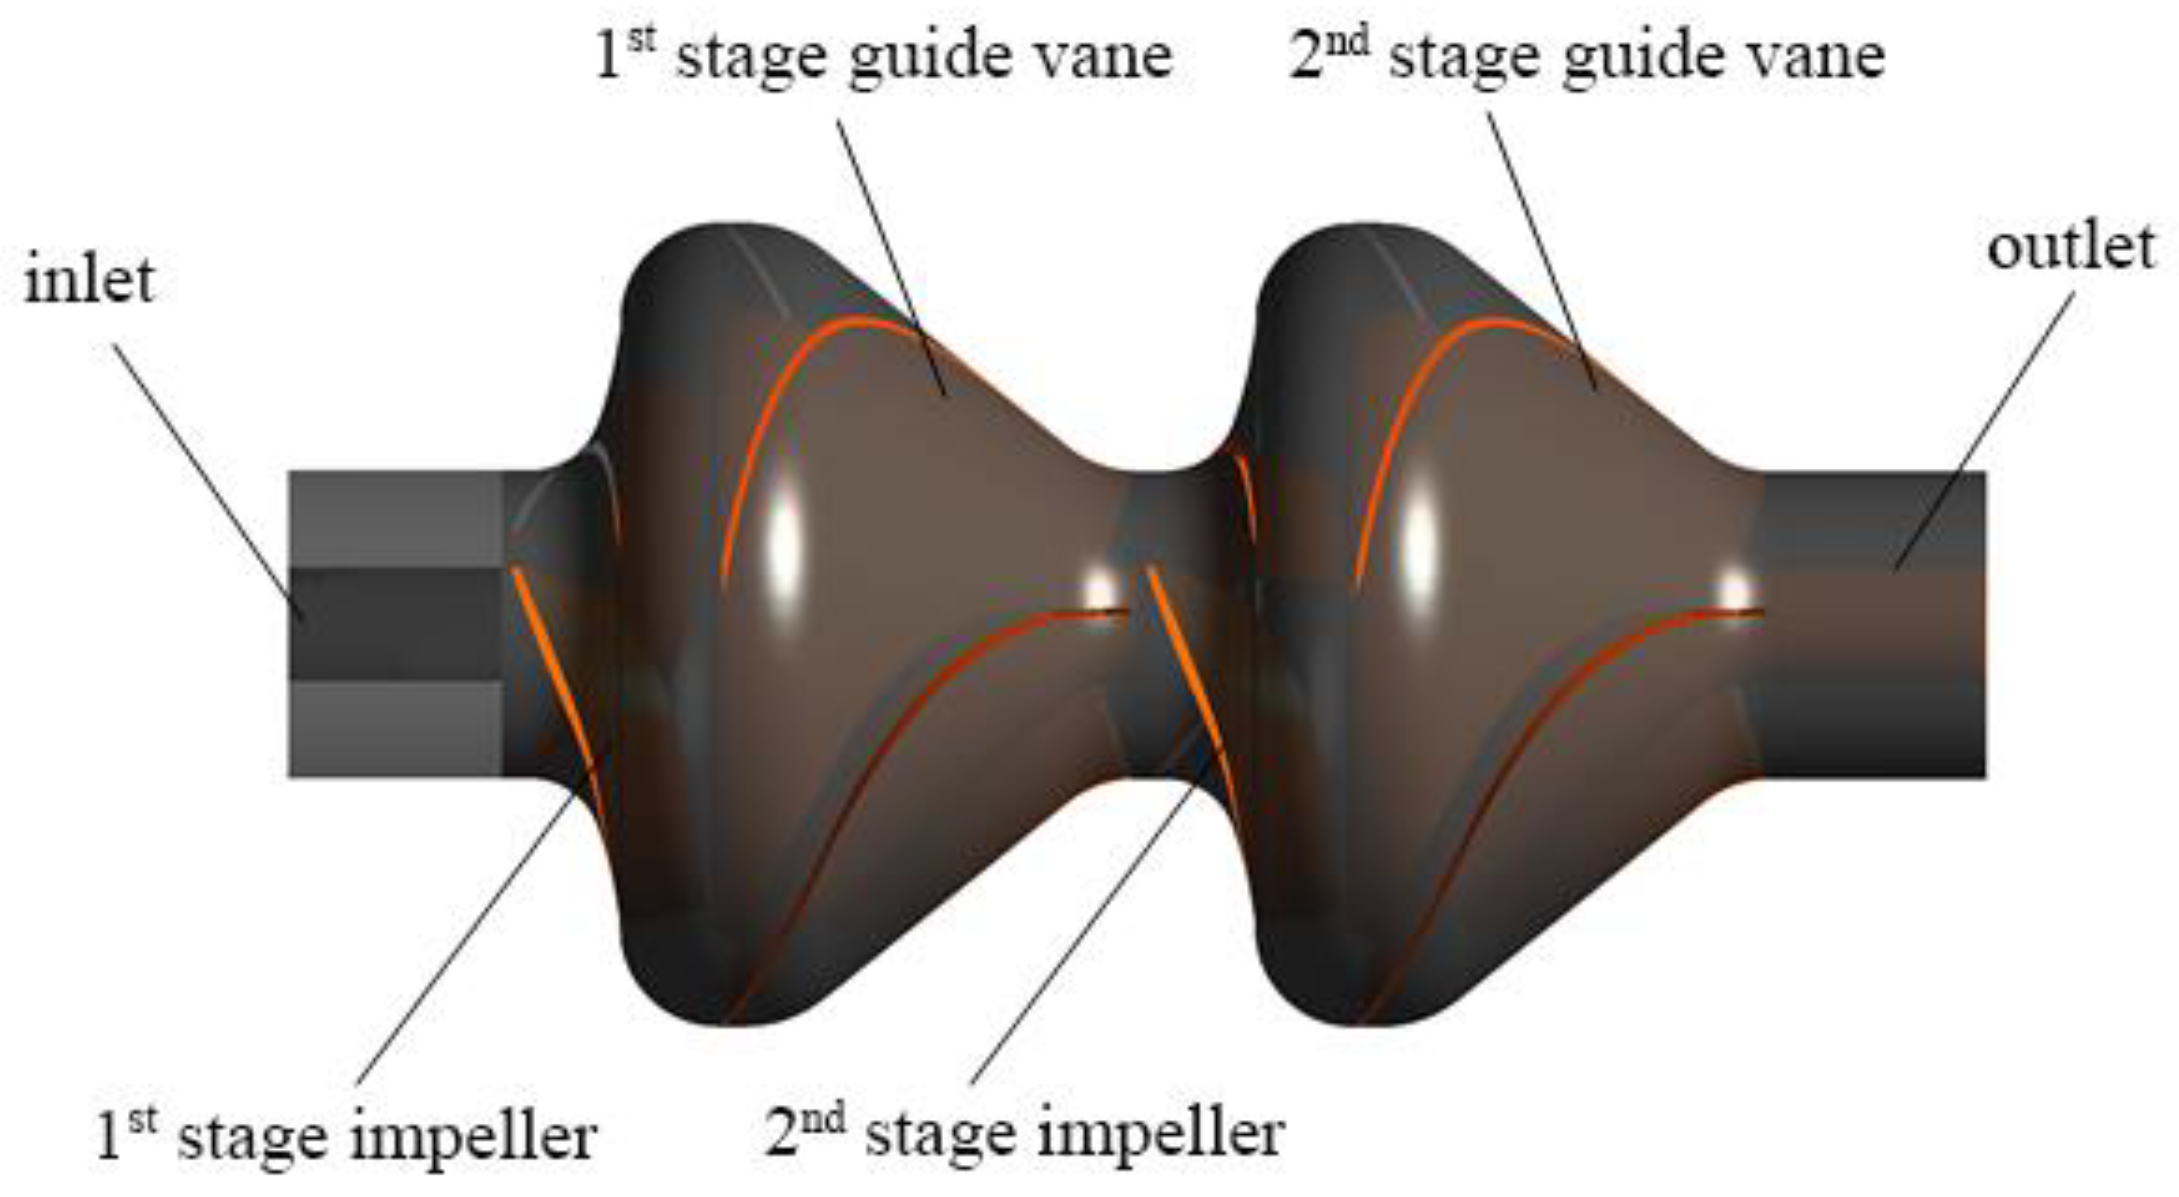
2.1. Three-Dimensional Modeling

The main design parameter values of deep-sea mining pumps adopted in this study were a rated flow rate Qd = 420 m3/h, a single-stage head Hd = 45 m, a rated efficiency ηd = 52%, and a rated rotational speed n = 1450 r/min. The structure of the deep-sea mining pump is composed of hydraulic components such as the impeller, guide vane, suction connection, water outlet connection, water guide jacket and water inlet, motor motive components, and mechanical components (such as couplings and seals). The slurry flows in from the suction connection section of the conveyor electric pump, then passes through the water guide jacket, the water inlet section, and the impeller guide vanes of the pump at all levels, before flowing out from the water outlet guide casing. The main through-passage components of the mining pump are shown in Figure 1.
In the numerical simulations, the full flow field computational domain includes the inlet section, the first-stage impeller, the first-stage guide vane, the second-stage impeller, the second-stage guide vane, and the outlet section, as shown in Figure 2. The overall structure model is shown in Figure 3.

2.2. Numerical Calculation Strategy

2.2.1. Numerical Calculation Method

Ansys Fluent 18.0 was used to perform steady numerical simulations of the computational domain of the mining pump. In the computational process, it is assumed that there is no energy and mass exchange between the particle phase and the fluid phase, and that gravity is taken into account. The computation of the fluid domain adopts the SST k-ω turbulence model, the motion of the particle phase in the computational domain adopts the DPM model based on Euler–Lagrange coordinates, there is momentum exchange in this model, the discretization of the Navier–Stokes equation adopts the second-order upwind style, and the computational convergence precision is set as 10−4 in the numerical simulation.
Using the x-axis direction as an example, the equation for particle motion in the computational domain can be expressed as follows:
d u p d t = F D ( u u p ) + g x ( ρ p ρ ) ρ p + F V + F P + F x
where F D ( u u p ) is the drag force on a unit mass of solid-phase particles, as follows:
F D = 18 μ ρ p d p 2 C D R e 24
where, u is the fluid velocity (m/s), u p is the particle velocity (m/s), μ is the dynamic viscosity (N·s/m2), ρ is the fluid density (kg/m3), ρ p is the particle density (kg/m3), d p is the particle diameter (mm), and g x is the acceleration of gravity in the x-axis direction (m/s2).

2.2.2. Boundary Conditions

The boundary conditions of the calculation domain are as follows. The pump inlet is specified using the flow velocity, and the particle incident velocity is the same as that of the fluid. The pump outlet is specified as a condition of free outflow. The interface between the extended inlet section and the impeller inlet, as well as that between the impeller outlet and space guide vane, are specified in the numerical calculation as “Interface”. The mesh motion was used for data transmission. Assuming that one week of impeller rotation is 120 time steps (i.e., the impeller rotates approximately 3° over each time step), one time step corresponds to 0.00034483 s. The residual error was set to have a precision of 1 × 10⁻⁴, and the calculation results were determined to have converged when the average flow rate and pressure at the pump inlet and outlet between successive calculation steps exhibit a deviation of less than 0.001%.

2.3. Selection of the Wear Model

The expression of the wear prediction model used in the computation of the surface wear of the mining pump through-passage components can be expressed as shown in Equation (3) [32]:
R e r o s i o n = n = 1 N p a r t i c l e s m p C ( d p ) f ( θ ) v b ( v ) A f a c e
where
Rerosion: erosion rate;
C ( d p ) : particle size function of the solid-phase particles;
θ : impact angle between the particle and the wall;
f(θ): function of the impact angle;
v: relative velocity between the particle and the wall, m/s;
b(v): function of the relative velocity between the particle and the wall;
A f a c e : unit surface area of the wall, mm2;
N : the number of particles impacting the cell surface area;
m p : mass of a single particle;
d p : particle size; and
n : number of particles.
After combining the above formula and the particle motion trajectory for analysis, the wear on the surface of the pump’s various through-passage components caused by the movement of solid-phase particles in the computational domain can be quantitatively predicted. The impact angle function, f(θ), can expressed using a piecewise polynomial, as follows:
When θ ≤ 15°, then:
f ( θ ) = b θ 2 + c θ
When θ > 15°, then:
f ( θ ) = x cos 2 θ sin ( w θ ) + y sin 2 ( θ ) + z
The values of the constants in the above formula are shown in Table 1.

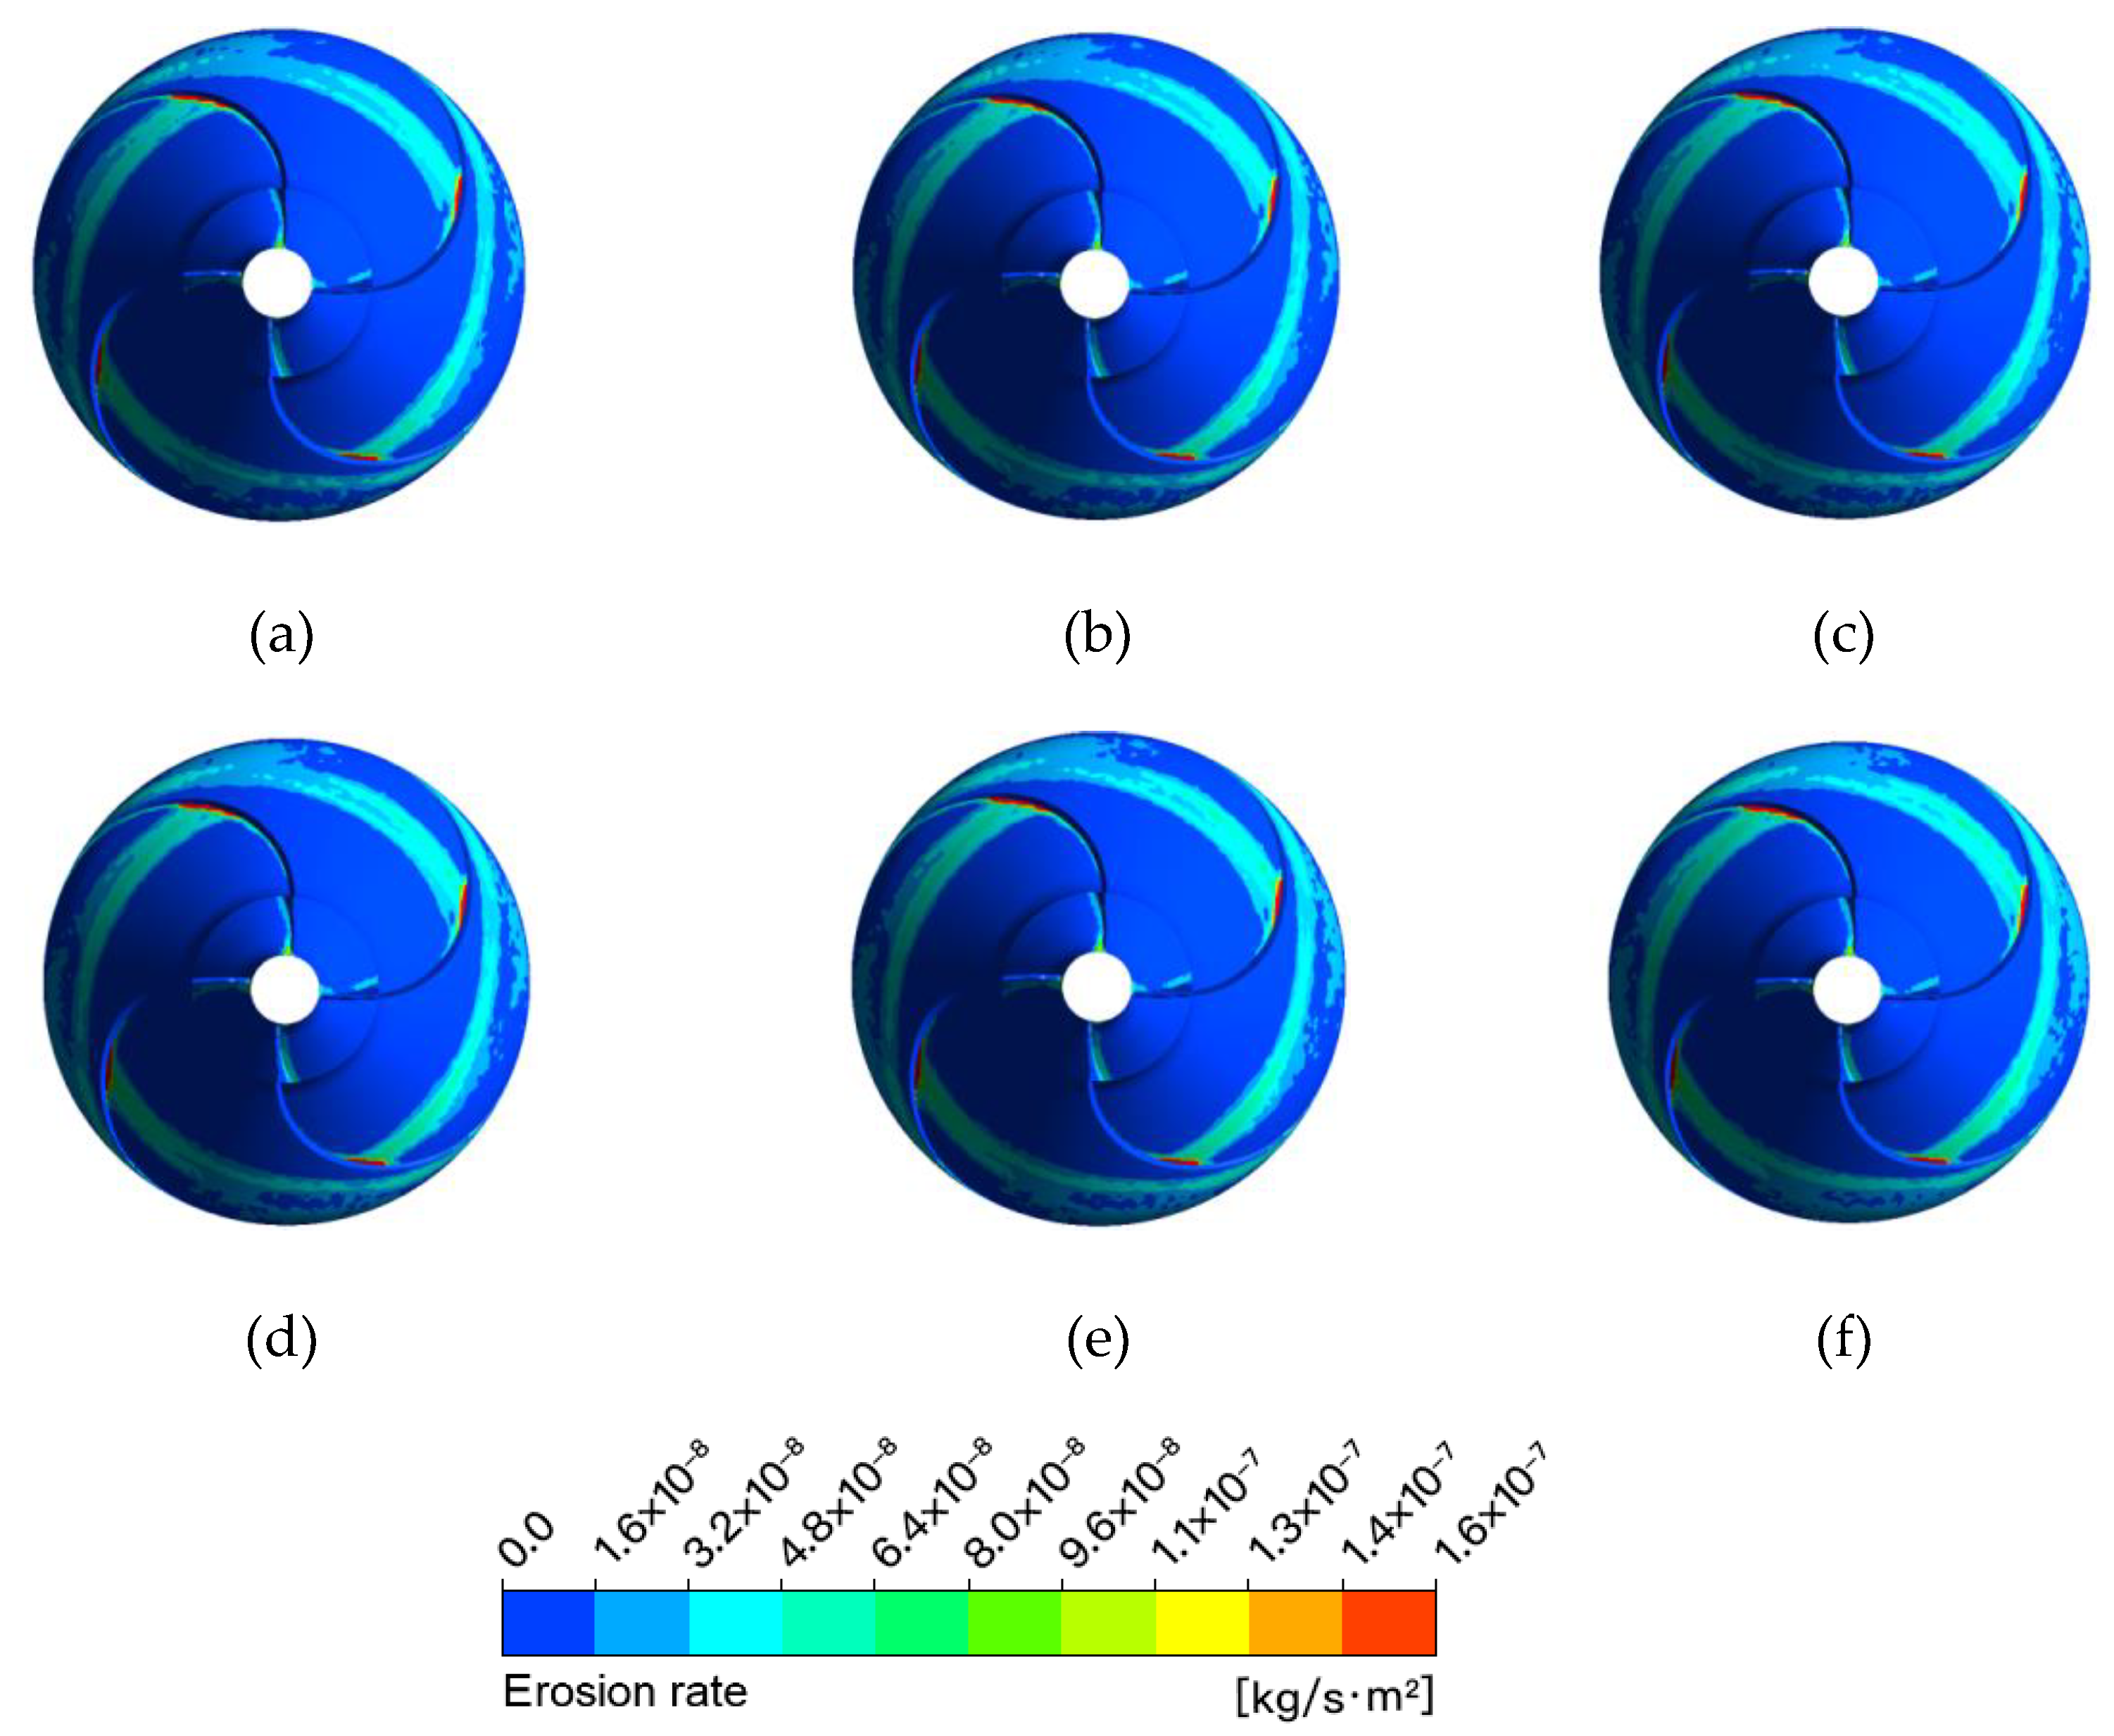
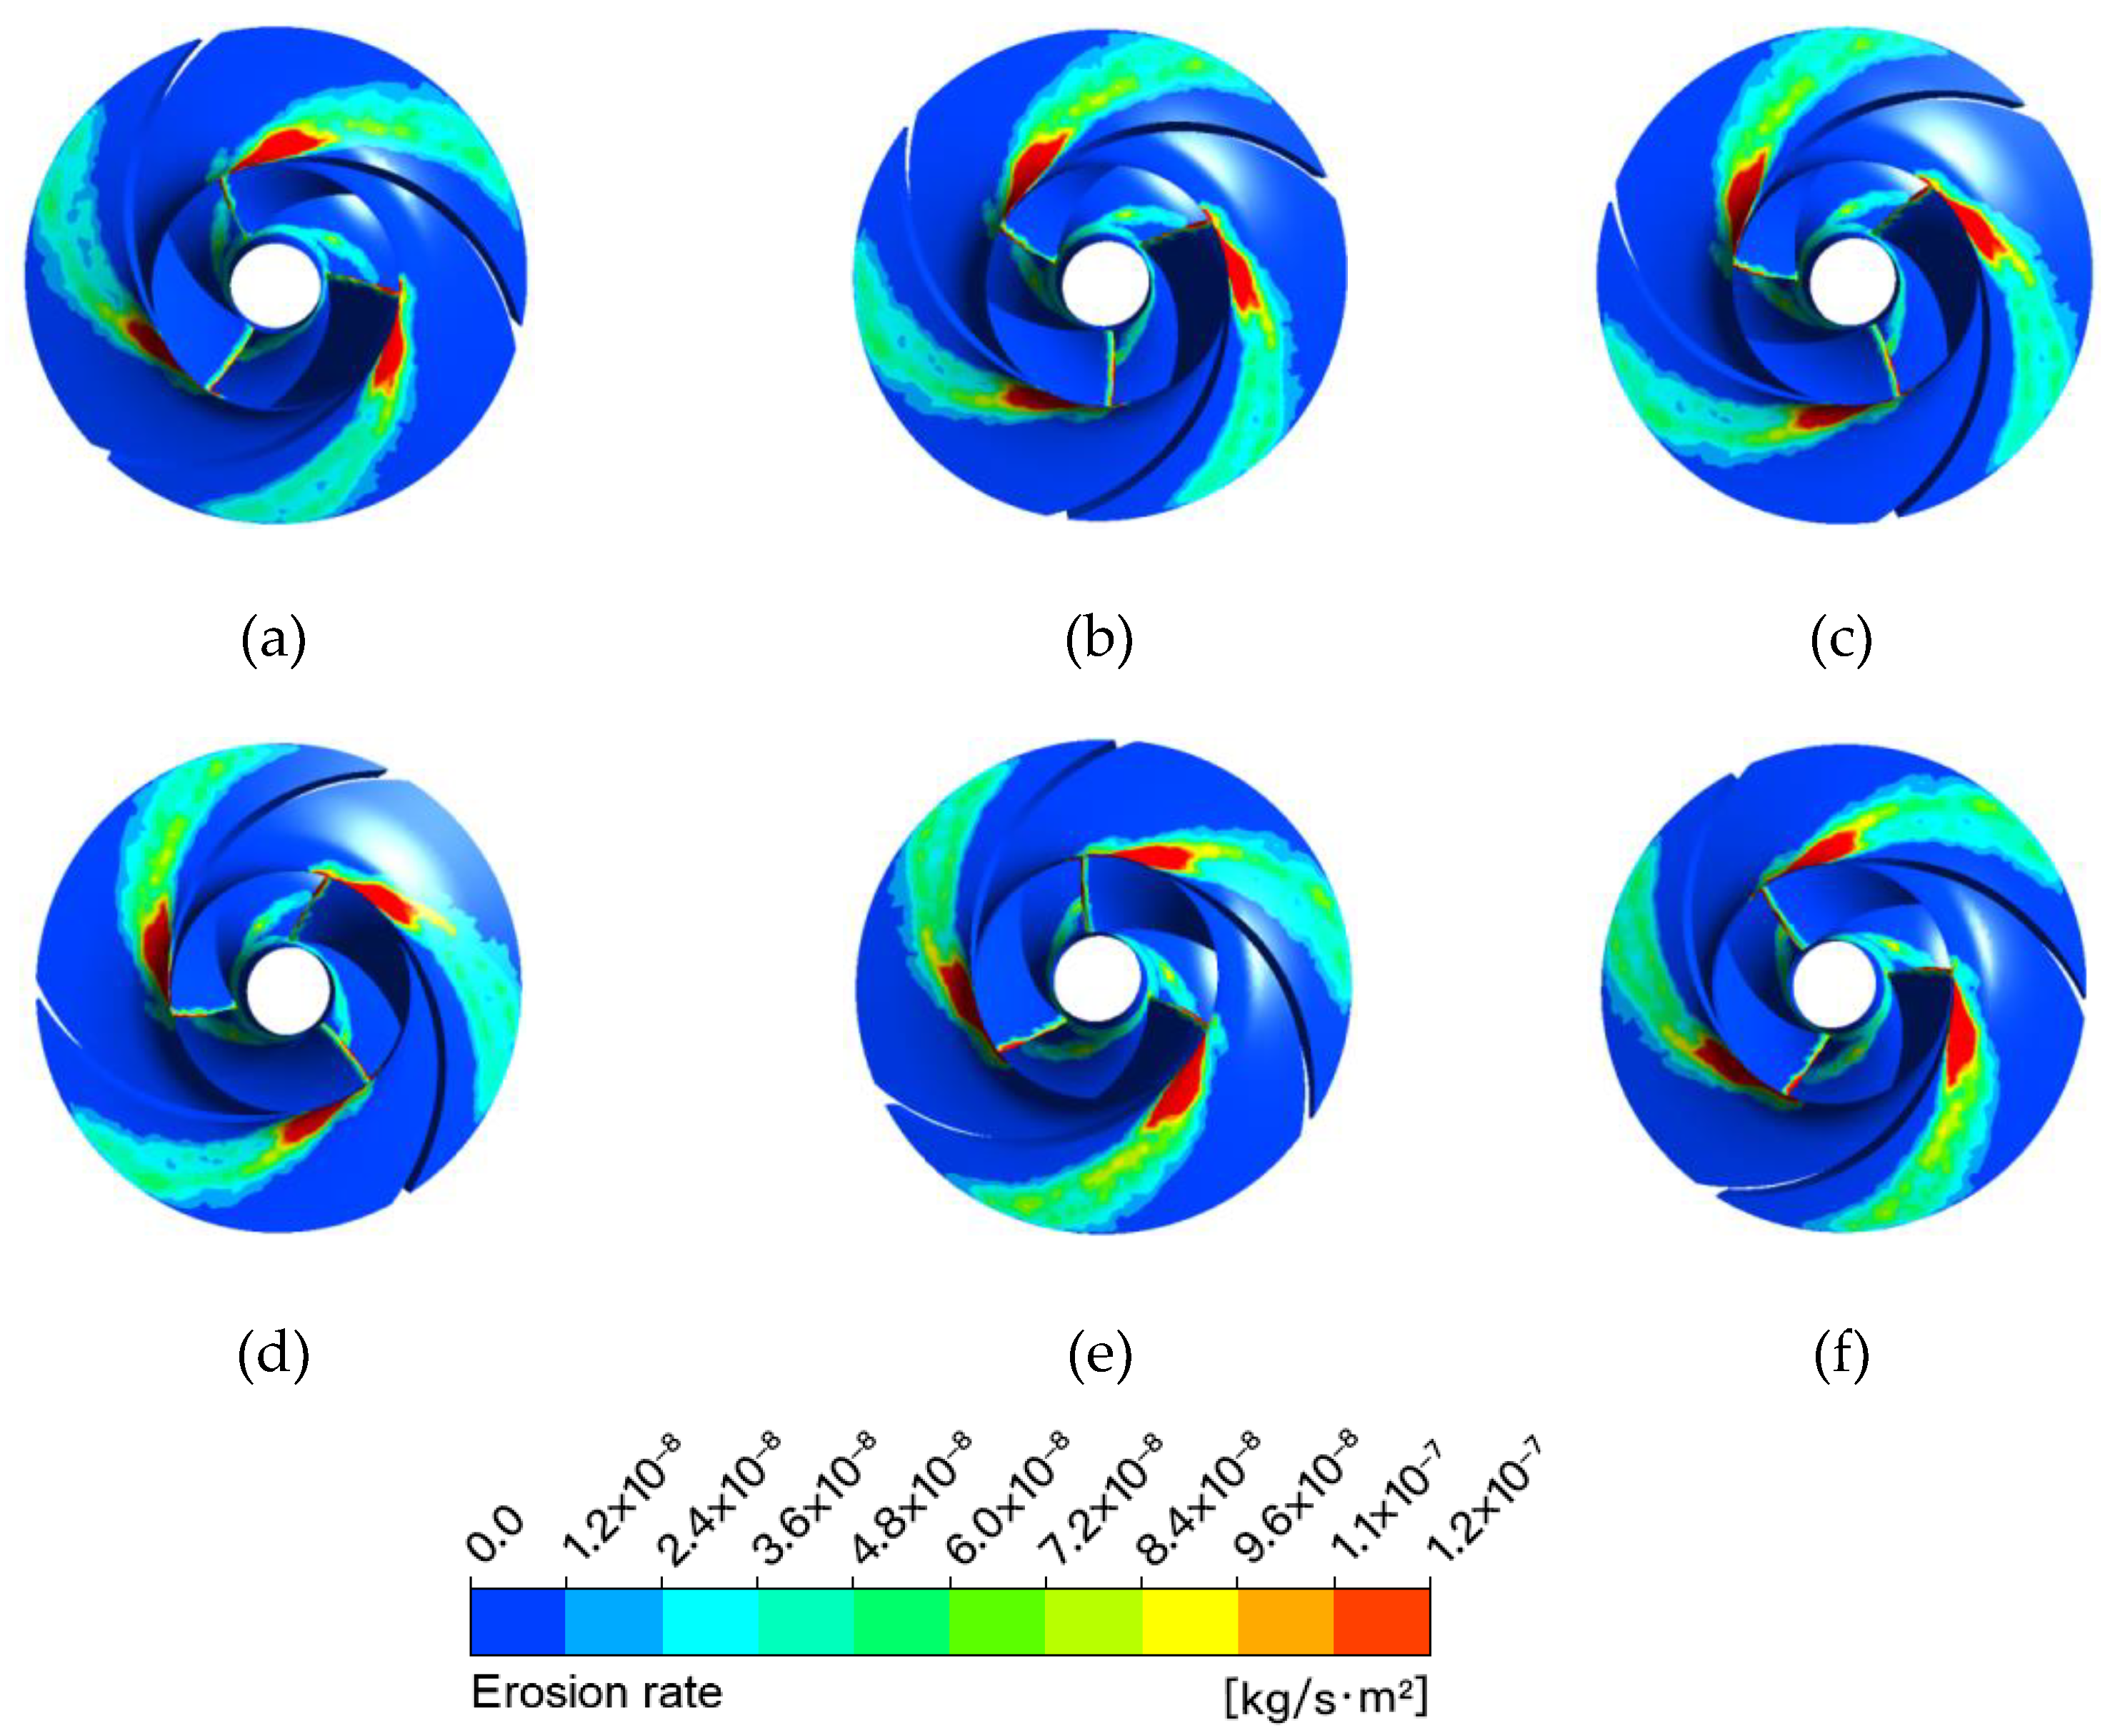
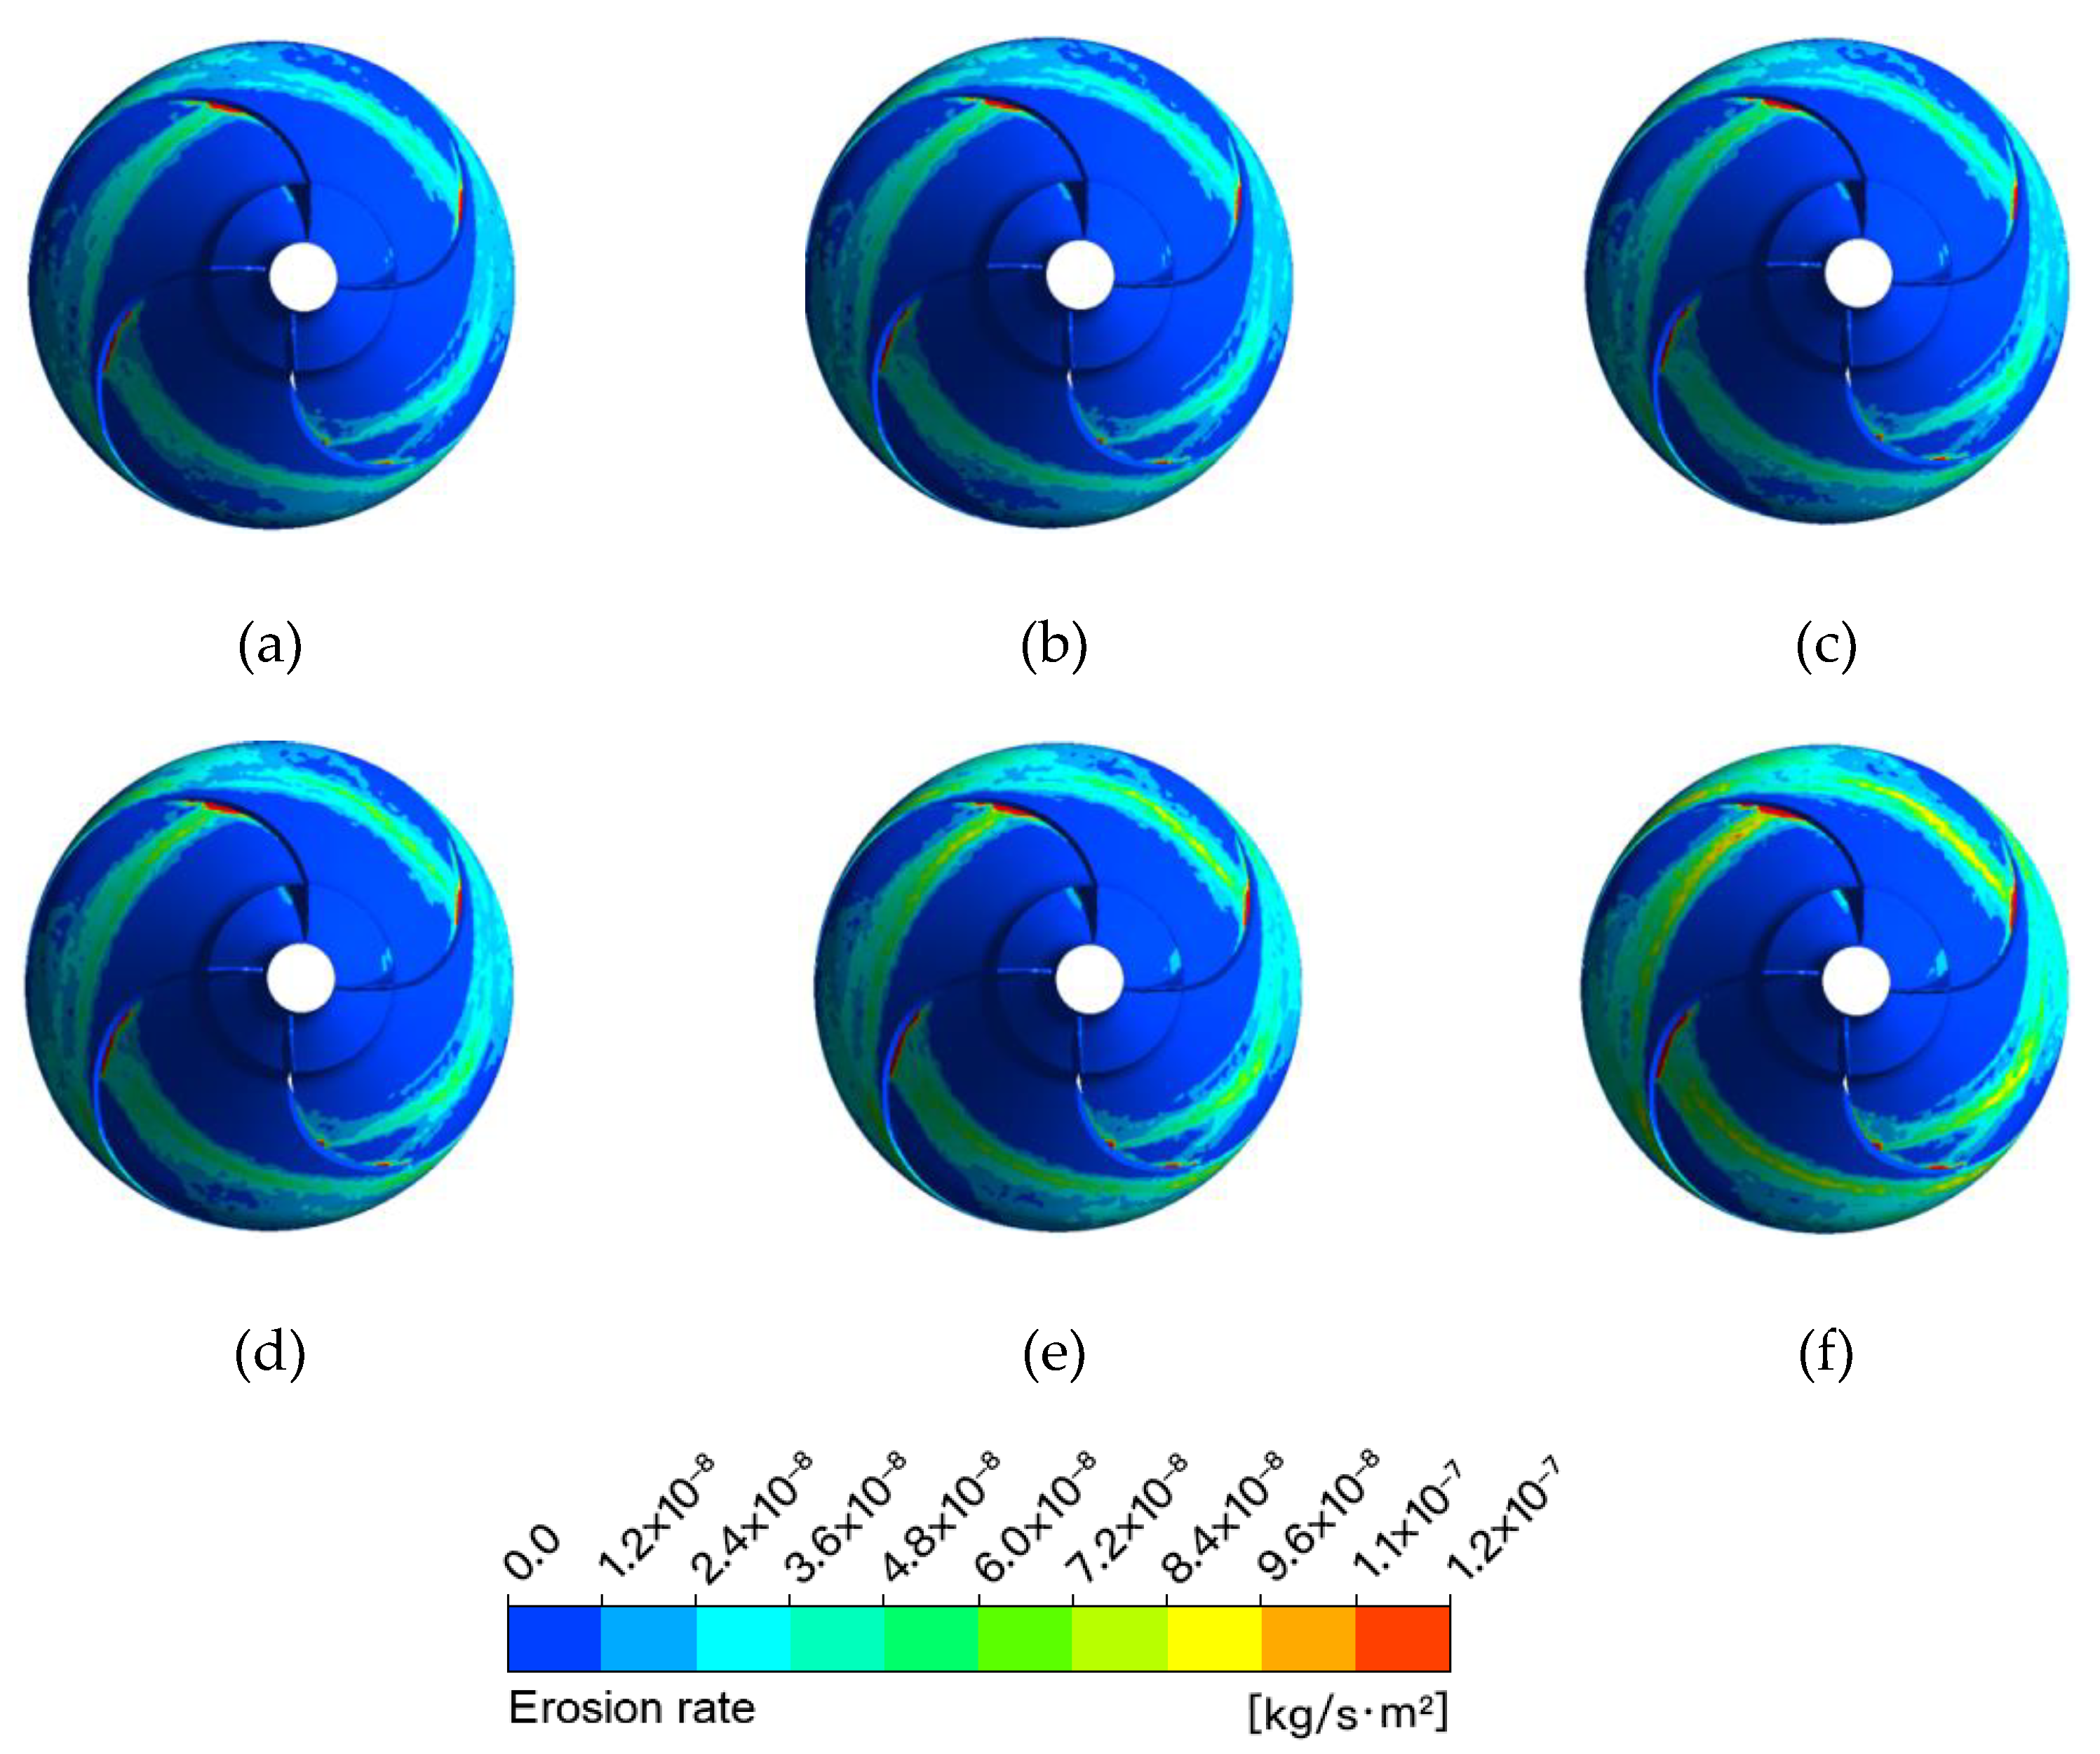
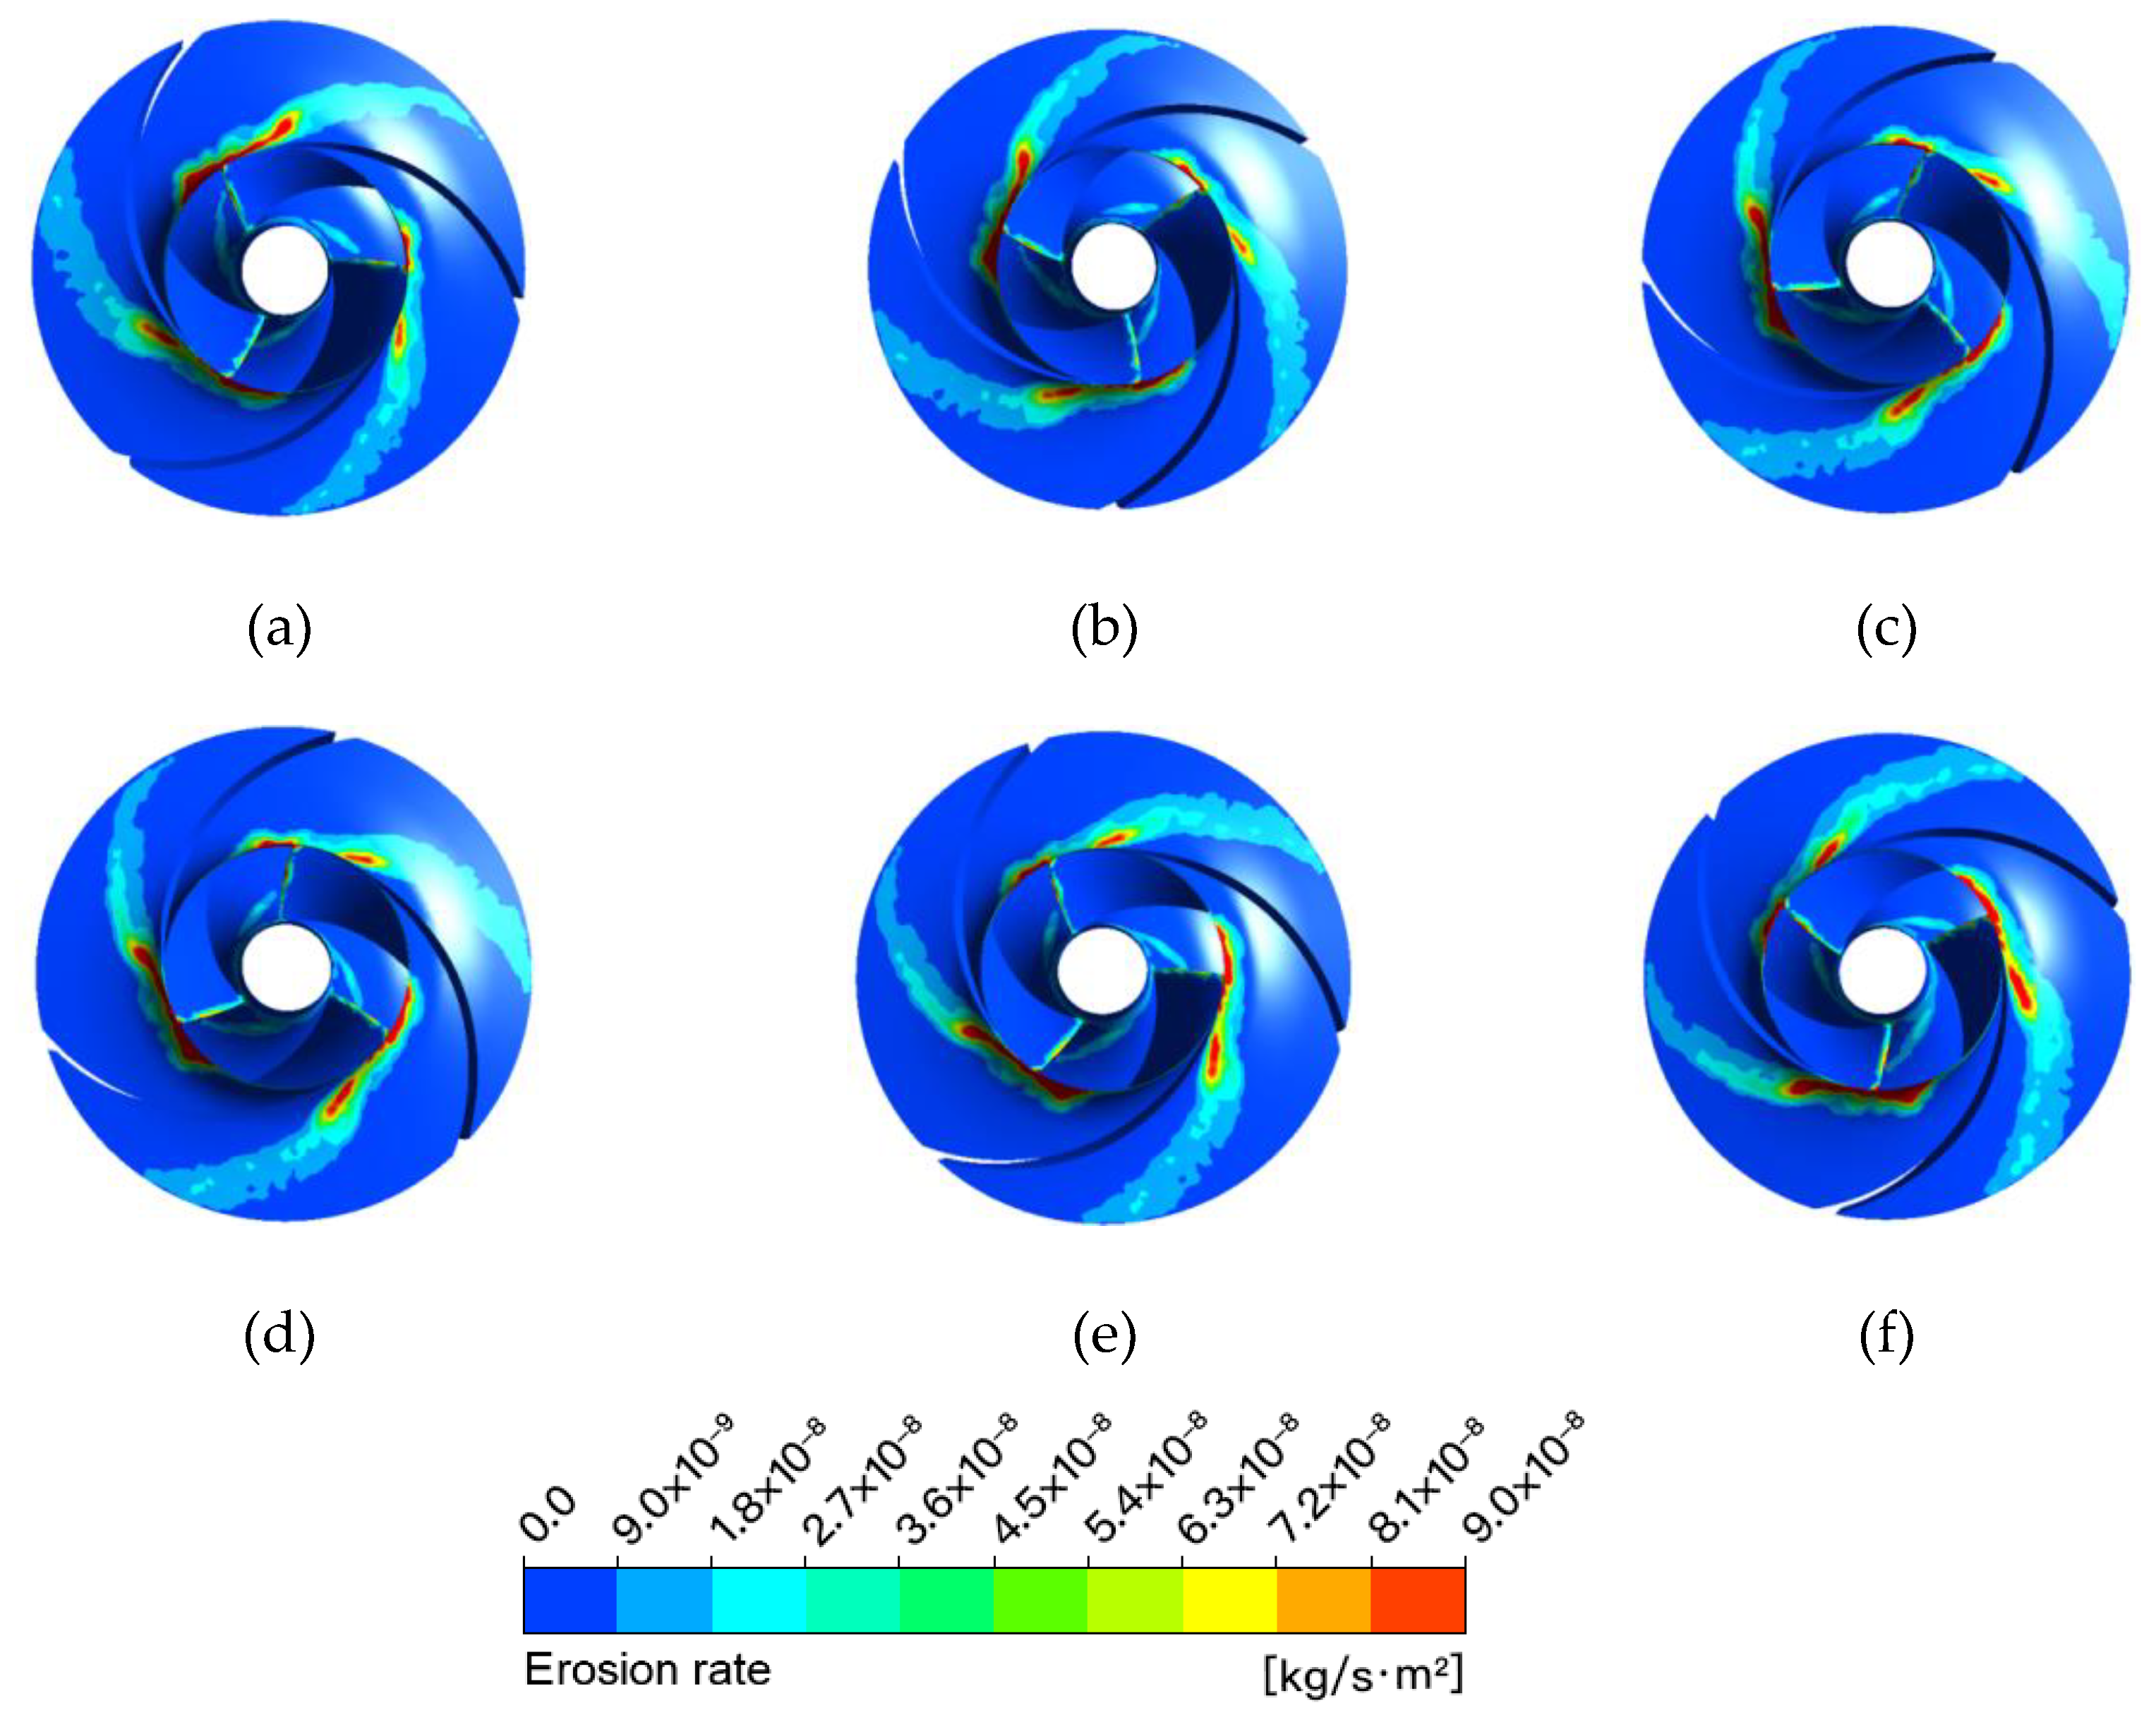
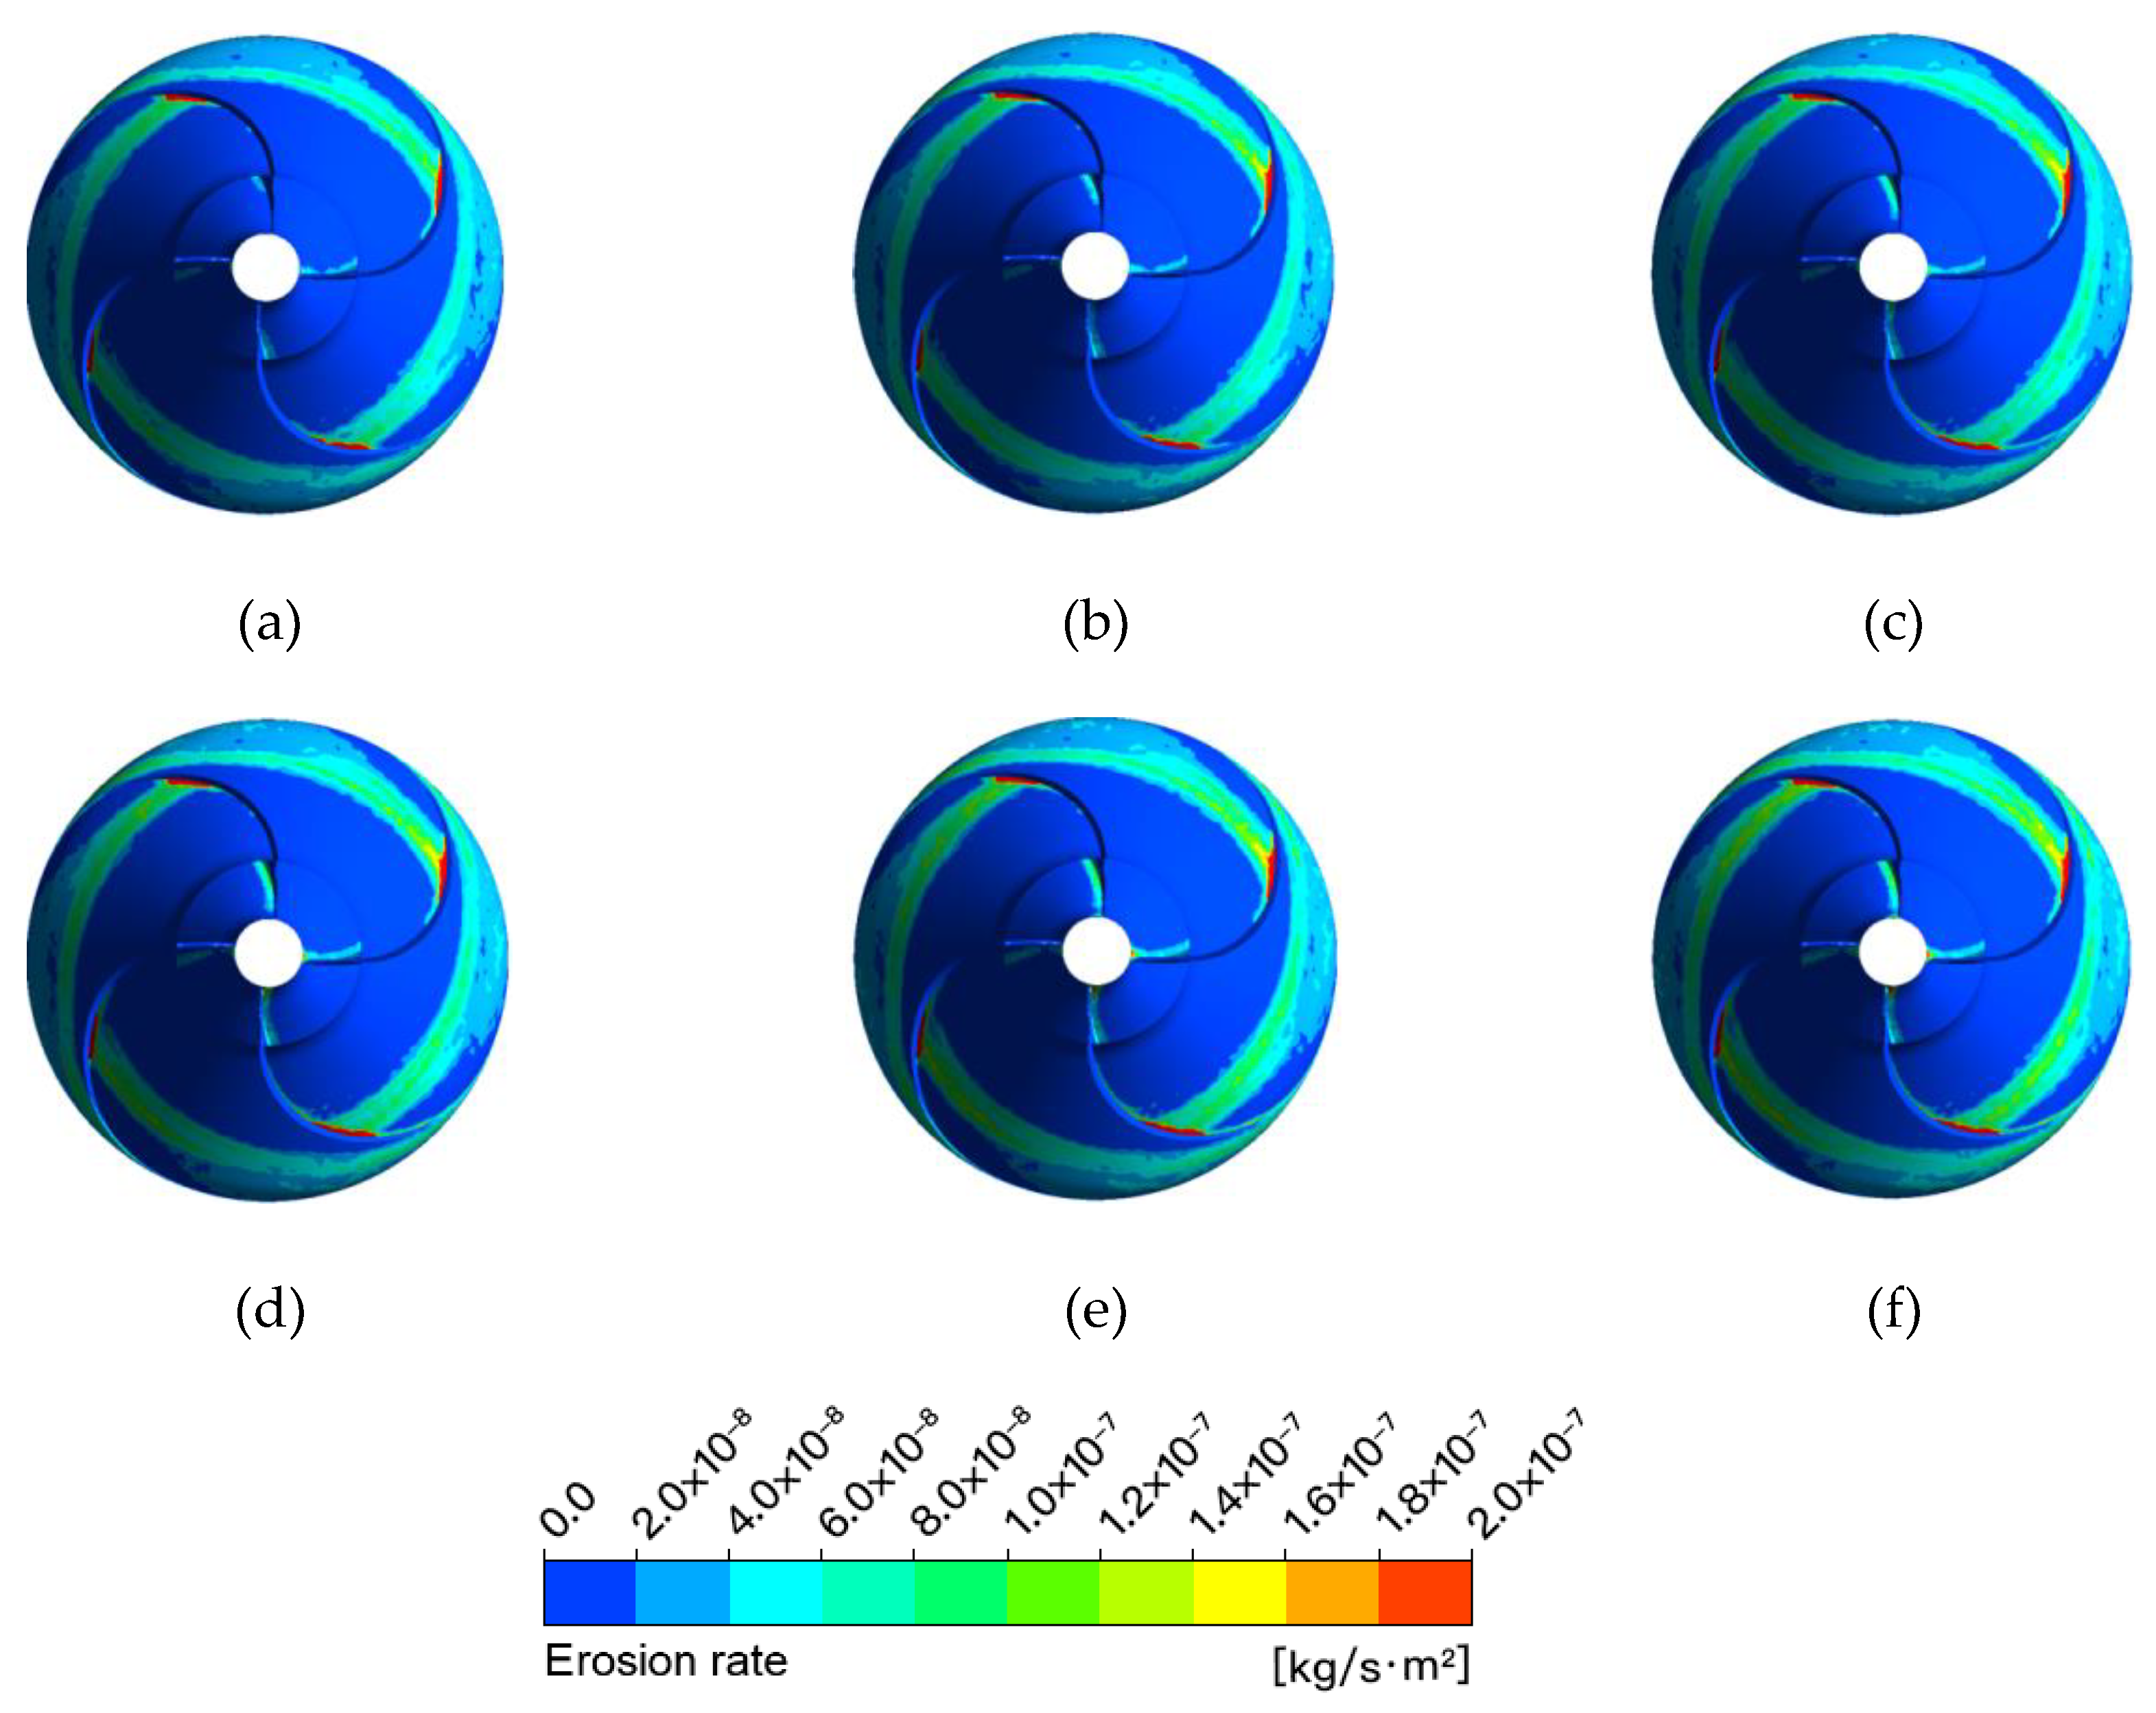
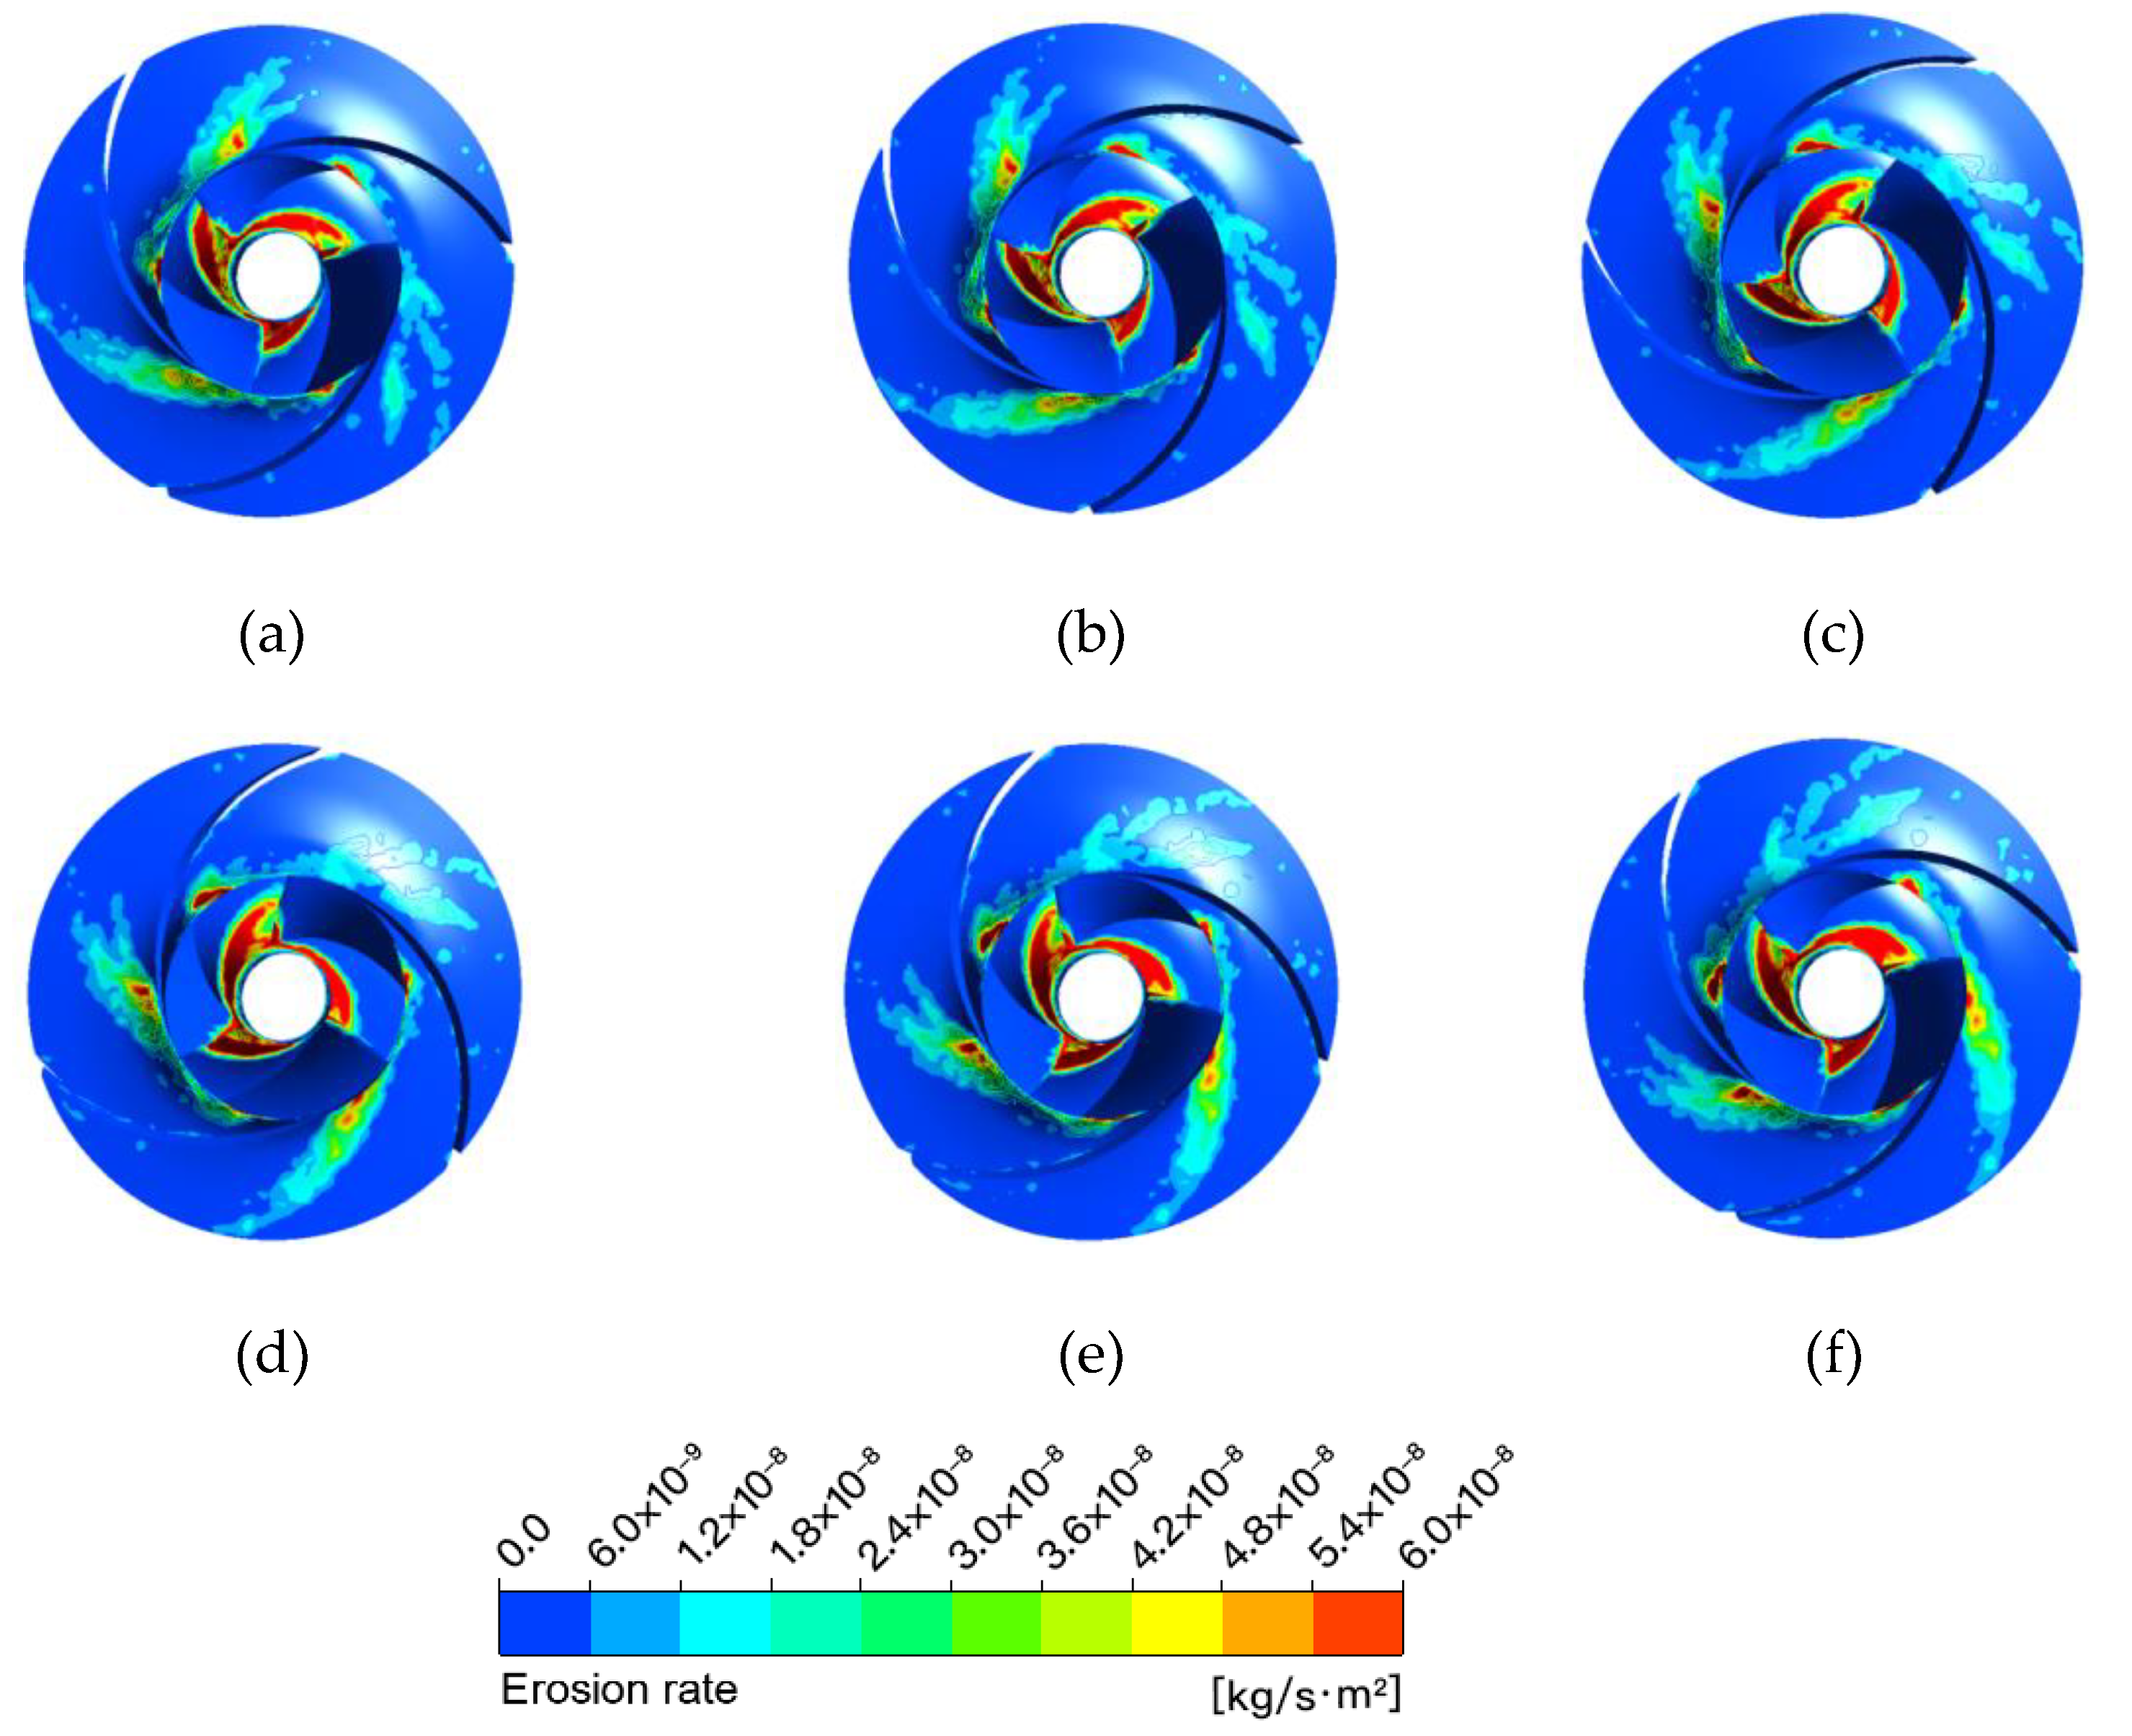
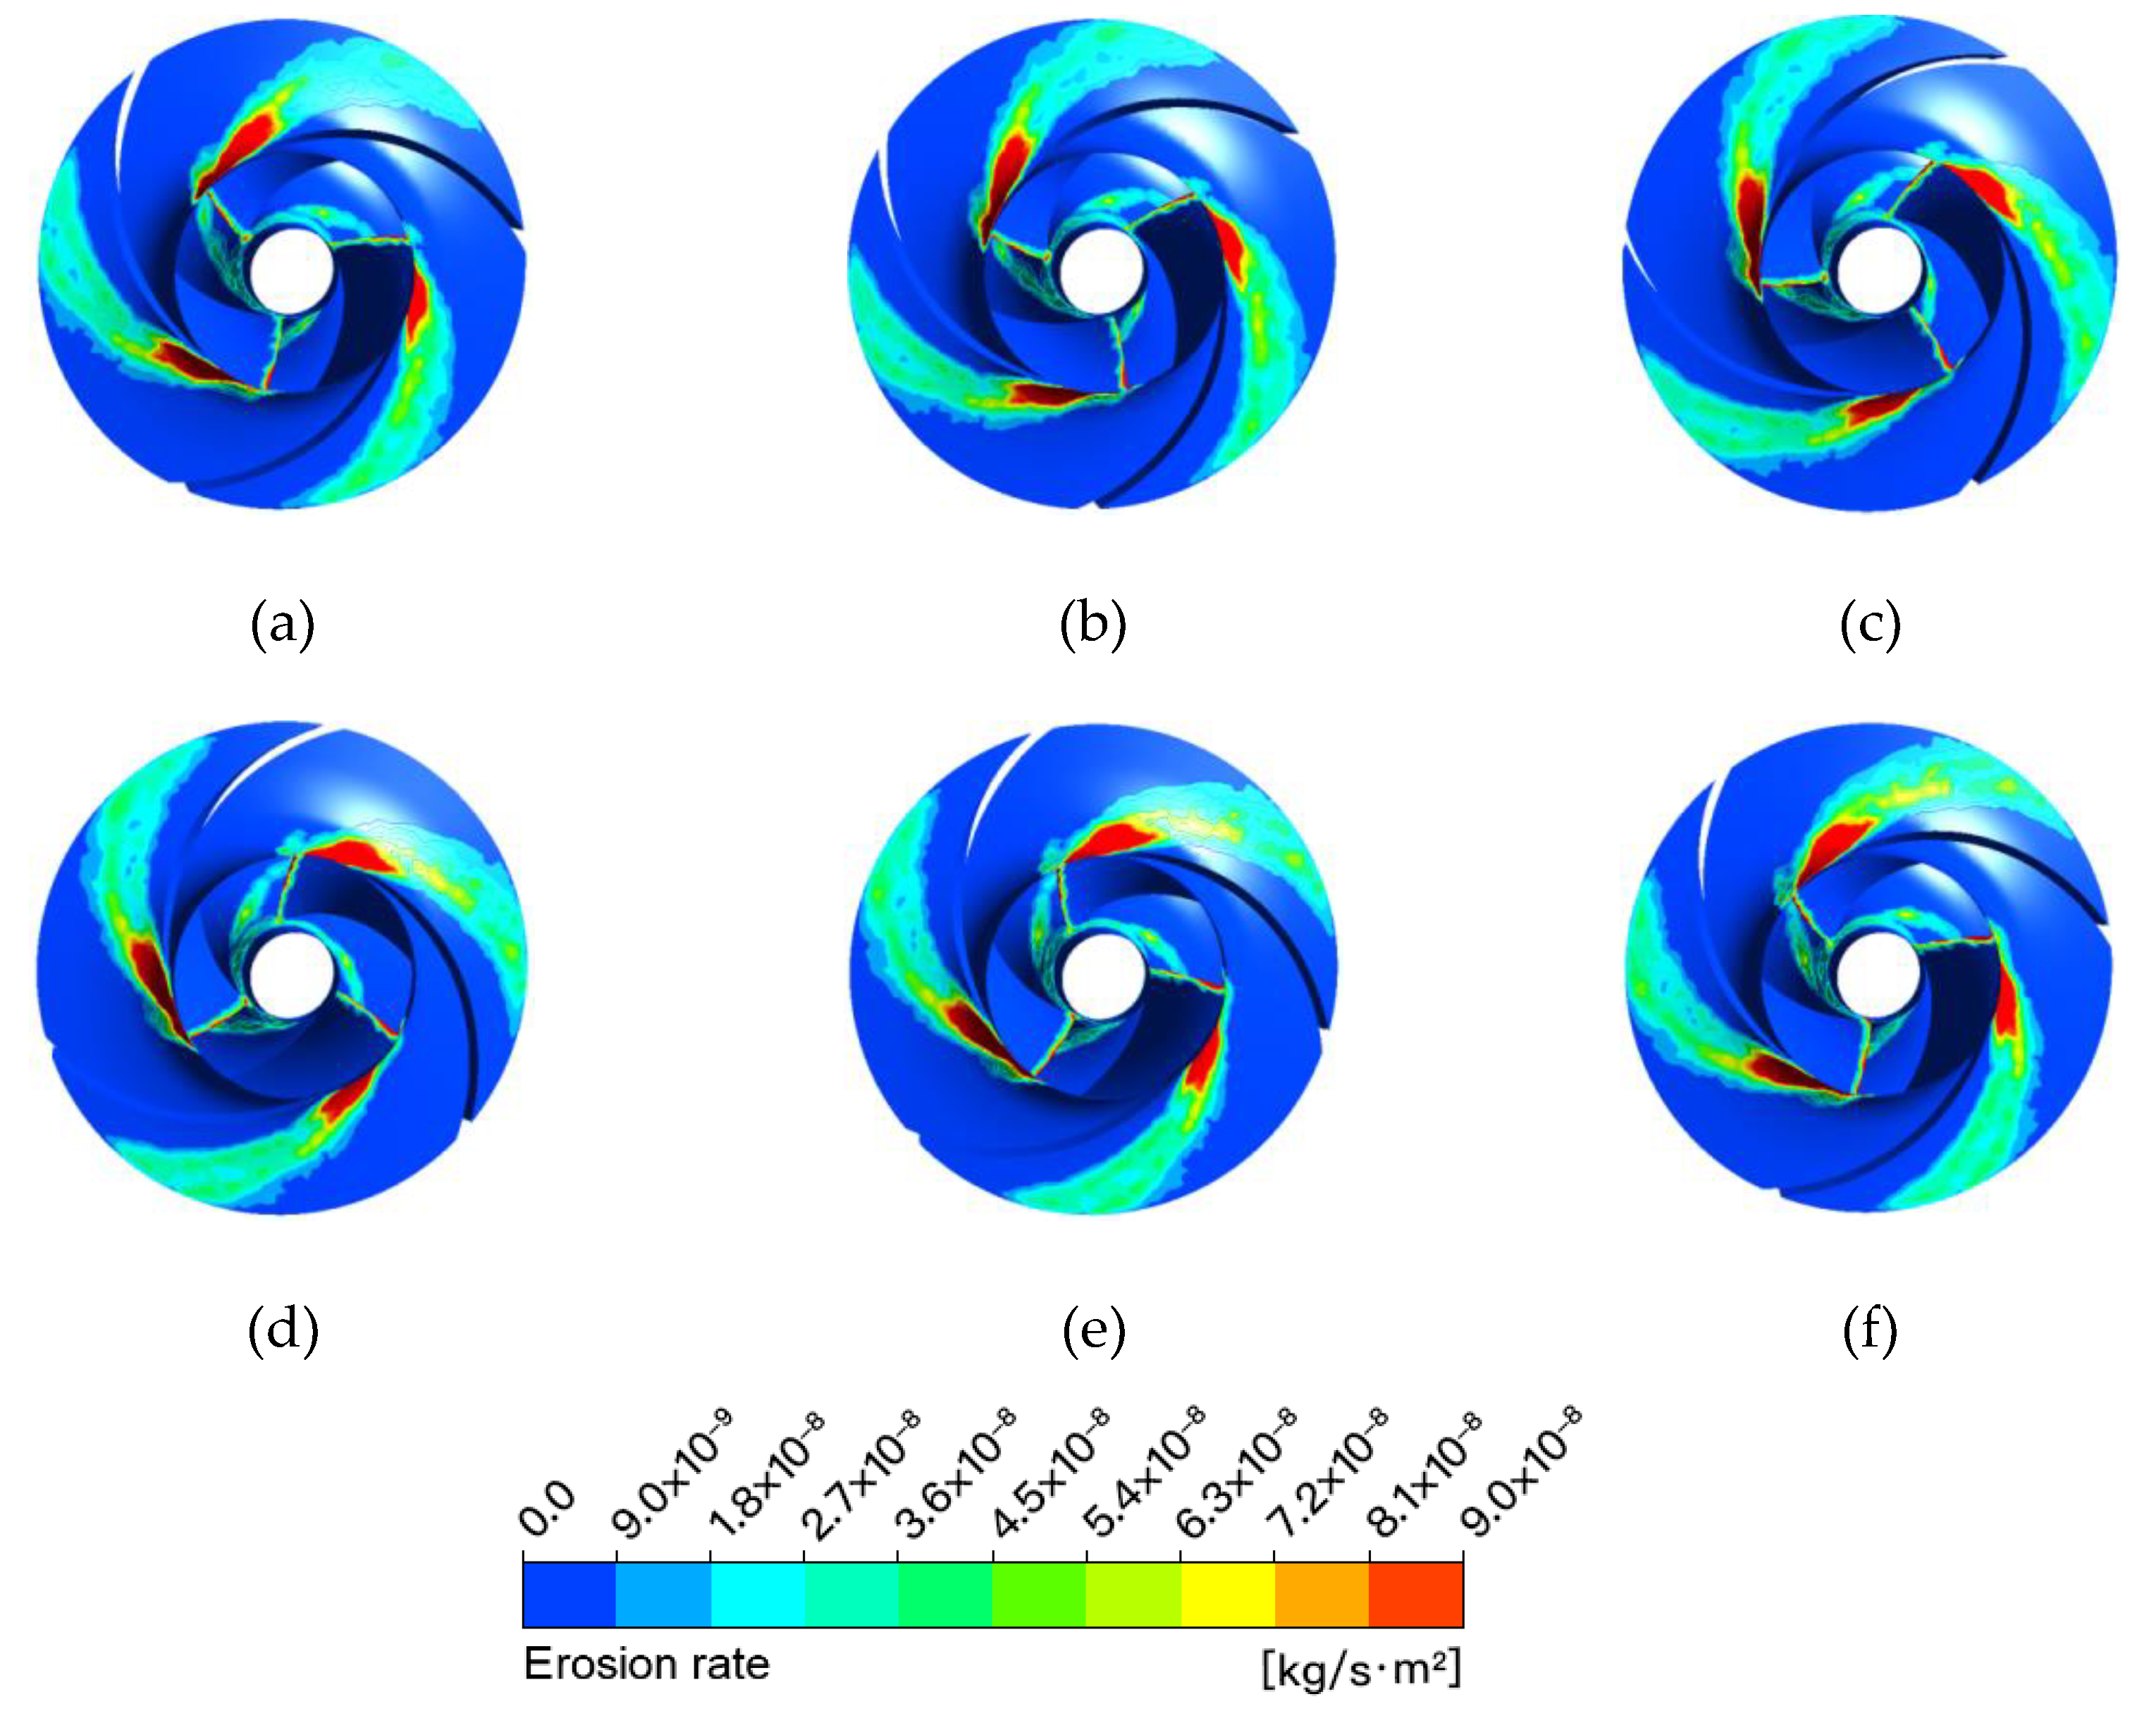
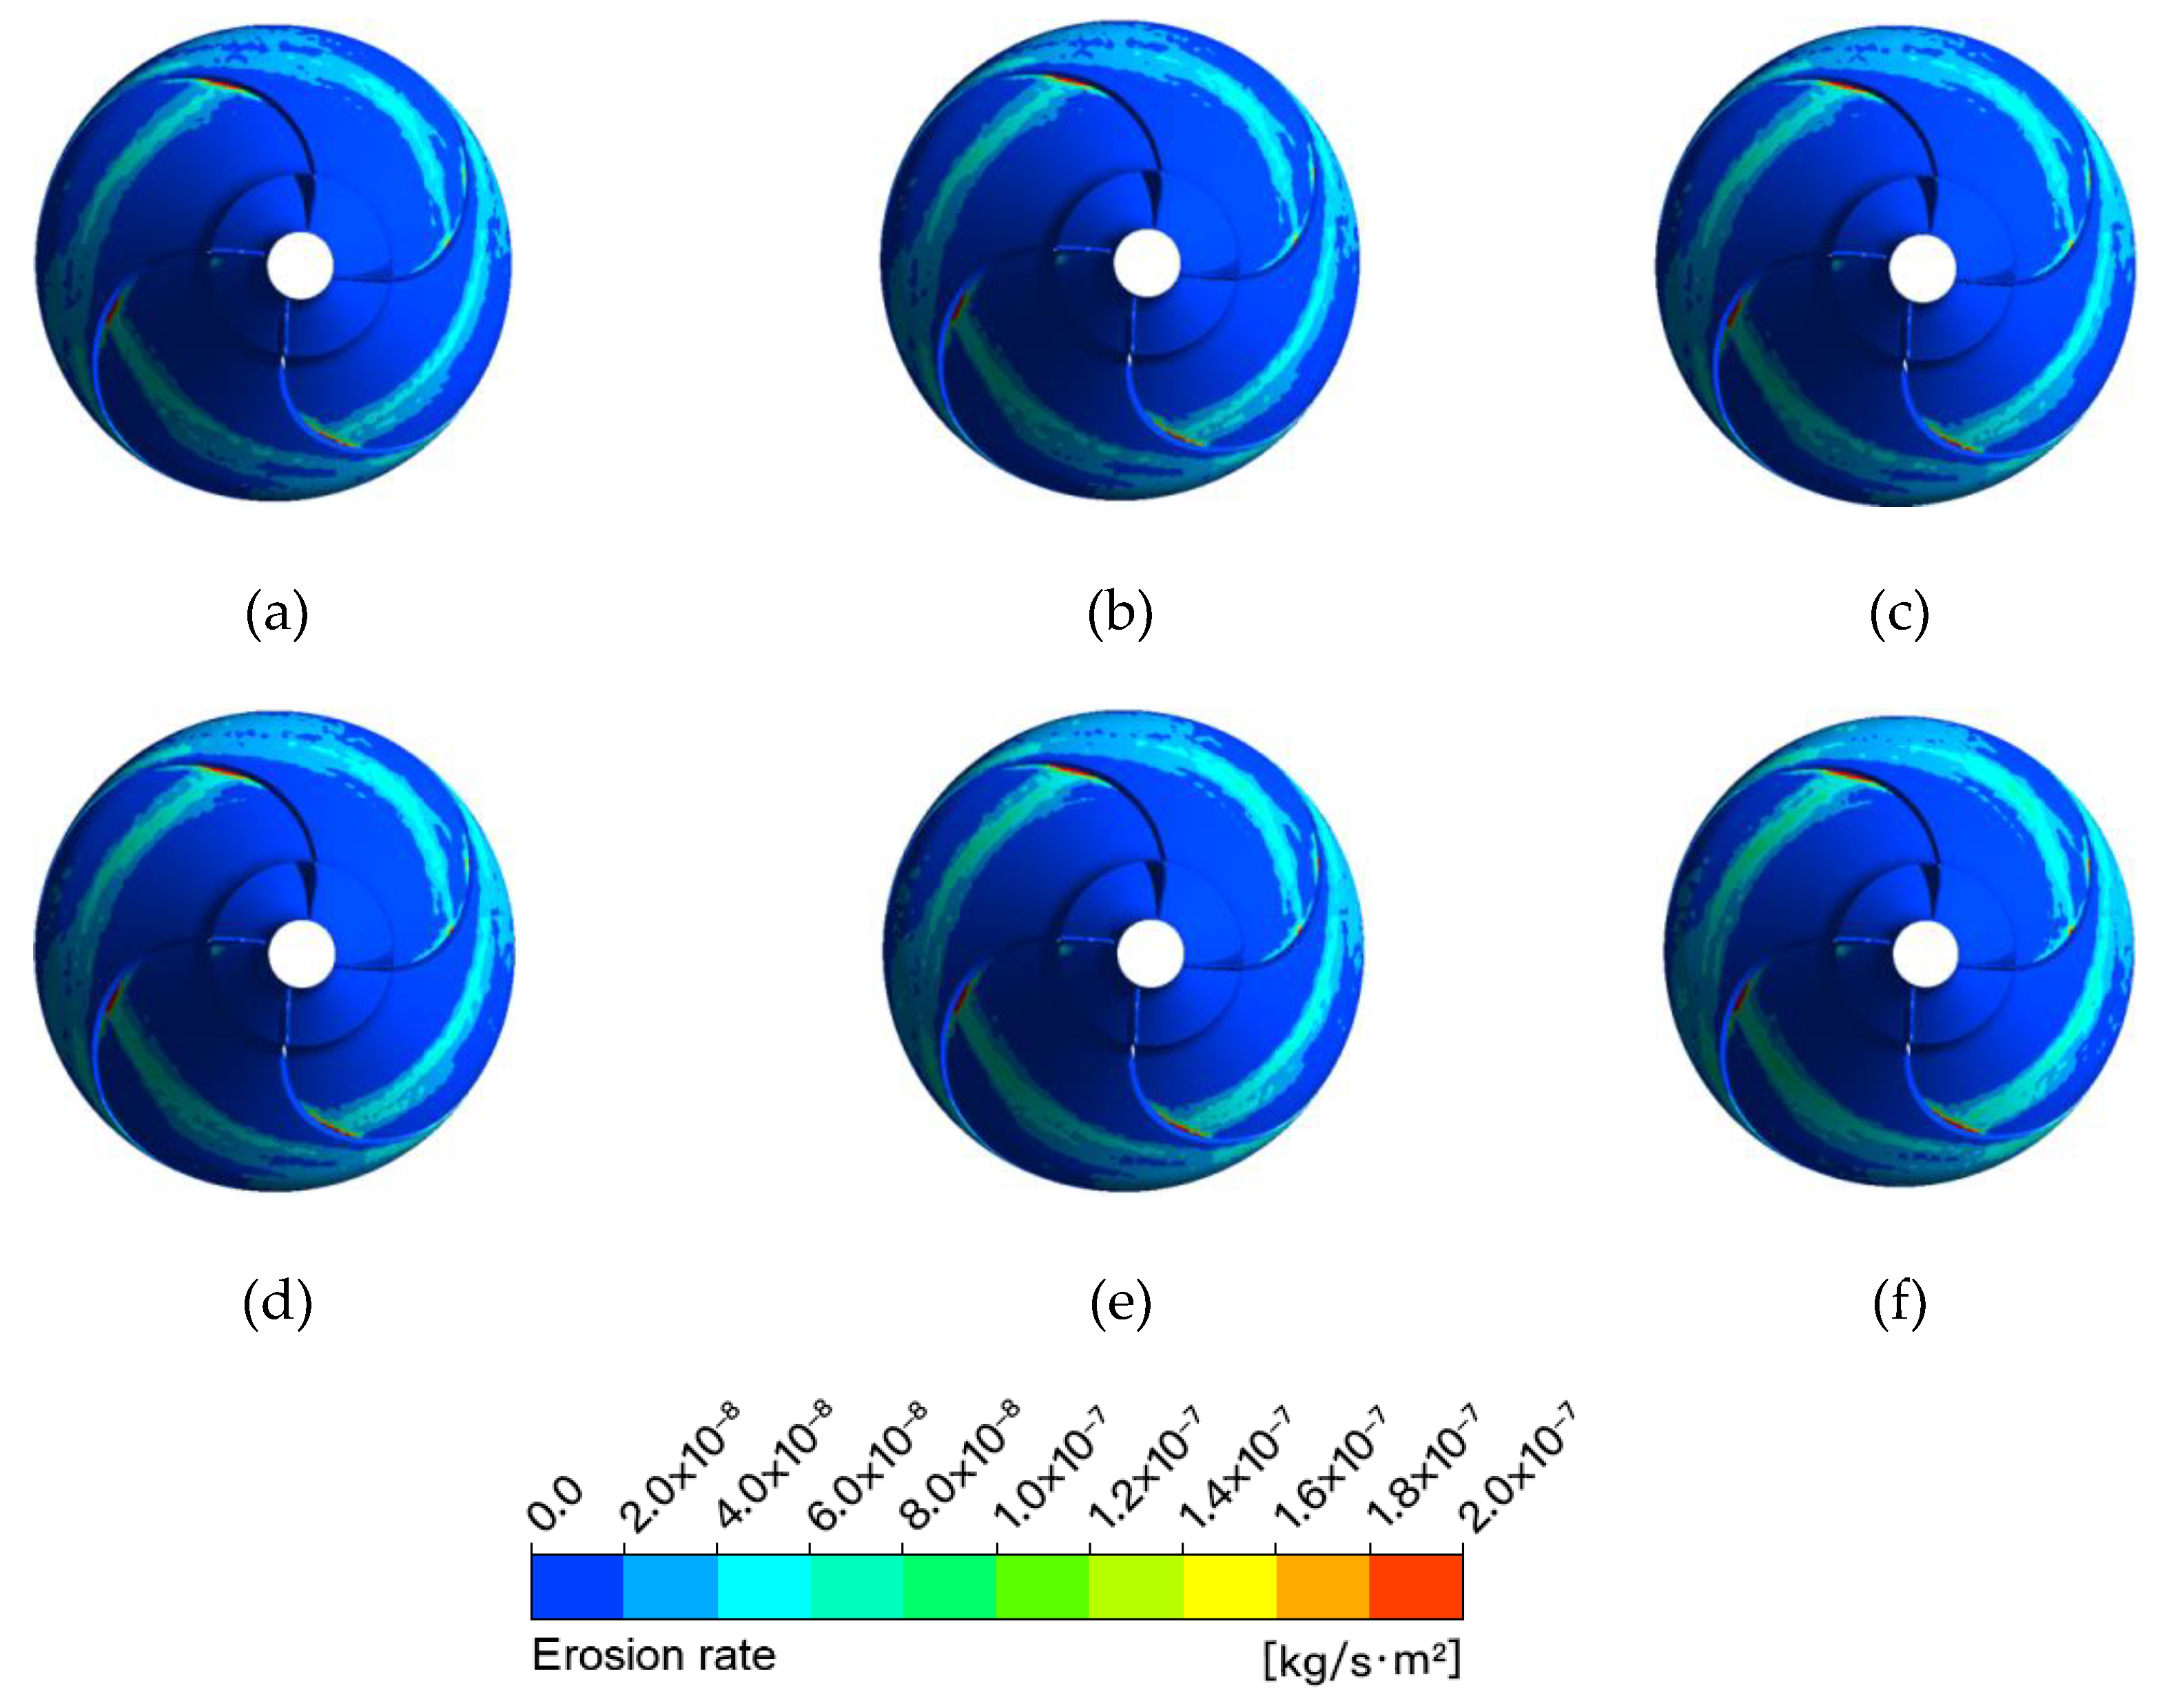
3. Results: Analysis of the Non-Steady-State Wear

A numerical simulation analysis of the non-steady-state wear of solid–liquid two-phase flow was carried out in the calculation domain of a deep-sea mining pump with three different operating conditions with flow rates of 0.68 Qd, 1.0 Qd, and 1.33 Qd, respectively. The impeller had a rotational speed of 1450 rpm, the particles had a diameter of 6 mm, and the volume fraction Cv of the solid phase was 7.5%.

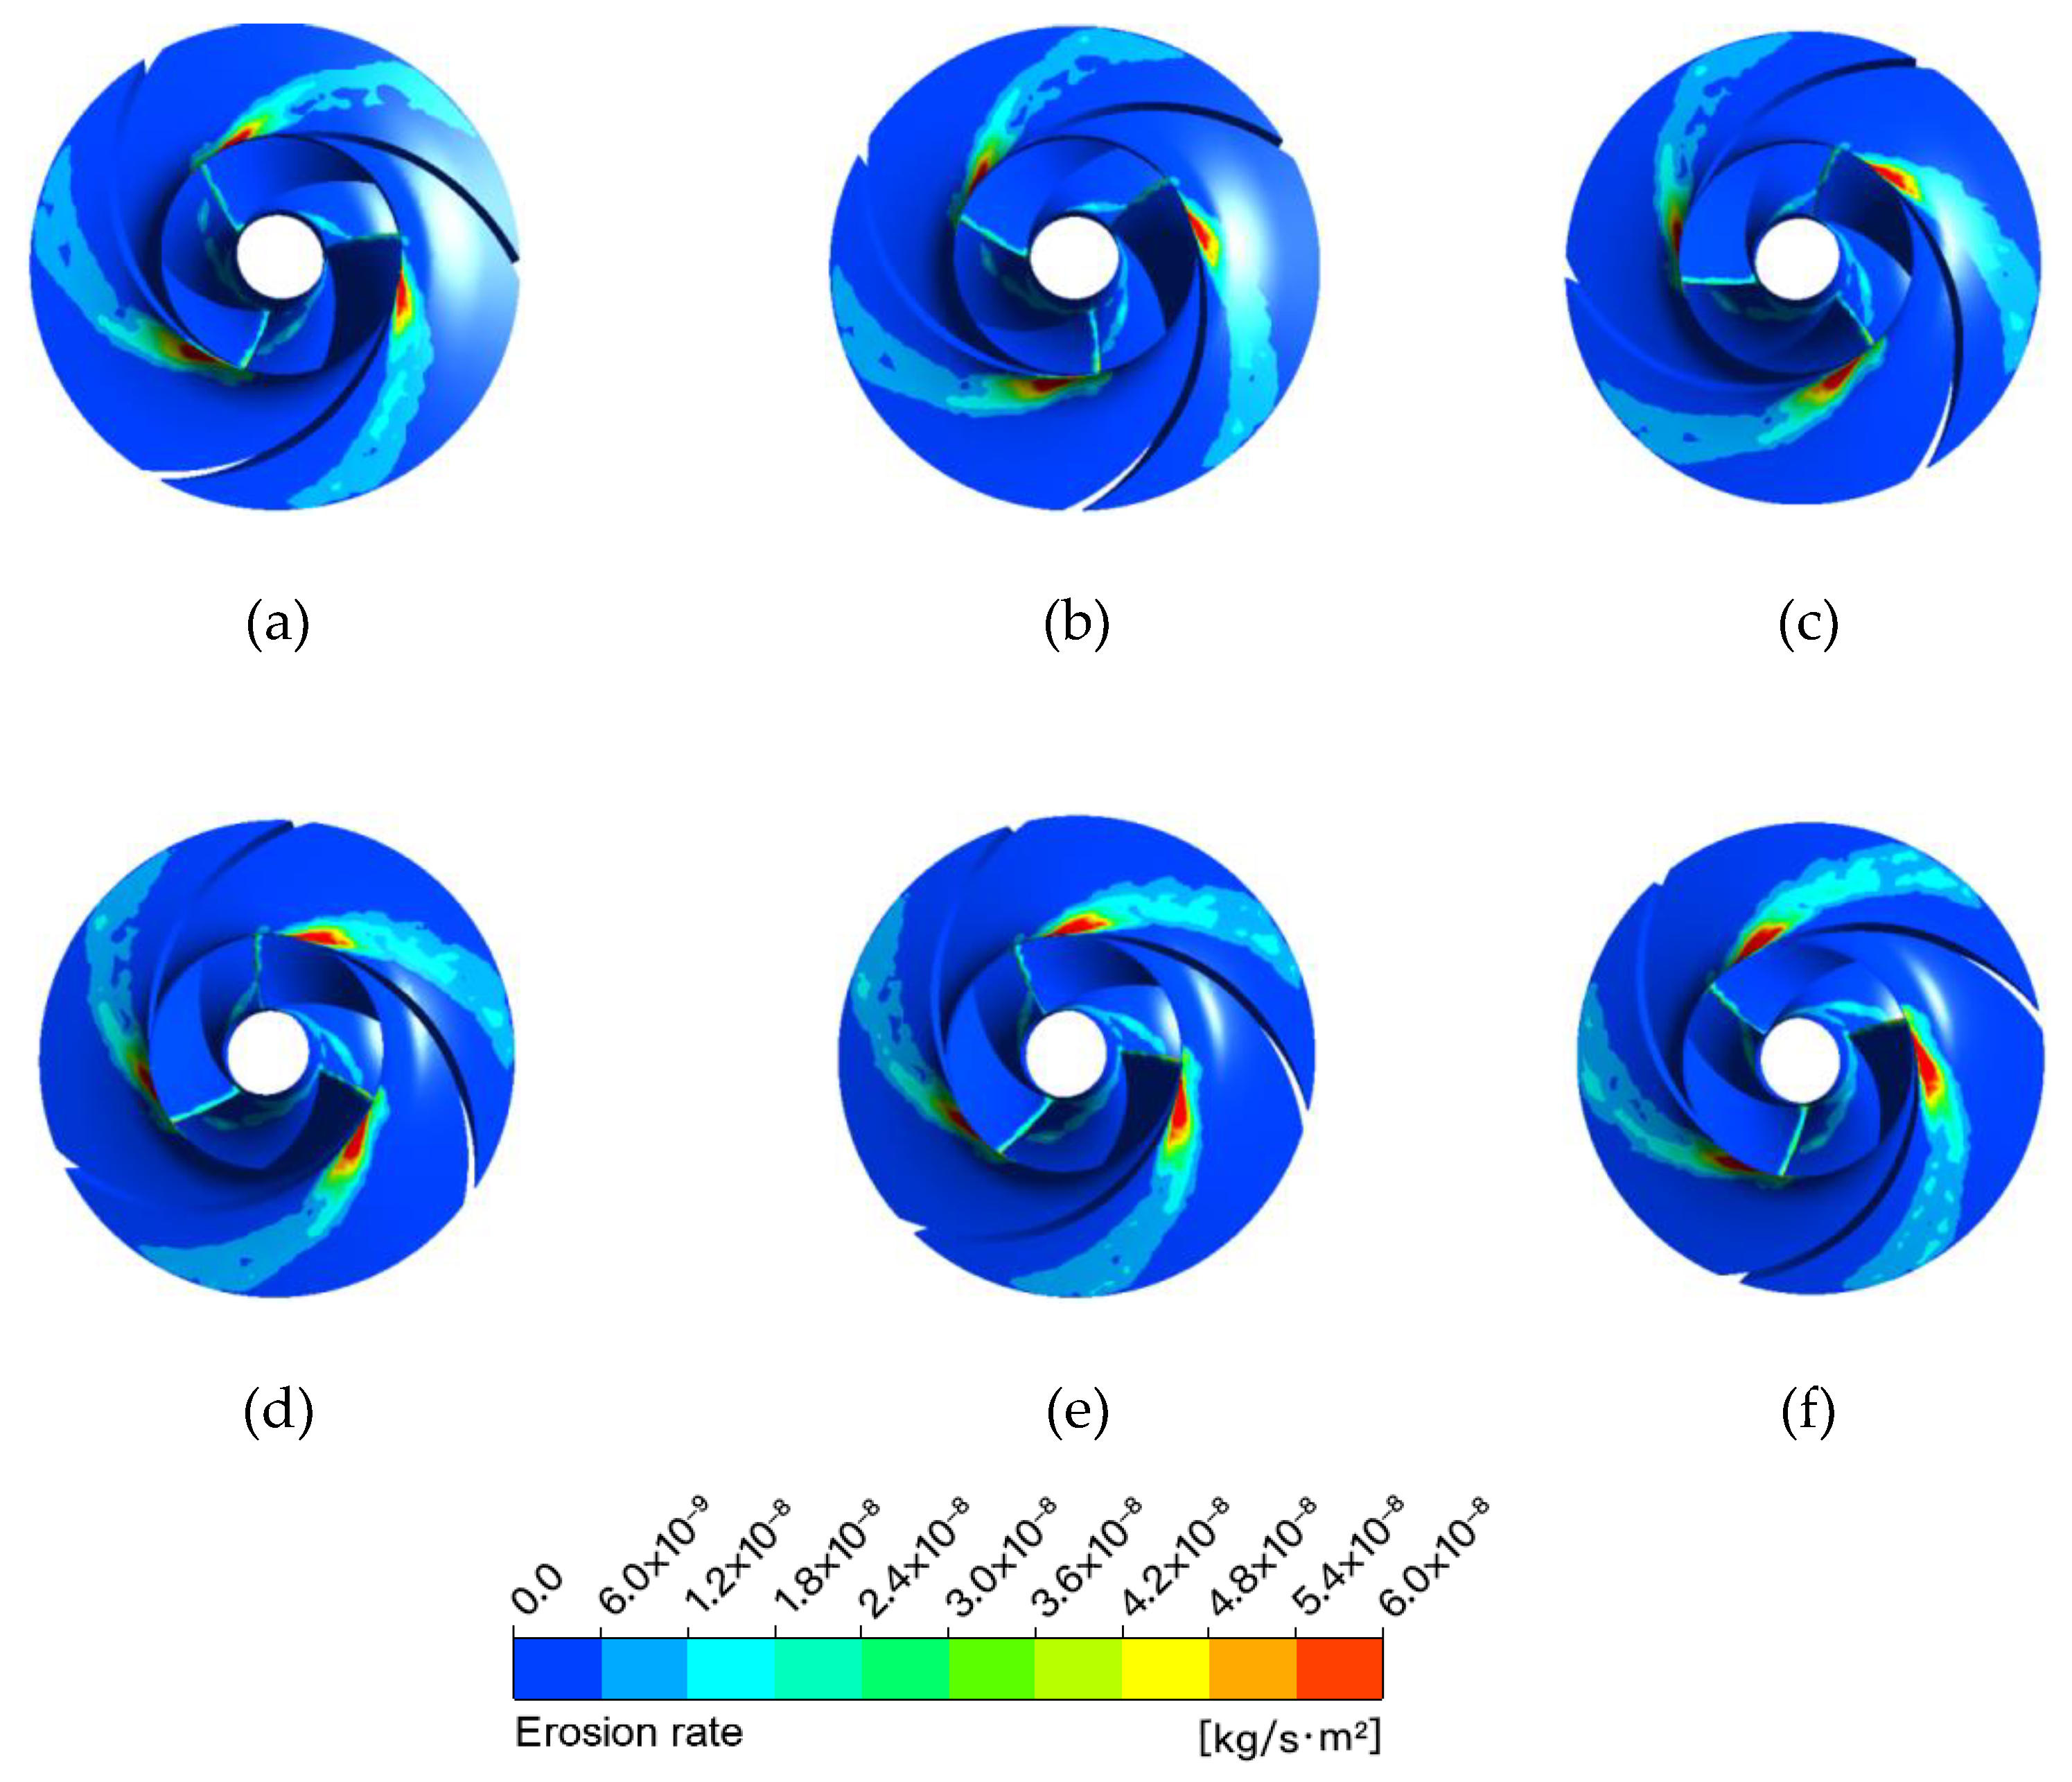
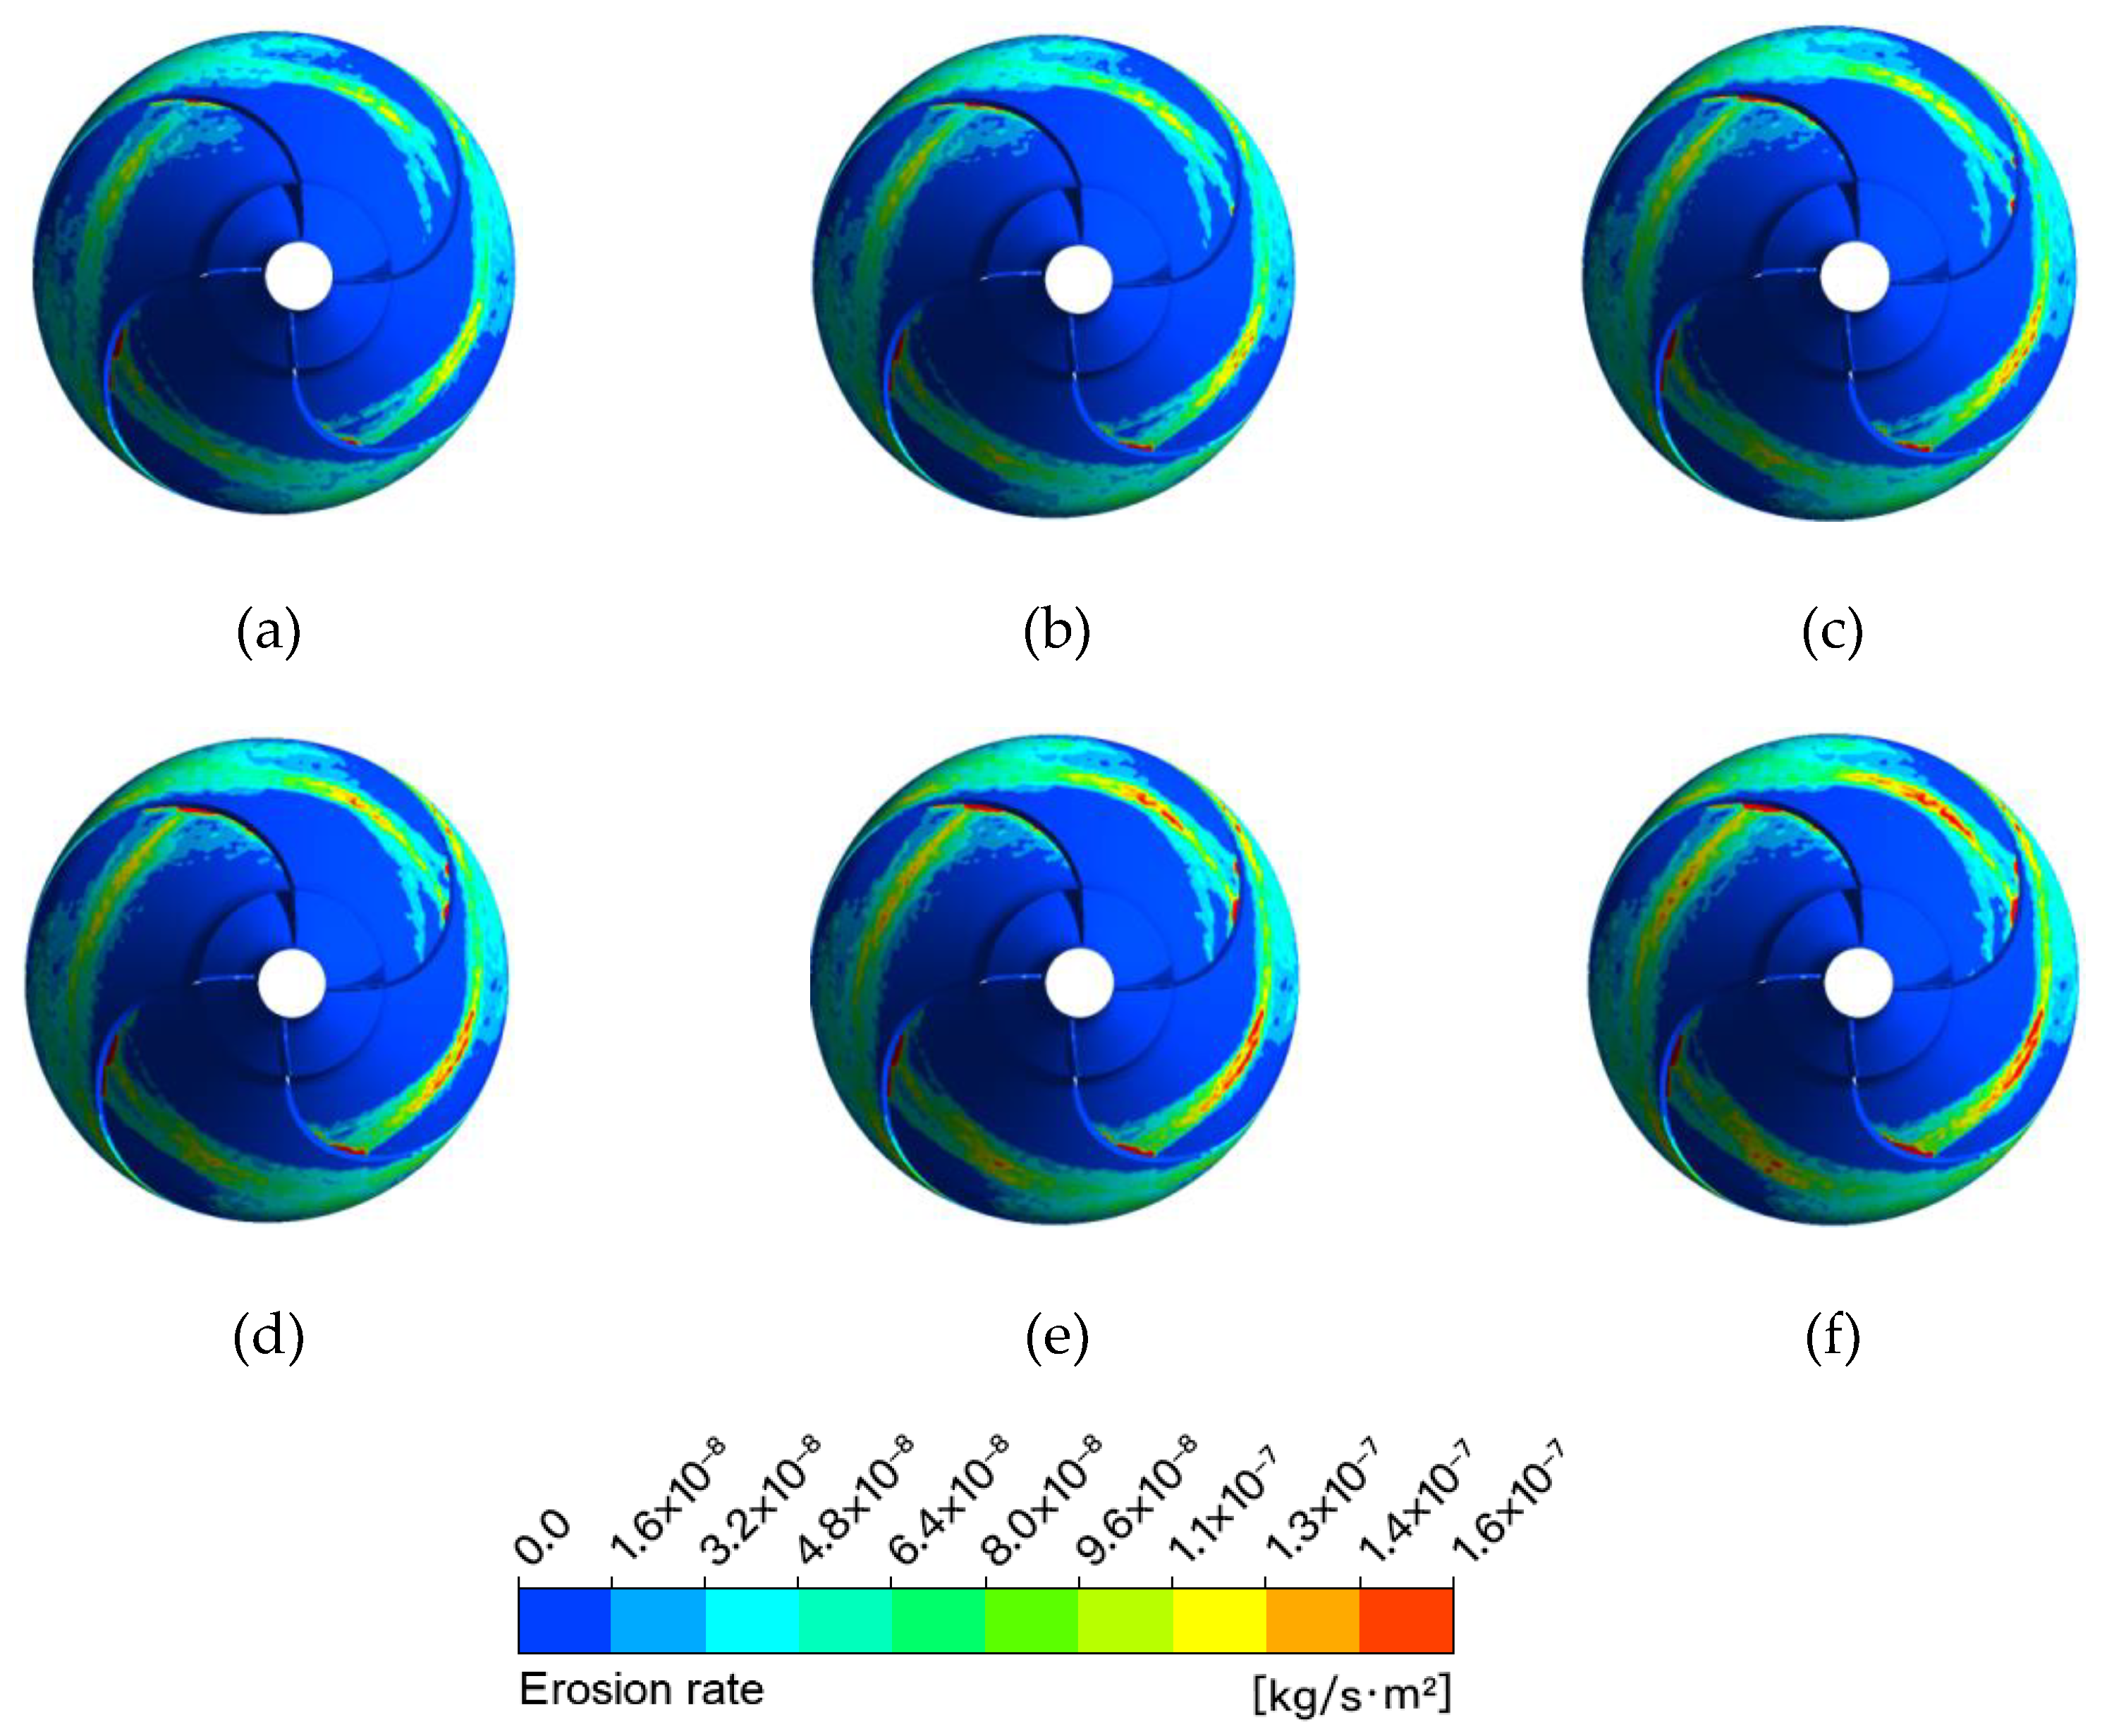
3.1. Low Flow Rate Condition

The model pump impeller has three blades, which are evenly arranged in the circumferential direction. Therefore, the flow process of one third of a cycle correctly reflects the wear characteristics of an entire impeller rotation cycle. Using a low flow rate (0.68 Qd), the evolution process of the surface wear rate of the impellers and guide vanes was analyzed during one third of a rotation cycle (120°) of the impellers.
Figure 4, Figure 5, Figure 6 and Figure 7 show the evolution process of the surface wear rate of the first- and second-stage impellers, as well as that of the first- and second-stage guide vanes during one third of the rotation cycle (120°) of the impeller with a low flow rate (0.68 Qd).
The surface wear of the impellers in Figure 4 and Figure 5 reveals that during the rotation of the impeller, the relative position of the surface damage due to the wear of the solid particles on the impeller does not change, and the wear rate also remains stable. The wear damage is concentrated in the middle of each flow channel on the front shroud of the impeller, the blade inlet, and the hub near the blade inlet. Moreover, the area of the wear damage on the front shroud increases as the area of the front shroud for each flow channel increases. Unlike for the second-stage impeller, the wear damage on the surface of the first-stage impeller is more dispersed as the turbulent flow in the first-stage impeller with a low flow rate caused multiple collisions between particles and the surface of the impeller.
The surface wear of the guide vanes shown in Figure 6 and Figure 7 reveals that the wear due to particles on the surface of the guide vane flanges exhibits a pattern resembling bands, similar to that observed on the second-stage impeller, but the wear damage is more serious overall. After the particles are thrown out of the impeller outlet, their circular motion will continue over a certain distance until the particles finally collide with the surface of the blade in the middle of the guide vane. At this point, the wear rate reaches its maximum, and wear damage is relatively more concentrated in this area. In addition, these figures indicate that although the relative position between the impeller and guide vane changes over time, this change is periodical, resulting in interference between the dynamic impeller and static guide vane. Nevertheless, the wear on the surface of the guide vanes does not change significantly during this process.

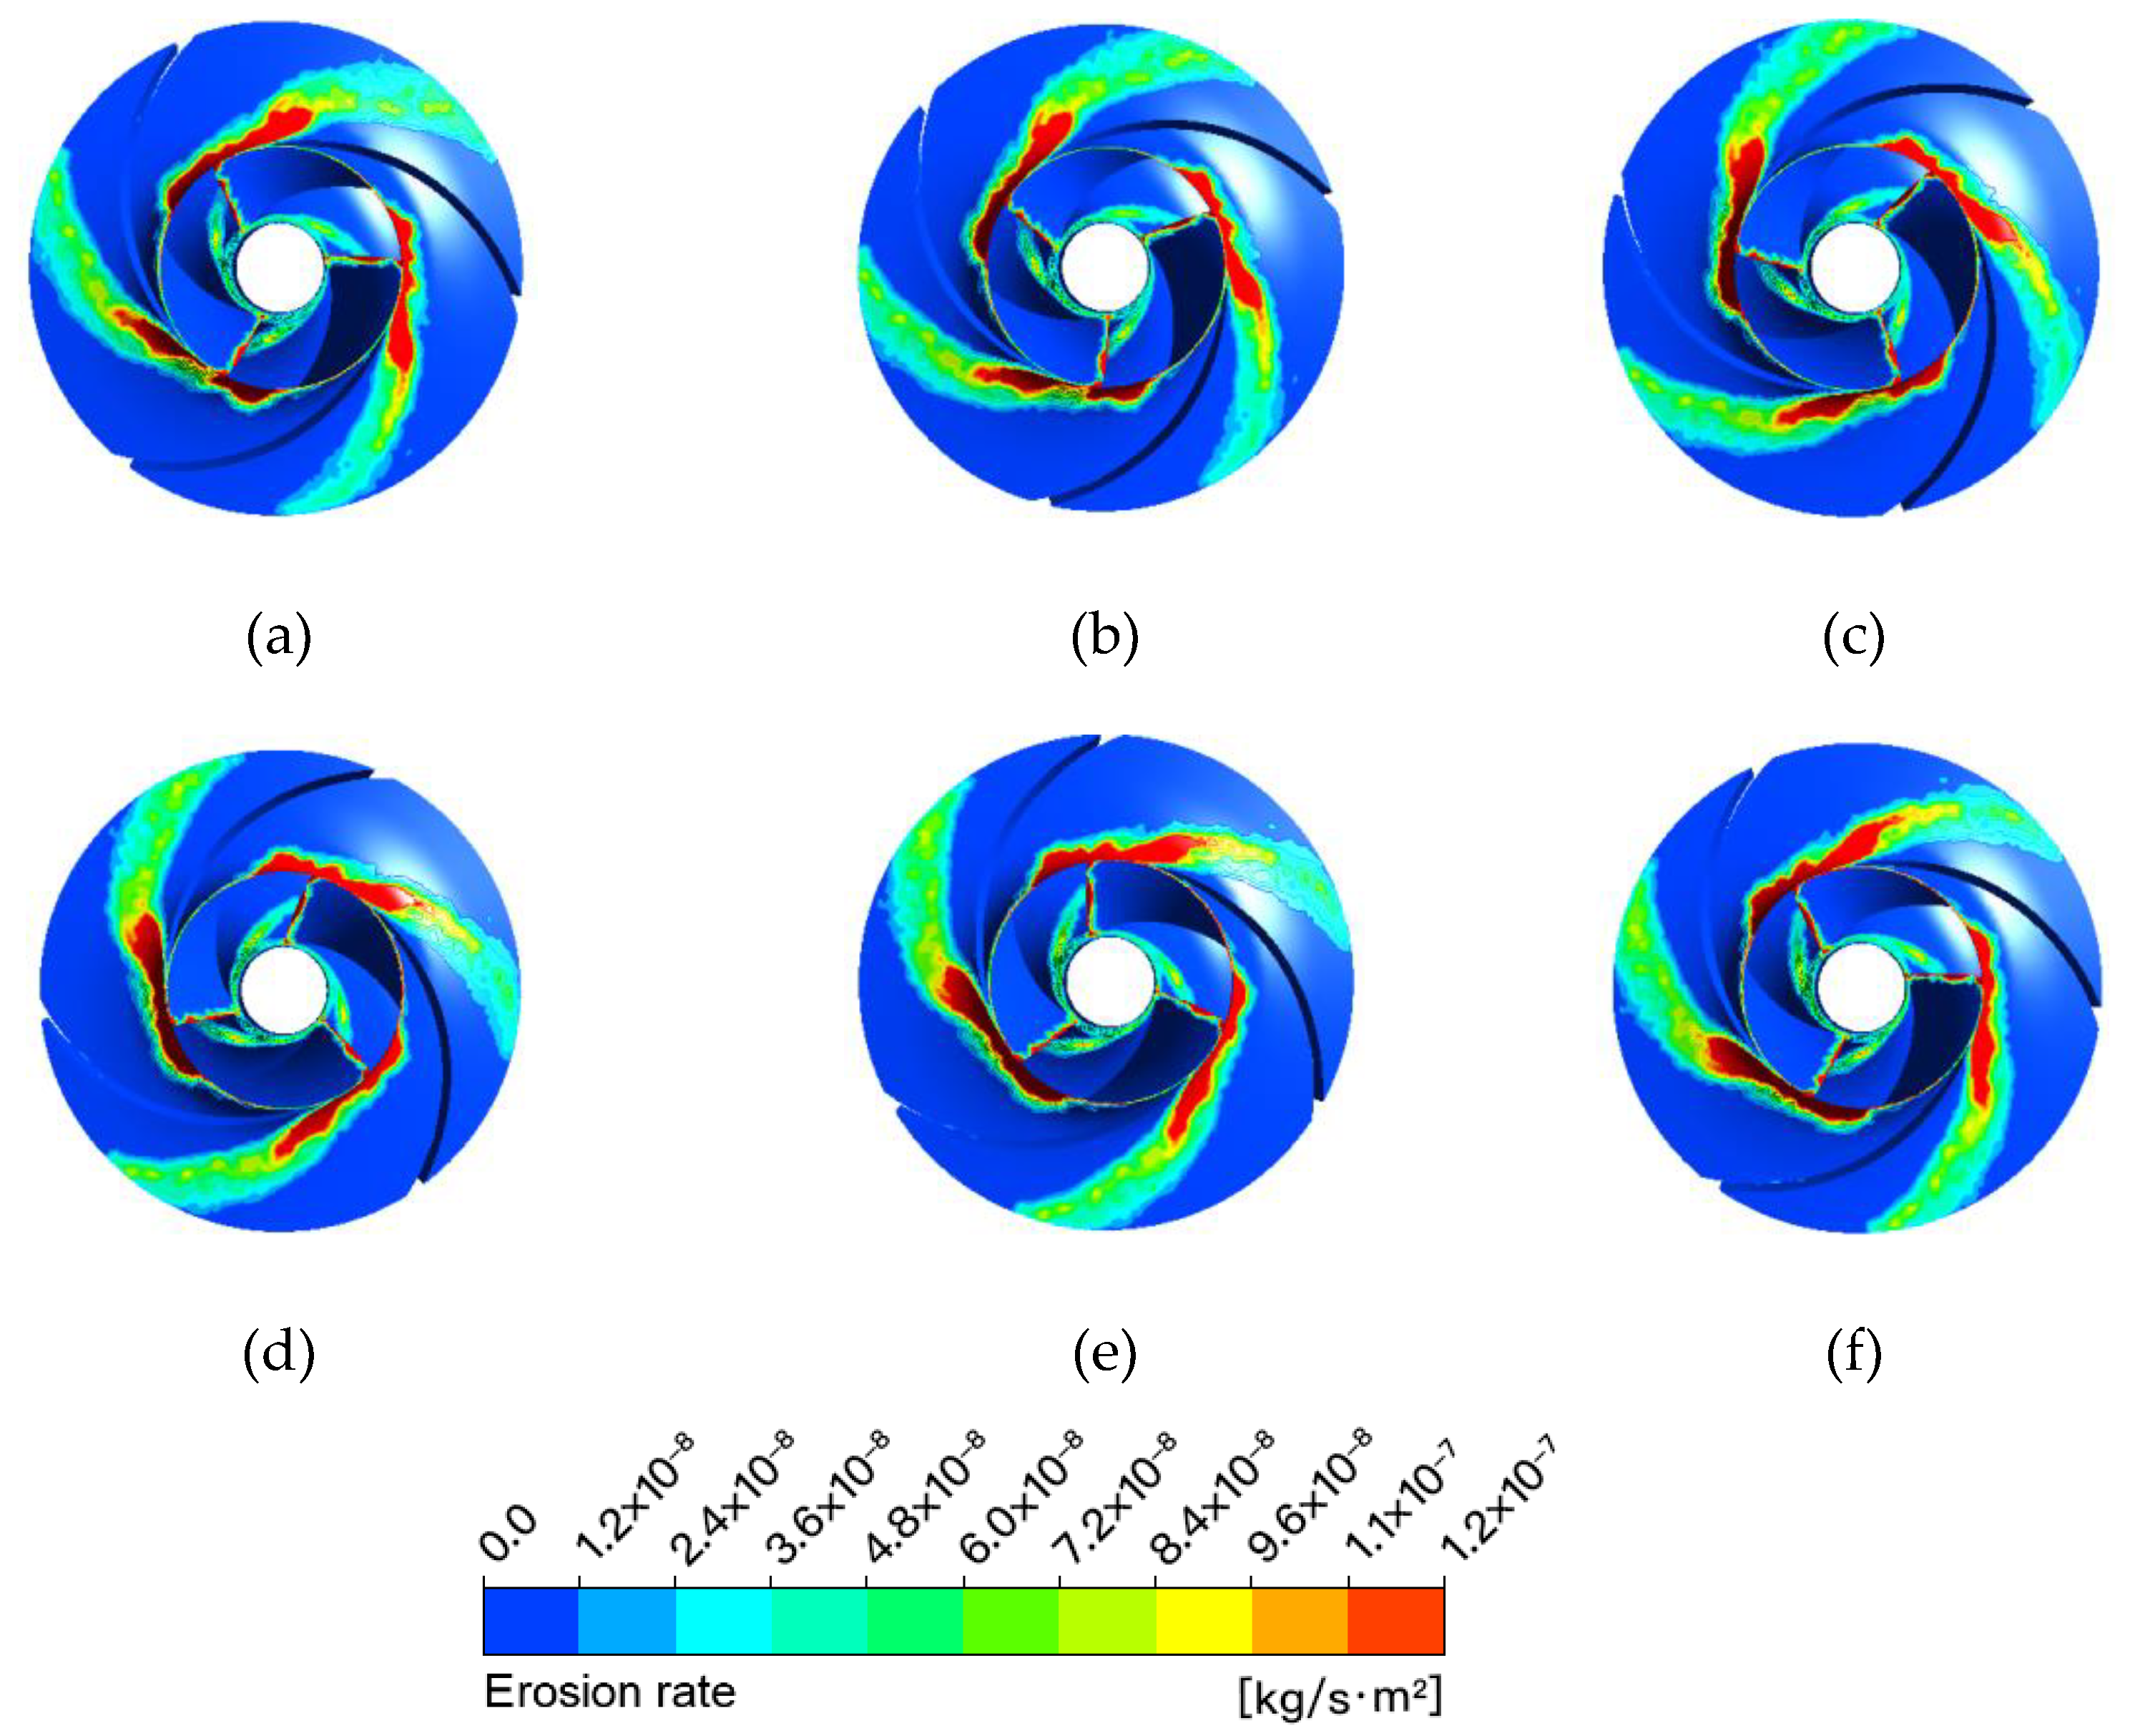
3.2. Design Flow Rate Conditions

Using the design flow rate (1.0 Qd), the evolution process of the surface wear rate of the impellers and guide vanes was analyzed during one third of a rotation cycle (120°) of the impellers. Figure 8, Figure 9, Figure 10 and Figure 11 show the evolution process of the surface wear rate of the first- and second-stage impellers, as well as that of the first- and second-stage guide vanes during one third of the rotation cycle (120°) of the impeller with the design flow rate (1.0 Qd).
It can be seen from Figure 8, Figure 9, Figure 10 and Figure 11 that the wear on the surface of the flow passage components is distributed in a more regular manner compared with that observed under a low flow rate due to the greatly improved flow in the calculation domain with the design flow rate. The surface wear for both the impellers and guide vanes are distributed in bands, and the relative position of the wear does not change due to the impeller rotation.

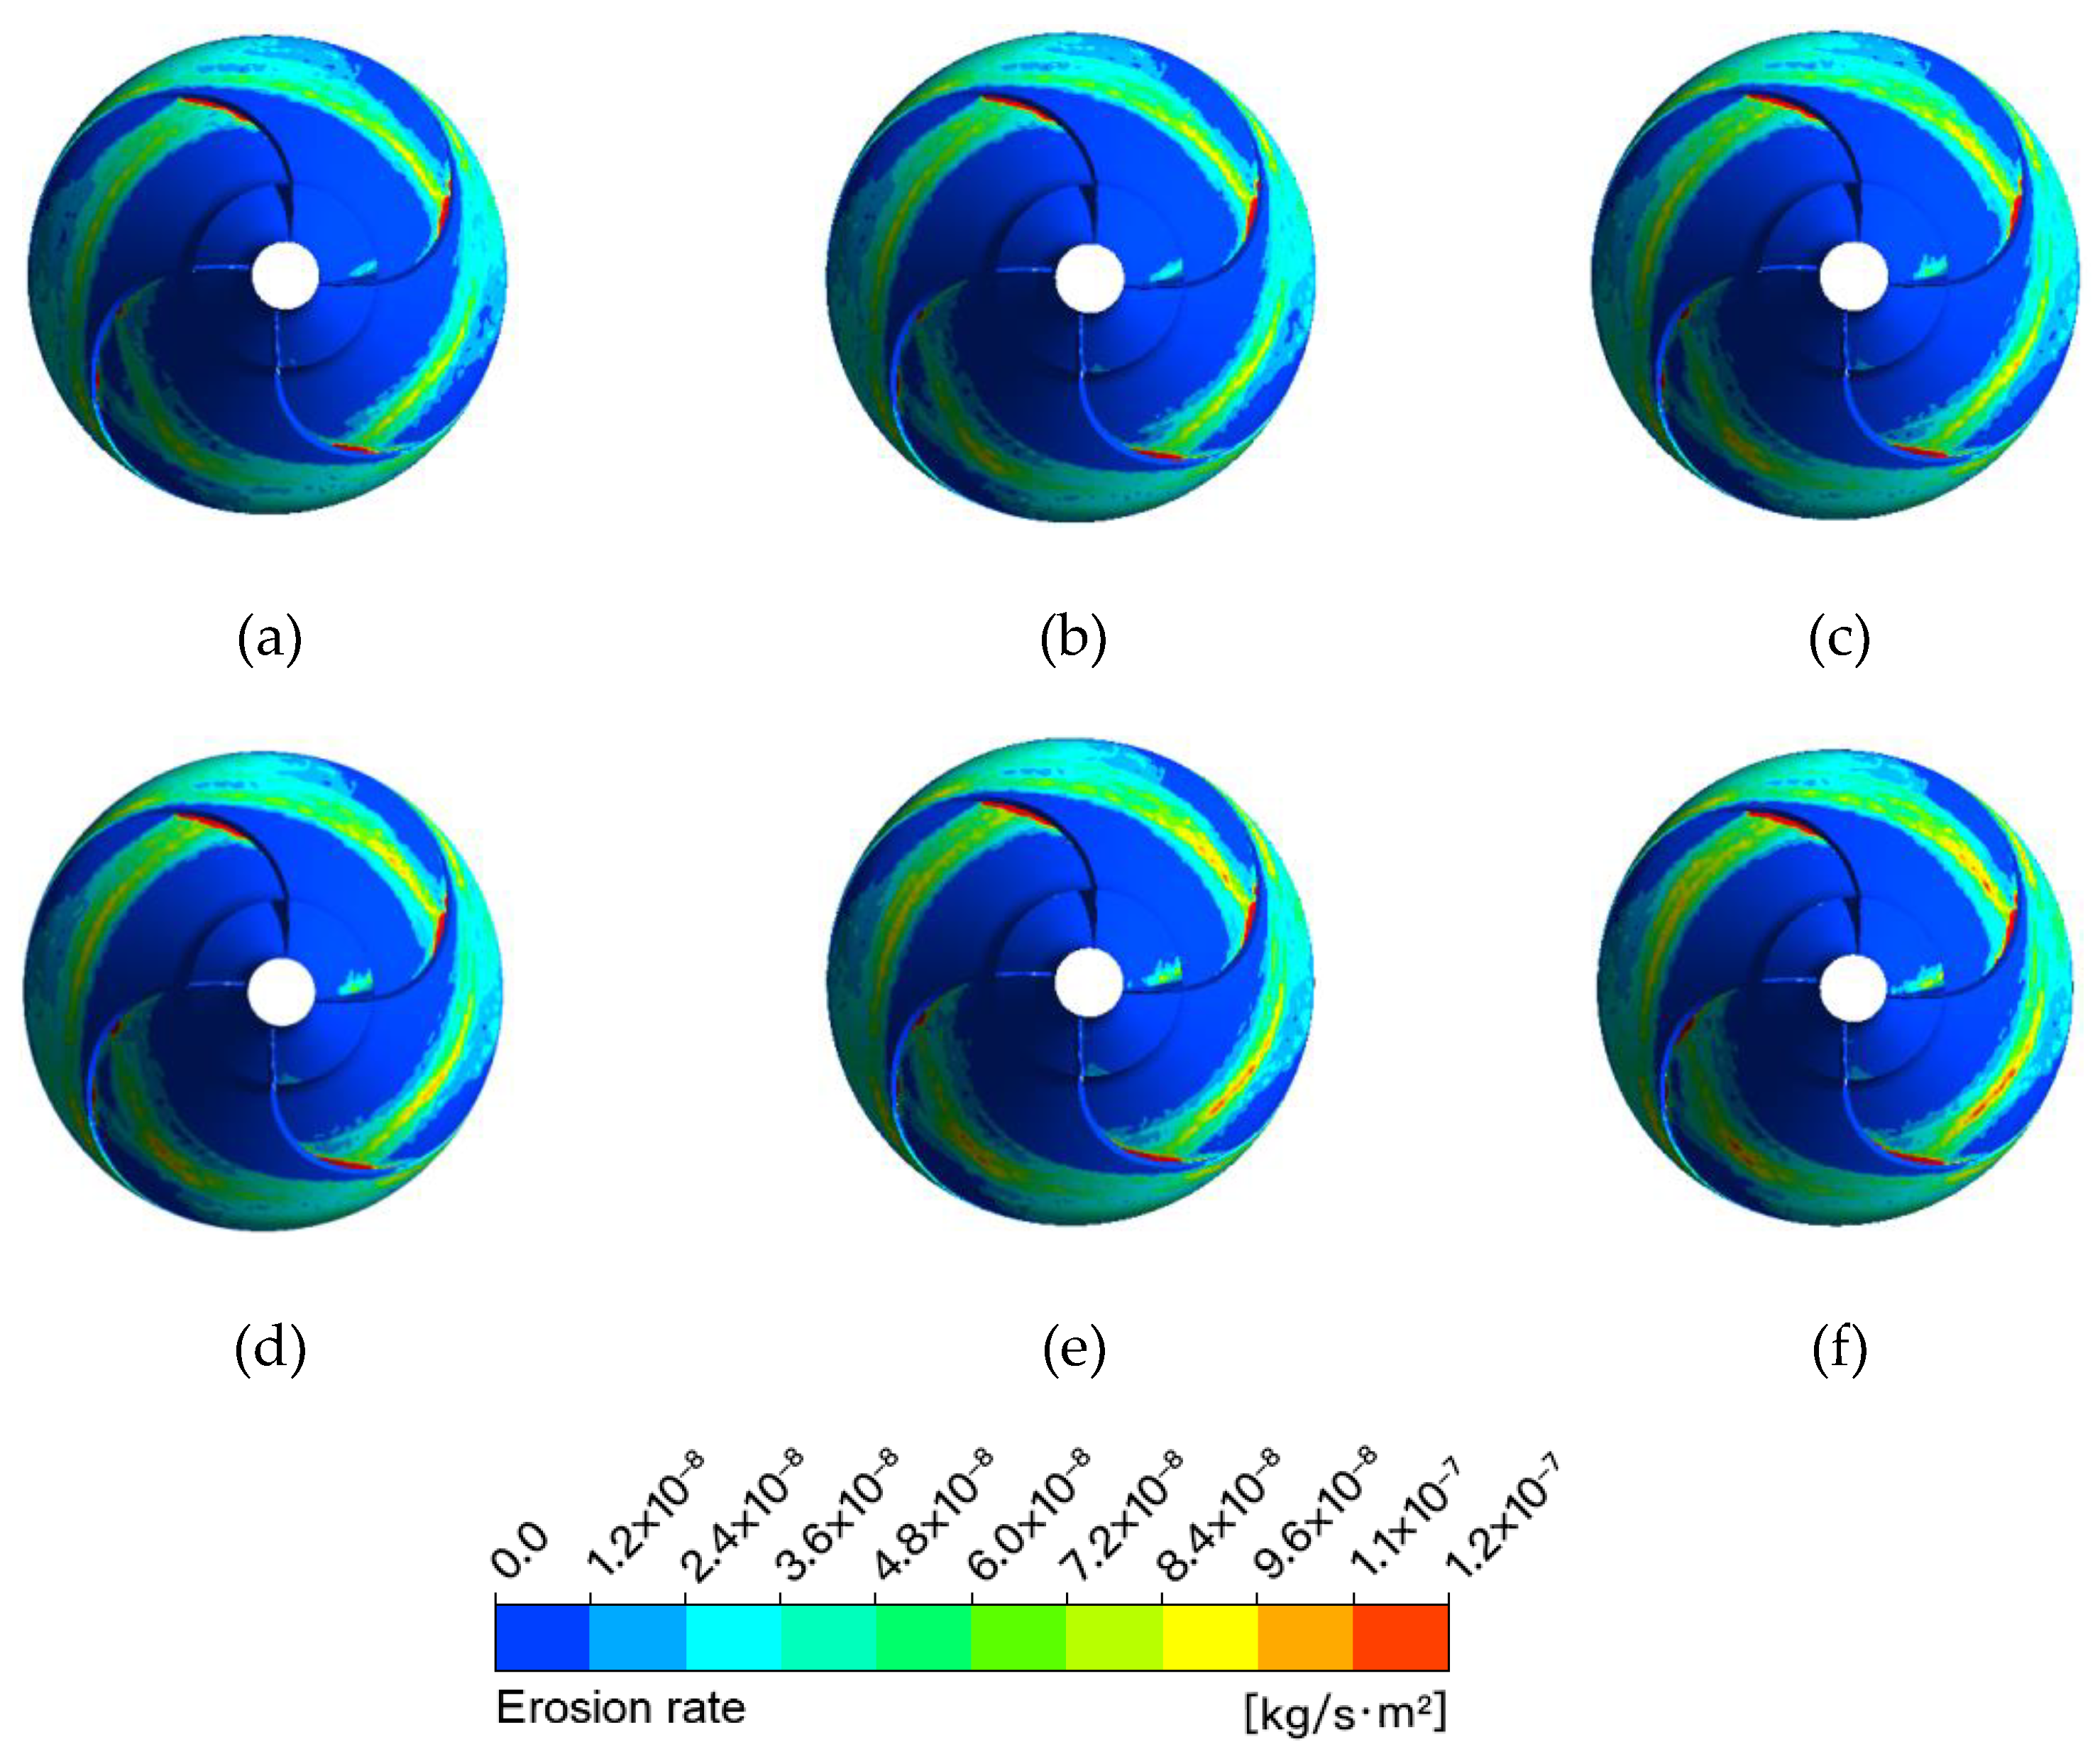
3.3. High Flow Rate Condition

With a high flow rate (1.33 Qd), the evolution process of the surface wear rate of the impellers and guide vanes was analyzed during one third of a rotation cycle (120°) of the impellers. Figure 12, Figure 13, Figure 14 and Figure 15 show the evolution process of the surface wear rate of the first- and second-stage impellers, as well as that of the first- and second-stage guide vanes during one third of a rotation cycle (120°) of the impeller with a high flow rate (1.33 Qd).
It can be seen from Figure 12, Figure 13, Figure 14 and Figure 15 that the increase in the flow rate aggravates the degree of surface wear of the flow passage components. At a high flow rate, the same distribution of surface wear is observed on the impellers and space guide vanes as was observed using the design flow rate. There are no significant changes in the wear distribution during the one-third rotation cycle of the impellers.

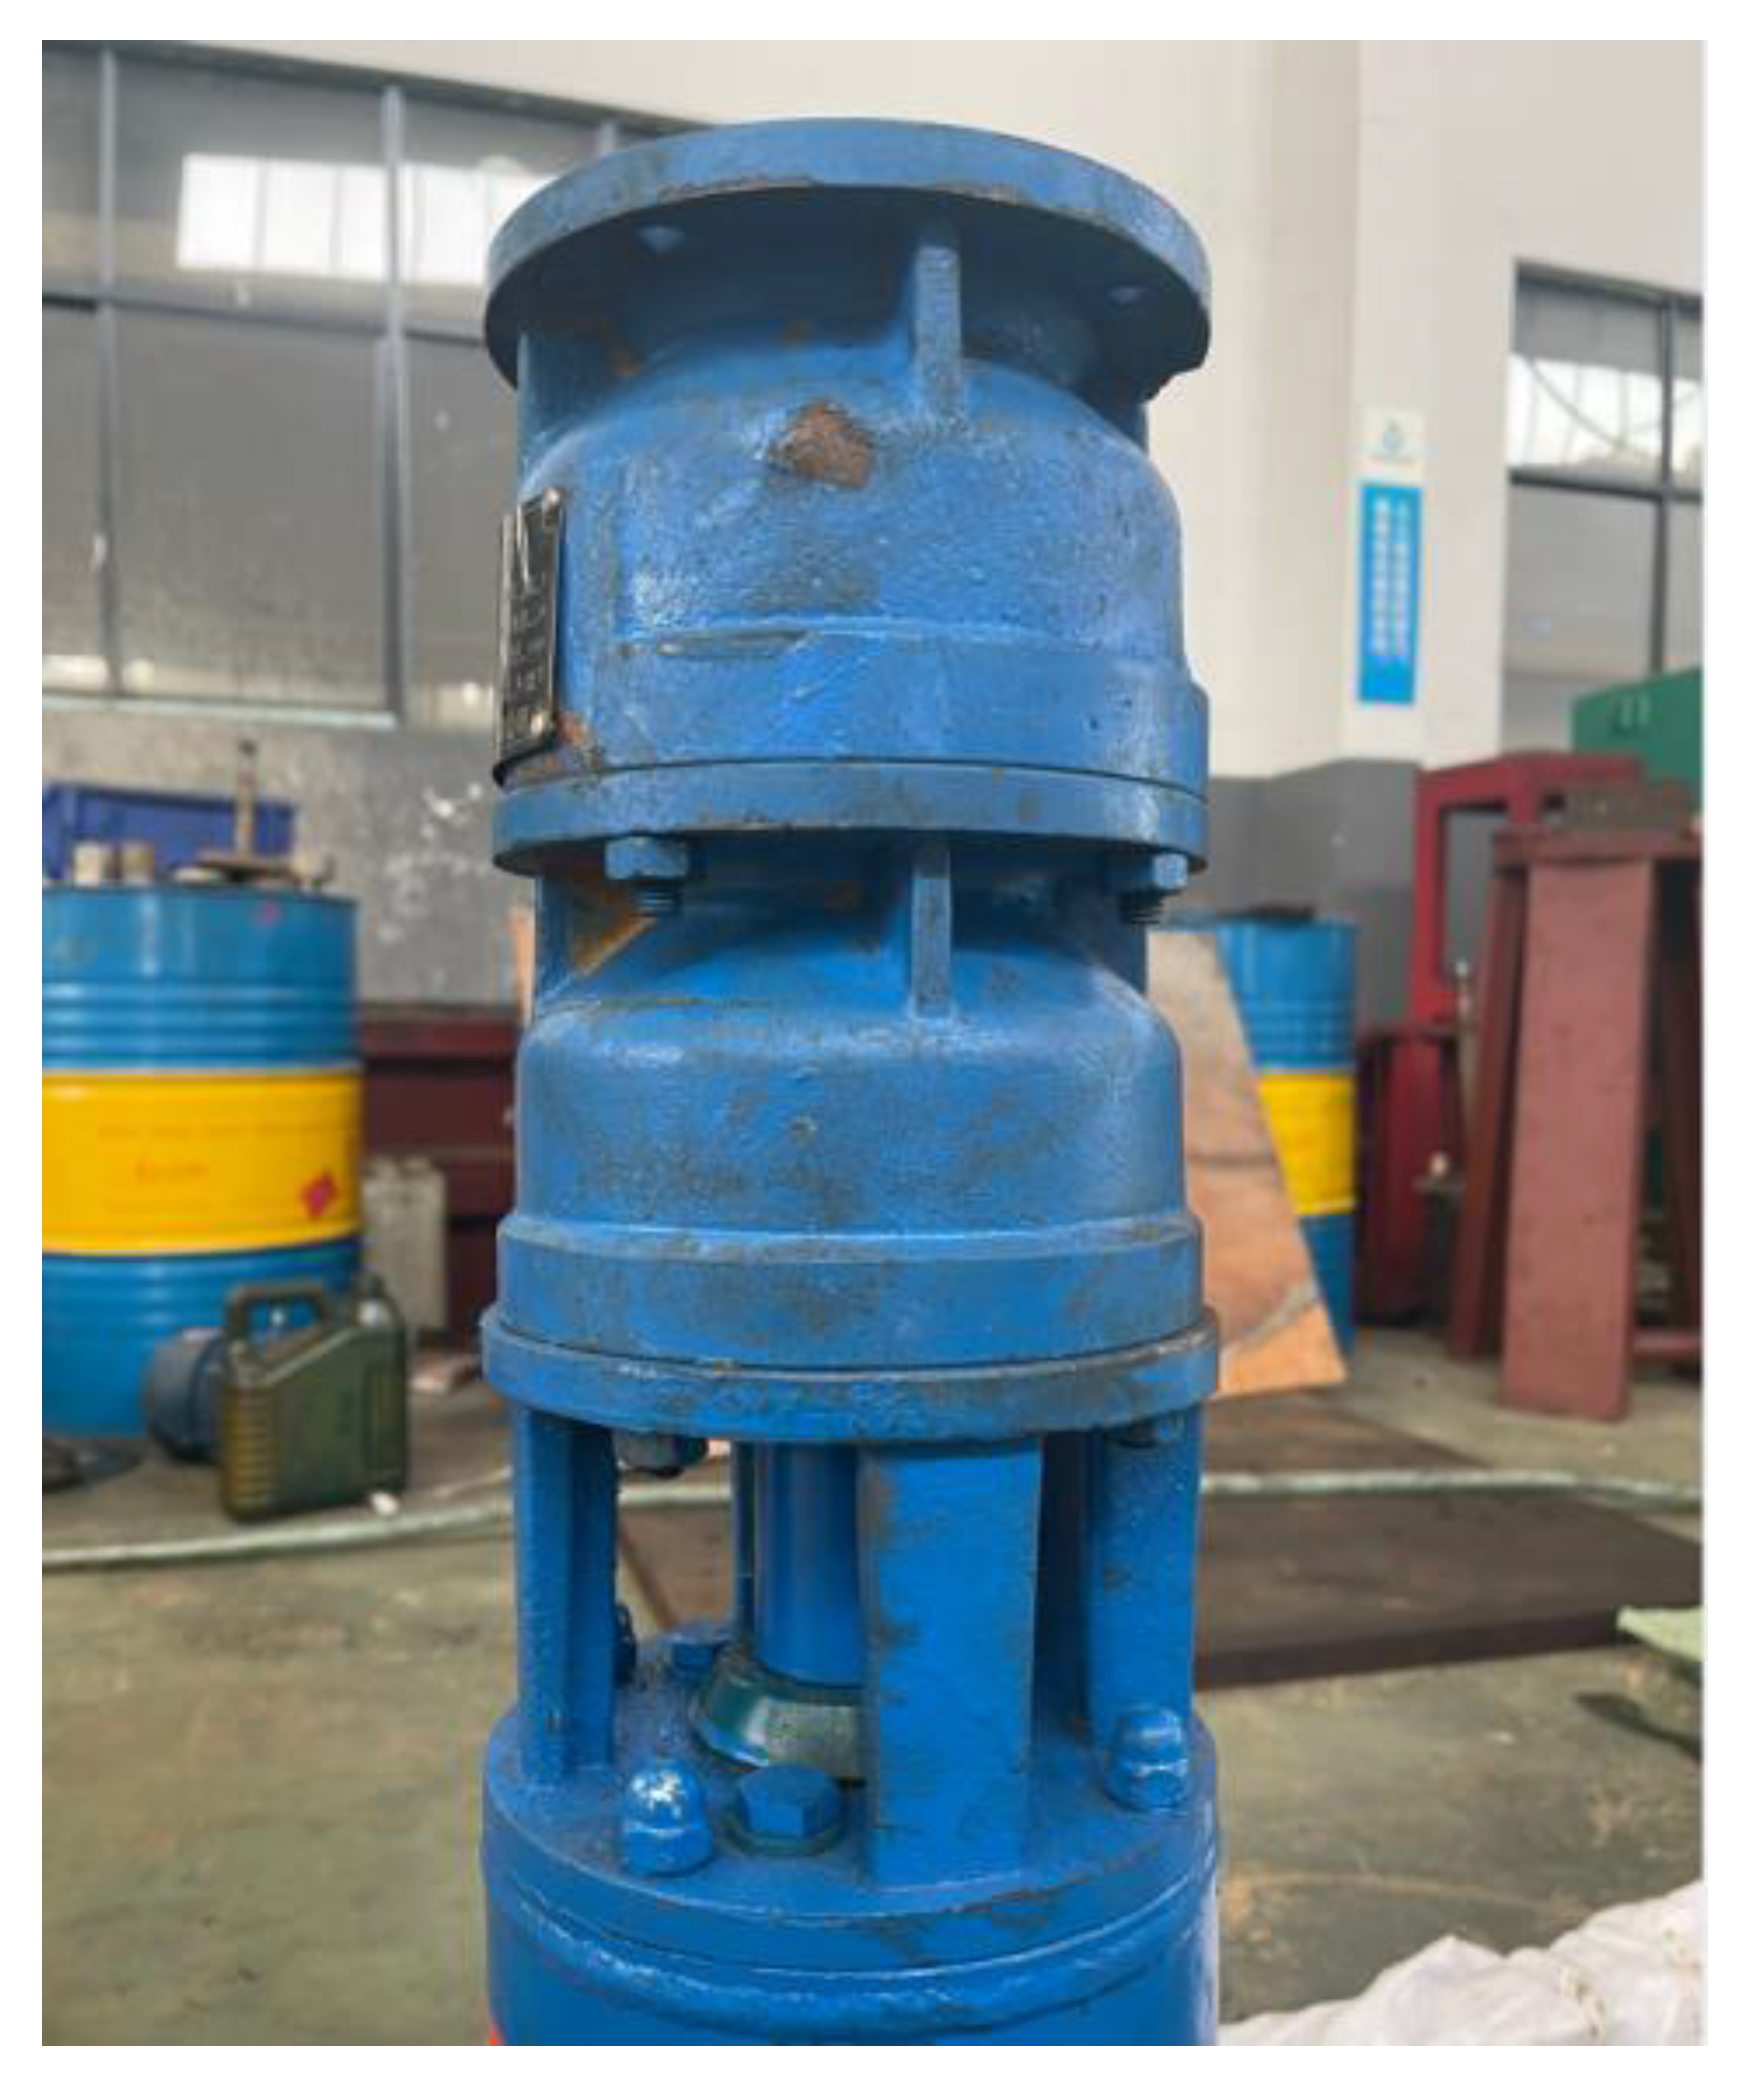
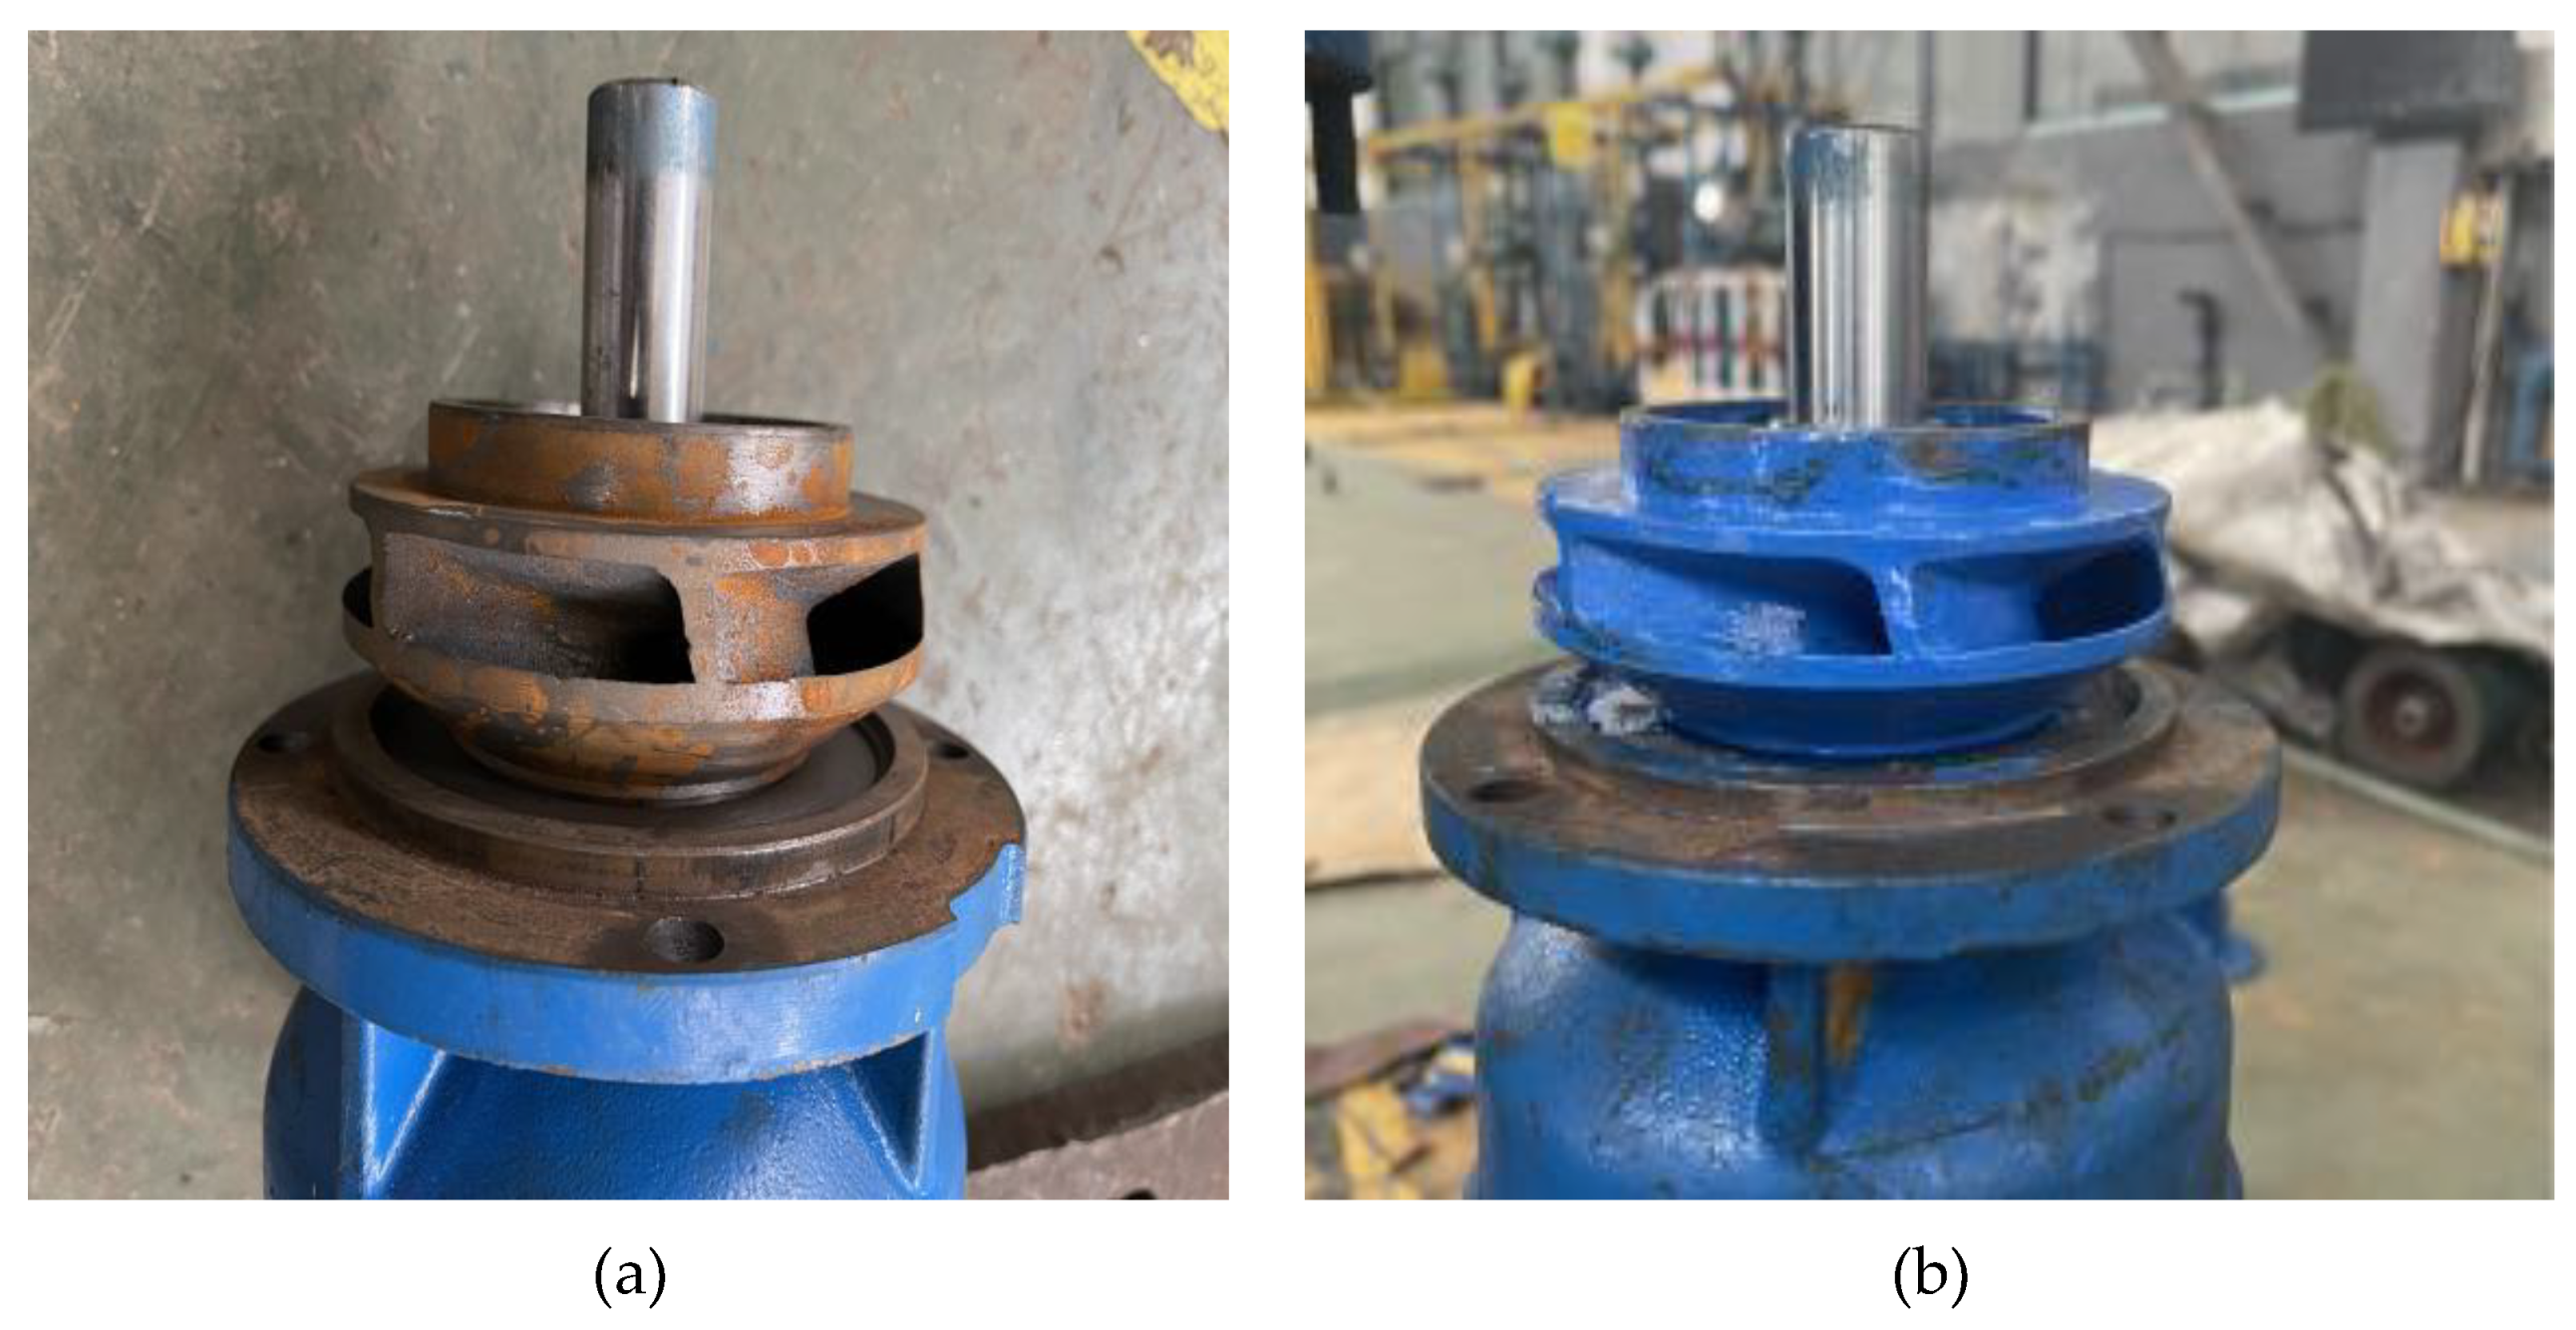
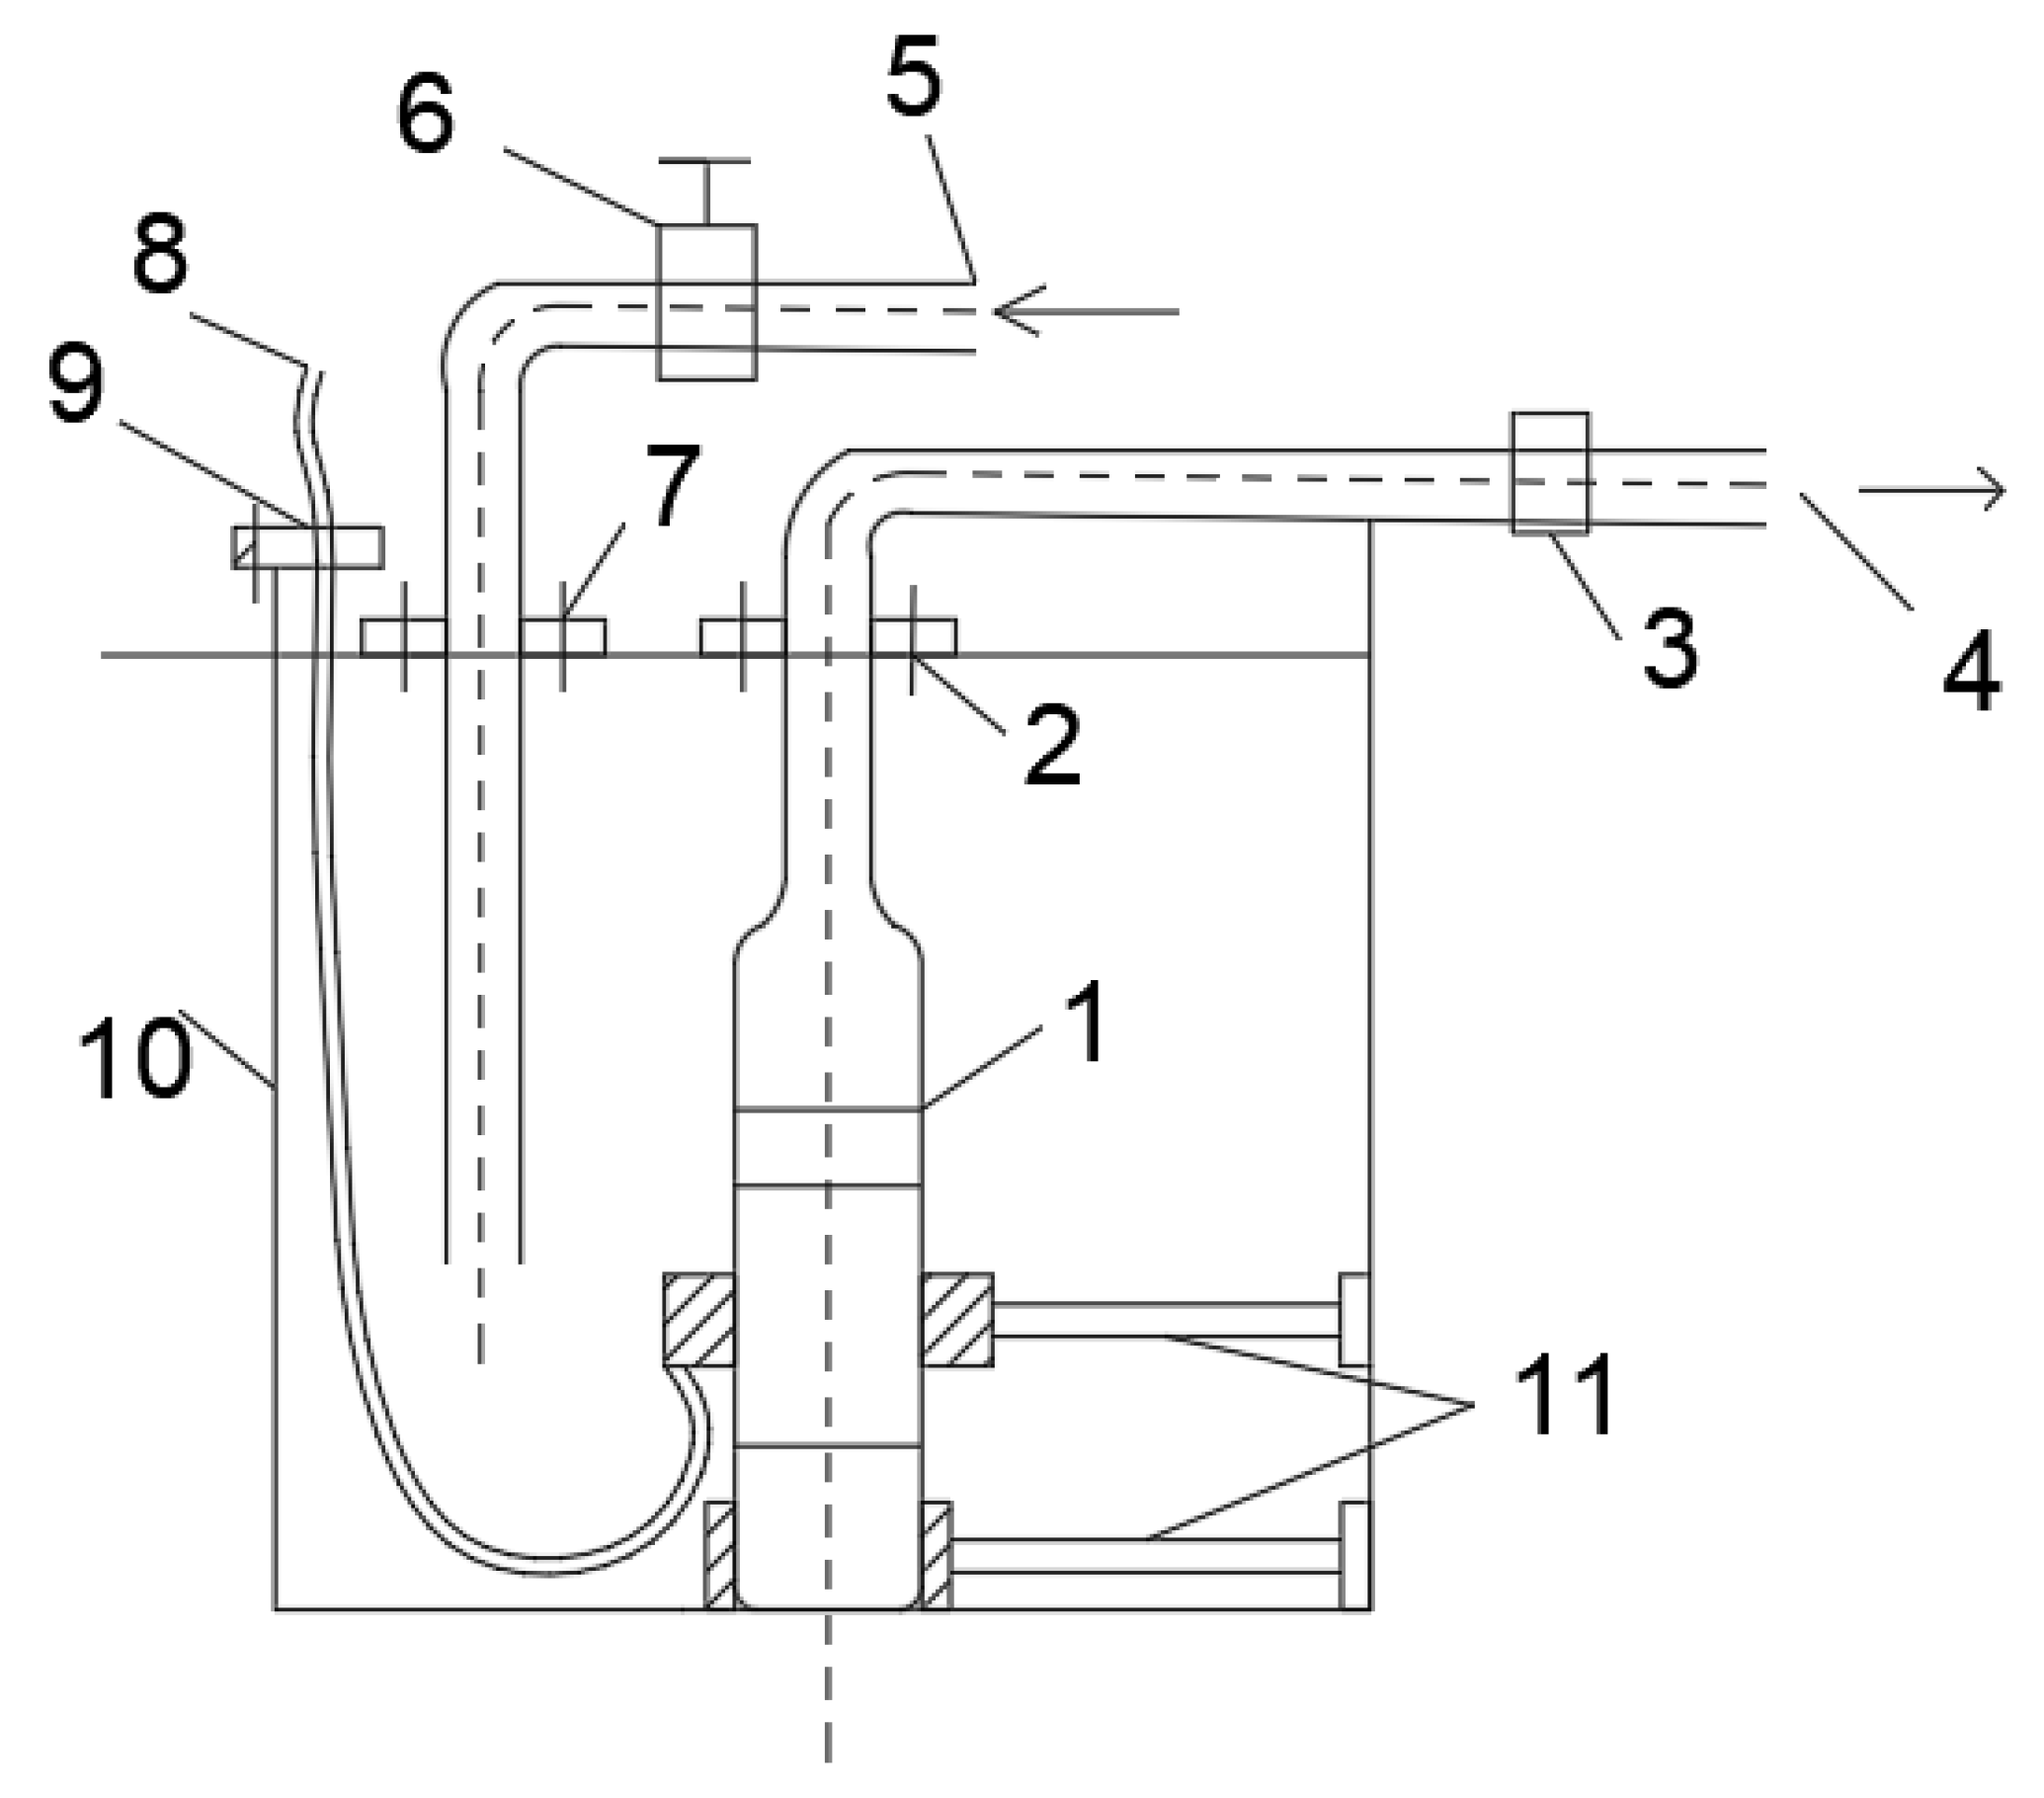
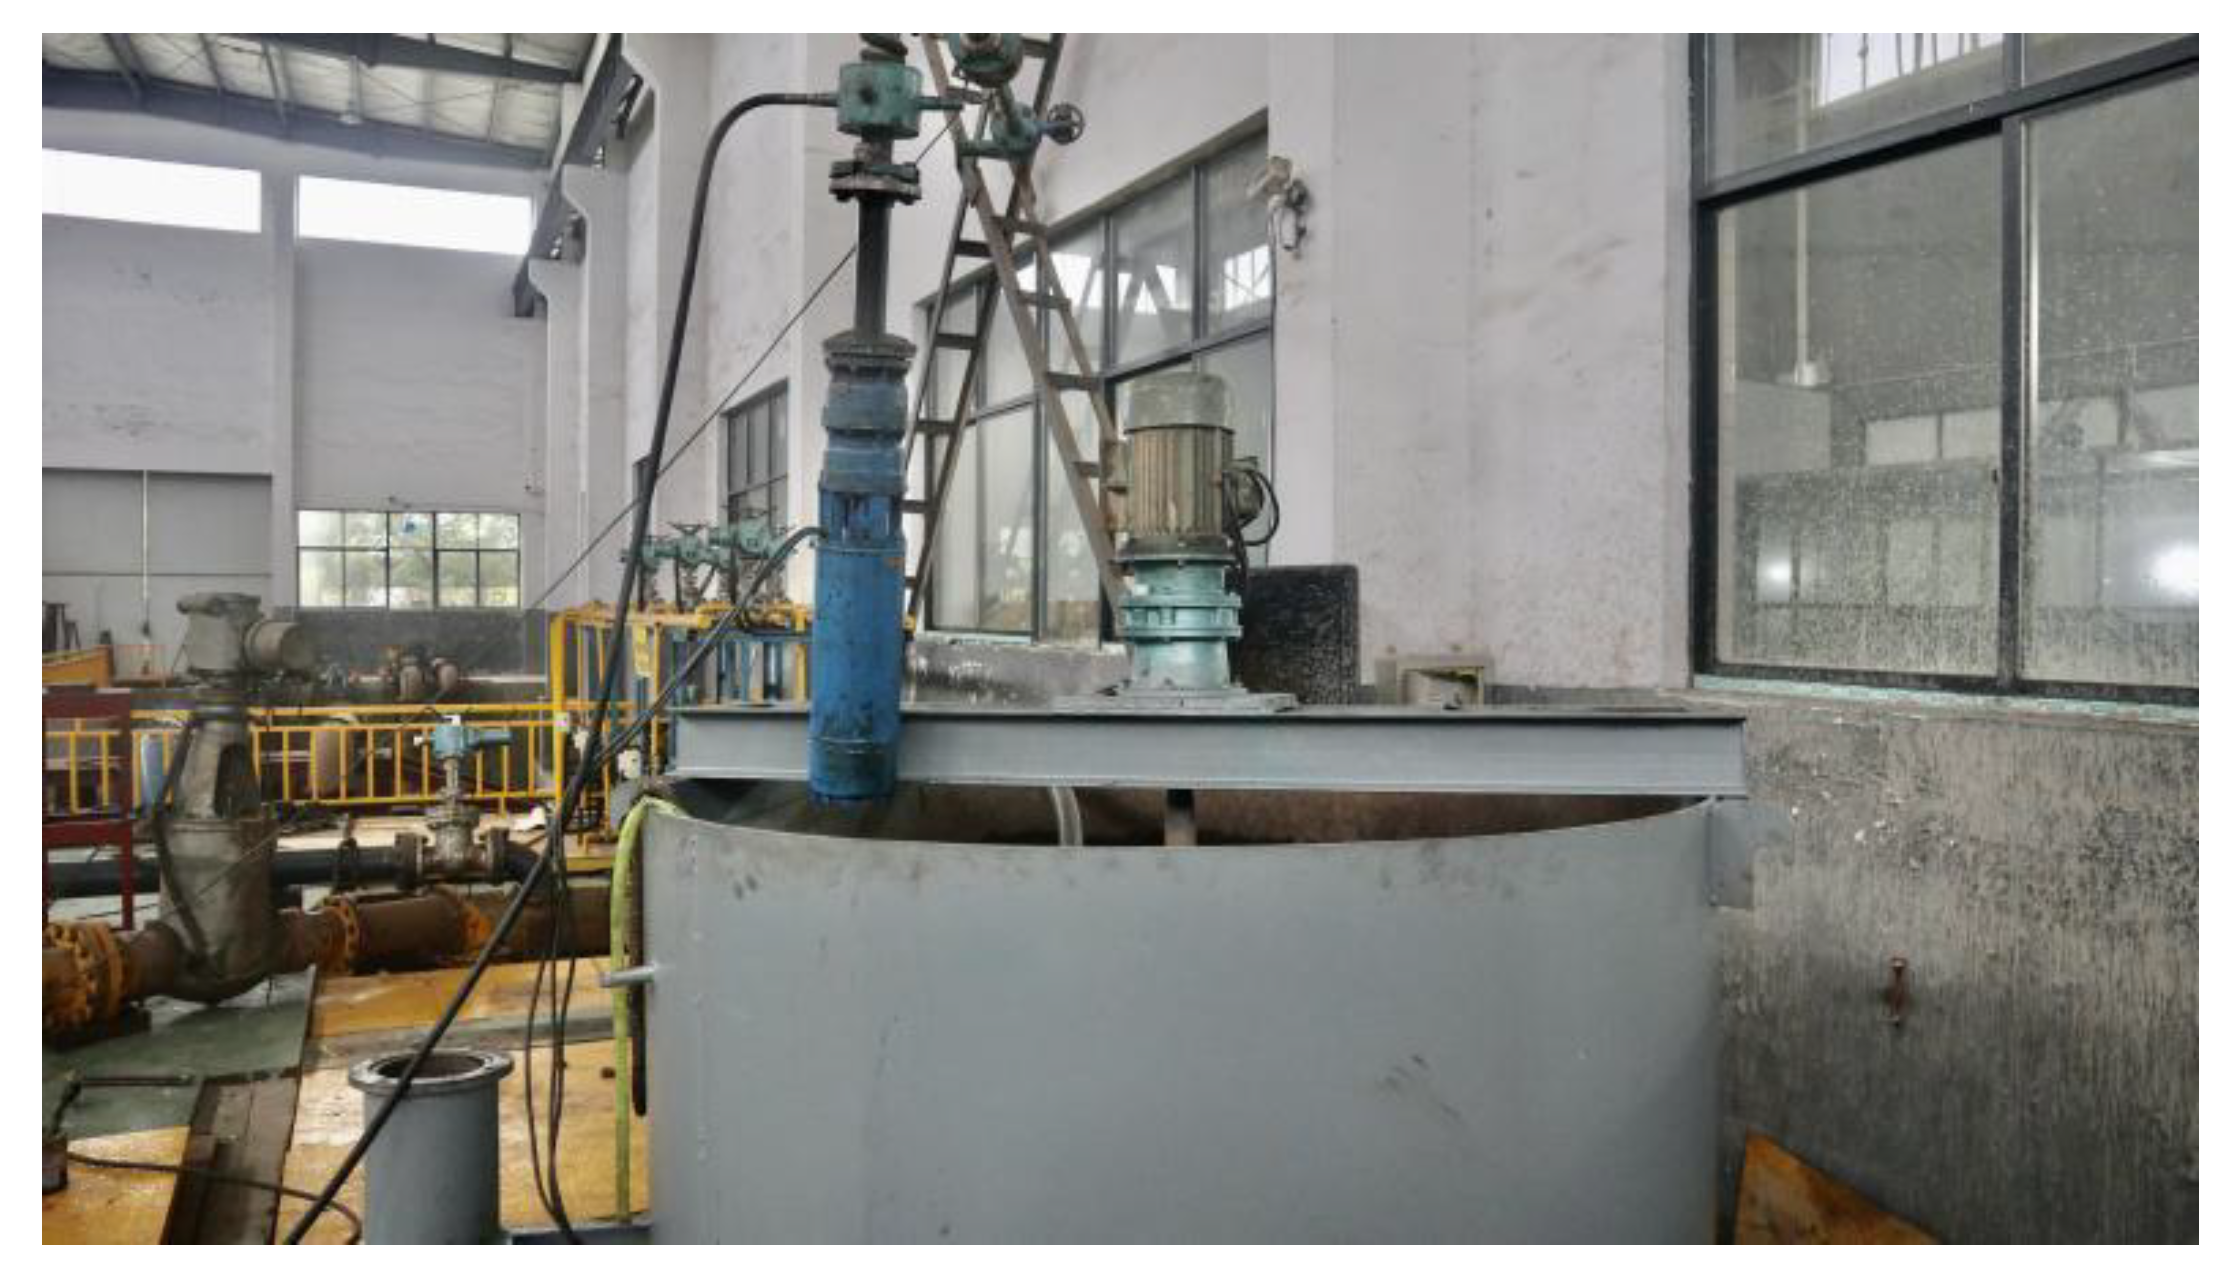
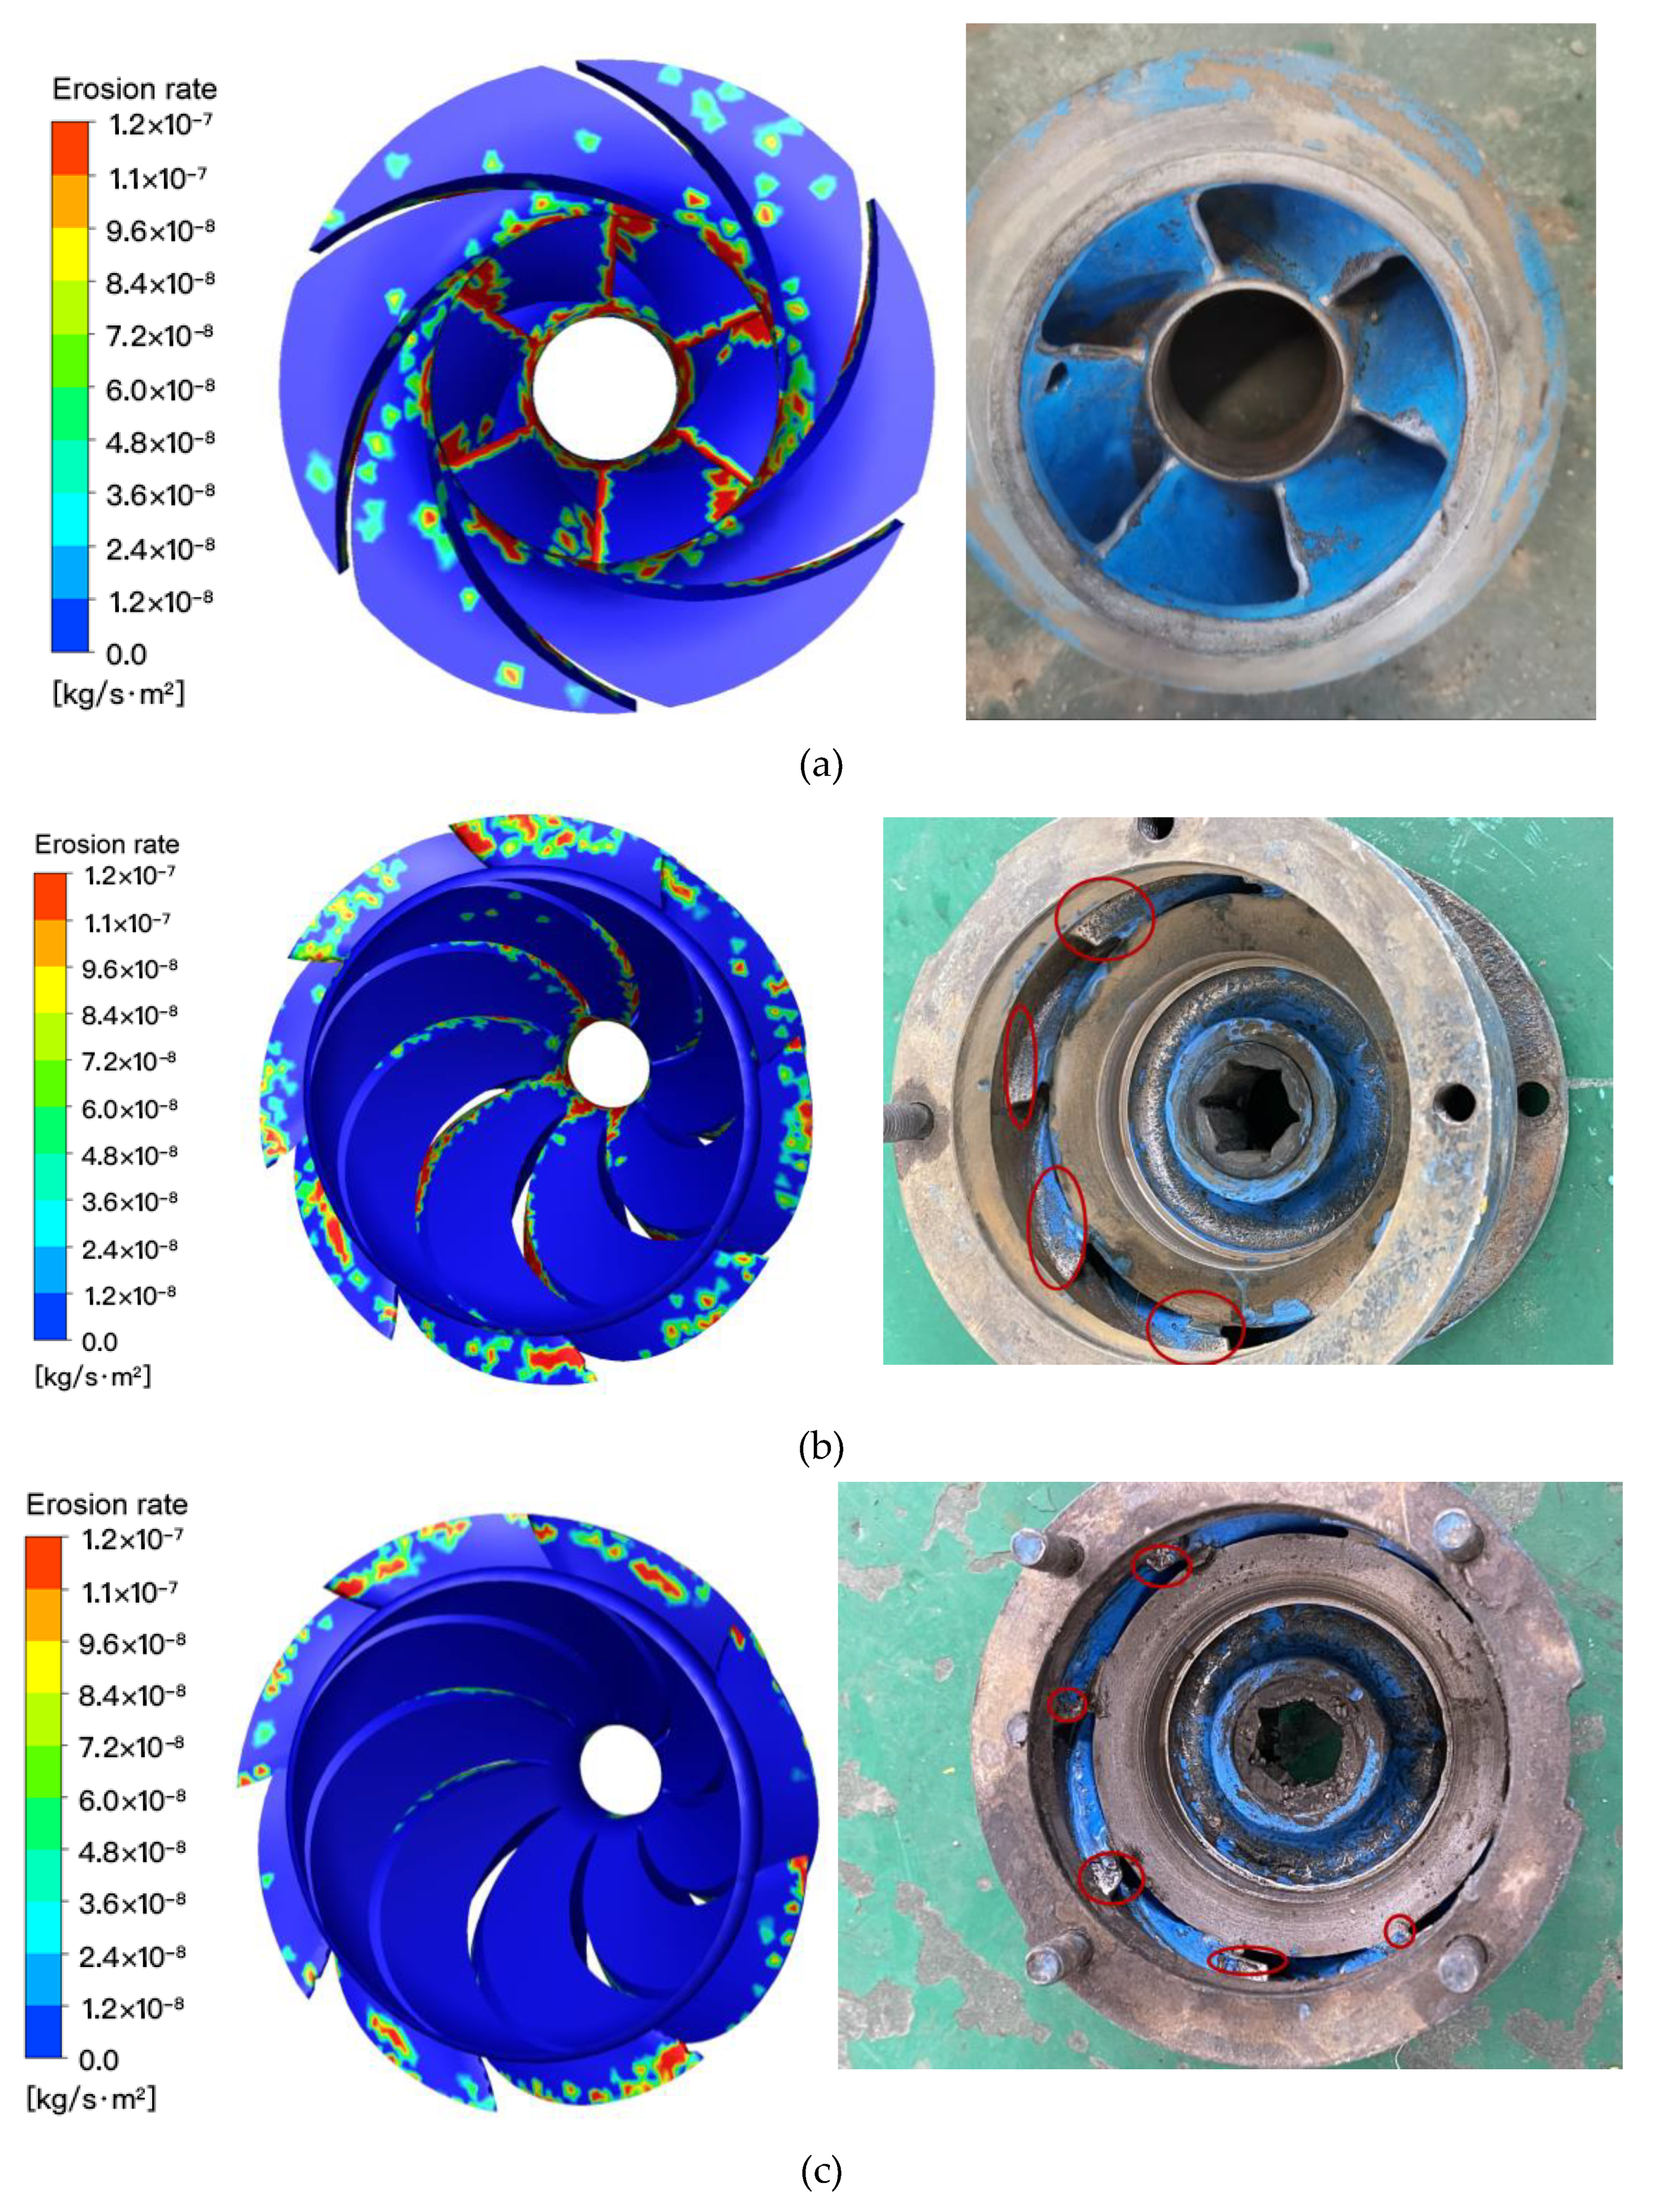
4. Test: Wear Test Verification

Due to the long manufacturing process of the deep-sea mining pump, the conditions for the wear test are not yet available. In order to verify the validity of the numerical calculation method and the wear model used in this article, we made a small test pump with the same specific speed as and a similar structure to that of the deep-sea mining pump for the wear test. In order to facilitate verification, we used a qualitative wear test that has been used in many studies [7,8,19]. The actual test pump is shown in Figure 16.

4.1. Testing Principle

The test was carried out on the condition of the worn area. Taking into account the actual situation of the test pump flow channel, this test uses regular solid particles with a particle size of 3 mm, and the test concentration was set to 7.5%. The test was carried out under large flow conditions (26 m3/h). Before the test, the same thickness of water-based paint was applied to the impeller and guide vane runners. The test was carried out after the paint had completely dried. The state change of the wear area was determined in order to observe the wear of the solid particles on the flow passage components, and then the numerical calculation results under the same boundary conditions were compared. The comparison diagrams of the impeller and guide vane before and after applying the water-based paint are shown in Figure 17 and Figure 18, respectively.
The test system is composed of test pumps, water tanks, regulating valves, pipelines, and data measurement systems. The principle of the test system is shown in Figure 19.
Figure 20 shows the test site during the wear test under high flow conditions.

4.2. Comparative Analysis of the Results

In the numerical calculation of the wear characteristics of the test pump, the calculation results of the state of the wear area of the impeller inlet, the first-stage guide vane, and the secondary guide vane of the test pump were obtained, and the test results were respectively compared and analyzed, as shown in Figure 21.
According to Figure 21a, under the abrasion and damage of the solid particles, the impeller inlet of the test pump is severely worn. This is because, when the particles first contact the impeller inlet, the shape of the particles is complete, and they will collide with the impeller inlet at a large angle.
From the comparison results of the wear of the guide vanes in Figure 21b,c, it can be seen that the maximum wear of the guide vanes appears near the entrance of the blade. At the same position, the surface wear of the first-stage guide vane is more severe than that of the secondary guide vane. This is because the flow state of the solid–liquid two-phase flow is restricted and rectified by the first-stage impeller, the first-stage guide vane, and the secondary impeller, and the flow of particles entering the secondary guide vane is more stable. The number of collisions between particles and the surface of the guide vane is reduced, thereby effectively reducing the wear damage to the surface of the secondary guide vane.

5. Conclusions

(1) At a low flow rate, the turbulent flow phenomenon in the first-stage impeller is prominent, causing the wear on the surface of the first-stage impeller to be more dispersed than that of the second-stage impeller when the impellers rotate through one third of a full cycle (120°). Due to the interference between the dynamic impellers and static guide vanes, the wear is concentrated in the middle of the guide vanes, at which point the wear rate is the highest.
(2) As the flow rate is increased to the design flow rate, the wear on the surface of the impellers and guide vanes is distributed in bands, and the pattern of the wear becomes more regular. At a high flow rate, the wear on the surface of the impellers and guide vanes increases.
(3) The wear characteristics of the flow passage components in the pump under non-steady-state flow conditions during the transportation of coarse-grained mineral nodules were successfully analyzed. These results closely reflect the wear that may occur inside of a pump.
(4) By comparing the results of the wear area state obtained by the numerical calculation with the test results, the numerical calculation wear area was found to be more consistent with the test wear area, which shows that the numerical calculation method used in this paper can predict the wear of the deep-sea mining pump more accurately.
(5) Due to the complex working environment of deep-sea mining pumps, the particle flow process is also very complicated. In the process of transporting solid–liquid two-phase flow, solid particles will cause different degrees of wear on the mining pump. Using appropriate numerical calculation methods and wear models to predict the wear characteristics of mining pumps can help guide the strengthening of the strength of severely worn parts. The research in this article provides a suitable numerical calculation method and wear model.

Author Contributions

Conceptualization, S.H.; methodology, S.H. and X.H.; software, S.H.; validation, S.H.; formal analysis, S.H.; investigation, S.H.; resources, S.H. and X.H.; data curation, S.H.; writing—original draft preparation, S.H.; writing—review and editing, S.H. and X.H.; visualization, S.H.; supervision, S.H.; project administration, S.H.; funding acquisition, X.H. All authors have read and agreed to the published version of the manuscript.

Funding

This work was supported by the National Key Research and Development Project of China, grant number 2016YFC0304103.

Institutional Review Board Statement

Not applicable.

Informed Consent Statement

Not applicable.

Data Availability Statement

Not applicable.

Acknowledgments

This work was supported by the National Key Research and Development Project of China (2016YFC0304103).

Conflicts of Interest

The authors declare no conflict of interest.

References

  1. Liu, H.X.; Yang, W.X.; Kang, R. A correlation for sand erosion prediction in annular flow considering the effect of liquid dynamic viscosity. Wear 2018, 404–405, 1–11. [Google Scholar] [CrossRef]
  2. Xu, H.; Zhou, Y.; Yang, F. Analysis on influences of feeding flow rate on flow characteristics in deep-sea ore hydraulic transport equipment. J. Drain. Irrig. Mach. Eng. 2019, 37, 618–624. [Google Scholar]
  3. Liu, S.-J.; Wen, H.; Zou, W.-S.; Hu, X.-Z.; Dong, Z. Deep-Sea Mining Pump Wear Prediction Using Numerical Two-Phase Flow Simulation. In Proceedings of the 2019 International Conference on Intelligent Transportation, Big Data & Smart City (ICITBS), Changsha, China, 12–13 January 2019; pp. 630–636. [Google Scholar]
  4. Peng, G.; Chen, Q.; Bai, L.; Hu, Z.; Zhou, L.; Huang, X. Wear mechanism investigation in a centrifugal slurry pump impeller by numerical simulation and experiments. Eng. Fail. Anal. 2021, 128, 105637. [Google Scholar] [CrossRef]
  5. Noon, A.A.; Kim, M.H. Erosion wear on centrifugal pump casing due to slurry flow. Wear 2016, 364–365, 103–111. [Google Scholar] [CrossRef]
  6. Tarodiya, R.; Gandhi, B.K. Hydraulic performance and erosive wear of centrifugal slurry pumps—A review. Powder Technol. 2017, 305, 27–38. [Google Scholar] [CrossRef]
  7. Peng, G.; Fan, F.; Zhou, L.; Huang, X.; Ma, J. Optimal hydraulic design to minimize erosive wear in a centrifugal slurry pump impeller. Eng. Fail. Anal. 2020, 120, 105105. [Google Scholar] [CrossRef]
  8. Song, X.J.; Yao, R.; Shen, Y.B.; Bi, H.; Zhang, Y.; Du, L.; Wang, Z. Numerical Prediction of Erosion Based on the Solid-Liquid Two-Phase Flow in a Double-Suction Centrifugal Pump. J. Mar. Sci. Eng. 2021, 9, 836. [Google Scholar] [CrossRef]
  9. Liu, Z.G.; Wan, S.; Nguyen, V.B.; Zhang, Y.-W. A numerical study on the effect of particle shape on the erosion of ductile materials. Wear 2014, 313, 135–142. [Google Scholar] [CrossRef]
  10. Takaffoli, M.; Papini, M. Numerical simulation of solid particle impacts on Al6061-T6 Part II: Materials removal mechanisms for impact of multiple angular particles. Wear 2012, 296, 648–655. [Google Scholar] [CrossRef]
  11. Grant, G.; Tabakoff, W. Erosion Prediction in Turbomachinery Resulting from Environmental Solid Particles. J. Aircr. 2012, 12, 471–478. [Google Scholar] [CrossRef]
  12. Arabnejad, H.; Mansouri, A.; Shirazi, S.; McLaury, B.S. Development of mechanistic erosion equation for solid particles. Wear 2015, 332-333, 1044–1050. [Google Scholar] [CrossRef]
  13. Huang, X.; Yang, S.; Liu, Z.; Yang, W.; Li, Y. Numerical simulation of prediction in centrifugal pump based on particle track model. Trans. Chin. Soc. Agric. Mach. 2016, 47, 35–41. [Google Scholar]
  14. Nguyen, V.; Nguyen, Q.B.; Zhang, Y.-W.; Lim, C.Y.H.; Khoo, B.C. Effect of particle size on erosion characteristics. Wear 2016, 348, 126–137. [Google Scholar] [CrossRef]
  15. Peng, W.; Cao, X. Numerical simulation of solid particle erosion in pipe bends for liquid–solid flow. Powder Technol. 2016, 294, 266–279. [Google Scholar] [CrossRef]
  16. Wang, R.; Guan, Y.; Jin, X.; Tang, Z.; Zhu, Z.; Su, X. Impact of Particle Sizes on Flow Characteristics of Slurry Pump for Deep-Sea Mining. Shock. Vib. 2021, 2021, 6684944. [Google Scholar] [CrossRef]
  17. Wang, Z.; Qian, Z. Effects of concentration and size of silt particles on the performance of a double-suction centrifugal pump. Energy 2017, 123, 36–46. [Google Scholar] [CrossRef]
  18. Liao, J.; Lai, X.D.; Zhang, W.M. Numerical analysis of internal flow field of centrifugal pump based on solid-liquid two-phase flow. J. Eng. Therm. Energy Power 2017, 32, 95–99+139–140. [Google Scholar]
  19. Shen, Z.; Chu, W.; Li, X.J.; Dong, W. Sediment erosion in the impeller of a double-suction centrifugal pump—A case study of the Jingtai Yellow River Irrigation Project, China. Wear 2019, 422–423, 269–279. [Google Scholar] [CrossRef]
  20. Serrano, R.O.P.; Santos, L.P.; Viana, E.M.F.; Pinto, M.A.; Martinez, C.B. Case study: Effects of sediment concentration on the wear of fluvial water pump impellers on Brazil’s Acre River. Wear 2018, 408–409, 131–137. [Google Scholar] [CrossRef]
  21. López, A.; Stickland, M.; Dempster, W. Modeling erosion in a centrifugal pump in an Eulerian-Lagrangian frame using OpenFOAM®. Open Eng. 2015, 5, 105–124. [Google Scholar] [CrossRef]
  22. Li, Y.W.; Liu, S.J.; Hu, X.Z. Rotating speed’s influence on performance of deep-sea lifting motor pump based on DEM-CFD. Mar. Georesour. Geotecnol. 2019, 37, 979–988. [Google Scholar] [CrossRef]
  23. Zhou, L.; Han, C.; Bai, L.; Li, W.; El-Emam, M.A.; Shi, W. CFD-DEM bidirectional coupling simulation and experimental investigation of particle ejections and energy conversion in a spouted bed. Energy 2020, 211, 118672. [Google Scholar] [CrossRef]
  24. Huang, R.F.; Wang, Y.W.; Du, T.Z.; Luo, X.; Zhang, W.; Dai, Y. Mechanism analyses of the unsteady vortical cavitation behaviors for a waterjet pump in a non-uniform inflow. Ocean Eng. 2021, 233, 108798. [Google Scholar] [CrossRef]
  25. Su, X.H.; Huang, S.; Zhang, X.; Yang, S. Numerical research on unsteady flow rate characteristics of pump as turbine. Renew. Energy 2016, 94, 488–495. [Google Scholar] [CrossRef]
  26. Zhang, N.; Liu, X.K.; Gao, B.; Xia, B. DDES analysis of the unsteady wake flow and its evolution of a centrifugal pump. Renew. Energy 2019, 141, 570–582. [Google Scholar] [CrossRef]
  27. Zhang, N.; Liu, X.; Gao, B.; Wang, X.; Xia, B. Effects of modifying the blade trailing edge profile on unsteady pressure pulsations and flow structures in a centrifugal pump. Int. J. Heat Fluid Flow 2019, 75, 227–238. [Google Scholar] [CrossRef]
  28. Zhang, N.; Jiang, J.X.; Gao, B.; Liu, X. DDES analysis of unsteady flow evolution and pressure pulsation at off-design condition of a centrifugal pump. Renew. Energy 2020, 153, 193–204. [Google Scholar] [CrossRef]
  29. Liu, S.J.; Liu, C.; Dai, Y. Status and progress on researches and developmengts of deep ocean mining equipmengts. J. Mech. Eng. 2014, 50, 8–18. [Google Scholar] [CrossRef]
  30. Kang, Y.J.; Liu, S.J.; Zou, W.S.; Zhao, H.; Hu, X. Design and analysis of an innovative deep-sea lifting motor pump. Appl. Ocean Res. 2018, 82, 22–31. [Google Scholar] [CrossRef]
  31. Wen, H.; Liu, S.-J.; Zou, W.-S.; Hu, X.-Z.; Dong, Z. Effects of Particle Diameter on Erosion Wear Characteristic of Deep-Sea Mining Pump. In Proceedings of the 2019 International Conference on Intelligent Transportation, Big Data & Smart City (ICITBS), Changsha, China, 12–13 January 2019; pp. 507–512. [Google Scholar]
  32. Zhao, R.-J.; Zhao, Y.-L.; Zhang, D.-S.; Li, Y.; Geng, L.-L. Numerical Investigation of the Characteristics of Erosion in a Centrifugal Pump for Transporting Dilute Particle-Laden Flows. J. Mar. Sci. Eng. 2021, 9, 961. [Google Scholar] [CrossRef]
Figure 1. The structure of the through-passage components of the mining pump.
Applsci 12 00782 g001
Figure 2. Model pump computational domain grid.
Applsci 12 00782 g002
Figure 3. Structure model diagram of the mining pump.
Applsci 12 00782 g003
Figure 4. Surface wear rate evolution of the first-stage impeller. (a) 0°, (b) 24°, (c) 48°, (d) 72°, (e) 96°, (f) 120°.
Applsci 12 00782 g004
Figure 5. Surface wear rate evolution of the second-stage impeller. (a) 0°, (b) 24°, (c) 48°, (d) 72°, (e) 96°, (f) 120°.
Applsci 12 00782 g005
Figure 6. Surface wear rate evolution of the first-stage guide vane. (a) 0°, (b) 24°, (c) 48°, (d) 72°, (e) 96°, (f) 120°.
Applsci 12 00782 g006
Figure 7. Surface wear rate evolution of the second-stage guide vane. (a) 0°, (b) 24°, (c) 48°, (d) 72°, (e) 96°, (f) 120°.
Applsci 12 00782 g007
Figure 8. Surface wear rate evolution of the first-stage impeller. (a) 0°, (b) 24°, (c) 48°, (d) 72°, (e) 96°, (f) 120°.
Applsci 12 00782 g008
Figure 9. Surface wear rate evolution of the second-stage impeller. (a) 0°, (b) 24°, (c) 48°, (d) 72°, (e) 96°, (f) 120°.
Applsci 12 00782 g009
Figure 10. Surface wear rate evolution of the first-stage guide vane. (a) 0°, (b) 24°, (c) 48°, (d) 72°, (e) 96°, (f) 120°.
Applsci 12 00782 g010
Figure 11. Surface wear rate evolution of the second-stage guide vane. (a) 0°, (b) 24°, (c) 48°, (d) 72°, (e) 96°, (f) 120°.
Applsci 12 00782 g011
Figure 12. Surface wear rate evolution of the first-stage impeller. (a) 0°, (b) 24°, (c) 48°, (d) 72°, (e) 96°, (f) 120°.
Applsci 12 00782 g012
Figure 13. Surface wear rate evolution of the second-stage impeller. (a) 0°, (b) 24°, (c) 48°, (d) 72°, (e) 96°, (f) 120°.
Applsci 12 00782 g013
Figure 14. Surface wear rate evolution of the first-stage guide vane. (a) 0°, (b) 24°, (c) 48°, (d) 72°, (e) 96°, (f) 120°.
Applsci 12 00782 g014
Figure 15. Surface wear rate evolution of the second-stage guide vane. (a) 0°, (b) 24°, (c) 48°, (d) 72°, (e) 96°, (f) 120°.
Applsci 12 00782 g015
Figure 16. Test pump.
Applsci 12 00782 g016
Figure 17. Comparison diagram of the impeller runner before and after applying water-based paint. (a) Before painting, (b) After painting.
Applsci 12 00782 g017
Figure 18. Comparison diagram of the guide vane runner before and after applying water-based paint. (a) Before painting, (b) After painting.
Applsci 12 00782 g018
Figure 19. Test system diagram. 1—Test pump (including motor); 2—Test pump support mechanism; 3—Flow meter; 4—Outlet pipe; 5—Return pipe; 6—Regulating valve; 7—Return pipe support member; 8—Cable terminal; 9—Cable fixing component; 10—Water tank; 11—Anti-submersible pump swing component.
Applsci 12 00782 g019
Figure 20. Test site.
Applsci 12 00782 g020
Figure 21. Comparison of numerical calculation results and test results of the wear area. (a) Impeller inlet, (b) First-stage guide vane, (c) Secondary guide vane.
Applsci 12 00782 g021
Table 1. Values of parameters in the impact angle equation.
bcxywz
−13.37.851.090.12511
b, c, x, y, w, and z are empirical constants in the impact angle function equation.
Publisher’s Note: MDPI stays neutral with regard to jurisdictional claims in published maps and institutional affiliations.

