
Frother Characterization Using a Novel Bubble Size Measurement Technique


Abstract
:1. Introduction
1.1. Bubble Size in Flotation
1.2. Frothers and Their Characterization
1.3. Traditional Bubble Size Measurement Tools
- Bubbles are sampled from the pulp through a bubble rise tube or column, leaving the solids behind.
- The bubbles rise through the sampling column into a measurement chamber. This chamber can be a bubble viewer window, where bubble images are captured employing a camera. Alternatively, bubbles can be captured by a bell capillary, where the volume of individual bubbles is calculated from the total volume of collected gas.
- In all cases, the measured size of the bubbles needs to be adjusted to compensate for a difference in hydrostatic pressure between the sampling point and the measurement point.
- Before measurement, the instrument needs to be filled with water that matches the chemical composition of the flotation pulp. However, an additional frother is usually added to the analyzer to prevent bubble coalescence inside the sampling tube.
- During the measurement, the water contained within the instrument is displaced by the collected gas. The downward flow of water then flows counter-current to the rising bubbles.
1.4. In Situ Measurement Tools
2. Materials and Experimental Methods
2.1. Bubble Generation Systems
2.1.1. Bubble Generation Columns
2.1.2. Frothers
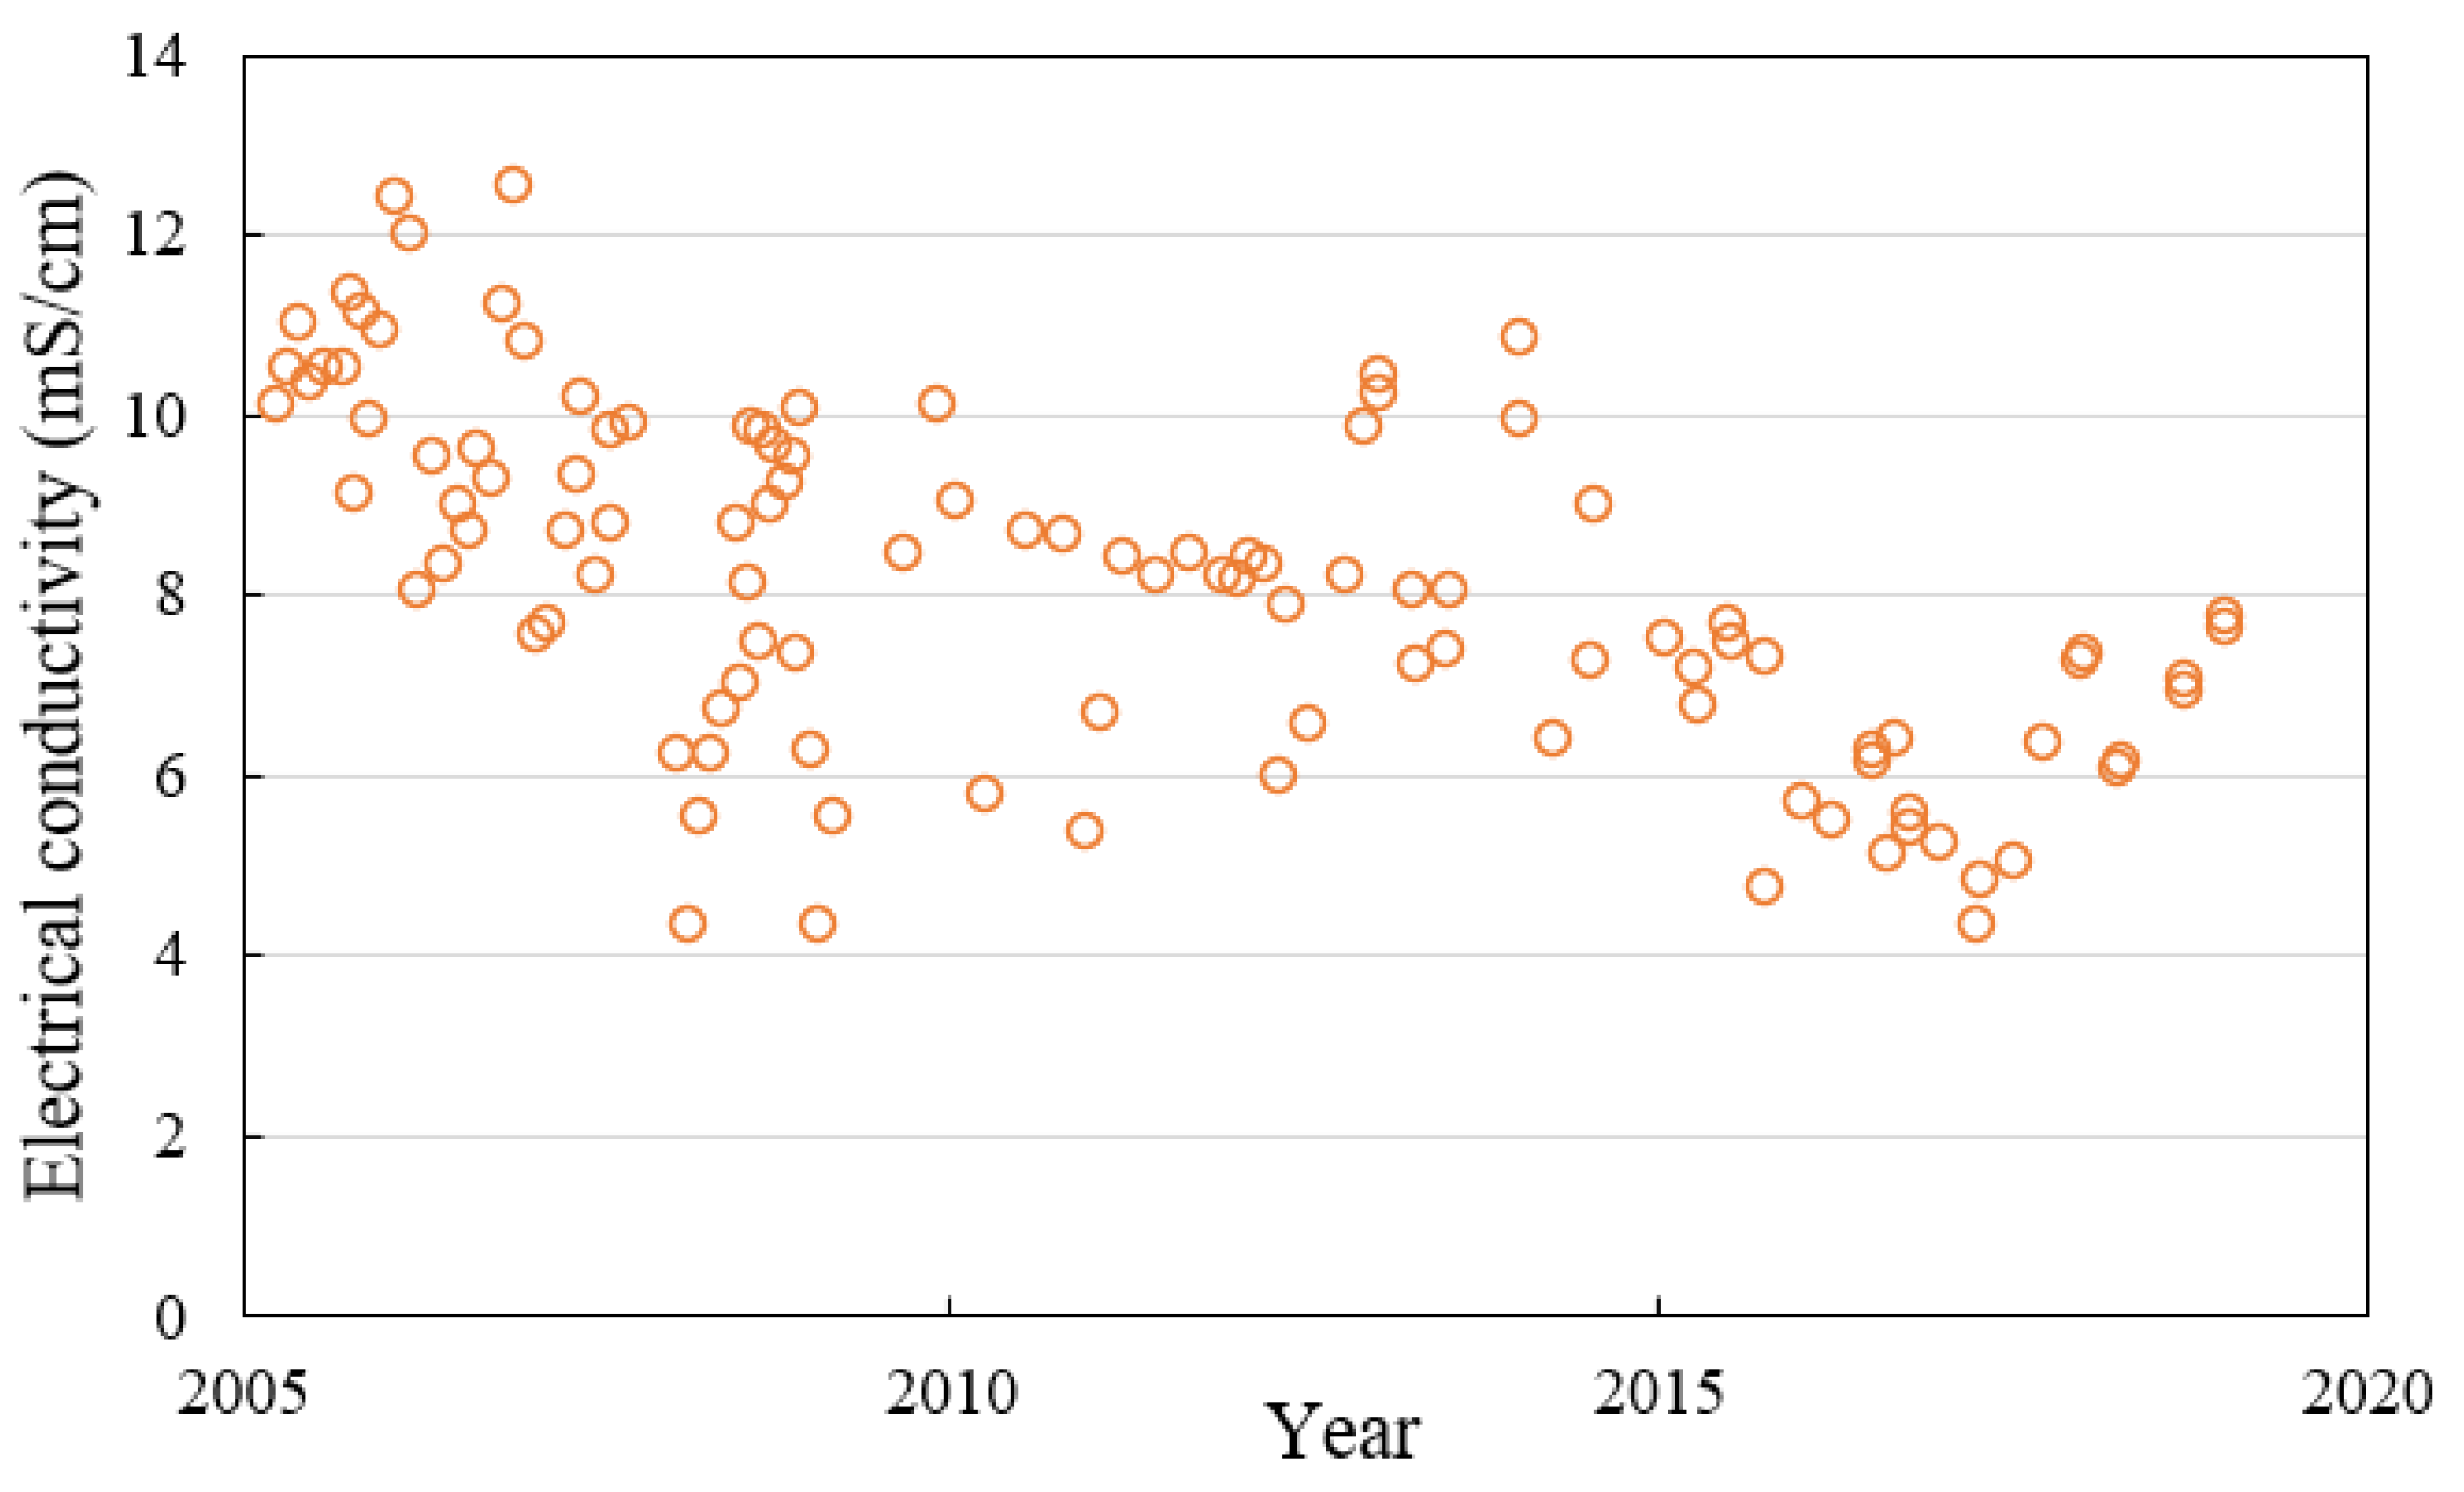
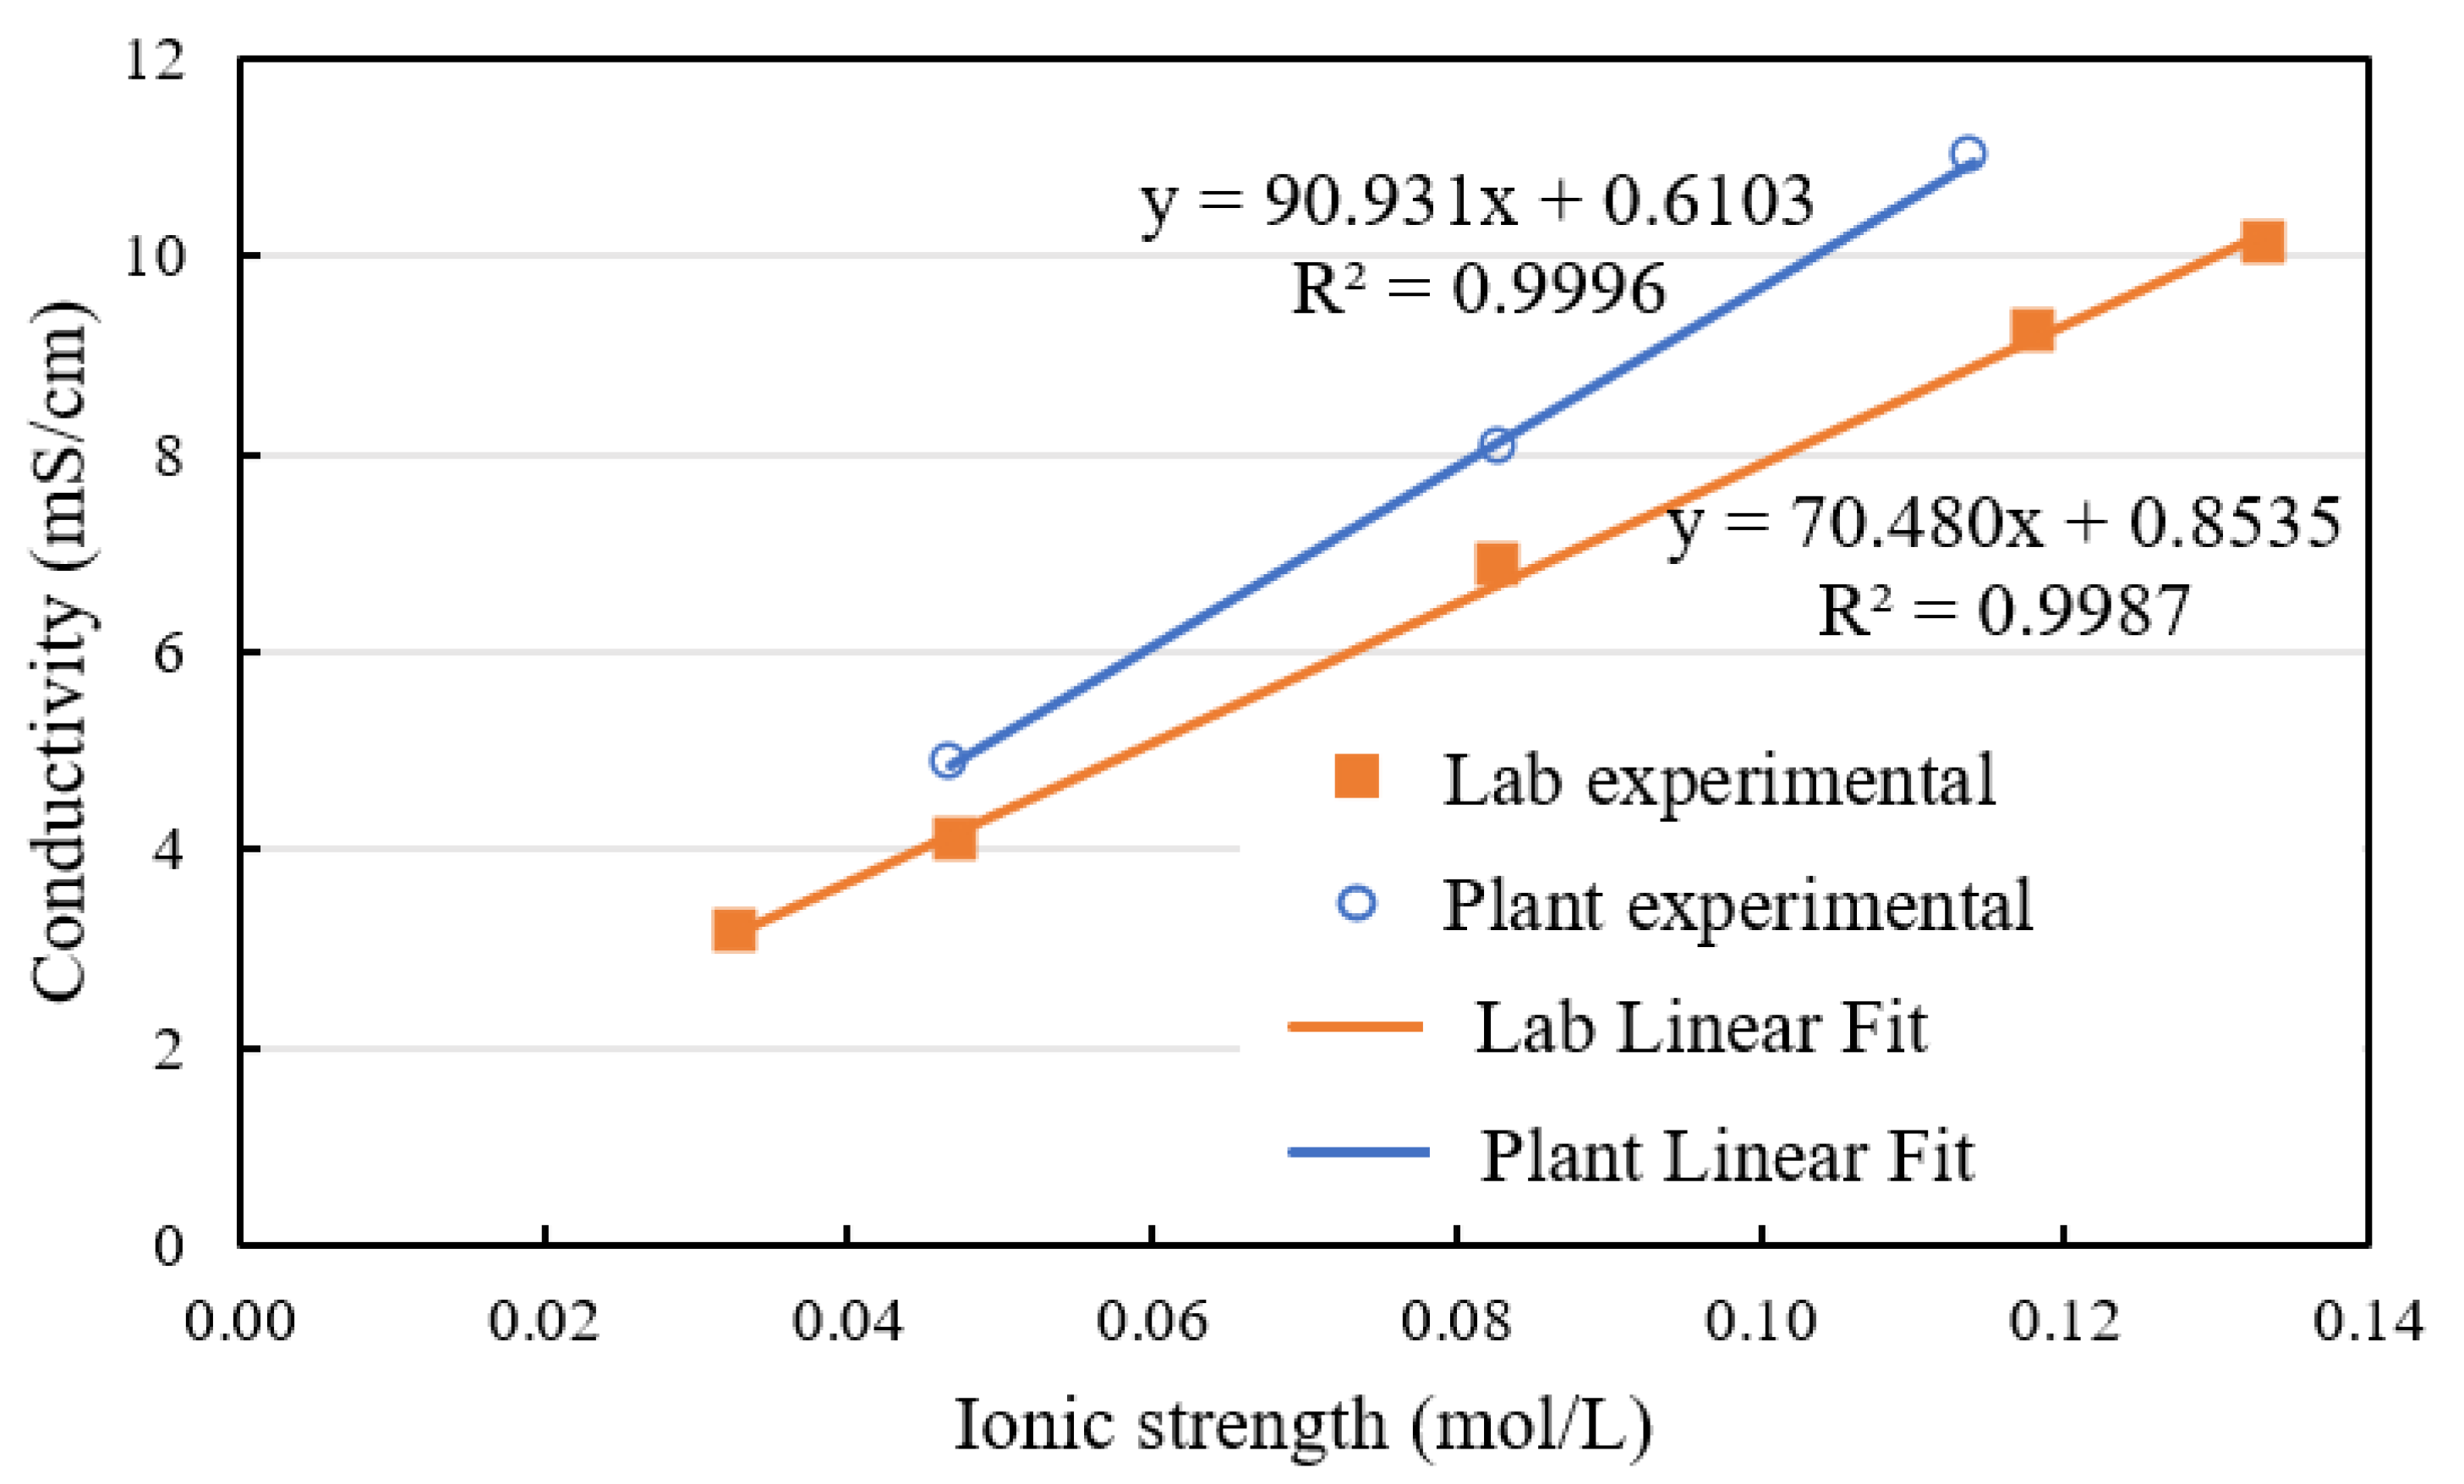
2.1.3. Electrolytes
2.1.4. Experimental Procedure
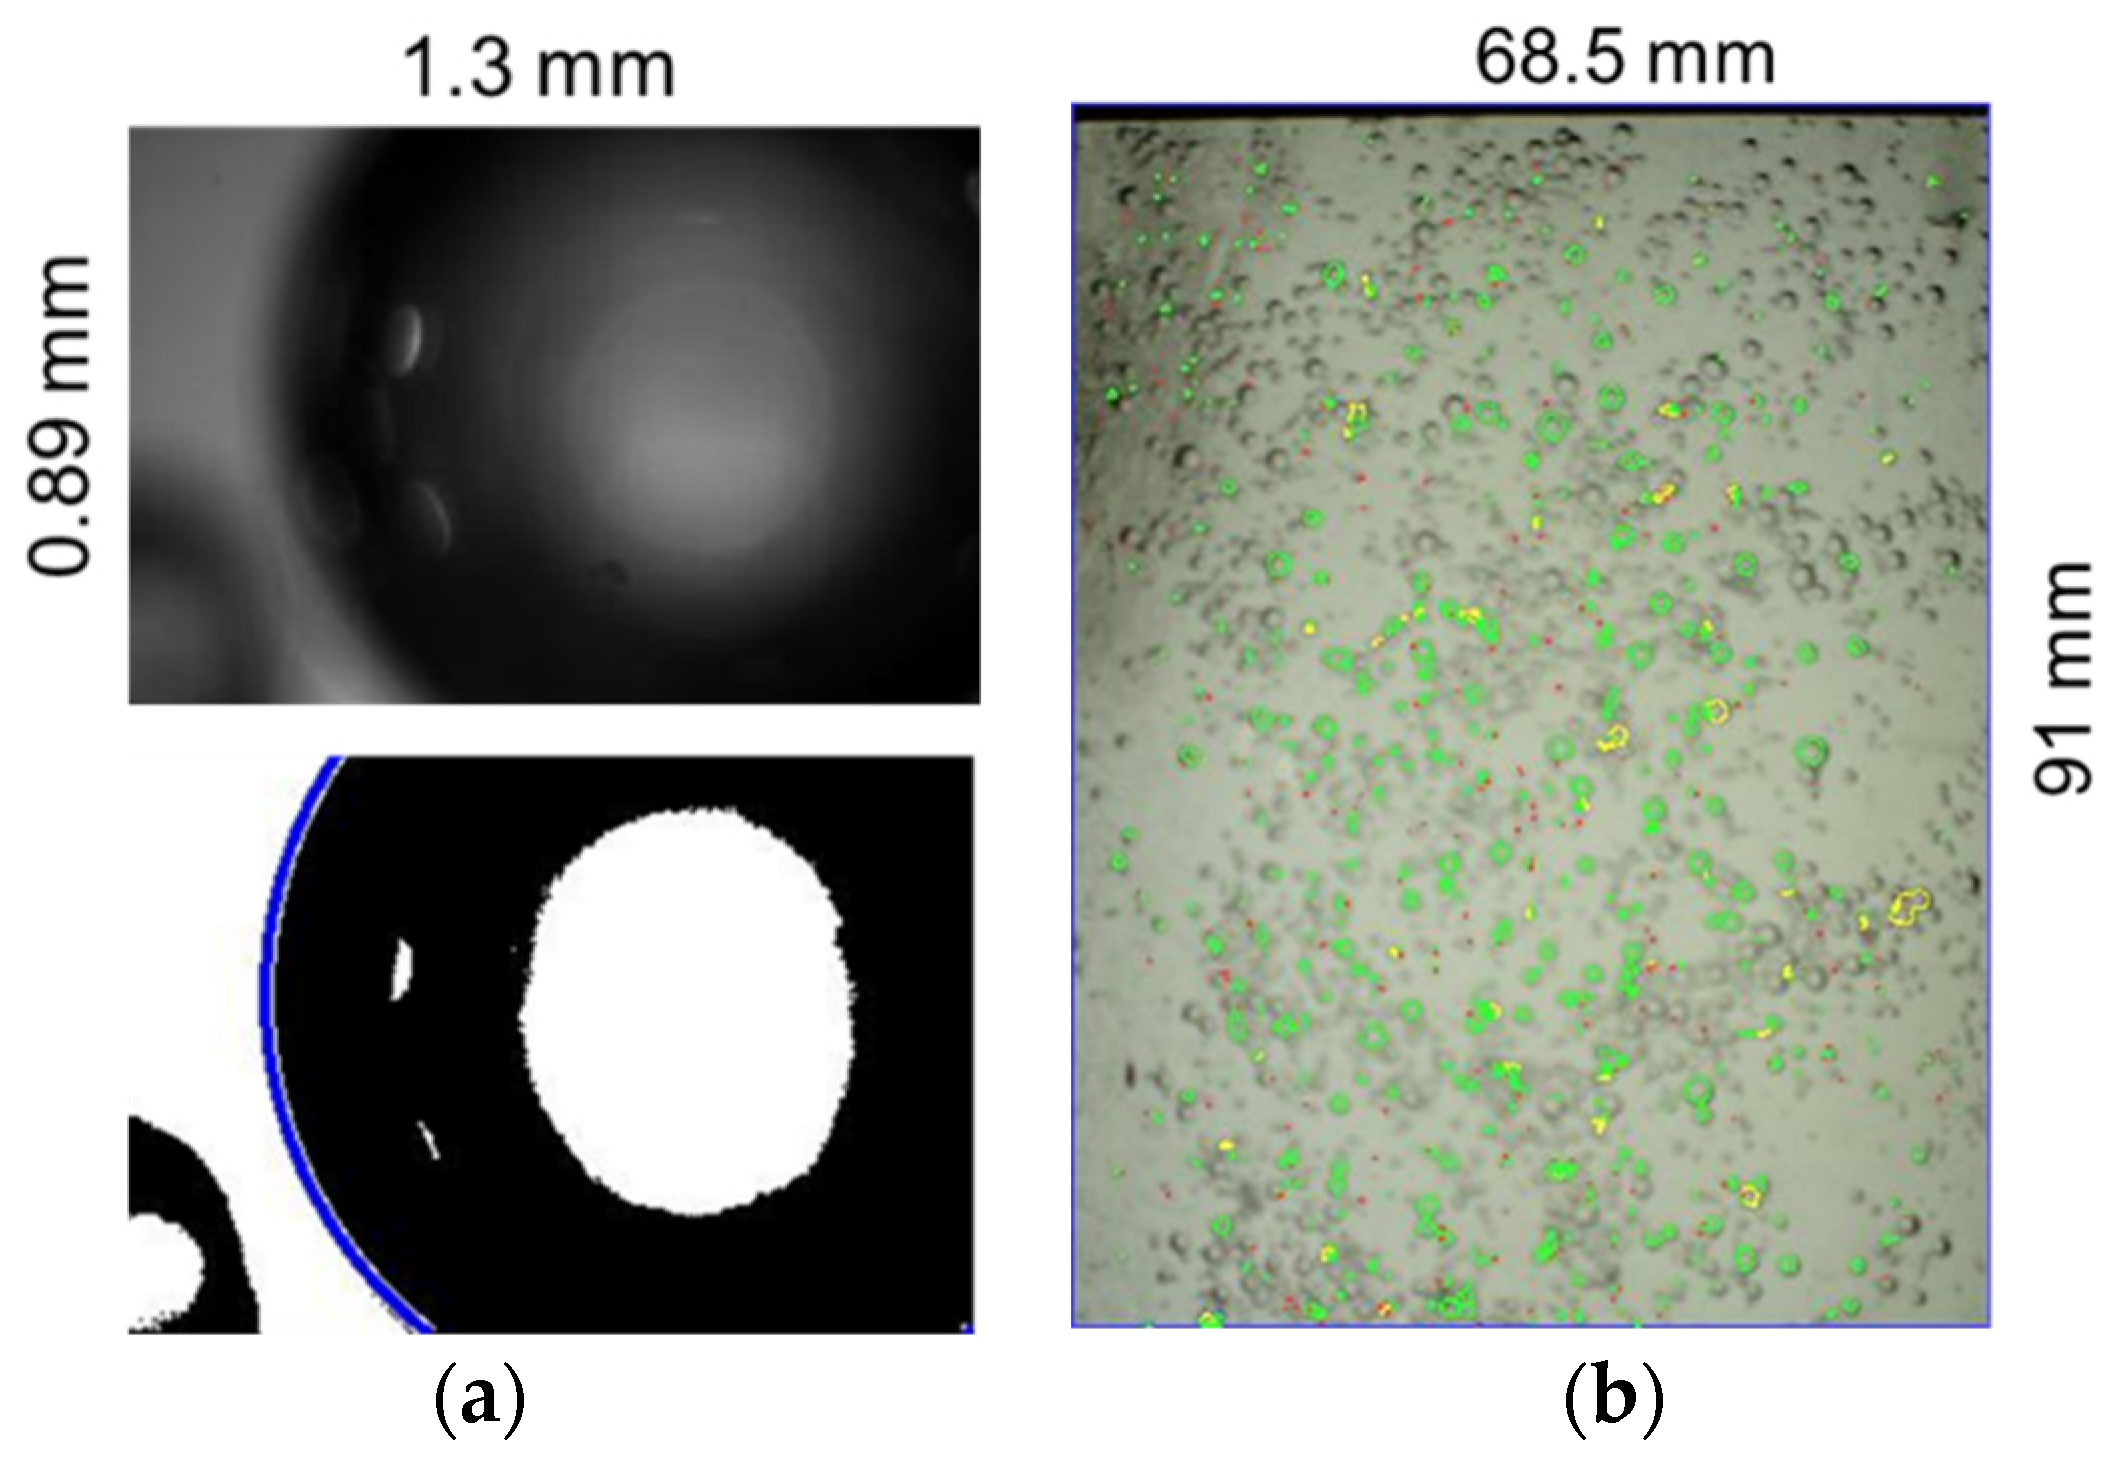
2.2. Bubble Size Measurement Techniques
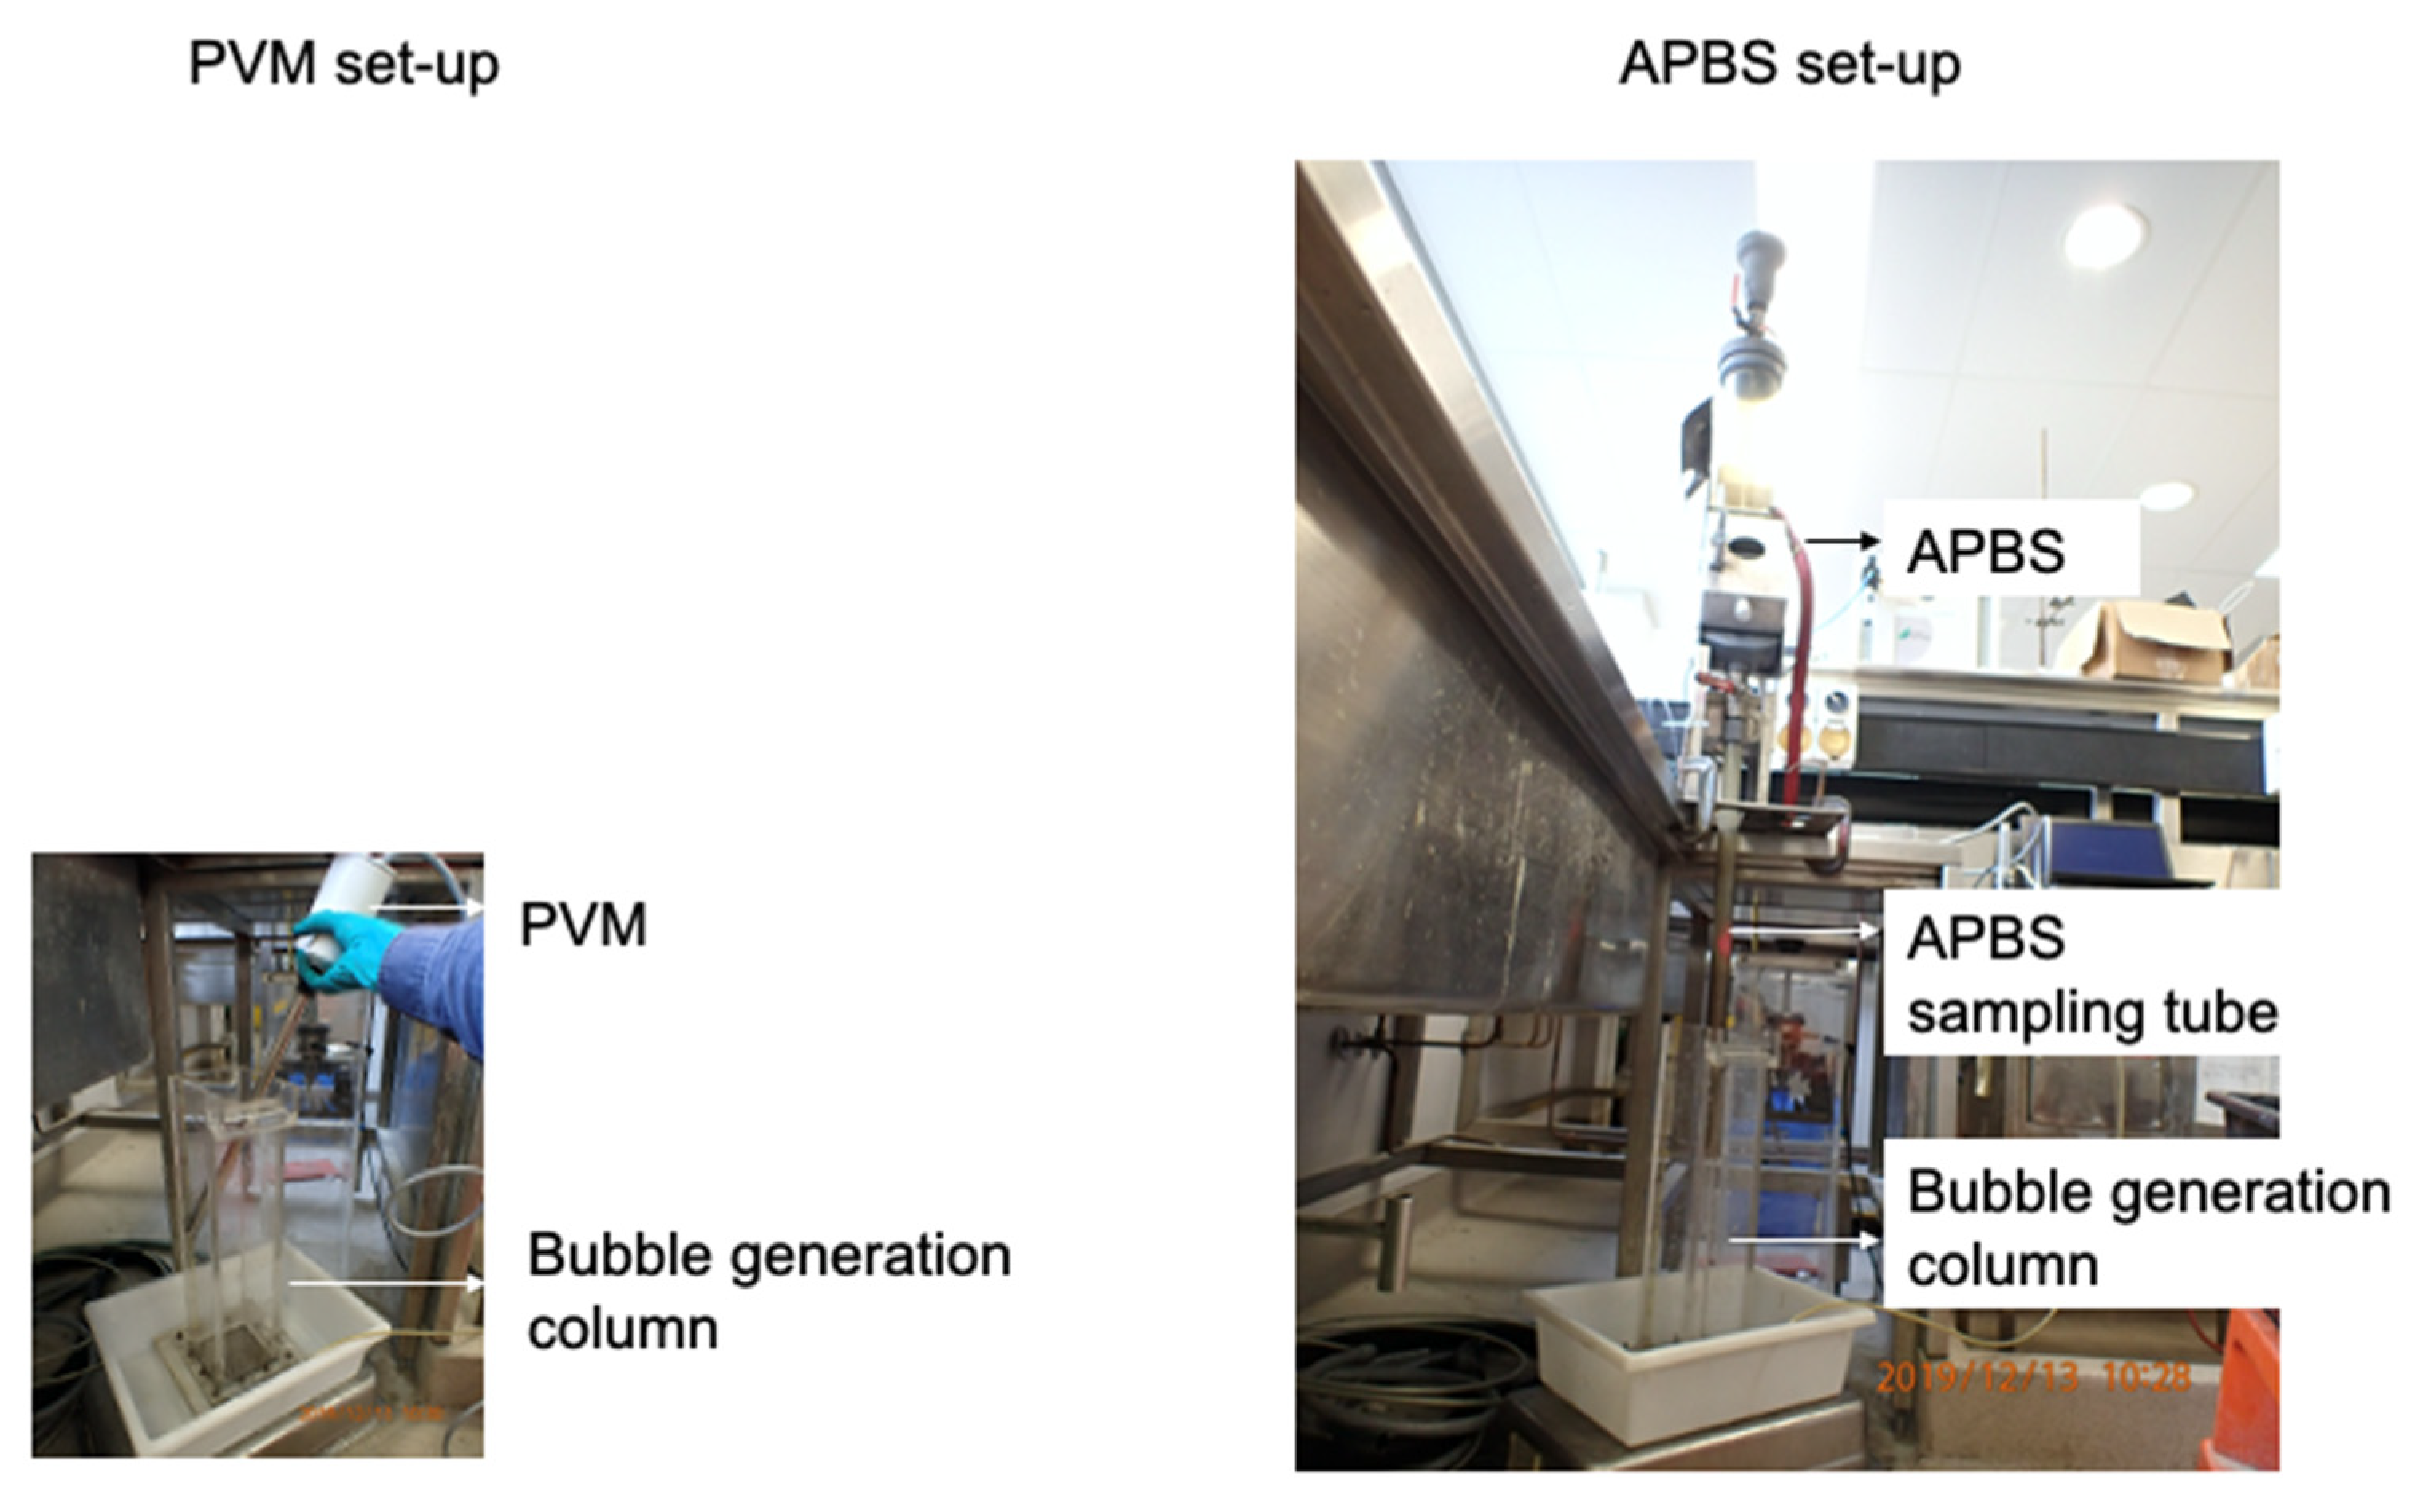
2.2.1. APBS Probe
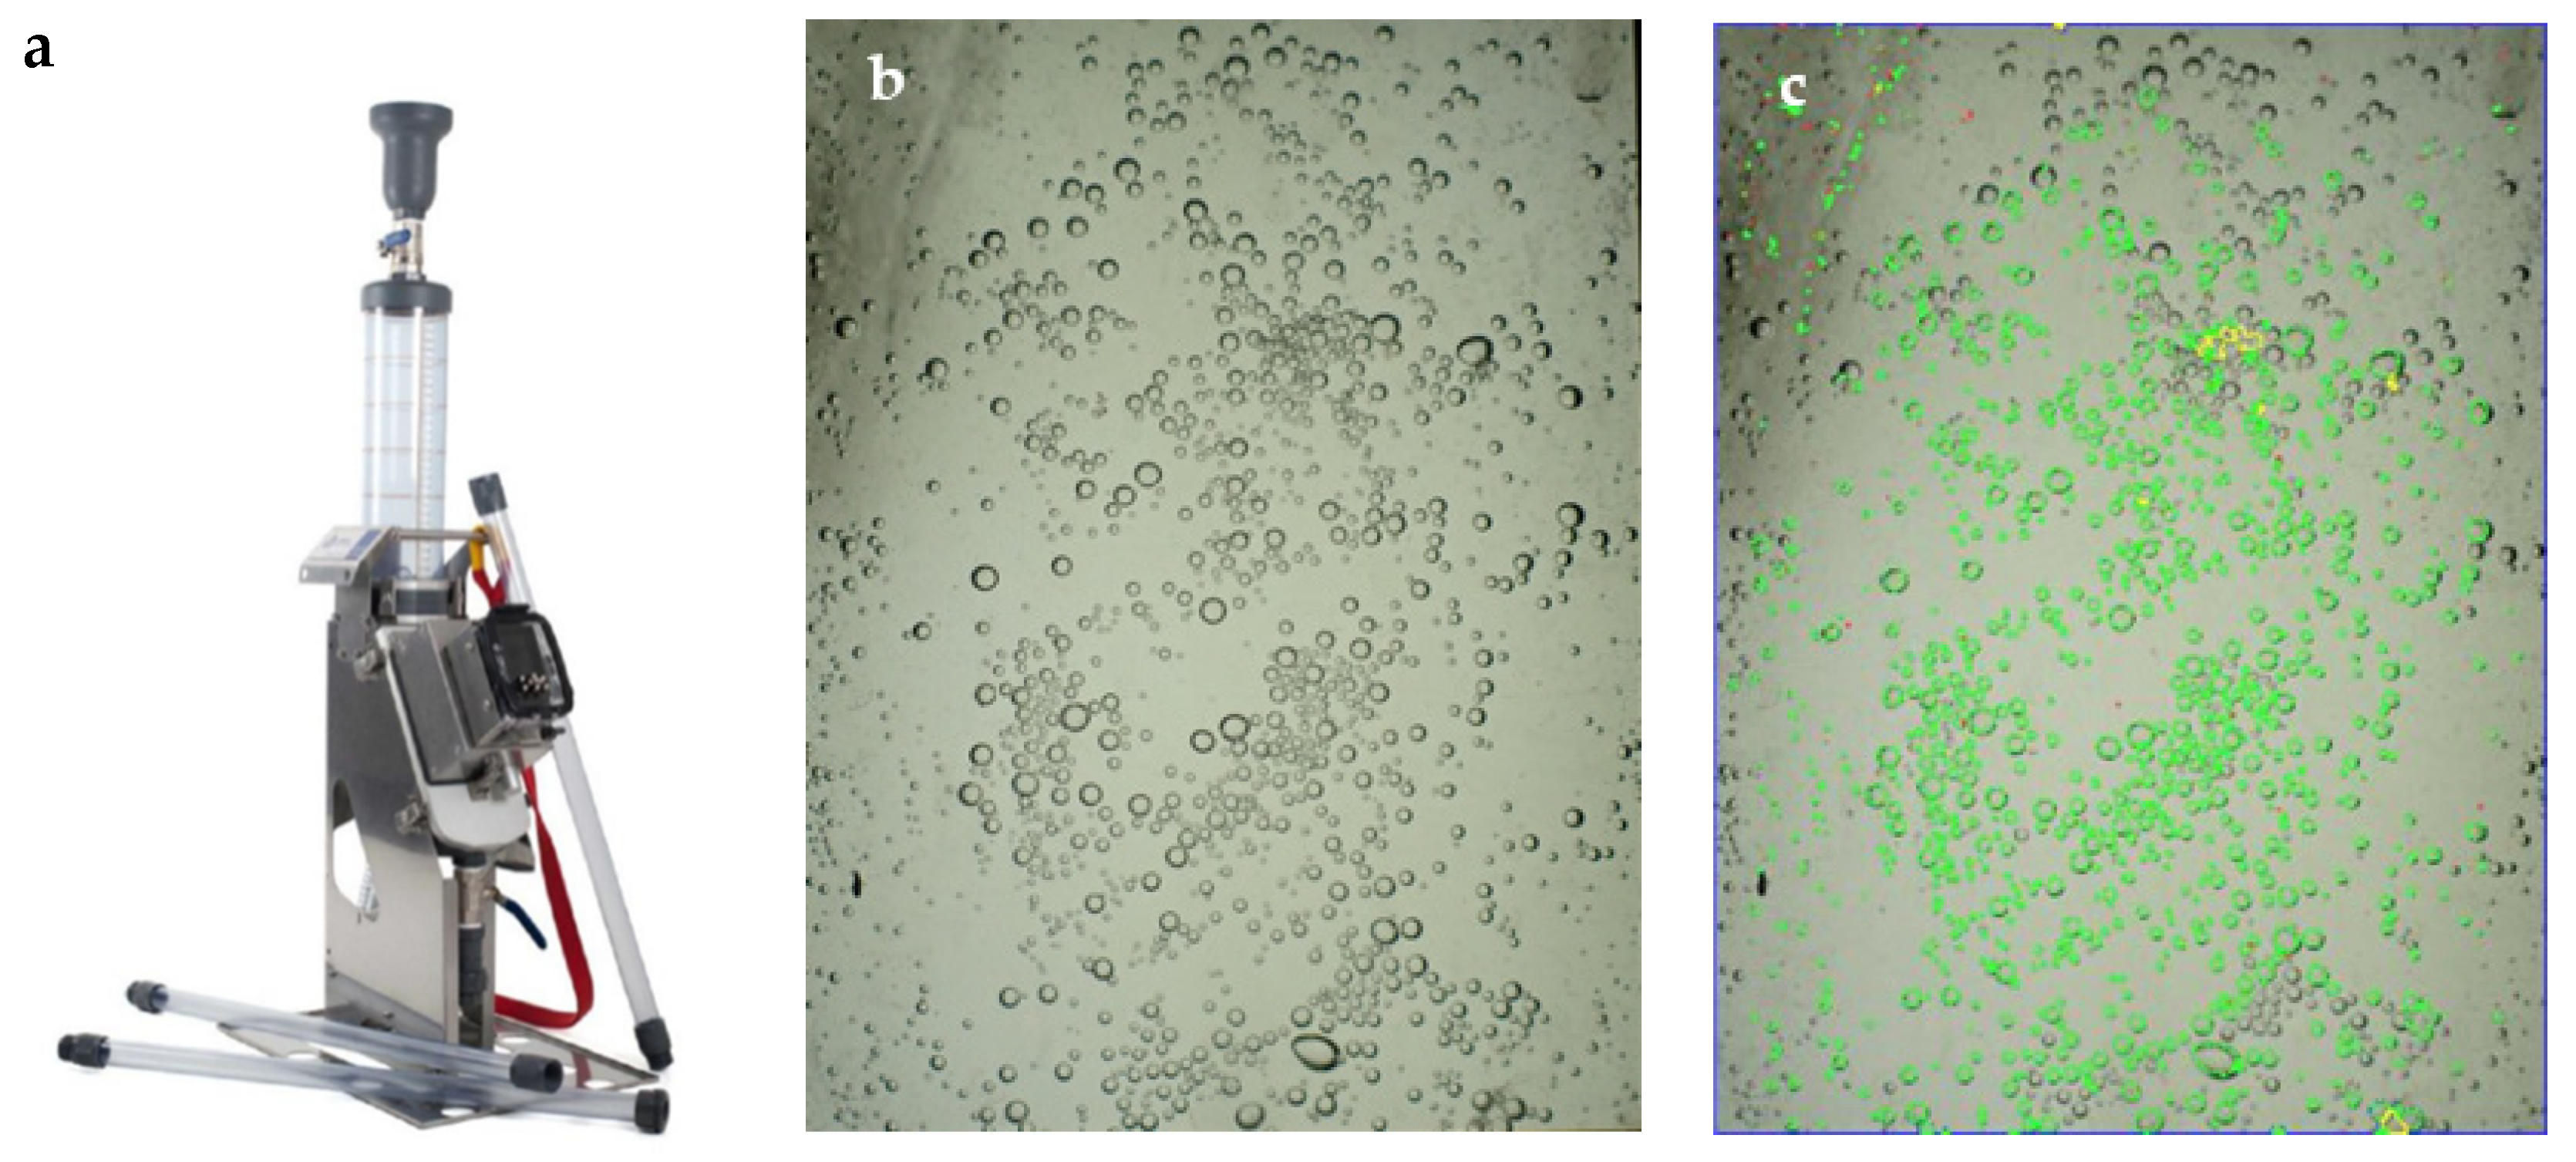
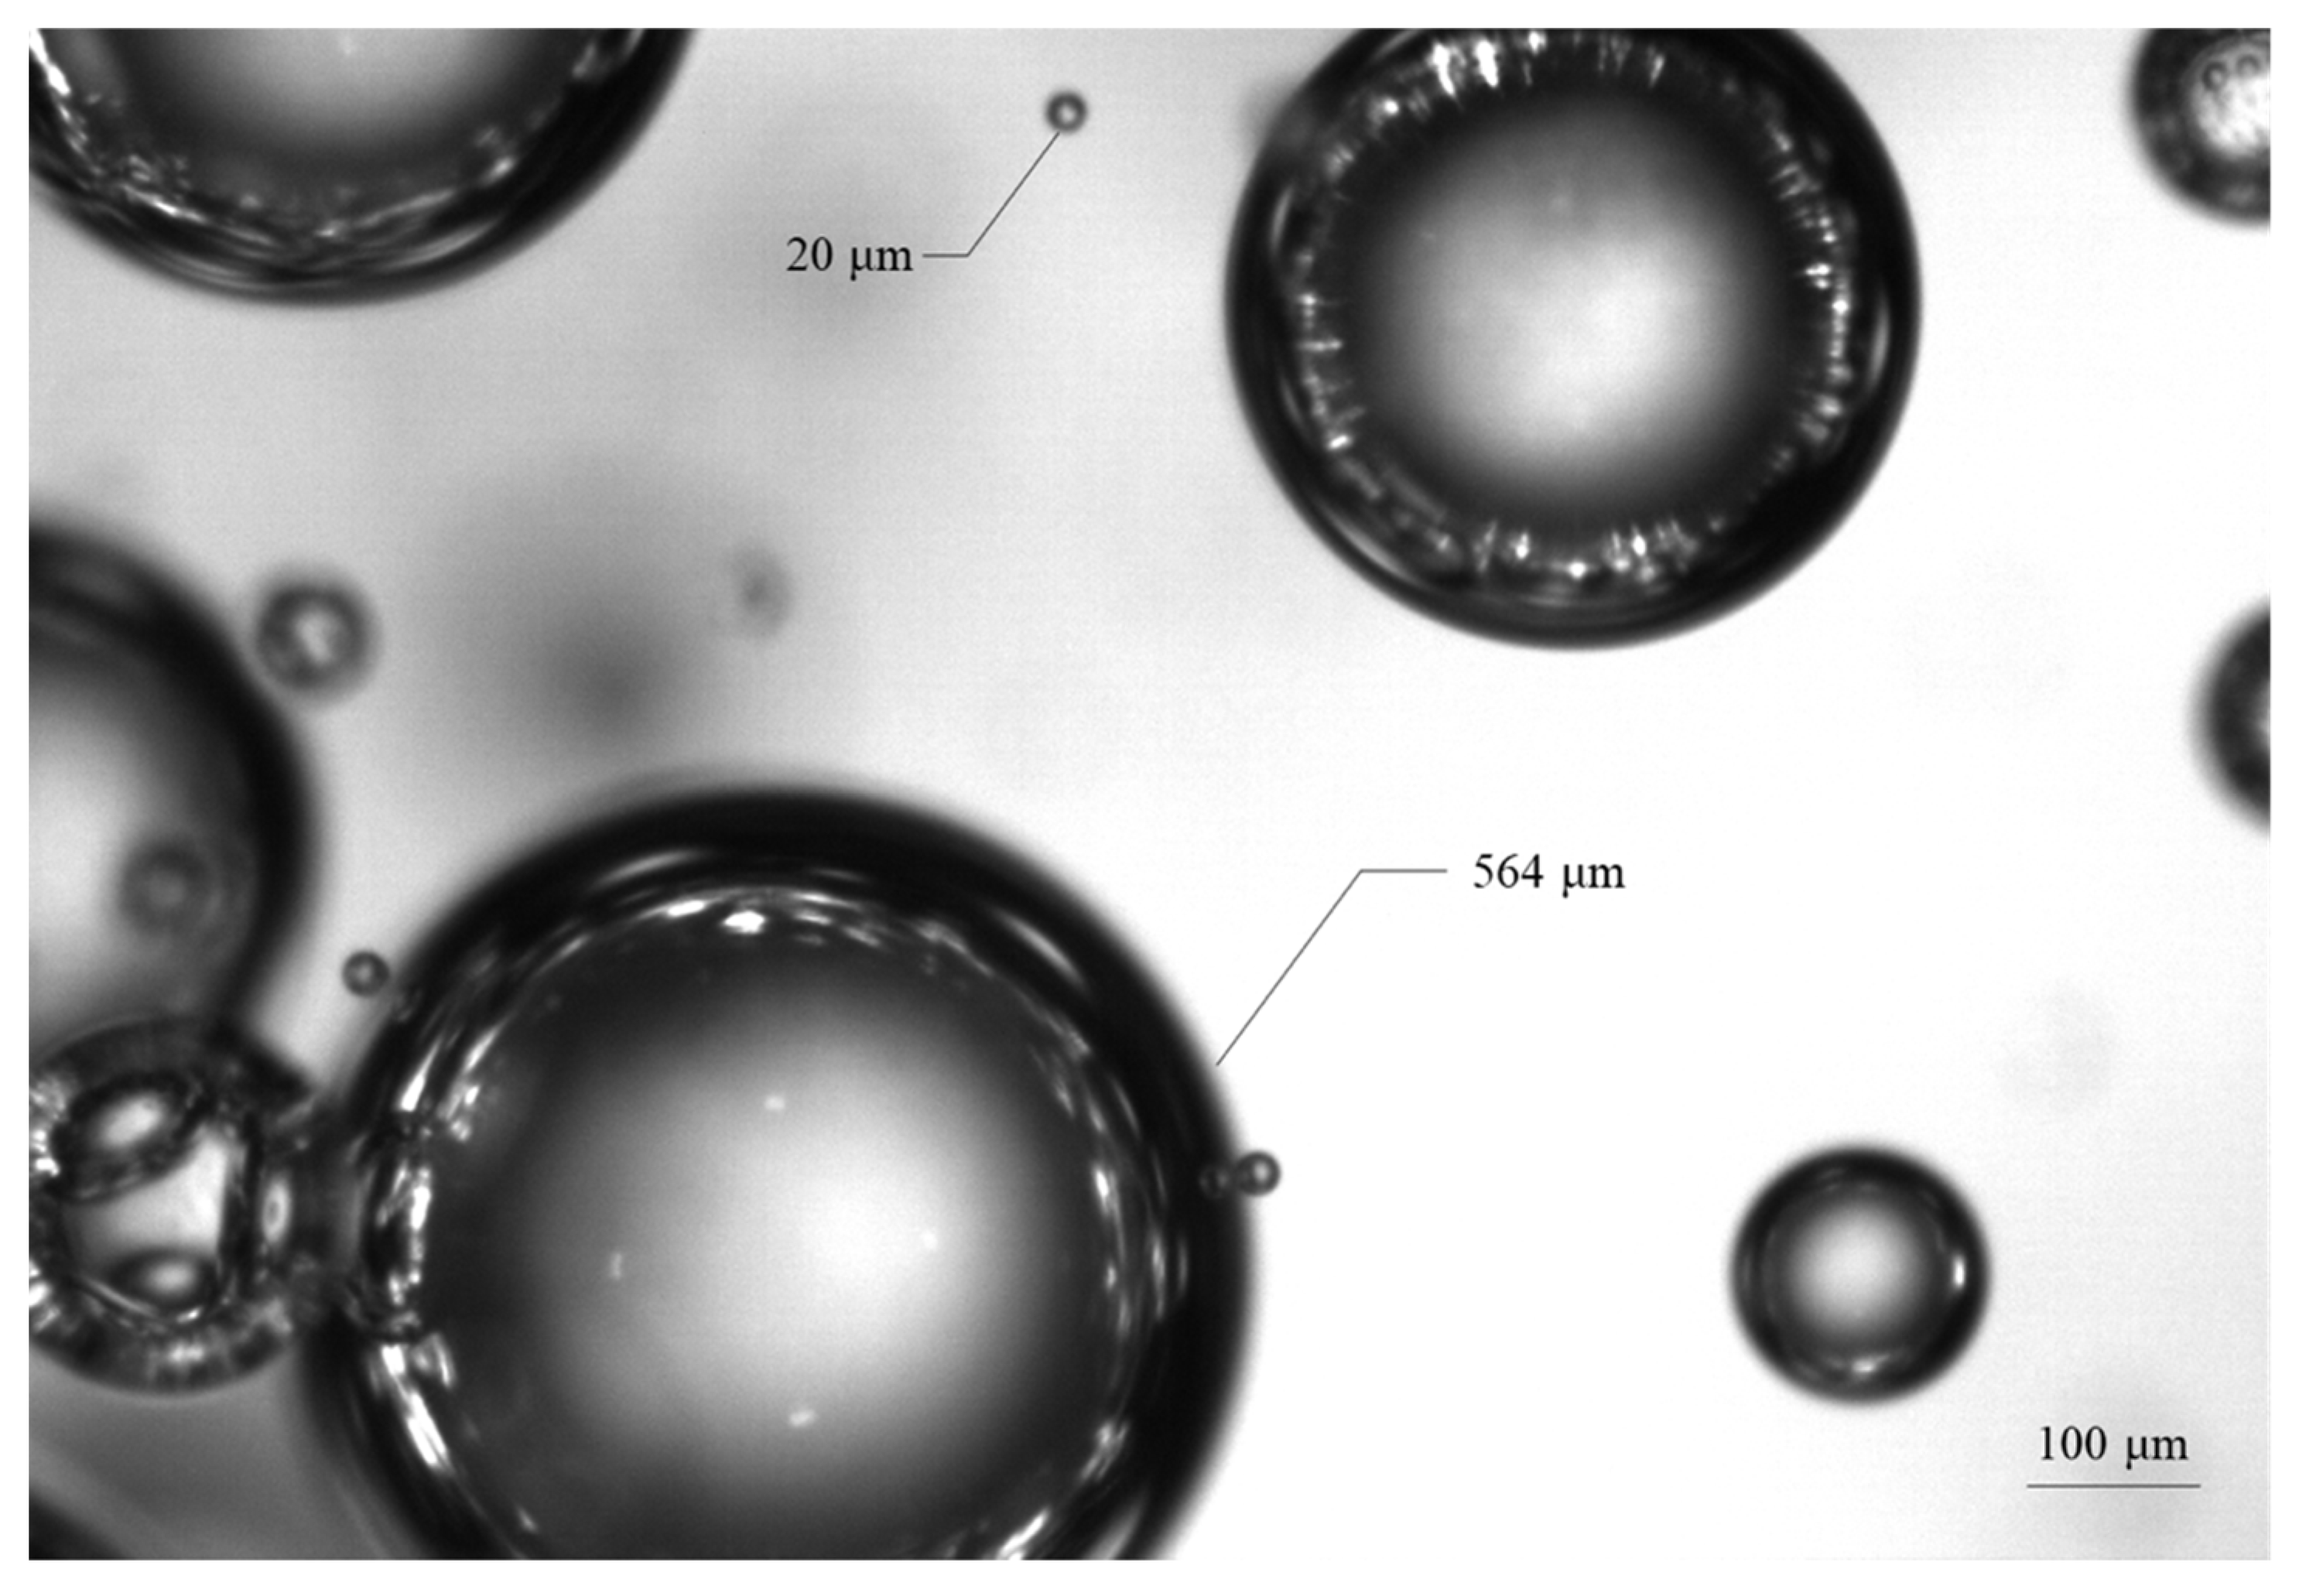
2.2.2. PVM Probe
2.2.3. Lab-Scale Experimental Set-Up
2.3. Data Analysis
3. Results
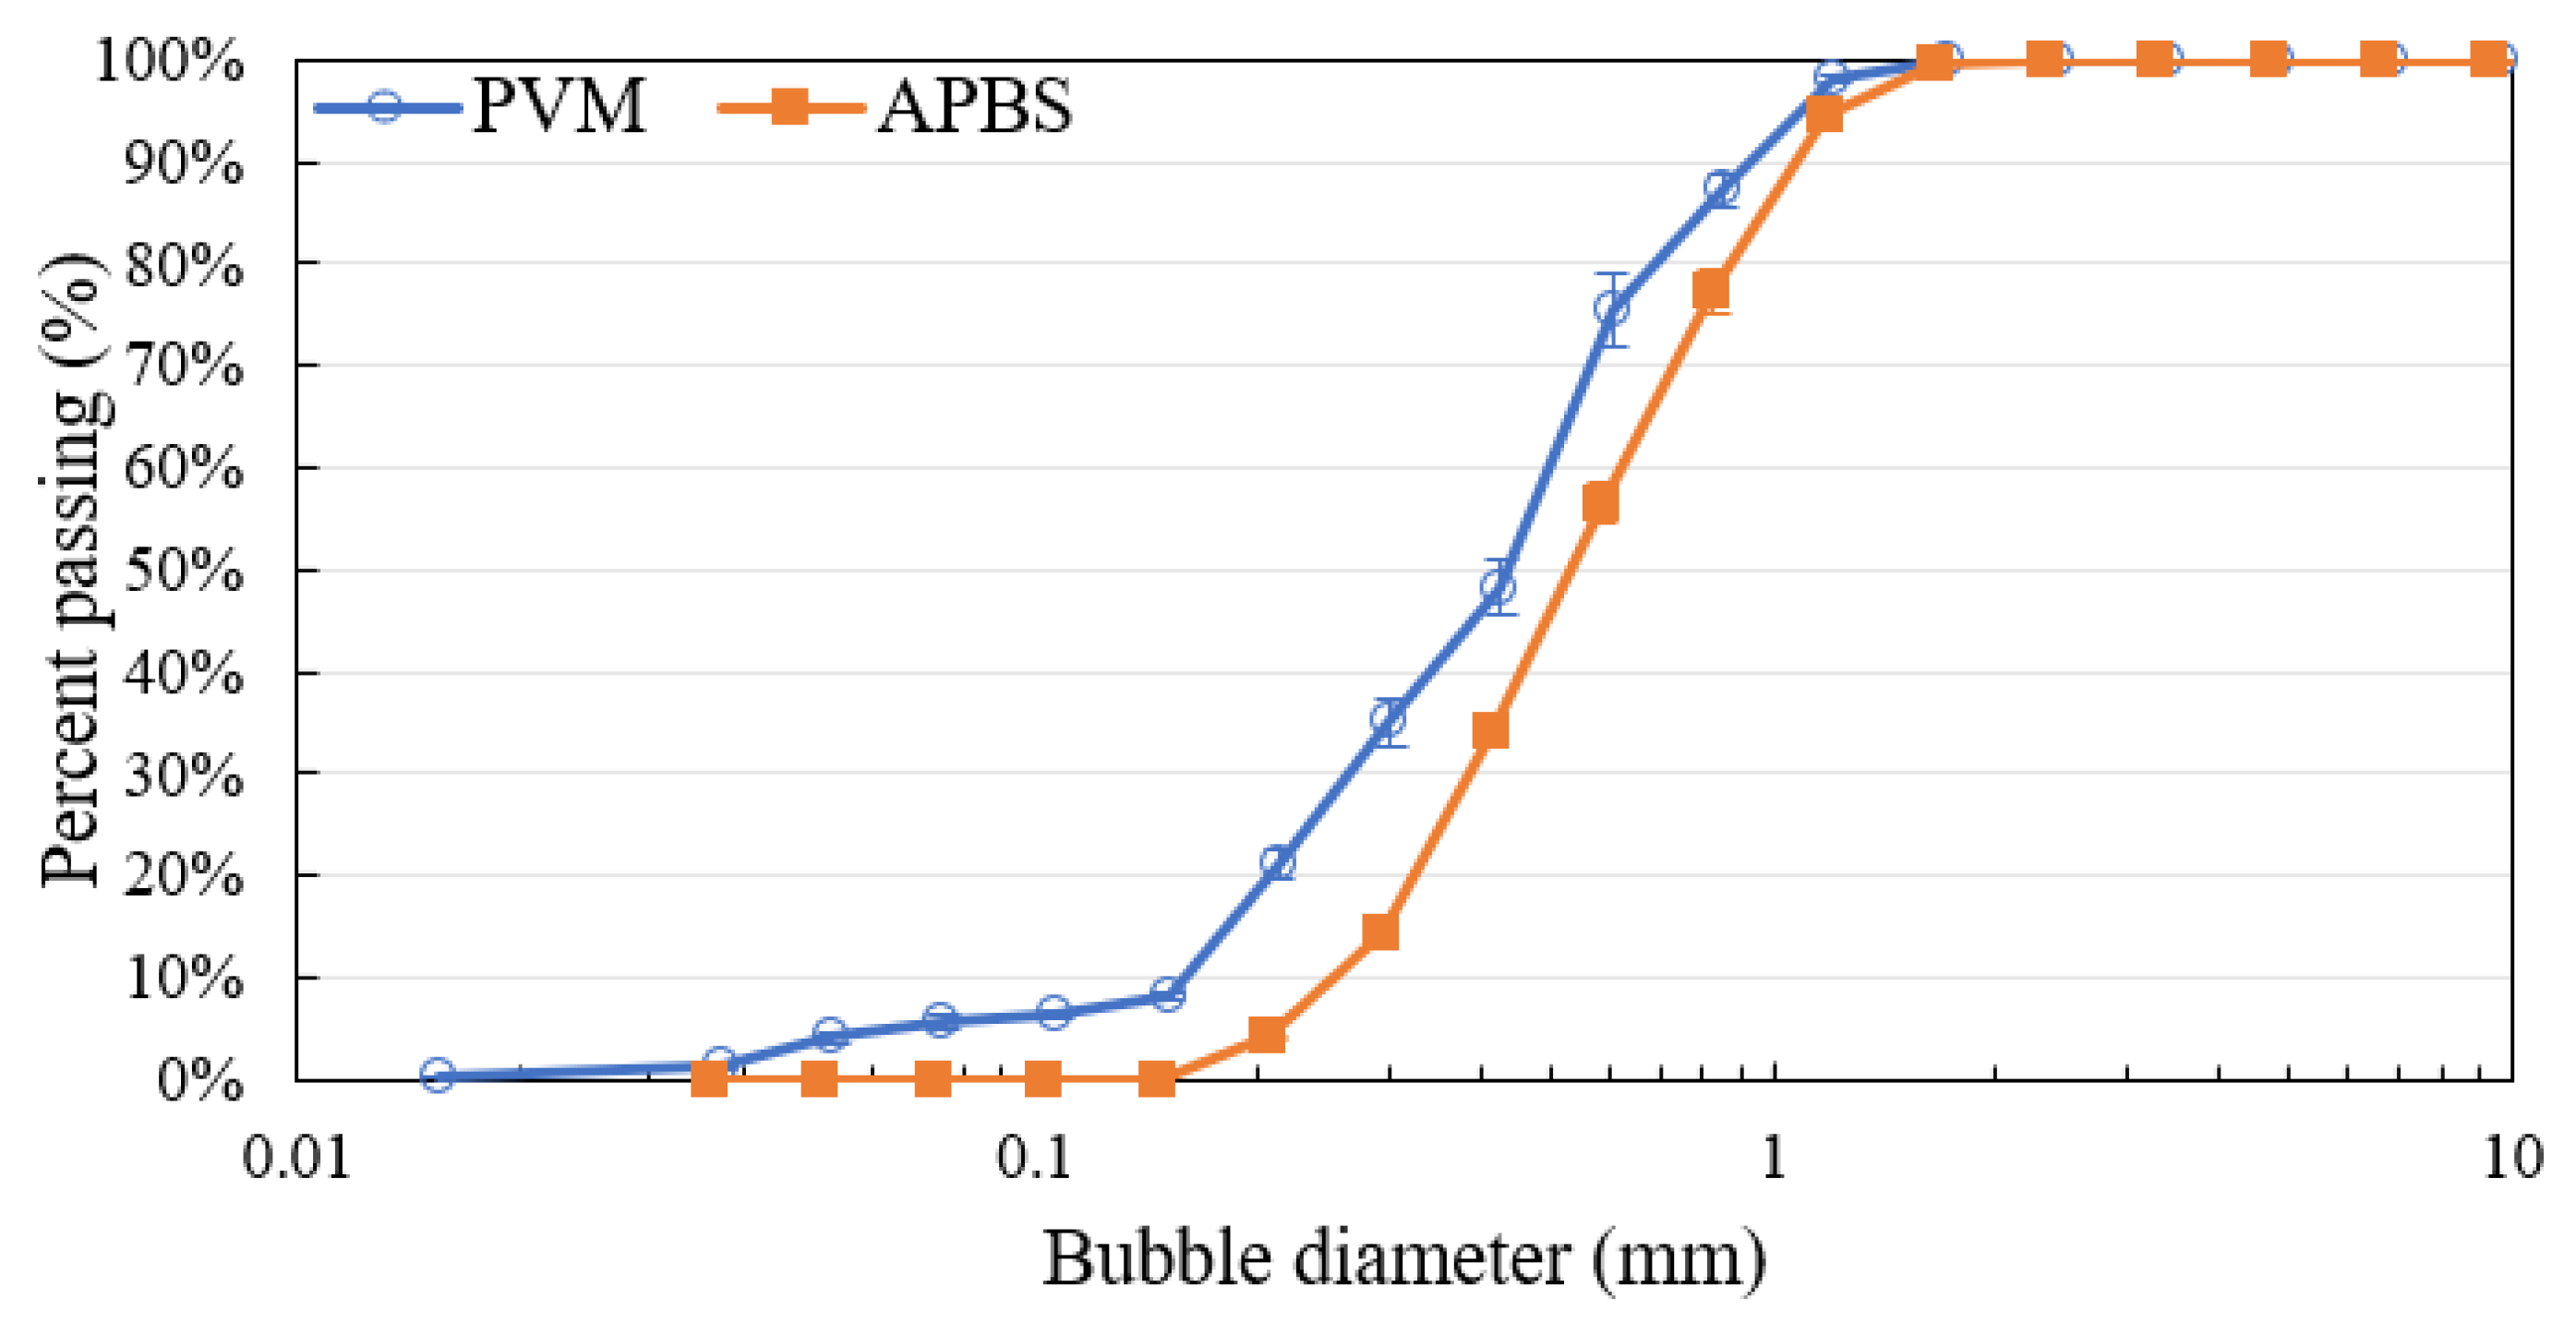
3.1. Comparison of Novel and Conventional Bubble Size Measurement Techniques
3.2. Use of PVM Probe for Two-Phase Frother Characterization
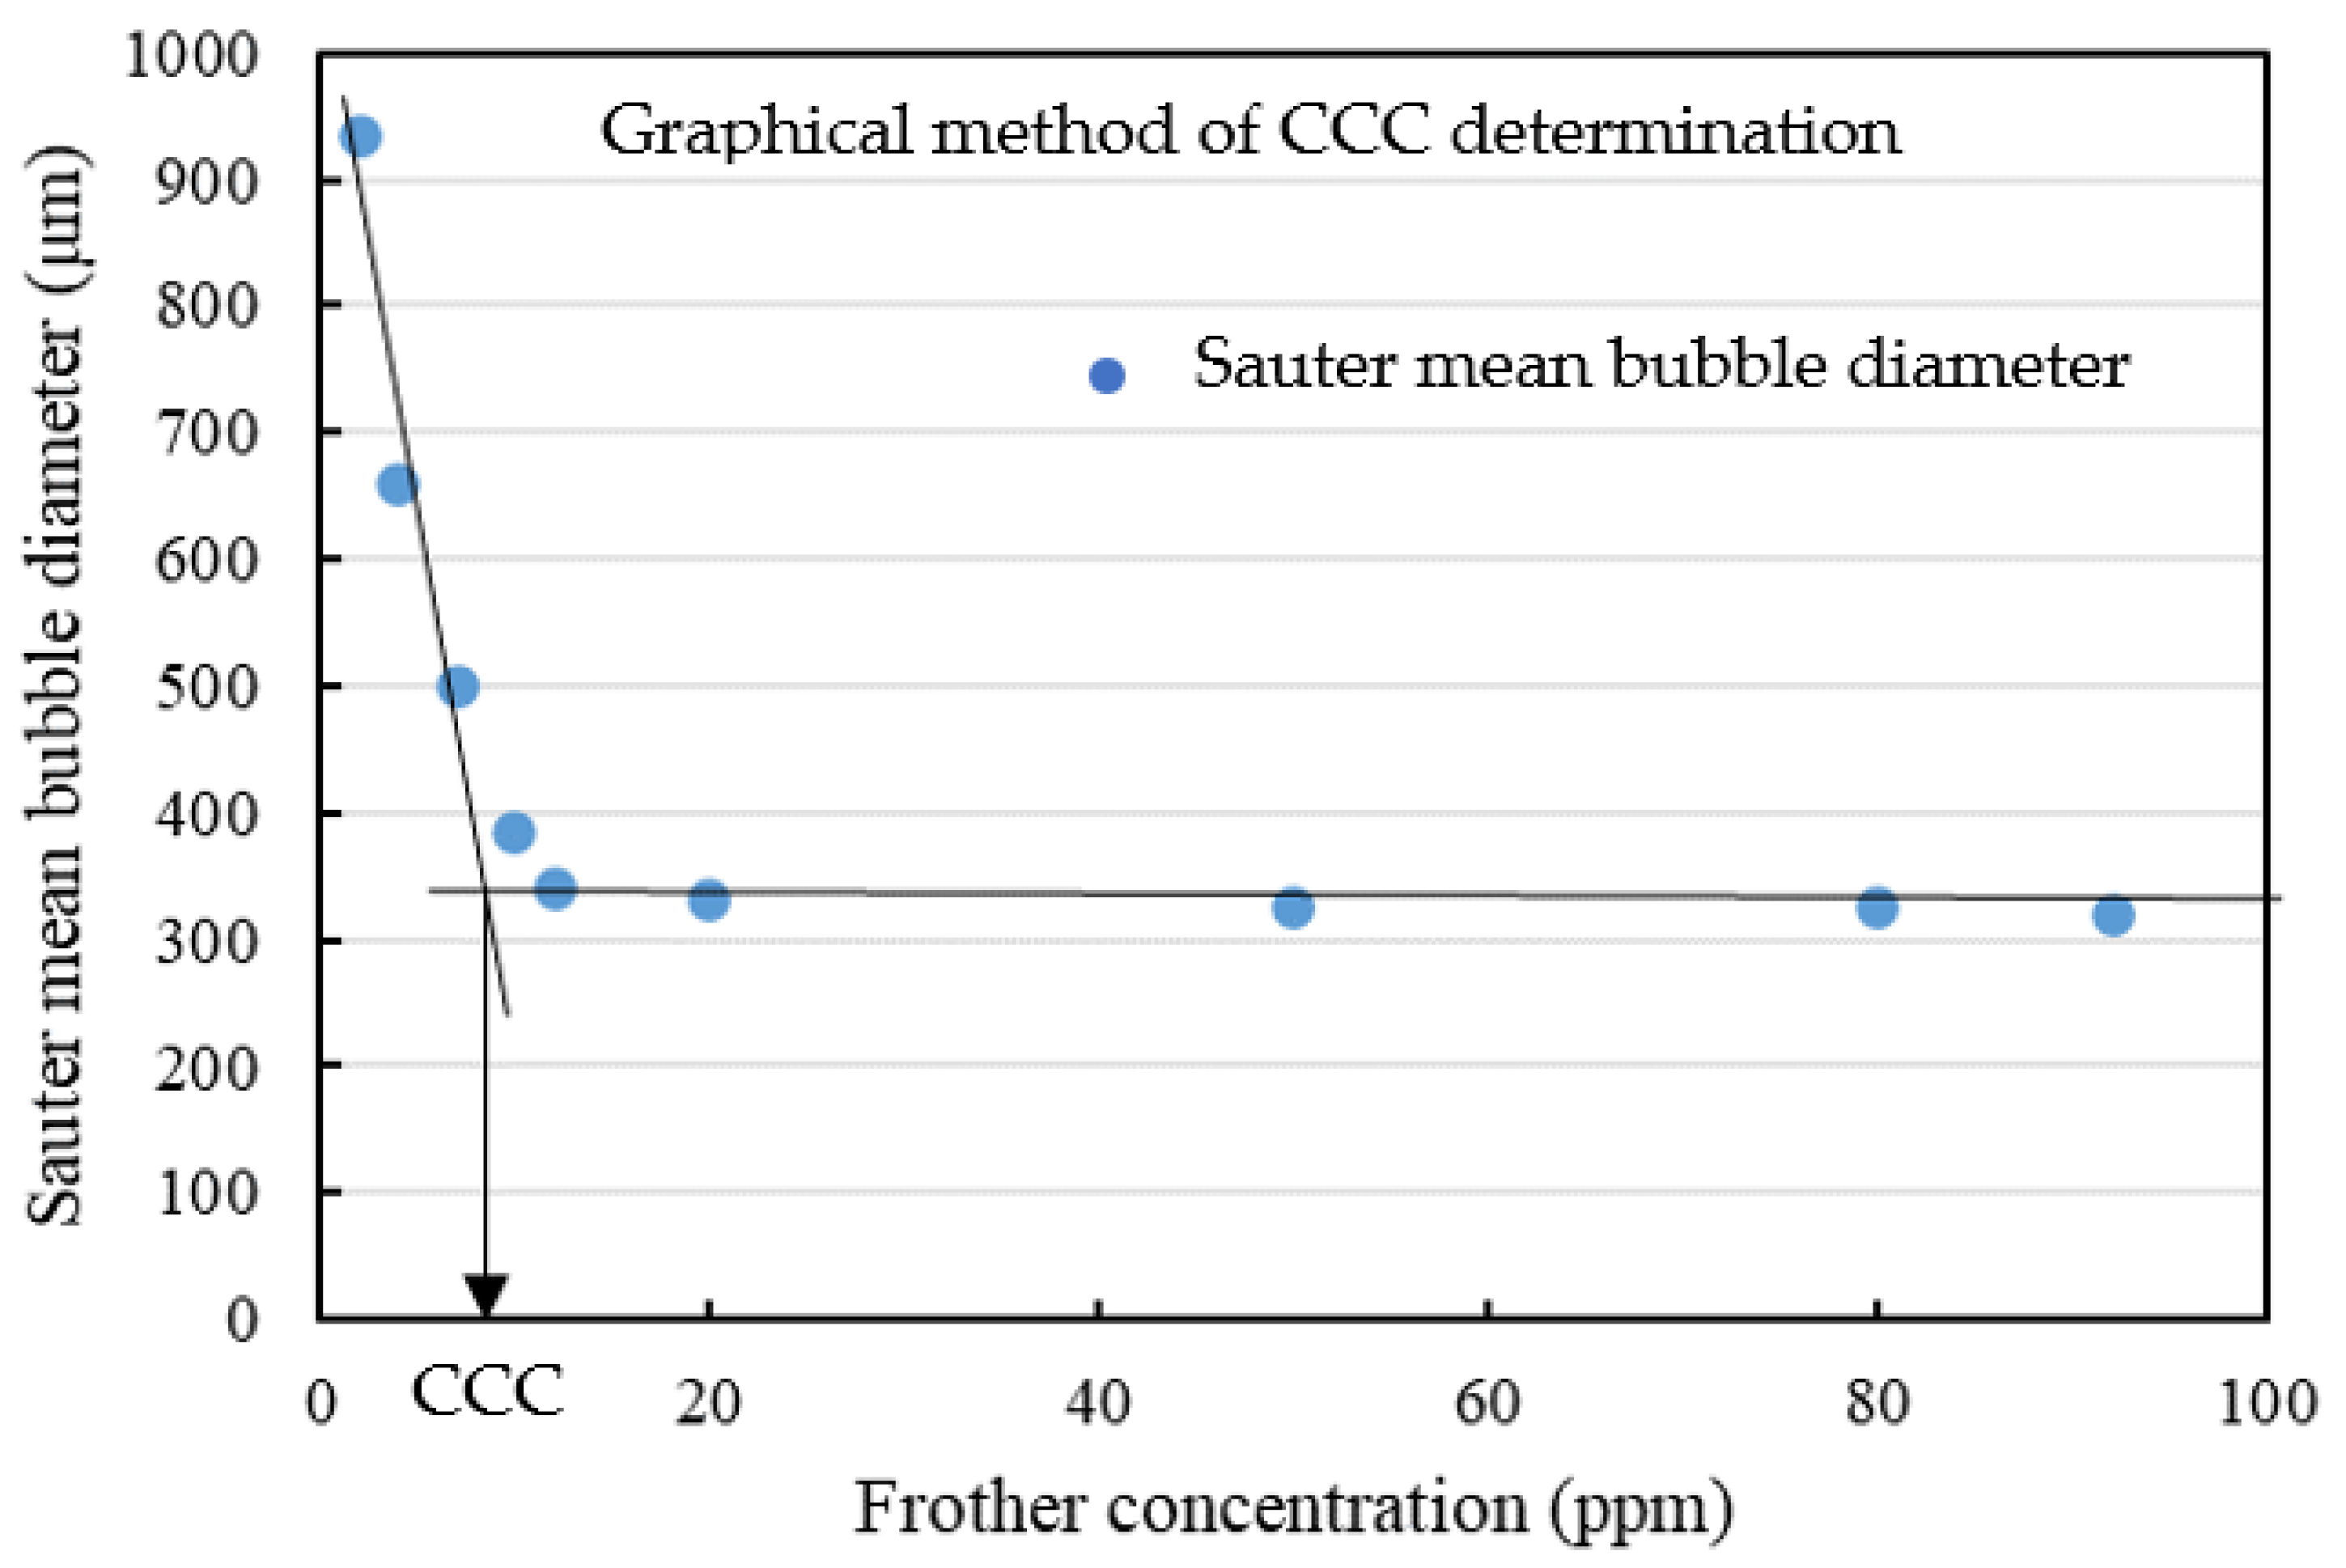
3.2.1. Example of CCC Determination
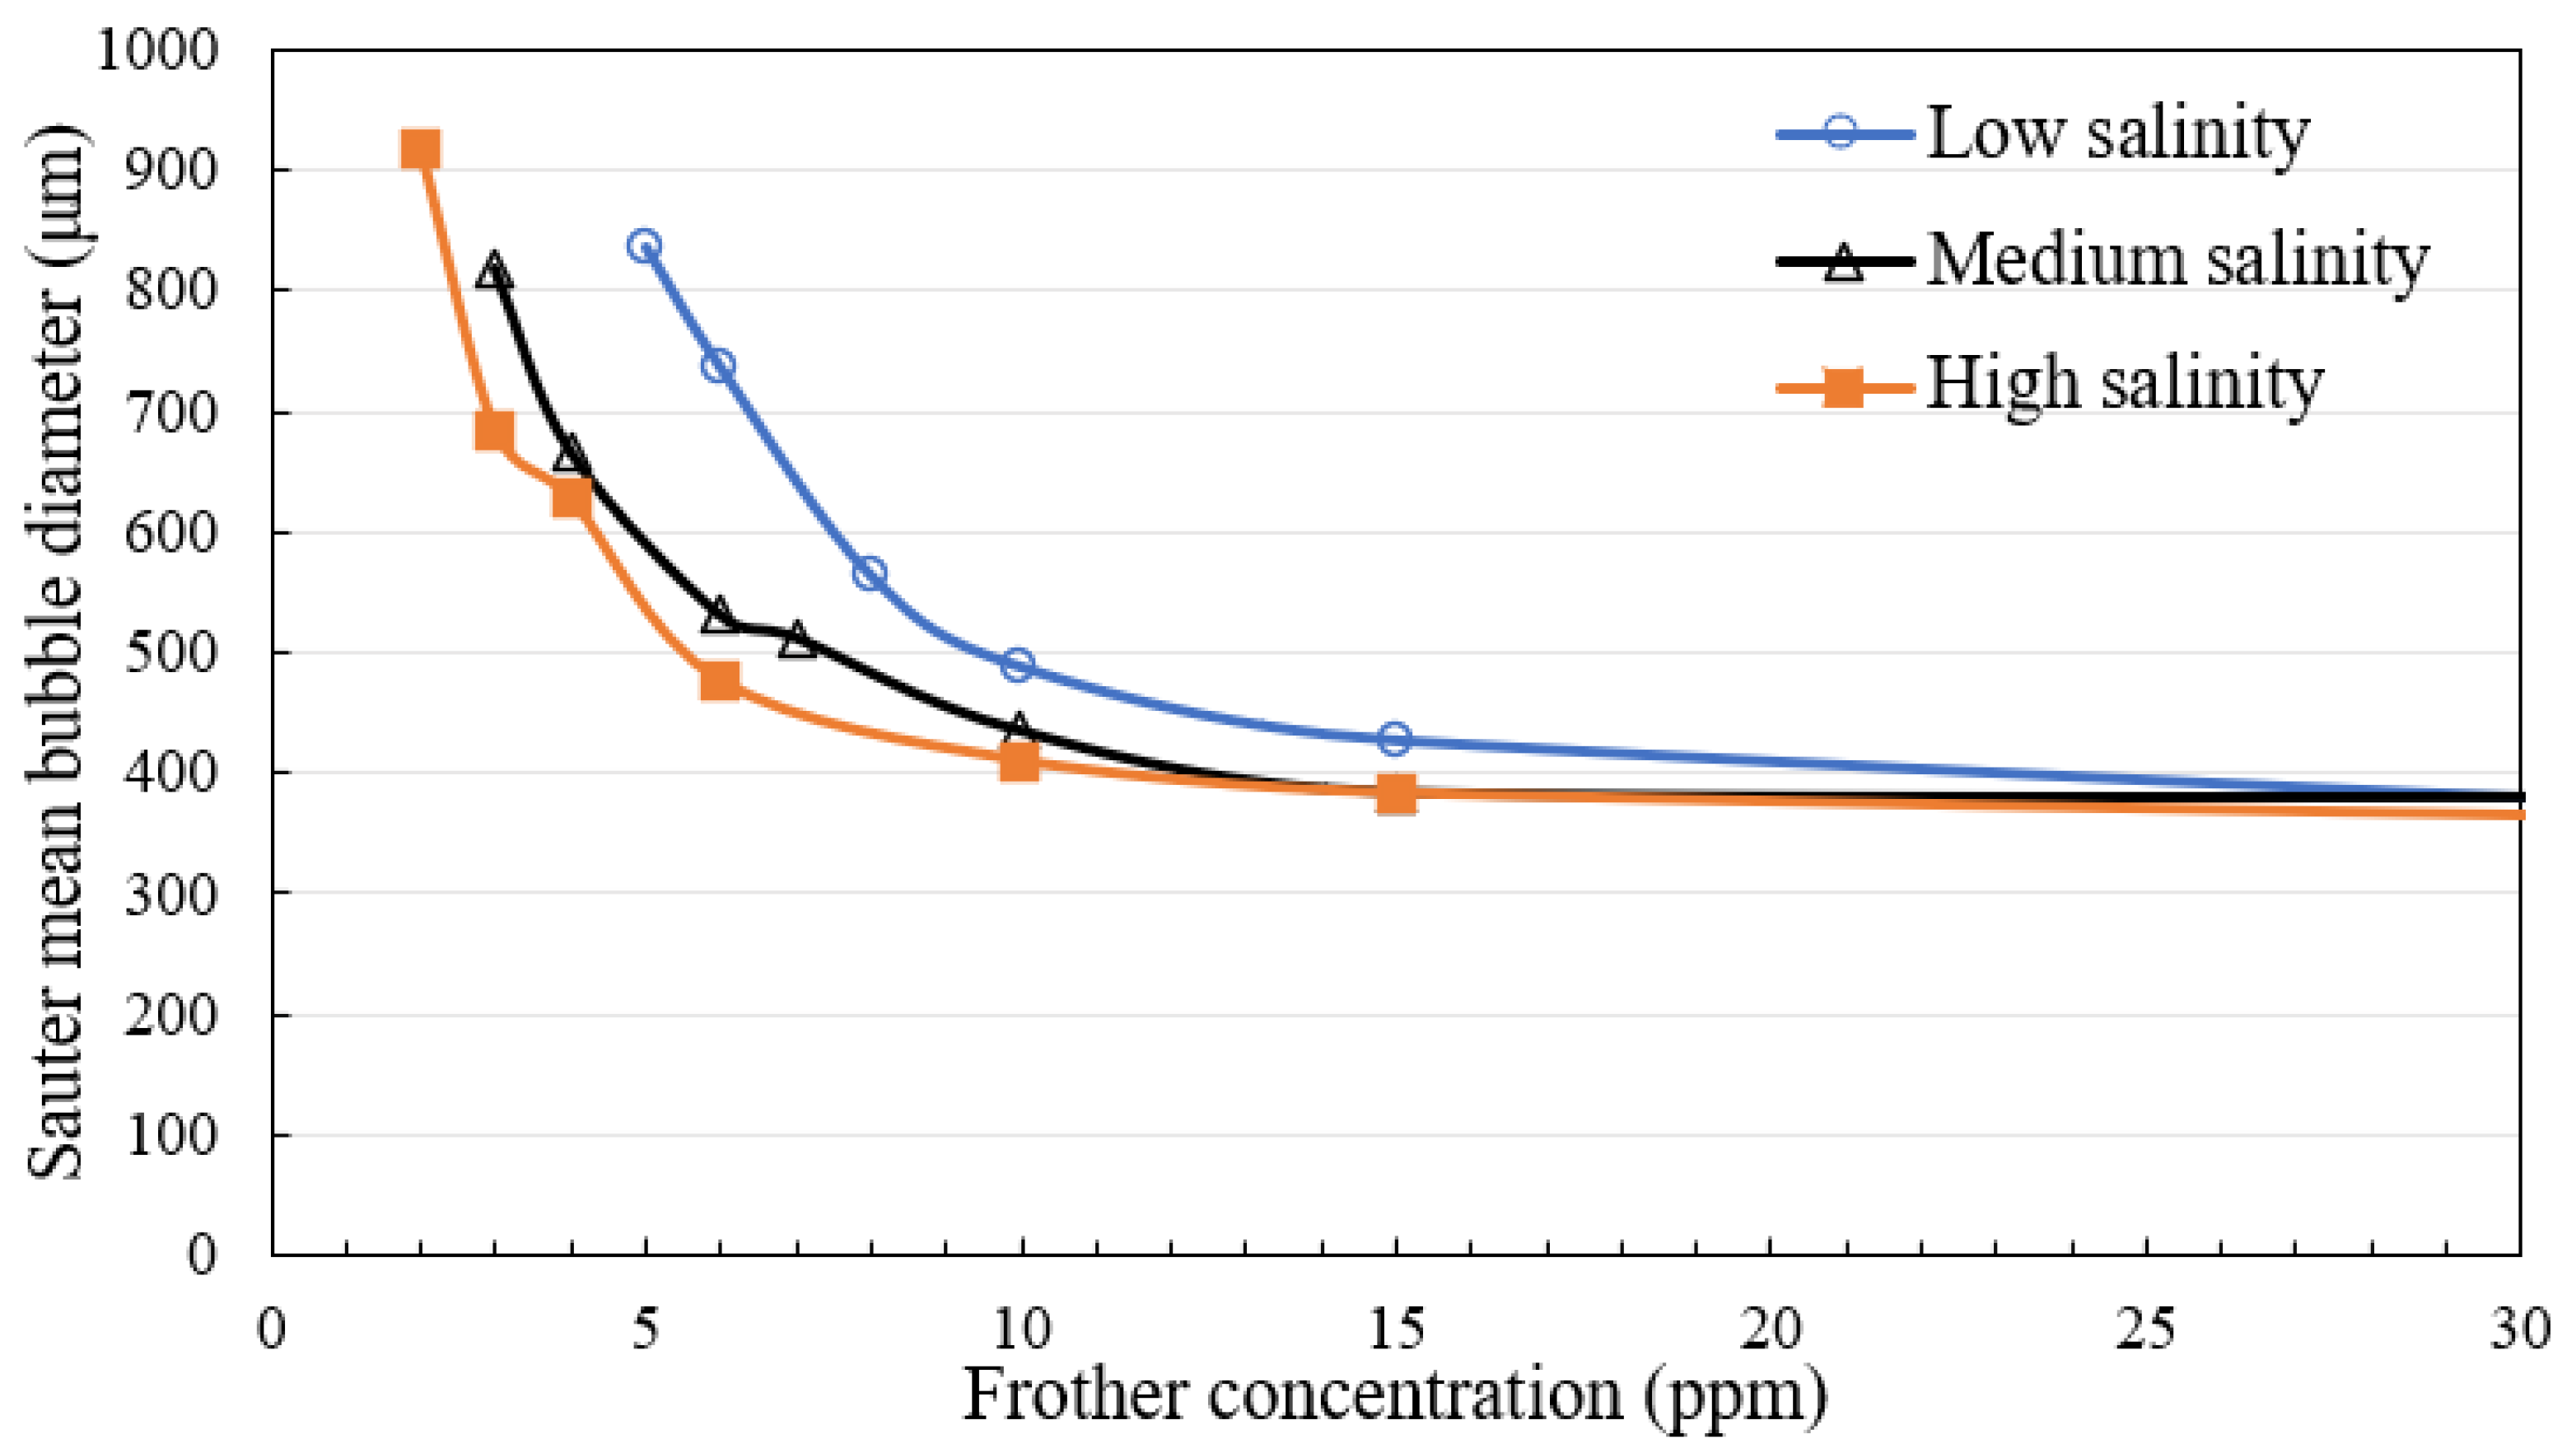
3.2.2. Effect of Water Salinity on Bubble Size-Reduction
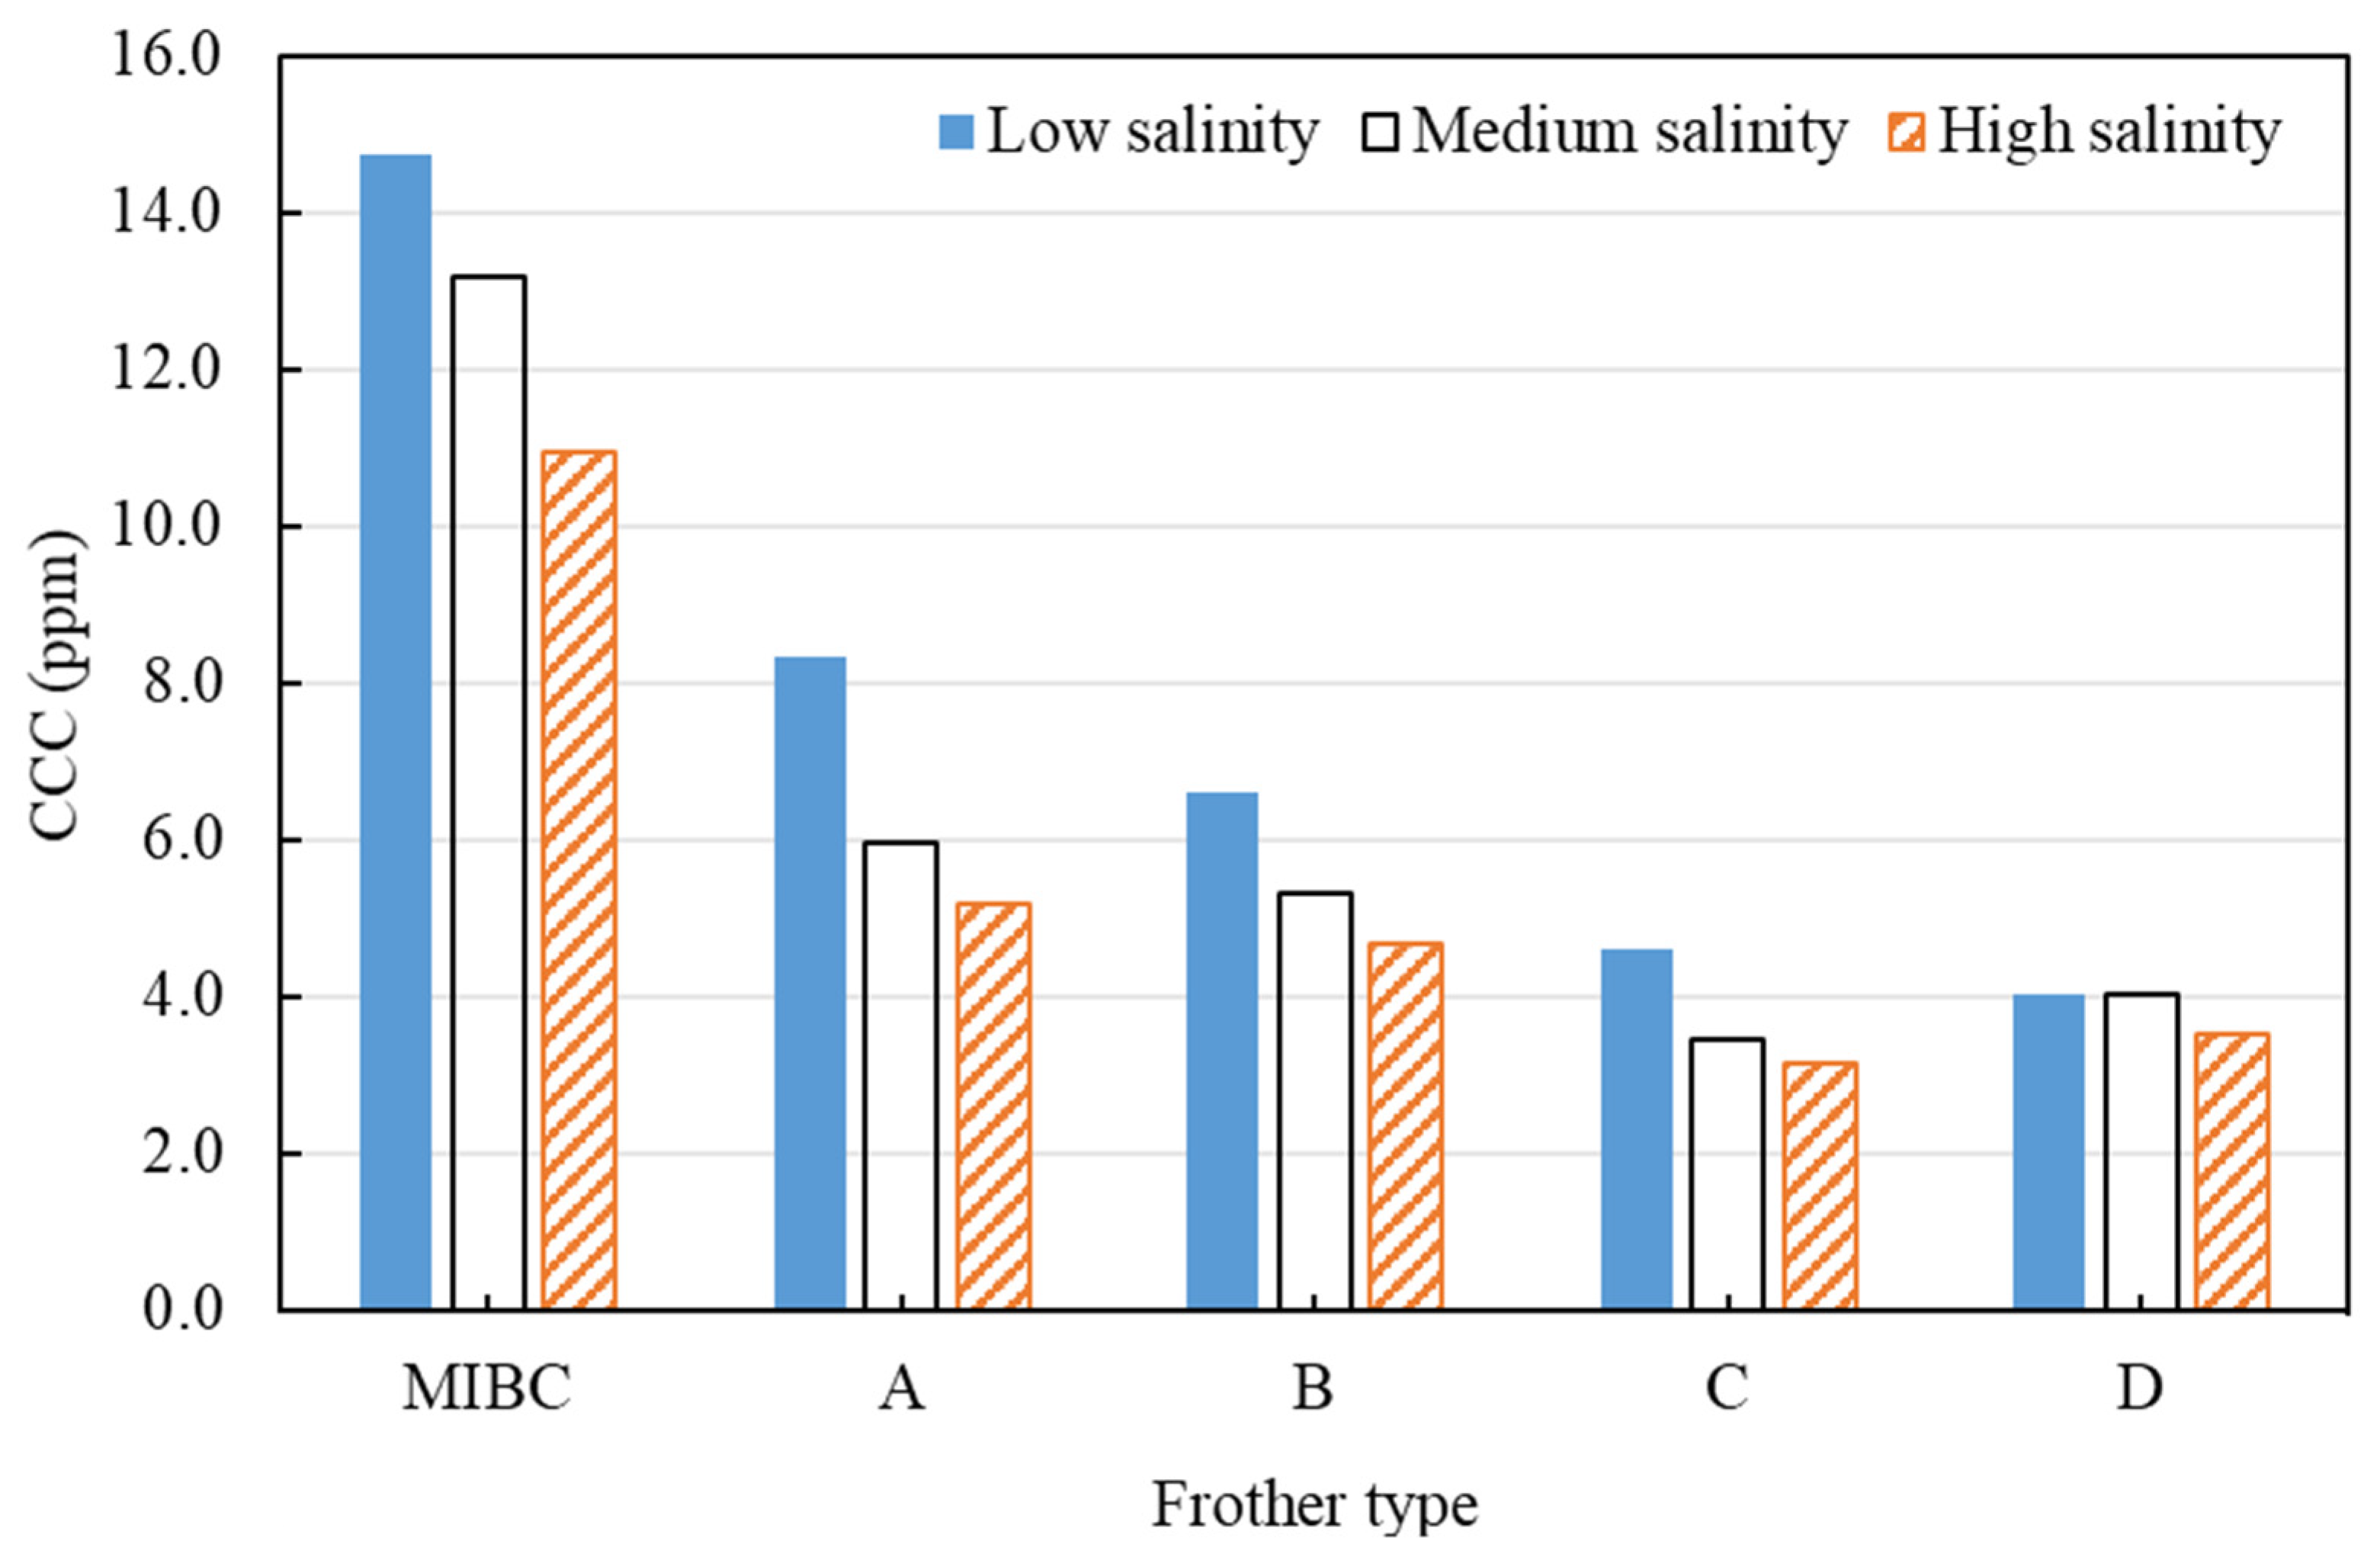
3.2.3. CCC Comparison
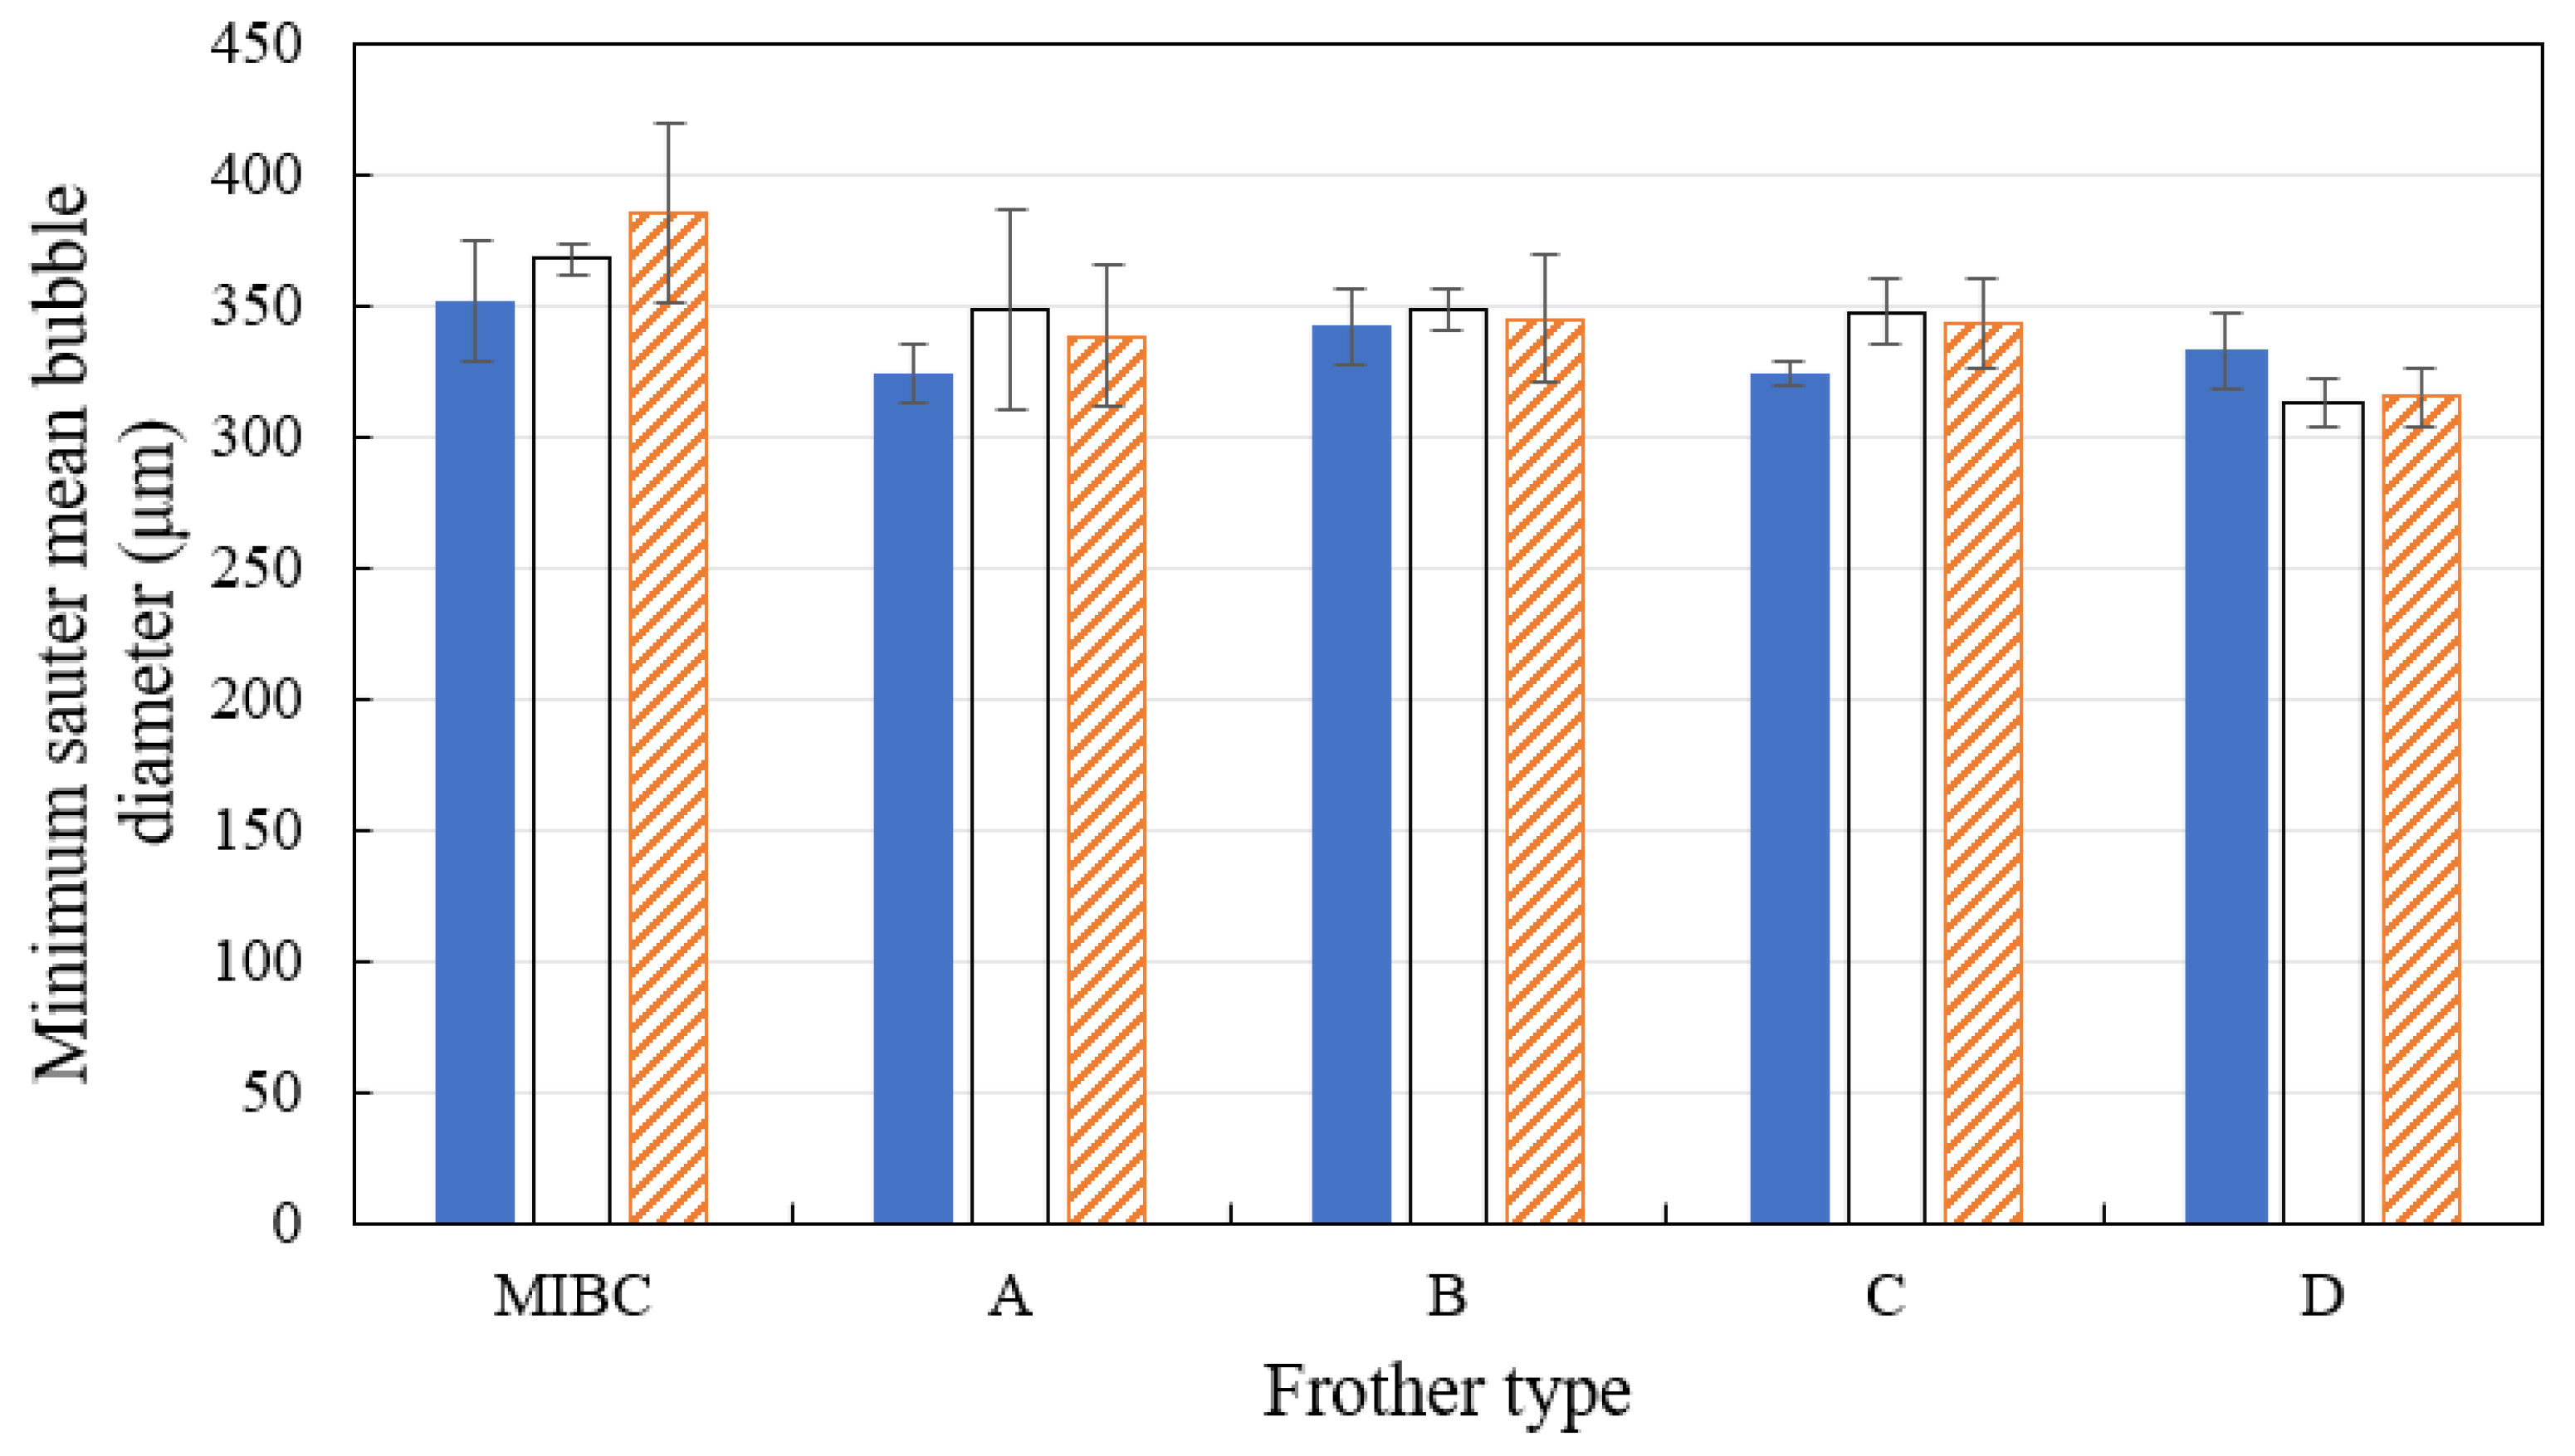
3.2.4. Minimum Sauter Mean Bubble Diameter at CCC
4. Conclusions
Author Contributions
Funding
Data Availability Statement
Acknowledgments
Conflicts of Interest
References
- Ahmed, N.; Jameson, G.J. The effect of bubble size on the rate of flotation of fine particles. Int. J. Miner. Processing 1985, 14, 195–215. [Google Scholar] [CrossRef]
- Rubinstein, J.B.; Samygin, V.D. Effect of Particle and Bubble Size on Flotation Kinetics. In Frothing in Flotation II; Laskowski, J.S., Woodburn, E.T.G., Eds.; Gordon and Breach: Amsterdam, The Netherlands, 1998; pp. 51–80. [Google Scholar]
- Yoon, R.H.; Luttrell, G.H. The Effect of Bubble Size on Fine Coal Flotation. Coal Prep. 1986, 2, 179–192. [Google Scholar] [CrossRef]
- Gorain, B.K.; Franzidis, J.P.; Manlapig, E.V. Studies on impeller type, impeller speed and air flow rate in an industrial scale flotation cell—Part 1: Effect on bubble size distribution. Miner. Eng. 1995, 8, 615–635. [Google Scholar] [CrossRef]
- Gorain, B.K.; Franzidis, J.P.; Manlapig, E.V. Bubble surface area flux: A new criterion to evaluate flotation cell performance. In Proceedings of the SAIMM Conference, Minerals and Materials’96, Cape Town, South Africa, 31 July–2 August 1996. [Google Scholar]
- Gorain, B.K.; Franzidis, J.P.; Manlapig, E.V. Studies on impeller type, impeller speed and air flow rate in an industrial scale flotation cell. Part 4: Effect of bubble surface area flux on flotation performance. Miner. Eng. 1997, 10, 367–379. [Google Scholar] [CrossRef]
- Chen, F.; Gomez, C.O.; Finch, J.A. Technical note bubble size measurement in flotation machines. Miner. Eng. 2001, 14, 427–432. [Google Scholar] [CrossRef]
- Tucker, J.; Deglon, D.; Franzidis, J.-P.; Harris, M.; O’Connor, C. An evaluation of a direct method of bubble size distribution measurement in a laboratory batch flotation cell. Miner. Eng. 1994, 7, 667–680. [Google Scholar] [CrossRef]
- Randall, E.W.; Goodall, C.M.; Fairlamb, P.M.; Dold, P.L.; O’Connor, C.T. A method for measuring the sizes of bubbles in two- and three-phase systems. J. Phys. E Sci. Instrum. 1989, 22, 827–833. [Google Scholar] [CrossRef]
- Fuerstenau, M.C.; Han, K.N. Fundamental principles of froth flotation. In SME Mining Engineering Handbook; Darling, P., Ed.; Society for Mining, Metallurgy, and Exploration, Inc.: Englewood, CO, USA, 2011; p. 1523. [Google Scholar]
- O’Connor, C.T.; Randall, E.W.; Goodall, C.M. Measurement of the effects of physical and chemical variables on bubble size. Int. J. Miner. Processing 1990, 28, 139–149. [Google Scholar] [CrossRef]
- Power, A.; Franzidis, J.P.; Manlapig, E. The characterisation of hydrodynamic conditions in industrial flotation cells. In Proceedings of the Seventh Annual Mill Operators Conference, Kalgoorlie, Australia, 12–14 October 2000. [Google Scholar]
- Cho, Y.S.; Laskowski, J.S. Effect of flotation frothers on bubble size and foam stability. Int. J. Miner. Processing 2002, 64, 69–80. [Google Scholar] [CrossRef] [Green Version]
- Cho, Y.S.; Laskowski, J.S. Bubble coalescence and its effect on dynamic foam stability. Can. J. Chem. Eng. 2002, 80, 299–305. [Google Scholar] [CrossRef]
- Quinn, J.J.; Kracht, W.; Gomez, C.; Gagnon, C.; Finch, J. Comparing the effect of salts and frother (MIBC) on gas dispersion and froth properties. Miner. Eng. 2007, 20, 1296–1302. [Google Scholar] [CrossRef]
- Castro, S.; Miranda, C.; Toledo, P.; Laskowski, J. Effect of frothers on bubble coalescence and foaming in electrolyte solutions and seawater. Int. J. Miner. Processing 2013, 124, 8–14. [Google Scholar] [CrossRef]
- Kerbyson, D.J.; Atherton, T.J. Circle detection using Hough transform filters. In Proceedings of the Fifth International Conference on Image Processing and its Applications, Edinburgh, UK, 4–6 July 1995; pp. 370–374. [Google Scholar]
- Yuen, H.; Princen, J.; Illingworth, J.; Kittler, J. A comparative study of Hough transform methods for circle finding. Image Vis. Comput. 1990, 8, 71–77. [Google Scholar] [CrossRef] [Green Version]
- Riquelme, A.; Bouchard, J.; Desbiens, A.; del Villar, R. Bubble detection in flotation columns based on circular Hough transform. In Proceedings of the 23rd World Mining Congress, Montreal, QC, Canada, 11–15 August 2013. [Google Scholar]
- Leiva, J.; Vinnett, L.; Contreras, F.; Yianatos, J. Estimation of the actual bubble surface area flux in flotation. Miner. Eng. 2010, 23, 888–894. [Google Scholar] [CrossRef]
- Mesa, D.; Morrison, A.J.; Brito-Parada, P.R. The effect of impeller-stator design on bubble size: Implications for froth stability and flotation performance. Miner. Eng. 2020, 157, 106533. [Google Scholar] [CrossRef]
- Grau, R.A.; Laskowski, J.S.; Heiskanen, K. Effect of frothers on bubble size. Int. J. Miner. Processing 2005, 76, 225–233. [Google Scholar] [CrossRef]
- Vinnett, L.; Yianatos, J.; Arismendi, L.; Waters, K. Assessment of two automated image processing methods to estimate bubble size in industrial flotation machines. Miner. Eng. 2020, 159, 106636. [Google Scholar] [CrossRef]


| Frother Nomenclature | Composition/Ingredients |
|---|---|
| A | Not disclosed |
| MIBC | Methyl isobutyl carbinol |
| B | Oxygenated hydrocarbons |
| C | Blend of hydrocarbons and glycol |
| D | Blend of hydrocarbons |
| Salts | Concentration (mg/L) | ||
|---|---|---|---|
| Low | Medium | High | |
| CaCl2∙2H2O | 114 | 220 | 477 |
| MgCl2 | 67 | 204 | 389 |
| KCl | 12 | 21 | 74 |
| NaCl | 2481 | 4194 | 5555 |
| Comparison | PVM | APBS |
|---|---|---|
| Application field | Micro-field (a few μm–1.3 mm) | mm-cm-field (200 μm–a few cm) |
| Size | 0.55 m–height 0.076 m–diameter | 2.00 m–height ~0.300 m–diameter |
| Weight | <1 kg | ~10 kg |
| Lab installation | Easy | Difficult |
| Picture taken point | In situ | 1 m above sampling point |
| Time requirements per test | ~30 min | ~20 min |
| D32 (mm) | PVM | APBS |
|---|---|---|
| Test 1 | 0.954 | 1.058 |
| Test 2 | 0.945 | 1.125 |
| Test 3 | 0.988 | 1.142 |
| Average | 0.962 | 1.109 |
| 95% CI | 0.026 | 0.050 |
| Comparison | PVM | APBS |
|---|---|---|
| Number of analyzed images | 2450 | 90 |
| Number of detected bubbles | 2894 | 83,683 |
| Test time (min) | 3 | 30 |
| Image analysis time (min) | 90 | 6 |
| Data post-processing time (min) | 0 | 30 |
Publisher’s Note: MDPI stays neutral with regard to jurisdictional claims in published maps and institutional affiliations. |
© 2022 by the authors. Licensee MDPI, Basel, Switzerland. This article is an open access article distributed under the terms and conditions of the Creative Commons Attribution (CC BY) license (https://creativecommons.org/licenses/by/4.0/).
Share and Cite
Wang, J.; Forbes, G.; Forbes, E. Frother Characterization Using a Novel Bubble Size Measurement Technique. Appl. Sci. 2022, 12, 750. https://doi.org/10.3390/app12020750
Wang J, Forbes G, Forbes E. Frother Characterization Using a Novel Bubble Size Measurement Technique. Applied Sciences. 2022; 12(2):750. https://doi.org/10.3390/app12020750
Chicago/Turabian StyleWang, Junyu, Gordon Forbes, and Elizaveta Forbes. 2022. "Frother Characterization Using a Novel Bubble Size Measurement Technique" Applied Sciences 12, no. 2: 750. https://doi.org/10.3390/app12020750
APA StyleWang, J., Forbes, G., & Forbes, E. (2022). Frother Characterization Using a Novel Bubble Size Measurement Technique. Applied Sciences, 12(2), 750. https://doi.org/10.3390/app12020750