Article

Application of Infrared Thermography in an Adequate Reusability Analysis of Photovoltaic Modules Affected by Hail

Department of Power Engineering, Faculty of Electrical Engineering, Computer Science and Information Technology, Josip Juraj Strossmayer University of Osijek, Kneza Trpimira 2b, 31000 Osijek, Croatia
*
Authors to whom correspondence should be addressed.
Appl. Sci. 2022, 12(2), 745; https://doi.org/10.3390/app12020745
Submission received: 19 December 2021 / Revised: 7 January 2022 / Accepted: 10 January 2022 / Published: 12 January 2022

Abstract

:

Featured Application

Revitalization of PV power plants affected by natural disasters.

Abstract

Infrared thermography, in the analysis of photovoltaic (PV) power plants, is a mature technical discipline. In the event of a hailstorm that leaves the PV system without the support of the power grid (and a significant portion of the generation potential), thermography is the easiest way to determine the condition of the modules and revive the existing system with the available resources. This paper presents research conducted on a 30 kW part of a 420 kW PV power plant, and demonstrates the procedure for inspecting visually correct modules that have suffered from a major natural disaster. The severity of the disaster is shown by the fact that only 14% of the PV modules at the test site remained intact. Following the recommendations of the standard IEC TS 62446-3, a thermographic analysis was performed. The thermographic analysis was preceded by an analysis of the I-V curve, which was presented in detail using two characteristic modules as examples. I-V curve measurements are necessary to relate the measured values of the radiation and the measured contact temperature of the module to the thermal patterns. The analysis concluded that soiled modules must be cleaned, regardless of the degree of soiling. The test results clearly indicated defective module elements that would result in a safety violation if reused. The research shows that the validity criterion defined on the basis of the analysis of the reference module can be supplemented, but can also be replaced by a statistical analysis of several modules. The comparison between the thermographic analysis and the visual inspection clearly confirmed thermography as a complementary method for testing PV-s.

1. Introduction

Thanks to the EU’s energy policy, PV plants in the EU are already paving the way to meet the requirements of nearly zero energy buildings (NZEB) under Article 9, Directive 2010/31/EU of the European Parliament and of the Council of 19 May 2010 on the energy performance of buildings, Directive 2012/27/EU on energy efficiency, and Directive (EU) 2018/2001 of the European Parliament and of the Council of 11 December 2018 on the promotion of the use of energy from renewable sources.
PV systems are usually insured under a building’s insurance policy. The occasion for the investigation conducted in this paper was a severe storm, followed by hail, that hit Požega and its surroundings at 4:20 pm on 25 June 2021. The disaster caused damage to houses, cars, and power poles, mainly in the town of Požega and the settlement of Treštanovci. Part of the town of Požega and its surrounding settlements were without electricity [1]. The severity of the disaster is shown by the fact that the walls of the local prison collapsed, trees were left without leaves, and buildings were left without roofs [2]. According to a report by the Croatian Meteorological and Hydrological Service [3], the storm lasted 40 min, with hail up to 5 cm in size, and reached speeds of up to 145 km/h. The height of the ice cover was up to 8 cm [4]. The total damage was estimated at 25 million euros [5].
The Faculty of Electrical Engineering, Computer Science and Information Technology Osijek (FERIT), as a higher education institution in the field of power engineering, has been in Požega for many years and is a place where research is conducted in the field of power engineering, as well as in the field of photovoltaics [6,7]. Within the activities of the Laboratory of Renewable Energy Sources [8], the faculty has been engaged in the analysis of PV power plants, taking into account the various aspects of the impact of this disaster. One of the tasks set is also the objective of this work; to evaluate the applicability of infrared thermography in the possibility of using remaining visually undamaged modules in the revitalization of power plants, with the ultimate goal of stabilizing the power supply at micro-sites. The site chosen for presentation in this paper was the production company in Požega.
The European Photovoltaic Solar Energy Conference and Exhibition (EU PVSEC) represents a significant knowledge base in the field of photovoltaics. One of the early contributions, which provides an overview of the topic of photovoltaic module degradation for different types of photovoltaic module failures [9], is the comprehensive knowledge of the analyzed topic. Standard IEC TS 62446-3: 2017, which refers to thermographic testing, provides comprehensive instructions for performing the test [10], but not the temperature values for classifying the anomaly class (CoA). According to the literature [11], the initial expected values of the temperature difference are in the range of 10 °C. The use of criteria commonly used in infrared thermography for an energy audit of electrical installations, as described in [12], is not suitable for PV analysis and the criteria must be determined for each specific application. The expected temperature range in which PV modules are tested is given by IEC 61215 [13], and the maximum temperature limit is given by IEC TS 63126 [14]. The expected range of operating temperatures in practice can be found in [15,16,17]. The influence of external parameters, such as solar irradiance, wind, and ambient temperature, on PV panels can be found in [18]. Perhaps, the most challenging aspect of thermographic testing is the selection of imaging parameters, which are described in [19,20]. The Photovoltaic Power Systems Program of the International Energy Agency (IEA-PVPS) provides the most comprehensive analysis of the field of photovoltaics to date through its publications, and the guidelines from two reports have been used for the purposes of this study [15,21]. Thorough research on the reliability of PV modules can be found in the National Renewable Energy Laboratory (NREL) reports [22,23], especially on visualizations of possible damage to modules that have been in long-term operation.
The contribution of the paper is manifested in defining the class of abnormalities for the analyzed modules, and determining that thermography is a complementary method to existing standard test methods. No matter how time consuming, it can lead to the observation of damage in the making or pre-existing damage that cannot be detected using fast conventional methods.
The paper is divided into four sections. The first introductory section provides information about the event that led to the study, a review of the current literature, key findings of the paper, and the structure of the study. The second section, which describes the materials and methods, is divided into two subsections, the first of which contains the methodology, and the second subsection contains a description of the test site and an evaluation of the electrical performance of the PV modules. The third section, Results and Discussion, contains a presentation of the pilot project on infrared thermographic PV analysis and the measurements performed in the subsections: thermographic validity criterion, I-V curve measurements of the investigated modules, influence of soiling on the infrared thermographic pattern, and infrared thermographic analysis of undamaged modules.

2. Materials and Methods

2.1. Methodology

Preparations for the tests needed to be carried out with logistical care due to the 99 km distance between the laboratory and the test site. The tests conducted could not interfere with the reconstruction of buildings and production processes of companies that suffered losses due to the disaster. Therefore, a pilot project to test PV modules was conducted prior to on-site deployment. The purpose of the pilot project was to pre-investigate the procedure for determining the correctness criteria, by conducting analyses of the PV modules on racks at an angle corresponding to the site characteristics. The aim of the pilot project was to identify the challenges in performing thermographic analyses. The main objective was to determine the applicability of the available thermal imaging cameras, their acceptance in relation to the regulations in force, and the definition of the equipment required to perform the measurements. A flow chart of the test procedures is shown in Figure 1.
The test began by collecting the undamaged panels, cleaning them with a broom and water, and visually inspecting them for visible damage. After initial inspection of the panel, the I-V curve was analyzed. The process of determining the electrical properties was quickly accomplished with the appropriate test equipment. Infrared thermography analysis requires a considerable amount of time, namely 10–15 min, which is what it takes for a panel to reach thermal equilibrium. This was followed by an analysis of the parameters of the thermal pattern in search of the hotspots, which deviate significantly from the standards and the defined class of anomalies of the reference panel. In each of the individual steps, a decision was made regarding the technical correctness and safety of using the module. In this paper, each step is described in detail, focusing on thermography and the determination of the class of abnormality (CoA) criteria.

2.2. Description of the Test Site and PV Module Electrical Performance Evaluation

The test site represented a 30 kW part of a 420 kW PV plant, commissioned in November 2020, which was damaged by the hailstorm on 25 June 2021. The studied test site consisted of 94 PV monocrystalline silicon 340 Wp modules (30.08 kWp) and a 30 kW three-phase grid-tie inverter. The hailstorm visibly (totally) destroyed 81 out of 94 PV modules in the PV array, leaving 13 PV modules with no visible damage on PV module’s glass cover. The damaged PV modules are being replaced with new 340 Wp PV modules. Figure 2 shows the damage to the PV array caused by the hailstorm, while Figure 3 shows a close-up of a part of the PV array test site. The damage shown in the figures can also be shown using numerical indicators that define the failure share of the total system part [9].
The layout of the 30 kW PV plant with its PV module configuration on the DC side is given in Figure 4. The technical characteristics of the original 340 Wp PV modules and the new 345 Wp PV modules are provided in Table 1.

3. Results and Discussion

3.1. Pilot Project of Infrared Thermographic PV Analysis

According to IEC TS 62446-3 Photovoltaic (PV) systems—Requirements for testing, documentation and maintenance—Part 3: Photovoltaic modules and plants—outdoor infrared thermography use with an IR camera with a resolution of ≥320 × 240 pixels and a separate photo camera are recommended [10]. It is recommended to use cameras that have been calibrated within the previous two years. To conduct thermographic analyses, we used two infrared thermographic cameras, Flir E60bx and Flir E6. Both cameras were IP 54 and had an operating time of up to 4 h. The camera differences are listed in Table 2.
The significant differences in the cameras (for analysis purposes), in addition to the resolutions, are the optical characteristics of the field of view (FOV) and the instantaneous field of view (IFOV). Figure 5 illustrates the minimum distances of the cameras from the module to fit the complete module, described by Table 2, taken at an angle of 90°.
From this, we can conclude that the Flir E6 camera is not suitable for the analysis due to its lower resolution; however, in combination with the aforementioned IFOV optics, it can be used as a control and for additional analyses when the analysis object cannot be viewed from a greater distance. From the aspect of documenting the visual image, none of the cameras met the requirement of 9 Mpix visual image resolution. Therefore, photo documentation, for the purposes of visual analysis, was carried out using the cameras. Since the cameras have not been calibrated for more than two years, the analysis was performed using a VOLTCRAFT RS-350 with an uncertainty measurement of ± 0.5 °C at 100 °C. The calibration results are shown in Figure 6.
When analyzing two cameras, calibration data are necessary to reconcile the measurement results because the FLIR E60bx camera shows an average temperature of 0.8 °C higher, while the FLIR E6 shows an average temperature of 2.9 °C higher. To prepare the measurement procedure, a pilot analysis of a small unused module with dimensions of 52 × 32.5 cm, placed on supports intended for field use, was performed. Unfortunately, the nameplate, which should be present in accordance with the EN 50380: 2003 Datasheet and nameplate information for the PV modules (or UL 4730), was not attached to the module. Figure 7 shows a photograph of the pilot setup, taken at 720 nm.
The expected values of the temperature difference, according to the literature [11], were in the range of 10 °C. Figure 8 shows the temperature distribution on the module, recorded by the FLIR E60bx camera.
Figure 9 shows the thermal patterns of the bottom and top sides of the module, taken with a wide-angle camera, showing higher temperature values on the glass than a module shot with a narrow-angle camera at a higher distance. This analysis indicates that the influence of operator radiation during the thermographic analysis of the PV modules was not significant.
A comparison of the thermograms of the modules recorded with the E6 and E60bx cameras clearly indicates that the apparent temperature of the glass surface will vary significantly depending on the shooting angle, due to the environmental effects. Under real conditions expected in the field, it would not be possible to determine the exact share of reflected radiation that may occur at microlocations. This will be especially true for changes in the position of the sun, which heats the environment, and the elements of which become thermal emitters. The extent to which the camera position affects the reading of the temperature value is best illustrated in Table 3, which provides a comparison of the results of recording the apparent temperature of the glass surface and the substrate temperature using two cameras.
Table 3 shows a significant deviation in the measured apparent temperature values on glass compared to those measured on the plastic base of the module. In addition to the emissivity itself, the camera position had a significantly greater impact, which, in the case of the E6, was on the right side and, in the case of the E60bx, was on the left side of the module. The results indicated that the impact of the environment was significantly expressed in the process of thermographic analyses. While the difference in the reading on larger plastic surfaces of 0.95 °C was below the camera limit accuracy, the difference in the reading on the glass surfaces was more than 10 °C on average, which was a significant deviation from the definition of the ΔT (temperature difference) criteria [12].
The indicators of the detailed analysis of the PV module at a short-circuit state current of 1.07 A, carried out at points corresponding to the position of all individual semiconductor elements (cells) of the module, are shown in Table 4. Table 4 shows the temperature that can be measured on the board as a whole, but also on the semiconductor elements.
In order to compare the measured temperature values, it was necessary to know the limitations provided by the standards. According to IEC 61215 [13], modules must undergo several thermal cycles, from −40 °C to 85 °C, and hail in test IV 9 impacts, ¾ ″– 45 mph and test V 10 impacts 1″—52 mph (typical assumed in PV standards 25–75 mm hail, 7.53–39.5 m/s [24]). According to IEC TS 63126 [14], the upper limit of temperature cycling is 95 ± 2 °C for rating modules as temperature level 1 and 105 ± 2 °C for rating modules as temperature level 2. Another standard that can be applied in setting limits can be the IEC 61730-2 Photovoltaic (PV) module safety qualification—Part 2: Requirements for testing [25]. IEC 61730-2 sets temperature limits for components, wiring compartments, and fibers at 90 °C, laminated phenolic composition at 125 °C, molded phenolic composition of 150 °C and field wiring terminals, and metal parts at 30 °C above ambient. As can be seen in the thermograms, recordings were within the regulations. The floor coverings in the background of the modules were, on average, between 38 °C and 42 °C, so none of the elements met the criterion of a temperature higher than 30 °C above ambient, i.e., 68 °C–72 °C, allowed by the standard. The answer to the question of the maximum temperature value the module can withstand was also sought in the production process [26]. During the production process, modules are heated up to 170 °C. Cure reaction temperatures of 150 °C and 160 °C are not adequate; high cure temperatures of up to 170 °C and/or long cure times can generate acetophenone, which causes yellowing in the EVA (Ethylene vinyl acetate). According to more recent literature [21], lamination takes place at 150 °C. According to [15], the operating temperature range to be expected in practice is between 30 °C and 80 °C. The reason for the analysis of potential temperature extremes is the fact that the power plant is no longer under normal operations, and testing is only possible with modules experiencing short circuit, i.e., at the highest possible current, which also leads to the highest thermal stress. Otherwise, under normal operations, the increase in temperature of the module parts can be expressed by a simplified expression that takes into account wind speed, irradiance, and ambient temperature [18], given as (1):
T c = T a + ( 0.32 8.91 + 2 · V f ) · G t         ( V f > 0 ) ,
where Ta is ambient temperature in K, Tc is cell/module operating temperature in K, GT is solar irradiance in W/m2, and Vf is wind speed, ranging between 1–15 m/s.

3.2. Measurements

3.2.1. Thermographic Validity Criterion

The new modules used for the power plant renovation were subjected to analysis of the thermal pattern in the short-circuit state, which can be seen in Figure 10. At the time of recording, the solar irradiance was 677 W/m2 and the contact measured module temperature was 43.8 °C.
When performing the thermographic analysis, it was necessary to continuously consider the recording angle because the emissivity parameter takes on different values. Different sources give different information on the emissivity and the viewing angle perpendicular to the module, where shooting at an angle of 5–60° is acceptable [19]. FLIR in particular points out that the emissivity of glass is a great challenge. “Even though glass has an emissivity of 0.85–0.90 in the 8–14 μm waveband, thermal measurements on glass surfaces are not easy to do”. One of the first papers to provide information on temperature differences taken from a helicopter [20] showed a graphical representation of the emissivity, given in Figure 11.
The analysis of all previous findings, presented in [10], from the emissivity spectrum can be seen in Figure 12.
The work in [21] states that emissivity should be selected as 0.85 for glass and 0.95 for a polymer backsheet, if the view angle is within 90–60° (glass) and 90–45° (polymer). FLIR’s recommendation is visible in the form of the green space in Figure 12. Information on emissivity changes is especially important when conducting an analysis of a larger area composed of several different thermographic records is necessary because, sometimes, this is the only way we can get complete information about the temperature distribution of the surface of a PV module. Table 5 provides information on the temperature distribution on the module shown in Figure 10.
Analyzing the data, we can conclude that the maximum temperature difference of the individual parts of the module is 27.9 °C. Table 6 gives the statistical data of the apparent temperature of the new module.
Considering the pilot project results, where the apparent temperature only increased by 17%, the new module in the short-circuit state shows a temperature increase of 67% in some parts. Considering that the short-circuit current of the new module is up to 8 times higher, it is clear that the pattern of determining the ΔT criterion depends on the short-circuit current and will be unique for each module. The limiting criterion will be the maximum temperature that individual parts of the module can withstand under normal operation. From the above, it is clear why the IEC TS 62446-3:2017 standard does not specify temperature values, and only the three basic classes of abnormality are specified, as listed in Table 7.
The situation analyzed in this paper is described in [27], where the absolute temperatures of the hotspots were 62.1 °C and 101.4 °C, compared to the 58.4 °C of a healthy cell. The temperature difference between a low-temperature hotspot and a healthy cell was 3.7 °C, and the maximum temperature difference was 43 °C. The work in [16] gave similar data in the list of identified module defects, where the maximum registered temperature difference was 42.53 °C. In [17], an IR image revealed the existence of two hot spots reaching 86 °C, a relative increase of more than 35 °C with respect to the temperature of nearby cells. Furthermore, the cell temperatures measured at the back of the module were about 7–10 °C higher than those measured at the front.

3.2.2. I-V Curve Measurements of Studied Modules

Preparing the implementation of the on-site measurements is shown in Figure 13. The position of the modules was adjusted to the actual slope of the halls where the modules were located. The shadow created by the stands was used to adjust the position of the module. A photograph in Figure 13 shows the measurement procedure, in which the I-V curve of the PV modules was measured, followed by thermographic analysis of the modules in the short-circuit state.
PV modules with no visible damage to the glass cover were subjected to I-V curve measurements to evaluate the influence of the hailstorm on their performance. The PV modules’ I-V curve measurements were performed using an IEC (EN) 62446 standard compliant PV tester, the Metrel MI 3108 EurotestPV. This measurement procedure estimated a PV module’s I-V curve under standard test conditions (STCs) based on the PV module technical characteristics and the current environmental conditions (solar irradiance and PV module temperature), which was easily comparable to the manufacturer’s I-V curve under the STCs. This enabled an assessment of hailstorm damage on PV module performance. The technical characteristics of the PV tester I-V curve measurement module, along with the PV solar irradiance sensor (temperature compensated monocrystalline PV cell) and cell temperature sensor, are given in Table 8. The PV module I-V curve measurement procedure is given in Figure 14. The procedure for measuring the I-V curve with the PV tester is given in Figure 14.
PV module I-V curve measurements are given for 2 out of 13 PV modules with no visible damage to the glass surface. The environmental conditions at the moment of I-V curve measurement for both PV modules are given in Table 9.
The numerical and graphical results of the I-V curve measurements of the first (washed) PV module are given in Table 10 and Figure 15; Figure 15 shows both I-V and P-V curves. The results are given for three scenarios—measured values, calculated STC values (measured data estimated for STC values based on manufacturer data), and nominal STC values representing data from the manufacturer’s datasheet.
The numerical and graphical results of the I-V curve measurements of the second PV module are given in Table 11 and Figure 16.
The results indicate that both PV modules degrade significantly in terms of electrical performance in comparison to the manufacturer’s data even though the modules have been operating for only one year and their degradation should not be as high as presented levels. The most significant deviation is observed in the output power, which decreases by more than 20 % for both PV modules.

3.2.3. Influence of Soiling on the Infrared Thermographic Pattern

Figure 17 shows the thermogram of the module removed from the dust-covered roof. Upon washing, the apparent temperature values were significantly reduced. A temperature increase in the upper left corner of the triangle was also observed as a result of the reflected radiation from the production hall on the left side of the test site, which can be seen in Figure 13 of the measurement setup. The reflected temperature was read from the chrome-plated stand with the emissivity set to 1. During the thermographic measurements, it was found that the used cameras were not suitable for measurements at high solar irradiance levels due to the poor visibility of the displays. It is recommended to use cameras with optical viewfinder.
Due to the observed significant effect of shading, because of soiling, on the thermal pattern, all modules were subjected to the washing process. The procedure was carried out in three steps. The first stage was the removal of large particles and the rest of the glass with a whisk, followed by washing, which dissolves the stubborn deposits of particles from the module. This was followed by rinsing the surface with clean water and wiping with a clean cloth. Figure 18 shows the appearance of the module before washing and the necessary equipment on the ground. On average, one litre of water per module was needed to clean the modules.
Figure 19 shows the need for washing, i.e., the effects of impurities on the thermal pattern of the module, which is common due to shading [28]. Figure 19 illustrates the temperature deviation of the readings before and after cleaning. The analysis was performed on the first 5 rows whose measurement data were not affected by the reflected radiation of the production hall, which is difficult to see on the dirty module. The significance of the influence of shading is clearly seen in Figure 17, where the temperature values of individual cells after cleaning cannot determine the pattern of stochastic change.

3.2.4. Infrared Thermographic Analysis of Undamaged Modules

After the initial analysis, the identification of potential reflections on the site, and taking into account the time needed to inspect one module on average 27 min, it became clear that only 50 % of the available modules can be inspected during the day under the same conditions. The following thermograms show the thermal patterns of the modules in the short-circuit state. To facilitate visual comparison, the temperature range of the pallet is set to a temperature value from 20 °C to 100 °C. Figure 20 shows the thermographic analysis of module number 2 (left) and number 3 (right).
Figure 21 shows the thermographic analysis of the front side (up) and the backside (down) of module number 4. A hot spot was noticed on module number 4, which can lead to module degradation. The observed anomaly significantly exceeds the temperatures predicted by the standards. Based on previous findings, we decided to investigate the background of the module using a camera with a wider shooting angle FLIR E6 and determine the exact temperature values. The reflected radiation of the substrate was taken from the images recorded with E60bx.
The comparison of the sizes illustrated in the figures shows that the recording parameters were well chosen. The learned hot spot, with its temperature magnitude of 114 °C, can lead to the destruction of the module, so it was declared defective for further use. Figure 22 shows thermographic analyses of modules 5 and 6, while Figure 23 shows the thermographic analyses of modules 7 and 8.
The analyzed modules showed different thermal patterns, resulting from the short-circuit current at different solar irradiance values. The recorded values corresponded to the information found in [18,20,29]. Table 12 shows the values of solar irradiance and contact measurement values of the module temperatures that preceded the thermographic test.
A graphical representation of the solar irradiance over the thermographic measurements on the modules is provided in Figure 24.
The graphical representation of solar irradiance over the thermographic measurements must be corrected in order to get precise data according to (1), using the data presented in Figure 25. The average wind speed for the studied location in September is 1.7 m/s, based on the Croatian Meteorological and Hydrological Service data.
The minimum temperature of the module in the short-circuit state, given in Figure 26, shows a growth trend in the daily temperature for September. The increase in the value of module 4 is a result of heating caused by significant dissipation of the hot spot.
If we exclude the extreme hotspots on module number 4 and module number 8, the data shown in Table 13 indicate that the difference between the observed maximum and minimum temperature values is 20.5 °C, which is an average increase of 45.16%. The maximum temperature values, averaging 65.8 °C, are not a problem for module components under continuous operation. A comparison with the data from the analysis of the new modules in Table 6 shows that the data in Table 13 have similar values.
Considering the observed extremes of the hotspots (maximum temperature values of the modules are shown in Figure 27), we can conclude that module 4 is defective, i.e., not suitable for further use because the temperature difference is 65.3 °C. In addition, module 8 should be monitored, considering the lower value of solar irradiance with a temperature difference of 33.3 °C.
The analysis performed on 62% of the total studied modules indicates that another faulty module may occur. Another conclusion is that, if reusing entire modules, it is necessary to monitor at least two modules for further development of potential hotspots. This is due to damage that can develop as the module ages during operation. The results of the visual inspection described in [13] are shown in Figure 28, which illustrate the different forms of damage found on the modules. A detailed overview of all the different module damage types can be found in the NREL report [23]. Interesting examples of damage and appearance of a PV module after 27 years of operation can be found in [22].
A further analysis of the studied modules was done by classifying the visible damage into five levels. Level 1 represents a cell without any visible damage, level 2 represents barely visible damage, level 3 represents visible damage present in the right photograph of Figure 28, level 4 represents damage presented in the centre photograph in Figure 28, and level 5 is visible in the left photograph of Figure 28. The visual inspection and damage classification of module number 3 for each cell is given in Figure 29, along with the thermogram of the same module. The thermogram of module number 3, given in Figure 29 (right), is captured right after the thermographic analysis described in Section 3.2.4 and is given in Figure 20 (right) before disposal of the PV plant at the microlocation. The purpose of the thermogram given in Figure 29 (right) was not to conduct a thermographic analysis but rather to determine the thermal pattern for comparison with the damage classification via visual inspection. Comparison of the thermogram for module number 3 with the visual inspection damage classification results in Figure 29 shows that there is a significant difference. The thermal pattern does not correspond to the results of the visual inspection, i.e., conclusions that could be made on the basis of the visual inspection, whereby evaluation of the individual cell state via visual inspection emphasizes the complexity of the studied problem.
In a review of PV module failure [21], in a section on documenting visual failures in the field, the observed patterns were classified as snail tracks. Snail tracks are discolorations of the silver paste used for the gridlines of cells. This discoloration appears along cell cracks. More detailed conclusions regarding the state of the remaining modules can be made only by applying electroluminescence in accordance with IEC TS 60904-13:2008 and detailed I-V curve analyses [30], which are also the subject of another study to be published in the near future.

4. Conclusions

PV power plants are one way to shift energy policy toward a green economy. Natural disasters disrupt the economic indicators of a PV power plant’s life cycle. In the case of unforeseen events, such as hail, insurance plays a key role and covers the costs of replacing PV modules. The decision to replace all the modules or only the broken ones has a foundation, because even the modules that are visually intact can eventually develop a problem in operation due to mechanical shocks, and also manipulations when cleaning the cover of the surface covered in glass from other damaged modules. Using the example of the analyzed PV power plant, only 14% of the total number of modules remained visually intact. From the stated number, 13% was expected to malfunction. These problems cannot be directly related to the consequences of hail, but they can be used as a guideline if a module is reused for less demanding needs, i.e., at a location that allows intensive control at the time of commissioning.
The recommendations of IEC TS 62446-3 regarding the resolution of a thermal camera proved to be justified when it comes to choosing measuring points based on a smaller IFOV, which resulted in more accurate data. The effect of reflected radiation is particularly evident when a PV module is analyzed from the side of the glass cover. The temperature of the new module in the short-circuit state assumes temperature differences of up to 27 °C. The criterion for deciding the state of a module based on the ΔT criterion is not easy to determine, as it depends on the size of the module, short-circuit current, and the amount of solar irradiance. The modules need to be cleaned prior to thermographic analyses. Cleaning a module can change the thermal pattern, depending on the degree of contamination, as removing sediment reduces shading. On average, one liter of water is needed to clean one module, and the procedure can take up to six minutes. Analysis of a single module, consisting of the determination of the I-V curve and the thermographic analysis of the module in short-circuit state, takes an average of 27 min. If we do not have a new or reference module for defining the ΔT criteria, the data of the mean values of the analysis of several modules can be used, and it is necessary to exclude protruding observations. Based on statistically defined criteria, it is possible to make a judgment about the current state of a module, as well as the allowable range of temperature differences. The observed thermal patterns cannot be assumed by identifying damage during visual inspection, which is best seen by comparing the conducted analysis of the third panel.
The comparison between the thermographic analysis and the visual inspection clearly confirmed thermography as a complementary method for testing PVs. In the case where there is a need for additional accuracy and precision of the thermographic pattern information, it is necessary to compensate for the influence of solar irradiance and ambient temperature fluctuations during the day. In most cases, this compensation is not necessary since the defects of the damaged module result in a significant deviation of the temperature in relation to the recorded parameters of an undamaged module.

Author Contributions

Conceptualization, H.G., M.Ž. and D.Š.; methodology, H.G. and M.Ž.; software, H.G. and M.Ž.; validation, D.Š. and M.Ž.; formal analysis, M.Ž., H.G. and D.Š.; investigation, H.G., M.Ž. and N.V.; resources, D.Š. and N.V.; data curation, H.G. and M.Ž.; writing—original draft preparation, H.G. and M.Ž.; writing—review and editing, M.Ž. and D.Š.; visualization, H.G. and M.Ž.; supervision, D.Š.; funding acquisition, D.Š. All authors have read and agreed to the published version of the manuscript.
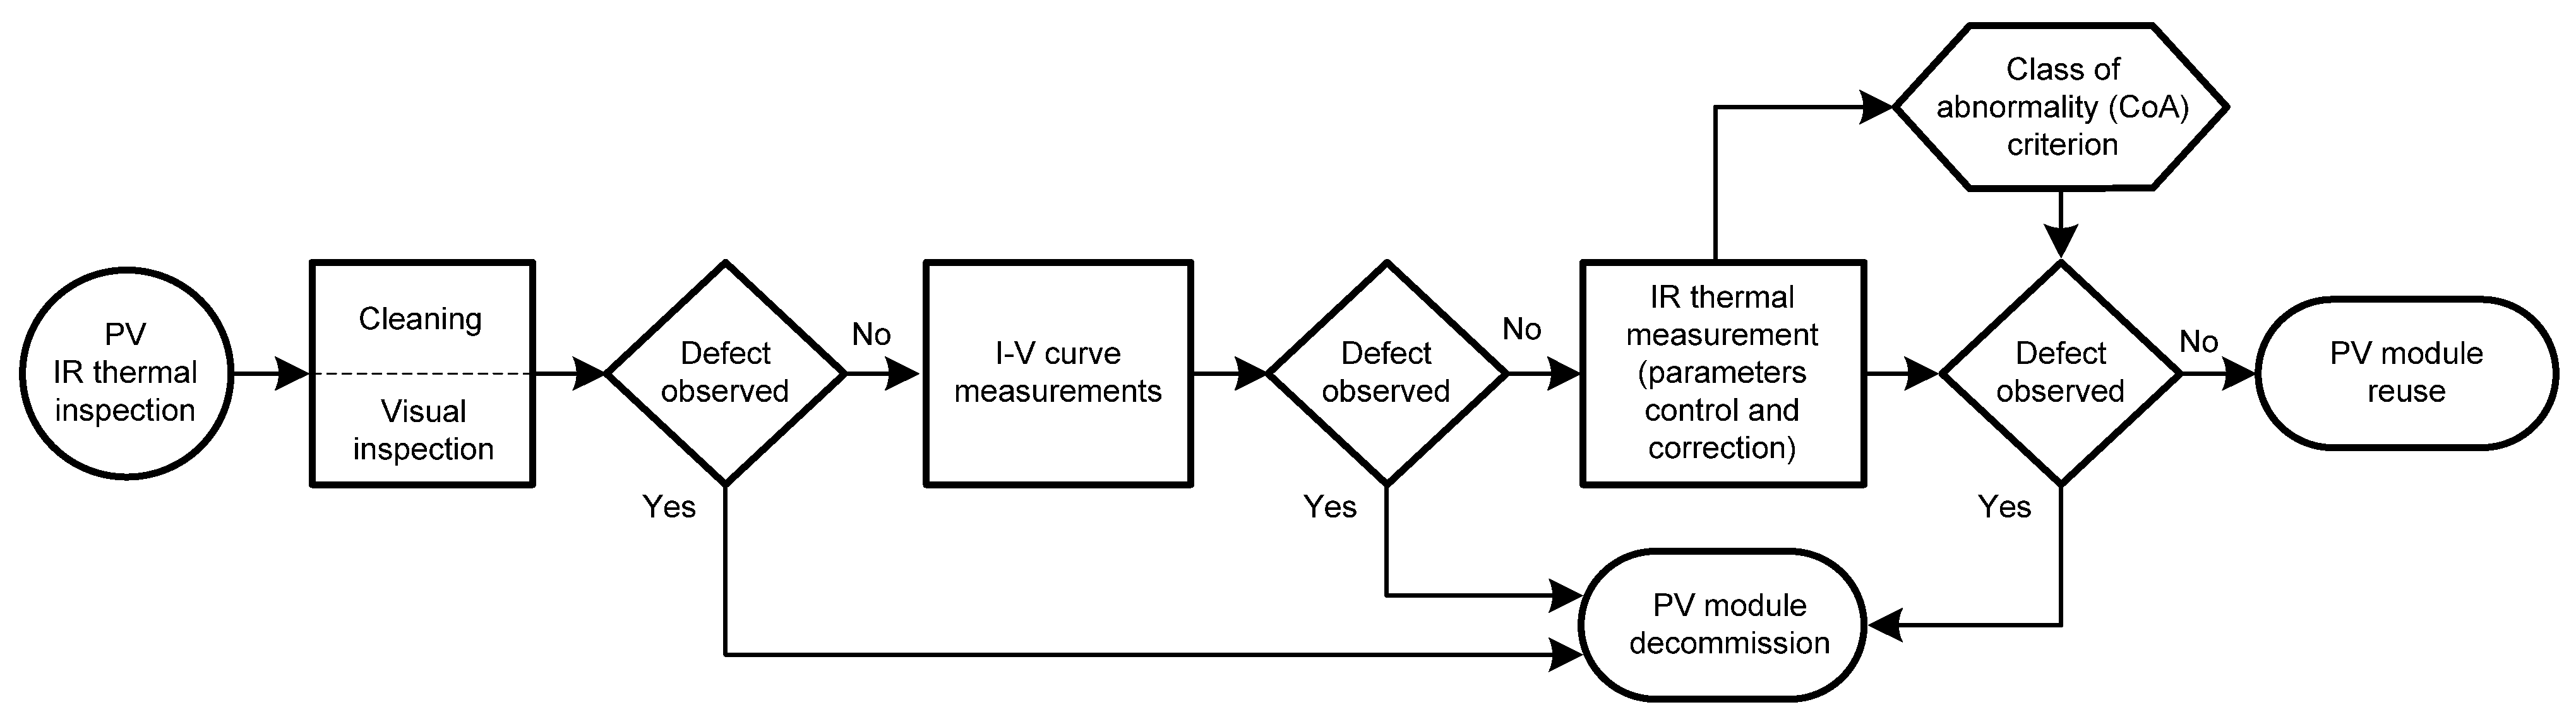
Funding

This research is supported by the Renewable Energy Sources for smart sustainable health Centers, University Education and other public buildings (RESCUE) project funded by Interreg IPAII Croatia–Serbia, project no. HR-RS303.

Conflicts of Interest

The authors declare no conflict of interest.

References

  1. HINA. Croatian Radiotelevision u Požegi Štete od Snažne Tuče, Dio Mještana bez Struje. Available online: https://vijesti.hrt.hr/hrvatska/stozer-civilne-zastite-spremite-se-na-jaca-grmljavinska-nevremena-2185252 (accessed on 6 December 2021).
  2. Republic of Croatia Ministry of Interior Civil Protection Headquarters Nevrijeme na Području Požege. Available online: https://civilna-zastita.gov.hr/vijesti/nevrijeme-na-podrucju-pozege-4334/4334 (accessed on 6 December 2021).
  3. Croatian Meteorological and Hydrological Service. Report on Hailstorm in Požega on June 25 2021; Croatian Meteorological and Hydrological Service: Zagreb, Croatia, 2021. [Google Scholar]
  4. Požega.eu Portal Stanovnicima s Područja Općine Jakšić Isplaćena Pomoć za Štete Nastale od Prirodne Nepogode na Stambenim Objektima. Available online: https://pozega.eu/stanovnicima-s-podrucja-opcime-jaksic-isplacena-pomoc-za-stete-nastale-od-prirodne-nepogode-na-stambenim-objektima/ (accessed on 6 December 2021).
  5. Grad Požega Gradsko Vijeće Grada Požege: Kreće Isplata Pomoći za Štete Nastale u Prirodnim Nepogodama. Available online: https://www.pozega.hr/index.php?option=com_k2&view=item&id=4309:gradsko-vijece-grada-pozege-krece-isplata-pomoci-za-stete-nastale-u-prirodnim-nepogodama&Itemid=323 (accessed on 6 December 2021).
  6. Žnidarec, M.; Šljivac, D.; Došen, D. Performance and Empirical Analysis of Photovoltaic Modules Made of Different Technologies Using Capacity Evaluation Method. Teh. Vjesn. Tech. Gaz. 2019, 26, 1585–1592. [Google Scholar]
  7. Žnidarec, M.; Šljivac, D.; Došen, D.; Dumnić, B. Performance assessment of mono and poly crystalline silicon photovoltaic arrays under Pannonian climate conditions. In Proceedings of the IEEE EUROCON 2019 -18th International Conference on Smart Technologies, Novi Sad, Serbia, 1–4 July 2019; pp. 1–6. [Google Scholar]
  8. Faculty of Electrical Engineering Computer Science and Information Technology Laboratory for Renewable Energy Sources About Laboratory for Renewable Energy Sources. Available online: https://reslab.ferit.hr/?t=4#m (accessed on 6 December 2021).
  9. Köntges, M.; Altmann, S.; Heimberg, T.; Jahn, U.; Berger, K.A. Mean Degradation Rates in PV Systems for Various Kinds of PV Module Failures. In Proceedings of the 32nd European Photovoltaic Solar Energy Conference and Exhibition, München, Germany, 21–24 June 2016; pp. 1435–1443. [Google Scholar]
  10. International Electrotechnical Commission. IEC TS 62446-3:2017 Photovoltaic (PV) Systems—Requirements for Testing, Documentation and Maintenance—Part 3: Photovoltaic Modules and Plants—Outdoor Infrared Thermography; International Electrotechnical Commission: Geneva, Switzerland, 2017. [Google Scholar]
  11. Kubicek, B.; Ebner, R.; Eder, G.C.; Sonnleitner, H.; Angerer, A. Assessment of Electric and Monetary Impact of Hot Cells Using Thermography And Thermal Modelling. In Proceedings of the 31st European Photovoltaic Solar Energy Conference and Exhibition, Hamburg, Germany, 14–18 September 2015. [Google Scholar]
  12. Glavaš, H.; Jozsa, L.; Barić, T. Infrared thermography in energy audit of electrical installations. Teh. Vjesn. Tech. Gaz. 2016, 23, 1533–1539. [Google Scholar]
  13. International Electrotechnical Commission. IEC 61215-1:2021 Terrestrial Photovoltaic (PV) Modules—Design Qualification and Type Approval—Part 1: Test Requirements; International Electrotechnical Commission: Geneva, Switzerland, 2021. [Google Scholar]
  14. International Electrotechnical Commission. IEC TS 63126:2020 Guidelines for Qualifying PV Modules, Components and Materials for Operation at High Temperatures; International Electrotechnical Commission: Geneva, Switzerland, 2020. [Google Scholar]
  15. Jahn, U.; Herz, M.; Köntges, M.; Parlevliet, D.; Paggi, M.; Tsanakas, I.; Stein, J.S.; Berger, K.A.; Ranta, S.; French, R.H.; et al. Review on Infrared and Electroluminescence Imaging for PV Field Applications. In IEA Photovoltaic Power Systems Programme (PVPS); IEA-PVPS T13-102018; International Energy Agency: Paris, France, 2018. [Google Scholar]
  16. Dalsass, M.; Scheuerpflug, H.; Maier, M.; Brabec, C.J. Correlation between the Monitoring Data of a Photovoltaic Power Plant and Module Defects Detected by Drone-Mounted Thermography. In Proceedings of the 31st European Photovoltaic Solar Energy Conference and Exhibition, Hamburg, Germany, 14–18 September 2015. [Google Scholar]
  17. Kaplani, E. Detection of Degradation Effects in Field-Aged c-Si Solar Cells through IR Thermography and Digital Image Processing. Int. J. Photoenergy 2012, 2012, 1–11. [Google Scholar] [CrossRef] [Green Version]
  18. Skoplaki, E.; Boudouvis, A.G.; Palyvos, J.A. A simple correlation for the operating temperature of photovoltaic modules of arbitrary mounting. Sol. Energy Mater. Sol. Cells 2008, 92, 1393–1402. [Google Scholar] [CrossRef]
  19. Glavas, H.; Vukobratovic, M.; Primorac, M.; Mustran, D. Infrared thermography in inspection of photovoltaic panels. In Proceedings of the 2017 International Conference on Smart Systems and Technologies (SST), Osijek, Croatia, 18–20 October 2017; pp. 63–68. [Google Scholar]
  20. Buerhop-Lutz, C.; Scheuerpflug, H.; Weißmann, R. The Role of Infrared Emissivity of Glass on IR-Imaging of PV-Plants. In Proceedings of the 26th European Photovoltaic Solar Energy Conference and Exhibition, Hamburg, Germany, 5–9 September 2011. [Google Scholar]
  21. Köntges, M.; Oreski, G.; Jahn, U.; Herz, M.; Hacke, P.; Weiss, K.-A.; Razongles, G.; Paggi, M.; Parlevliet, D.; Tanahashi, T.; et al. Assessment of Photovoltaic Module Failures in the Field. In IEA Photovoltaic Power Systems Programme (PVPS); IEA-PVPS T13-092017; International Energy Agency: Paris, France, 2017. [Google Scholar]
  22. Kurtz, S. Photovoltaic Module Reliability Workshop 2011; Technical Report NREL/TP-5200-60170; NREL—National Renewable Energy Laboratory: Oak Ridge, TN, USA, 2013. [Google Scholar]
  23. Kurtz, S. 2015 NREL Photovoltaic Module Reliability Workshops; Technical Report NREL/PR-5J00-68075; NREL—National Renewable Energy Laboratory: Golden, CO, USA, 2015. [Google Scholar]
  24. Brown, M.; Rowell, M.W.; Coughlin, S.J.; Hardwood, D.W.J. Hail Impact Testing on Crystalline Si Modules with Flexible Packaging. PV Modul. Reliab. Work. 2013. Available online: https://www.energy.gov/sites/default/files/2014/01/f7/pvmrw13_ps2_westpak_brown.pdf (accessed on 9 January 2022).
  25. IE Commission. IEC 61730-2:2016 Photovoltaic (PV) Module Safety Qualification—Part 2: Requirements for Testing; International Electrotechnical Commission: Geneva, Switzerland, 2016. [Google Scholar]
  26. Thaworn, K.; Buahom, P.; Areerat, S. Effects of Organic Peroxides on the Curing Behavior of EVA Encapsulant Resin. Open J. Polym. Chem. 2012, 2, 77–85. [Google Scholar] [CrossRef] [Green Version]
  27. De Oliveira, A.K.V.; Aghaei, M.; Madukanya, U.E.; Nascimento, L.; Ruther, R. Aerial Infrared Thermography of a Utility-Scale PV Plant After a Meteorological Tsunami in Brazil. In Proceedings of the 2018 IEEE 7th World Conference on Photovoltaic Energy Conversion (WCPEC), Waikoloa Village, HI, USA, 10–15 June 2018; pp. 0684–0689. [Google Scholar]
  28. Buerhop, C.; Ulrike, J.; Ulrich, H.; Bernd, L.; Wittman, S. Überprüfung der Qualität von PhotovoltaikModulen Mittels Infrarot-Aufnahmen; ZAE-Bayern: Würzburg, Germany, 2007. [Google Scholar]
  29. Ahmad, F.F.; Ghenai, C.; Hamid, A.K.; Rejeb, O.; Bettayeb, M. Performance enhancement and infra-red (IR) thermography of solar photovoltaic panel using back cooling from the waste air of building centralized air conditioning system. Case Stud. Therm. Eng. 2021, 24, 100840. [Google Scholar] [CrossRef]
  30. Sarikh, S.; Raoufi, M.; Bennouna, A.; Benlarabi, A.; Ikken, B. Fault diagnosis in a photovoltaic system through I-V characteristics analysis. In Proceedings of the 2018 9th International Renewable Energy Congress (IREC), Hammamet, Tunisia, 20–22 March 2018; pp. 1–6. [Google Scholar]
Figure 1. Flow chart of the test procedures.
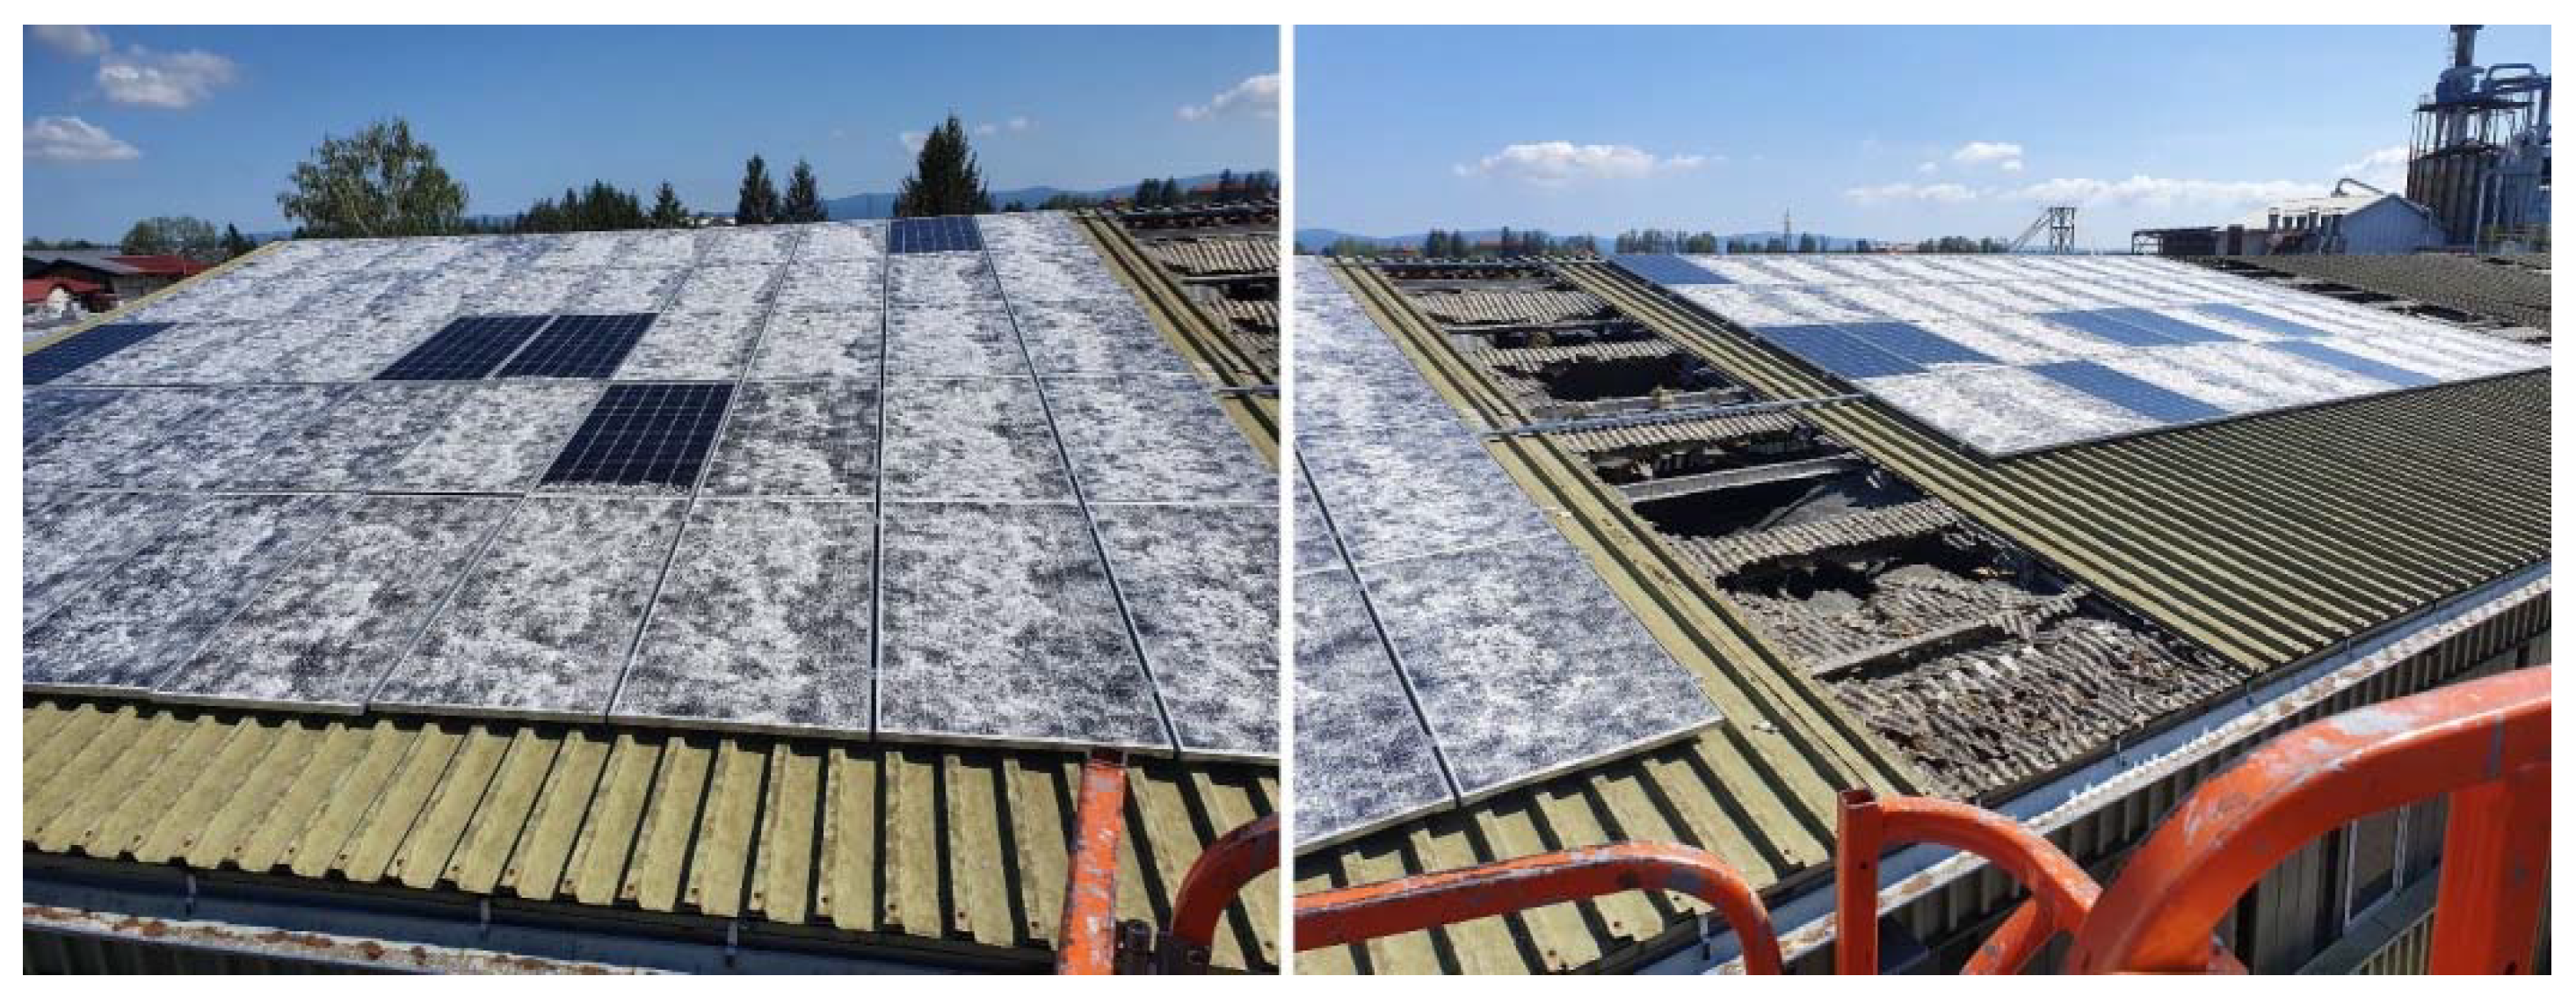
Applsci 12 00745 g001
Figure 2. Photographs of damaged PV arrays of the studied test site.
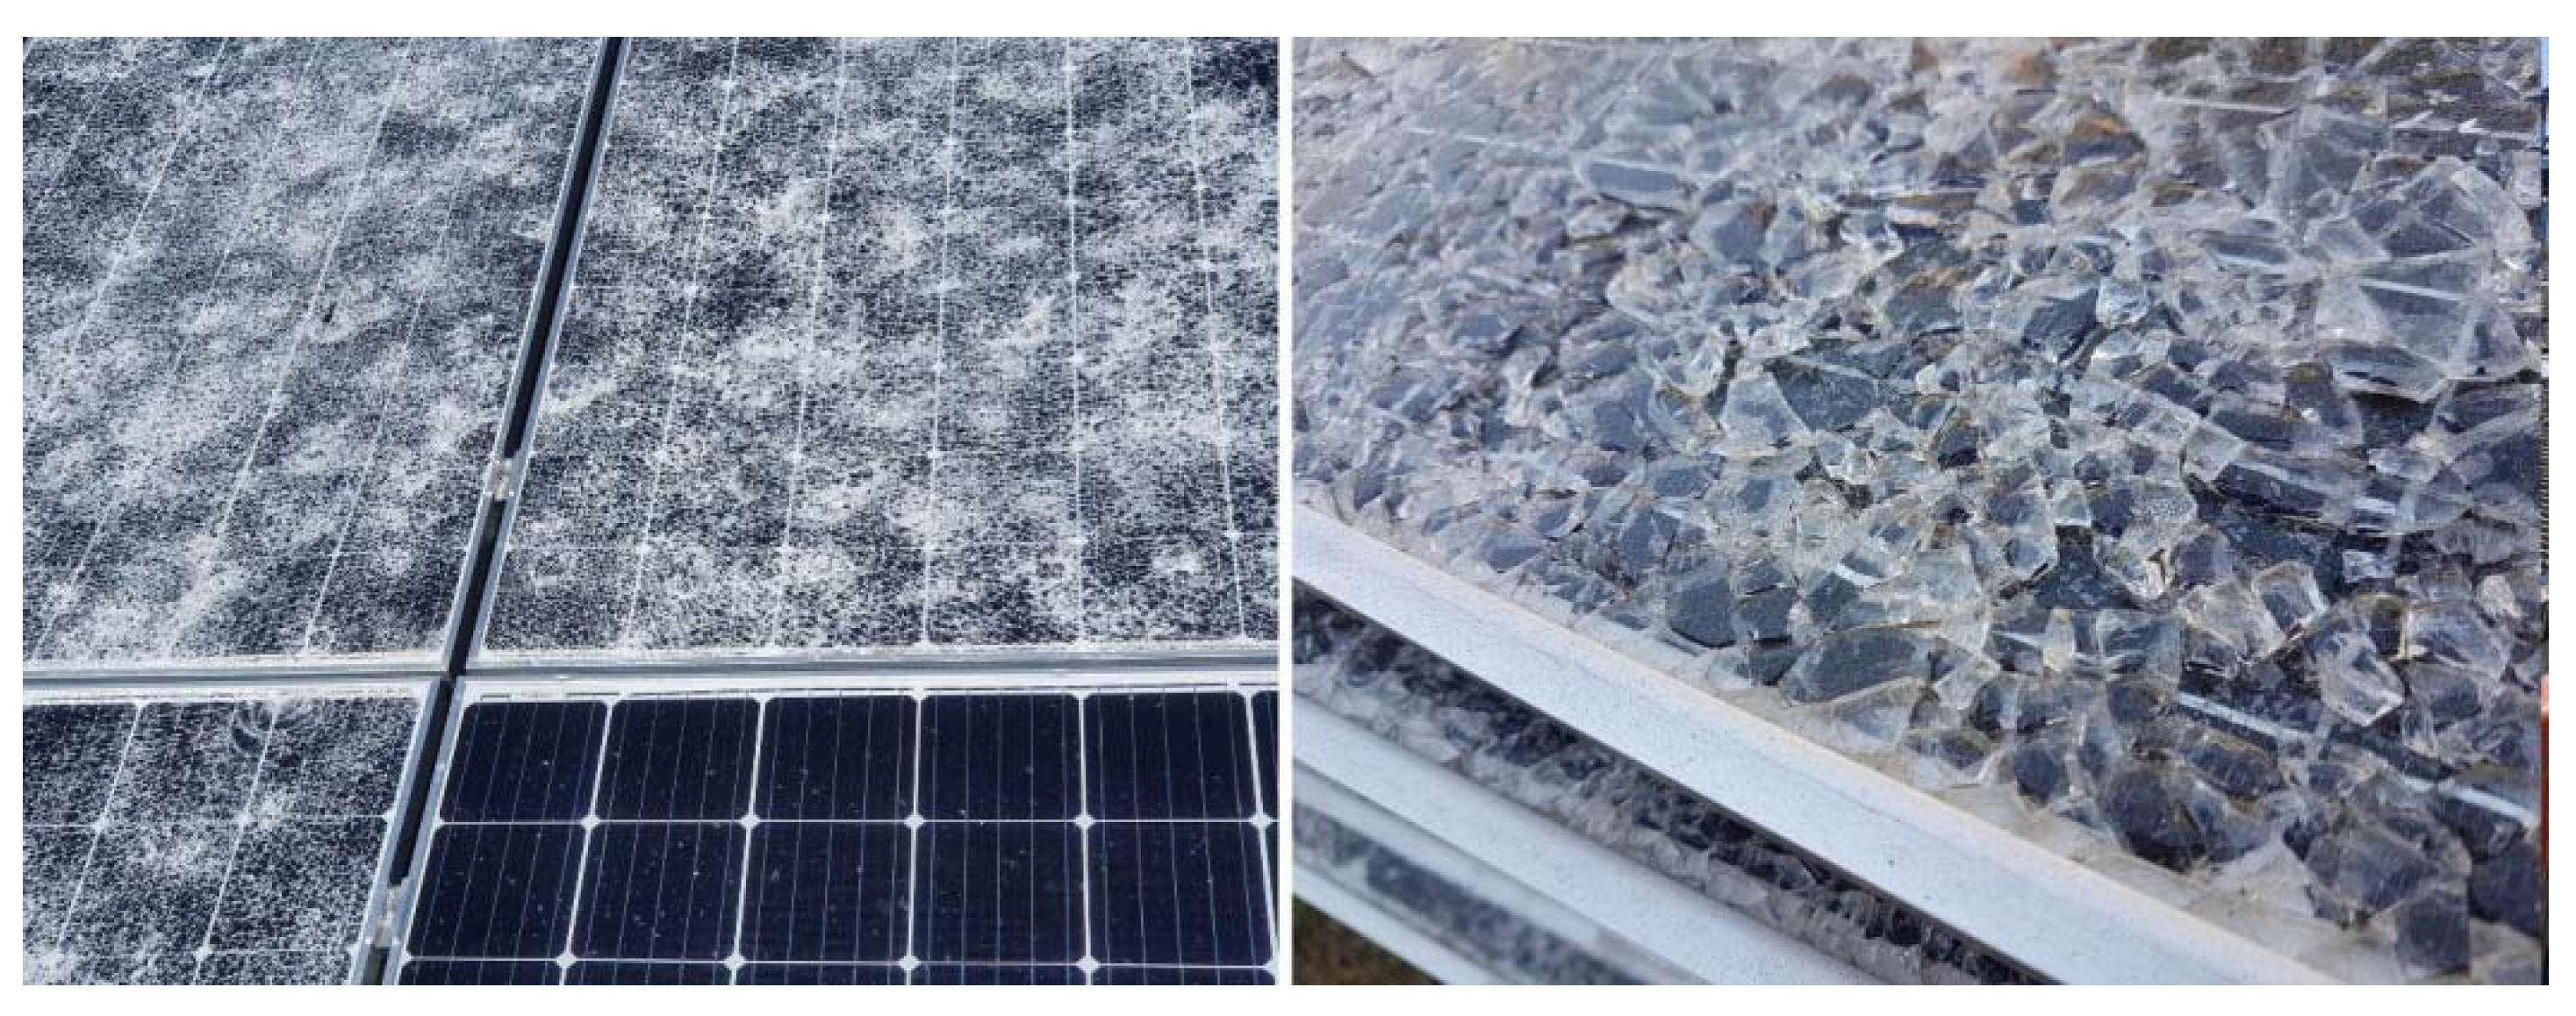
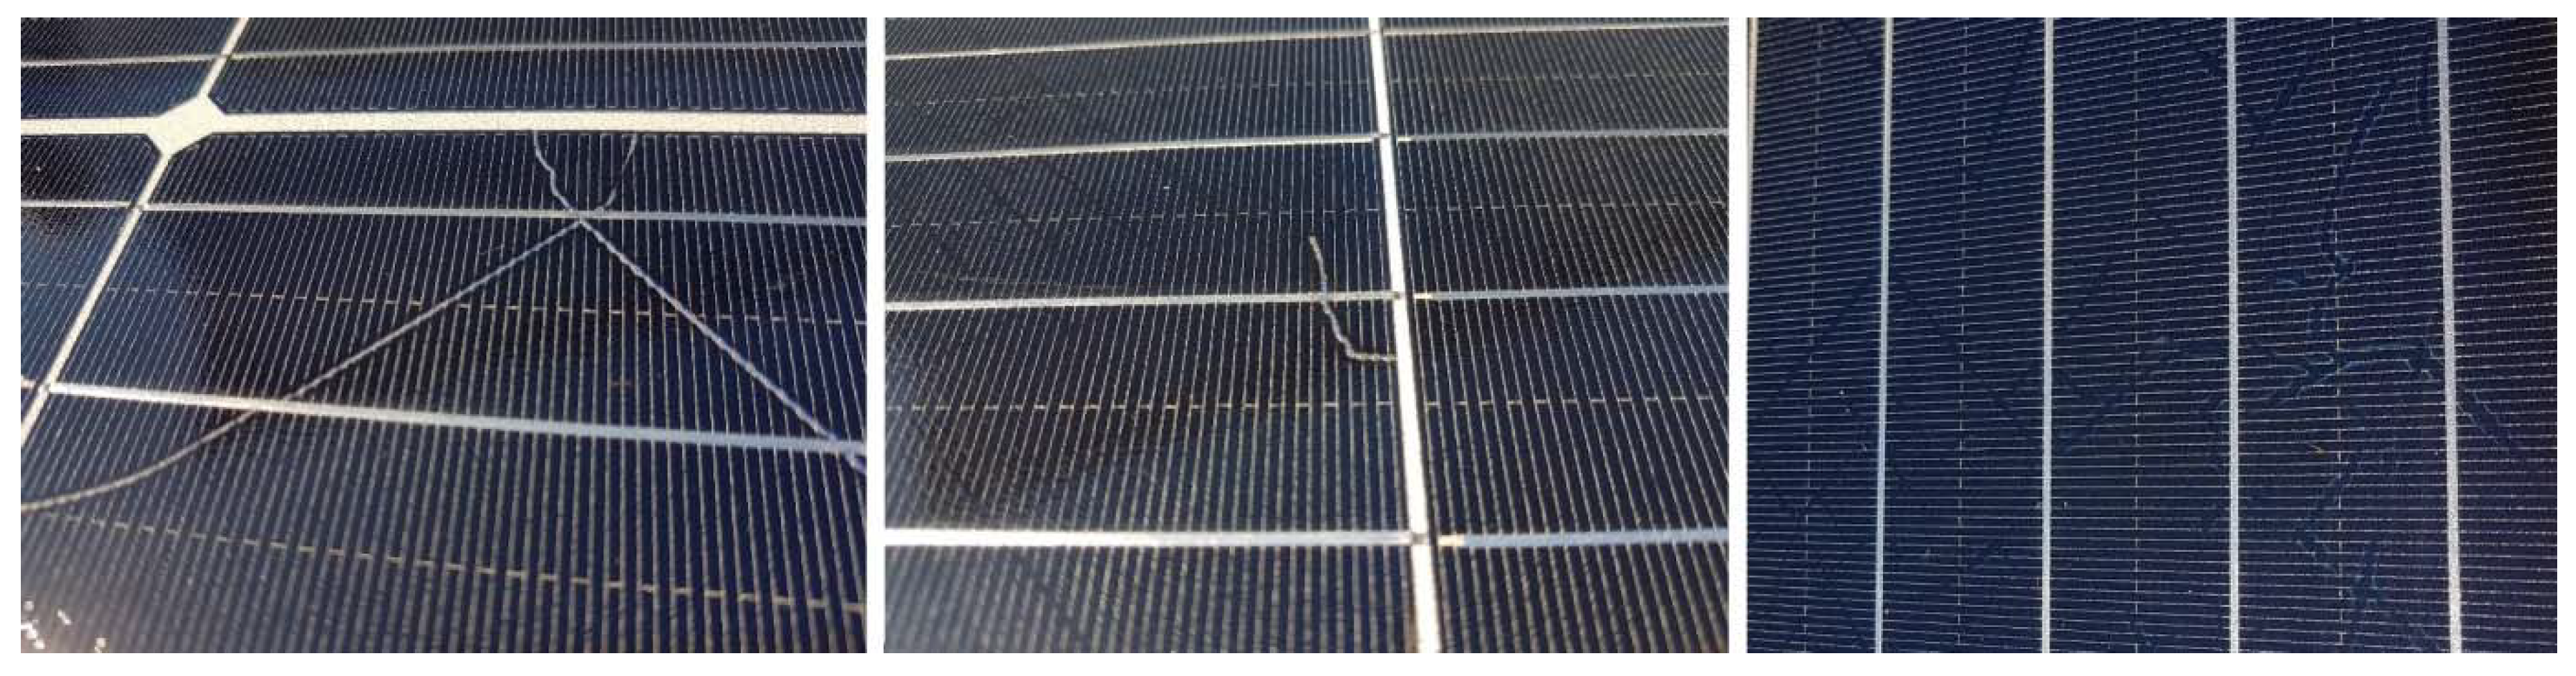
Applsci 12 00745 g002
Figure 3. Close-up on a part of a damaged PV array of the studied test site.
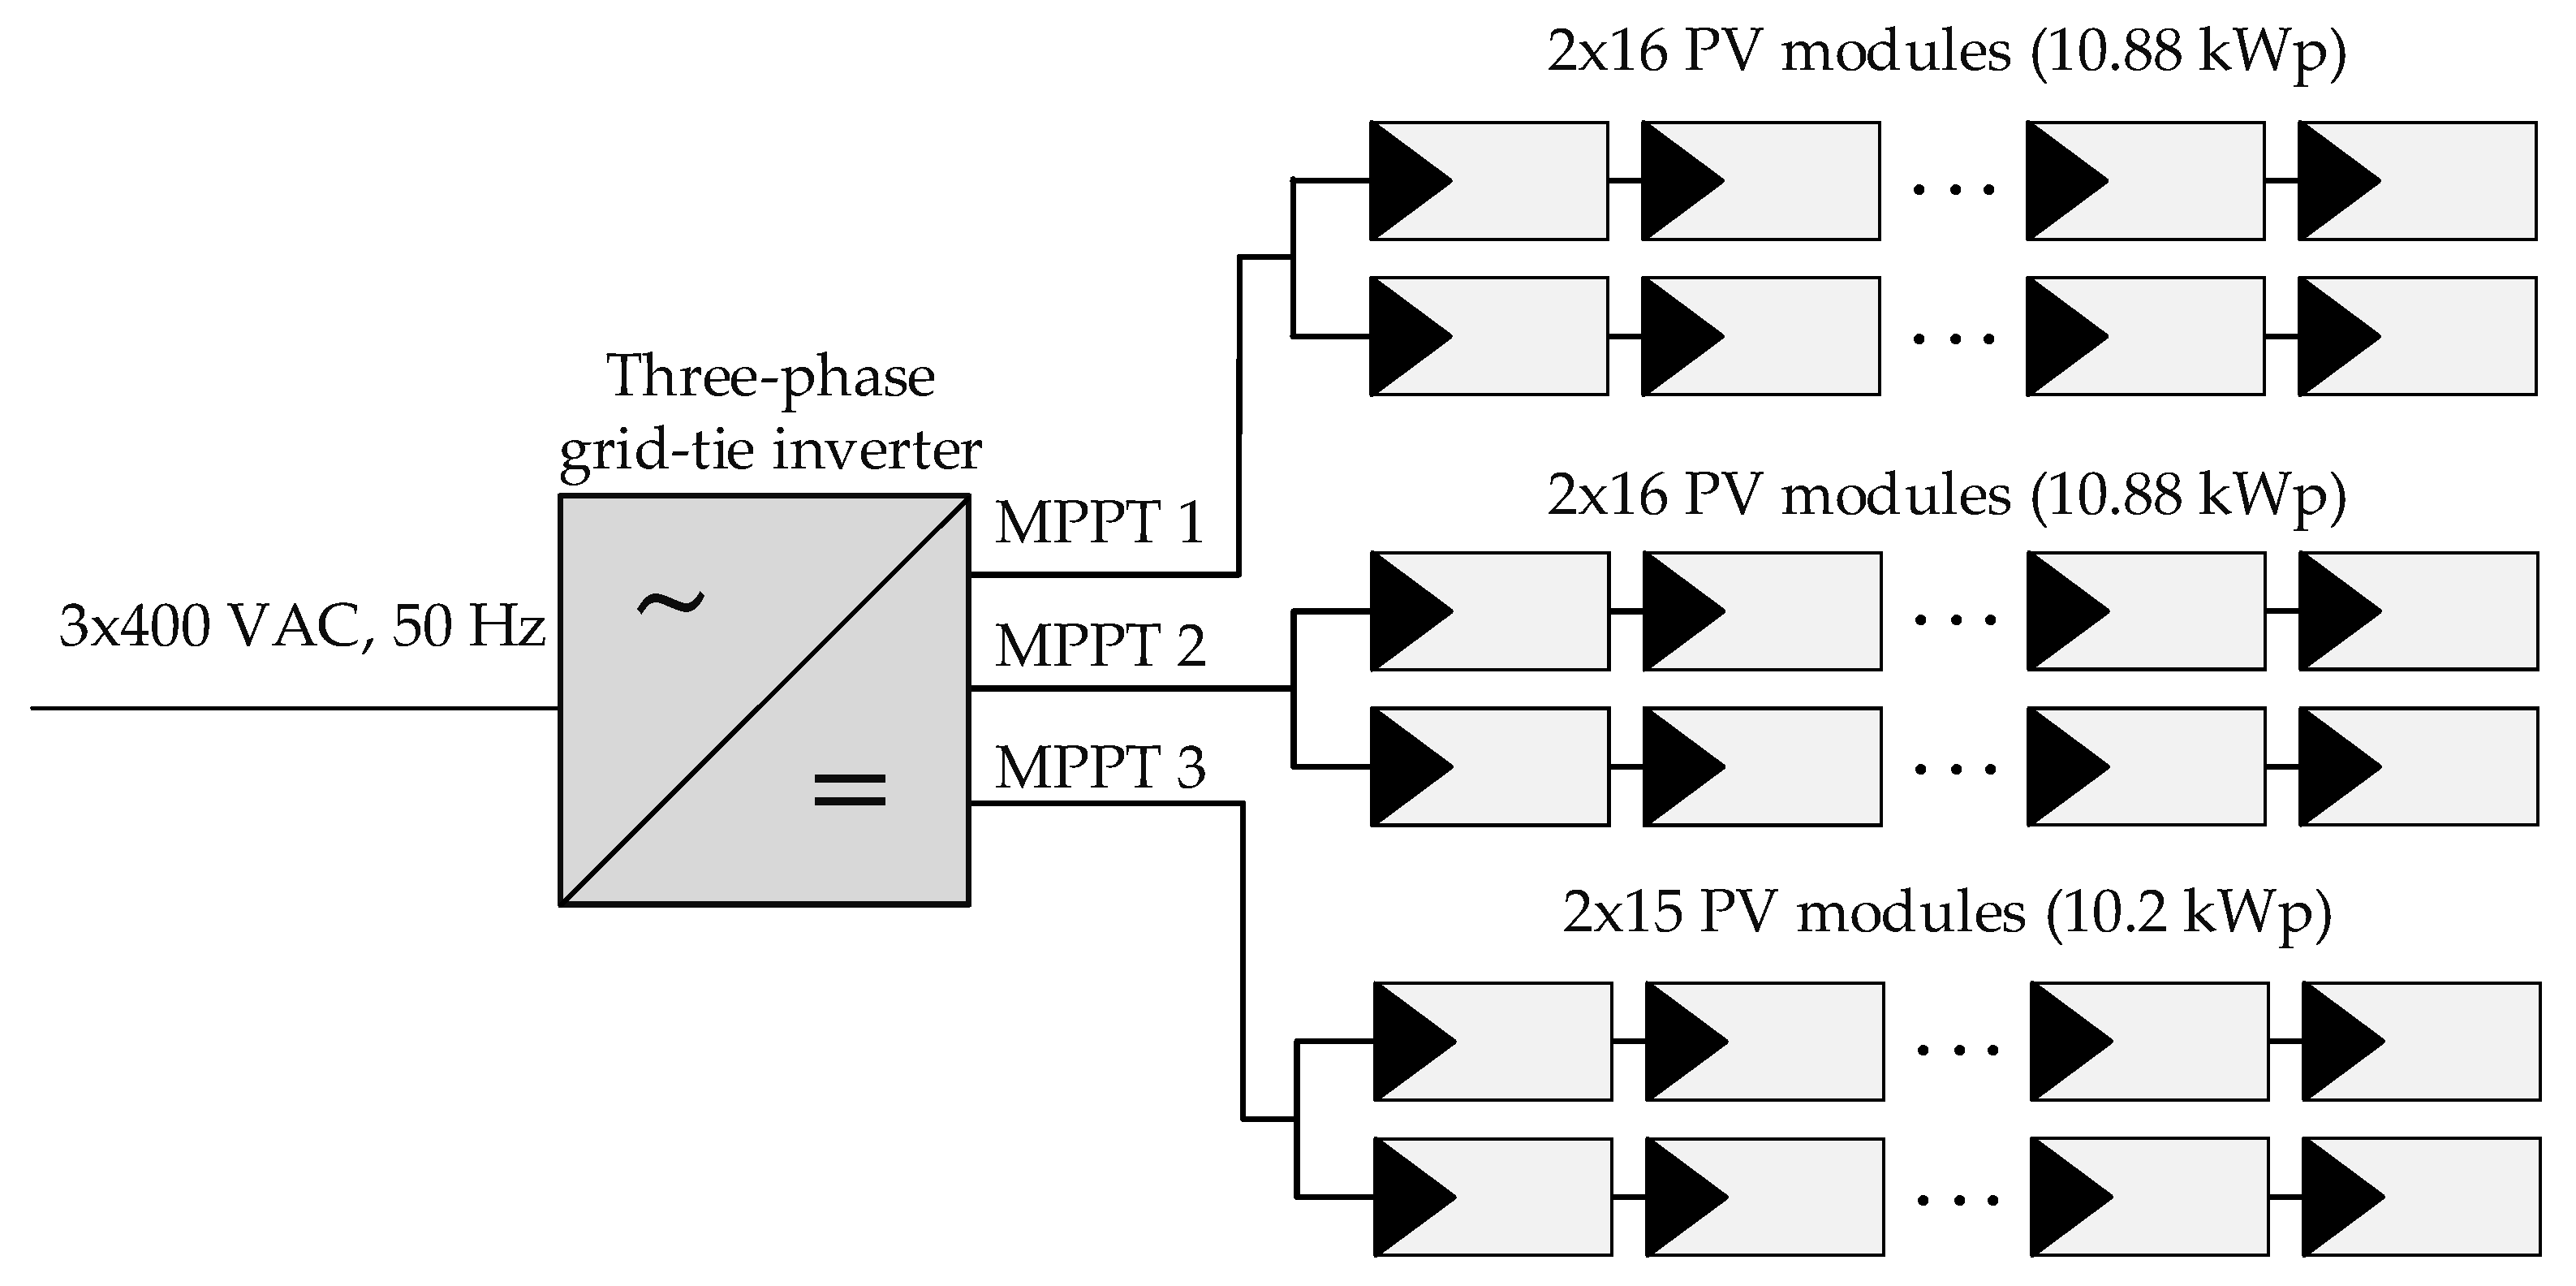
Applsci 12 00745 g003
Figure 4. The 30 kWp PV plant layout.
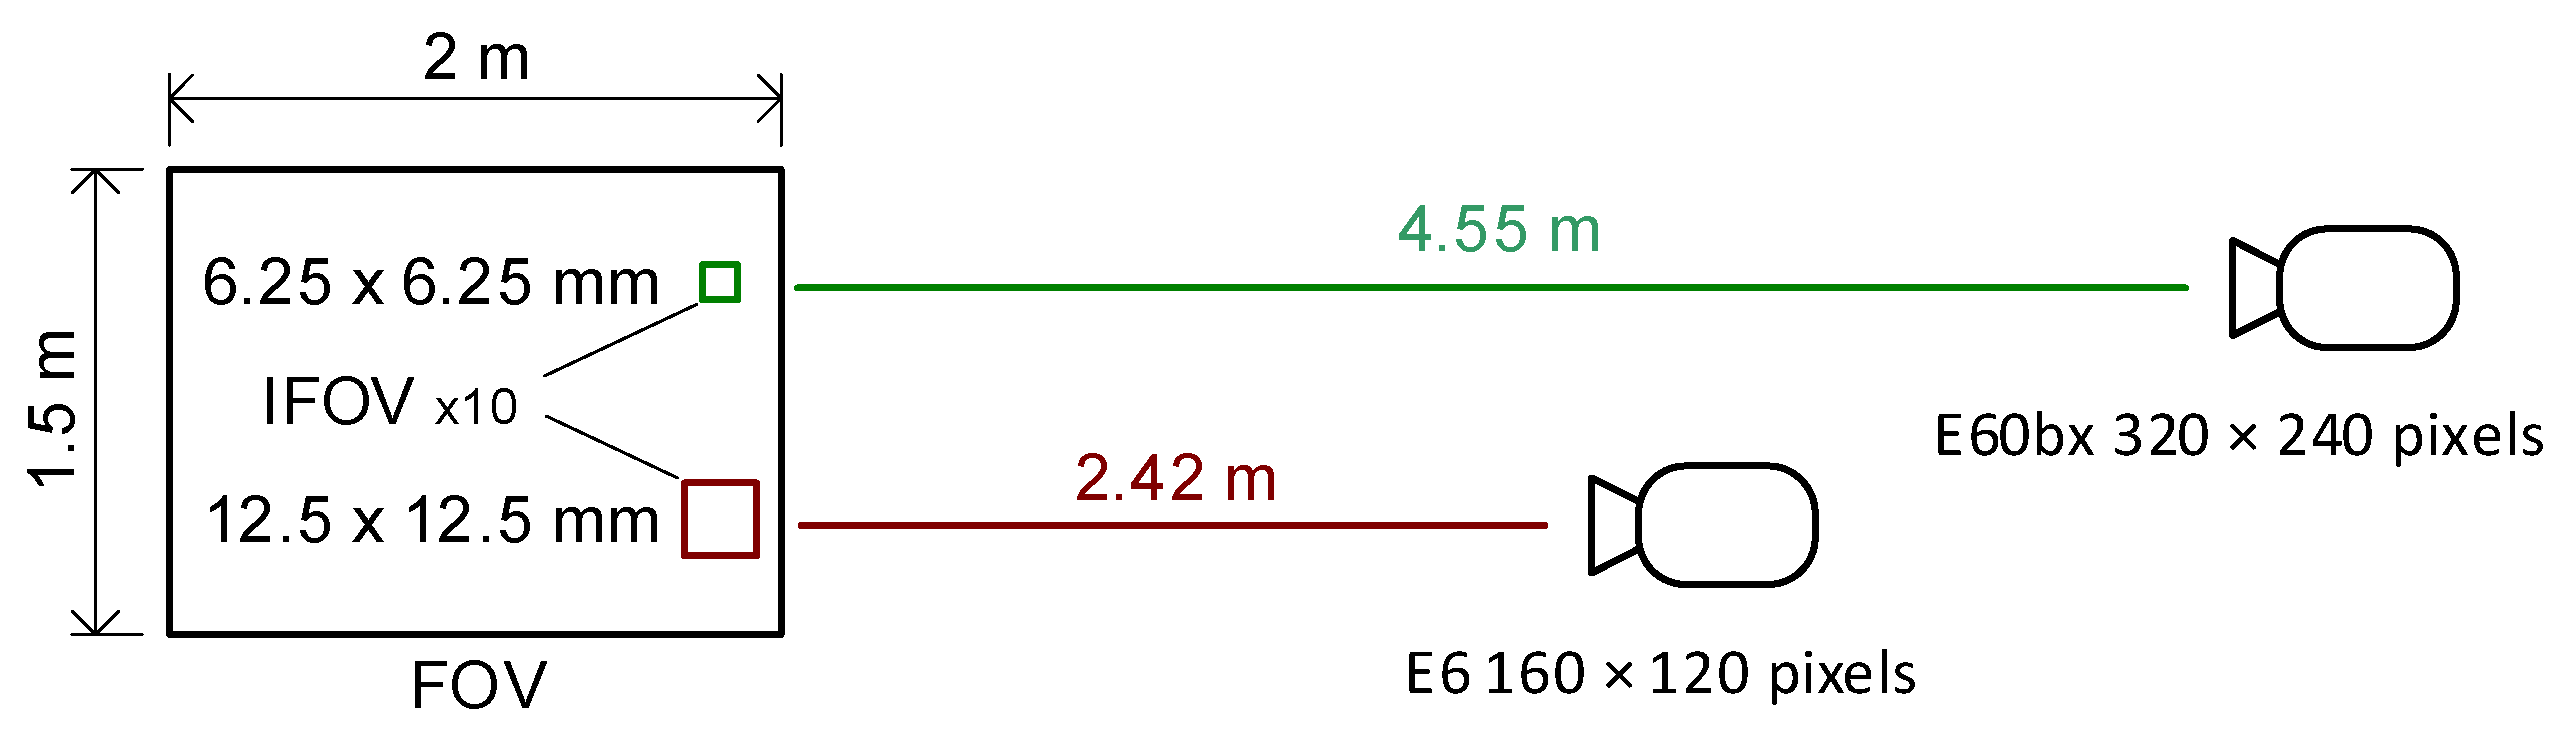
Applsci 12 00745 g004
Figure 5. FOV and IFOV of the available Flir E6 and Flir E60bx cameras.
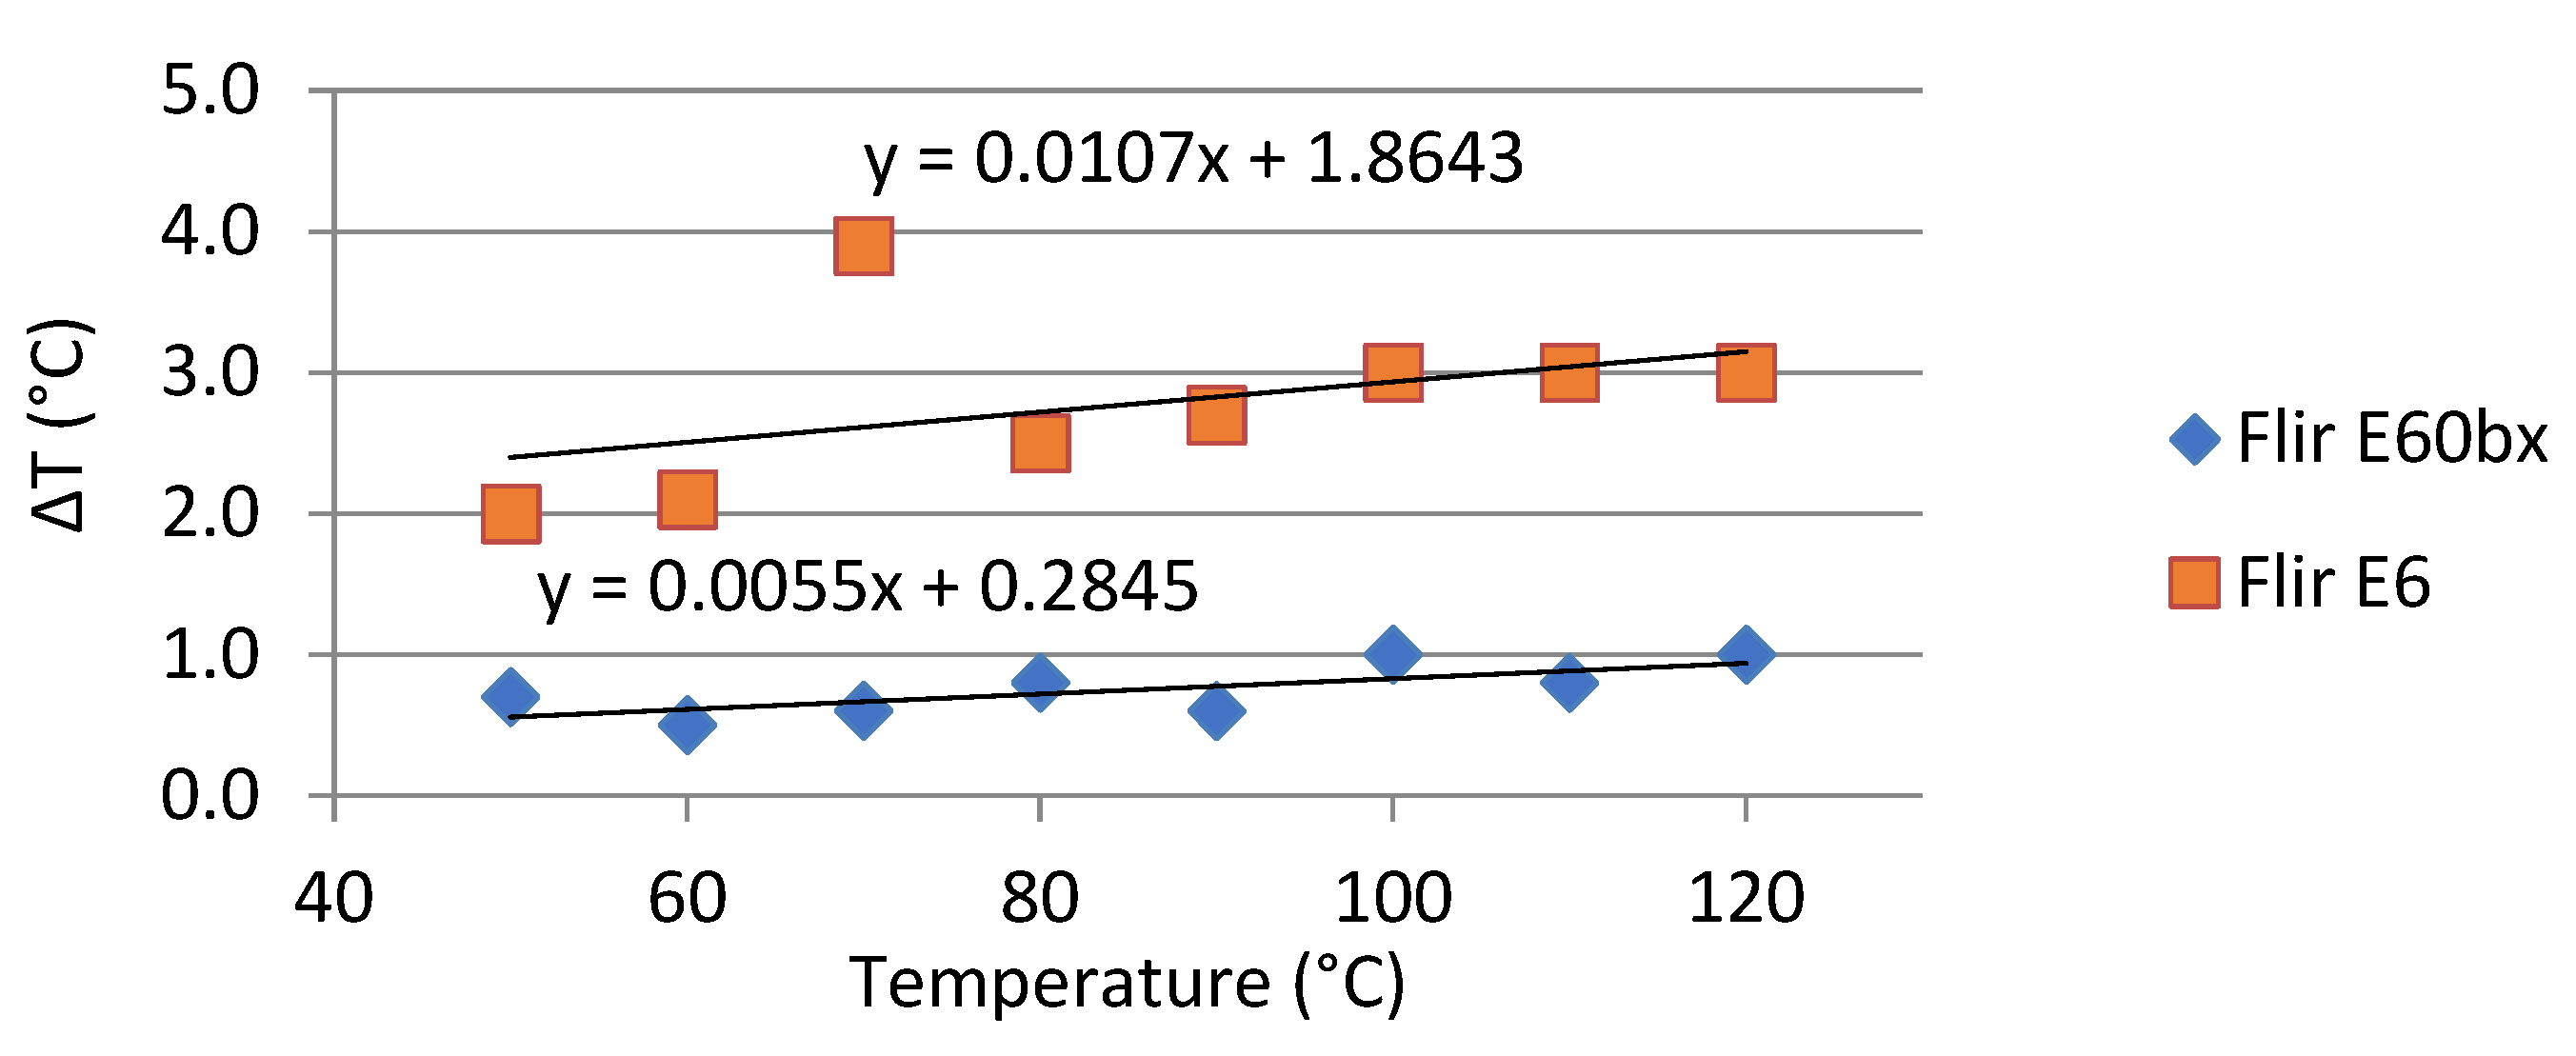
Applsci 12 00745 g005
Figure 6. Calibration results of the Flir E6 and Flir E60bx cameras.
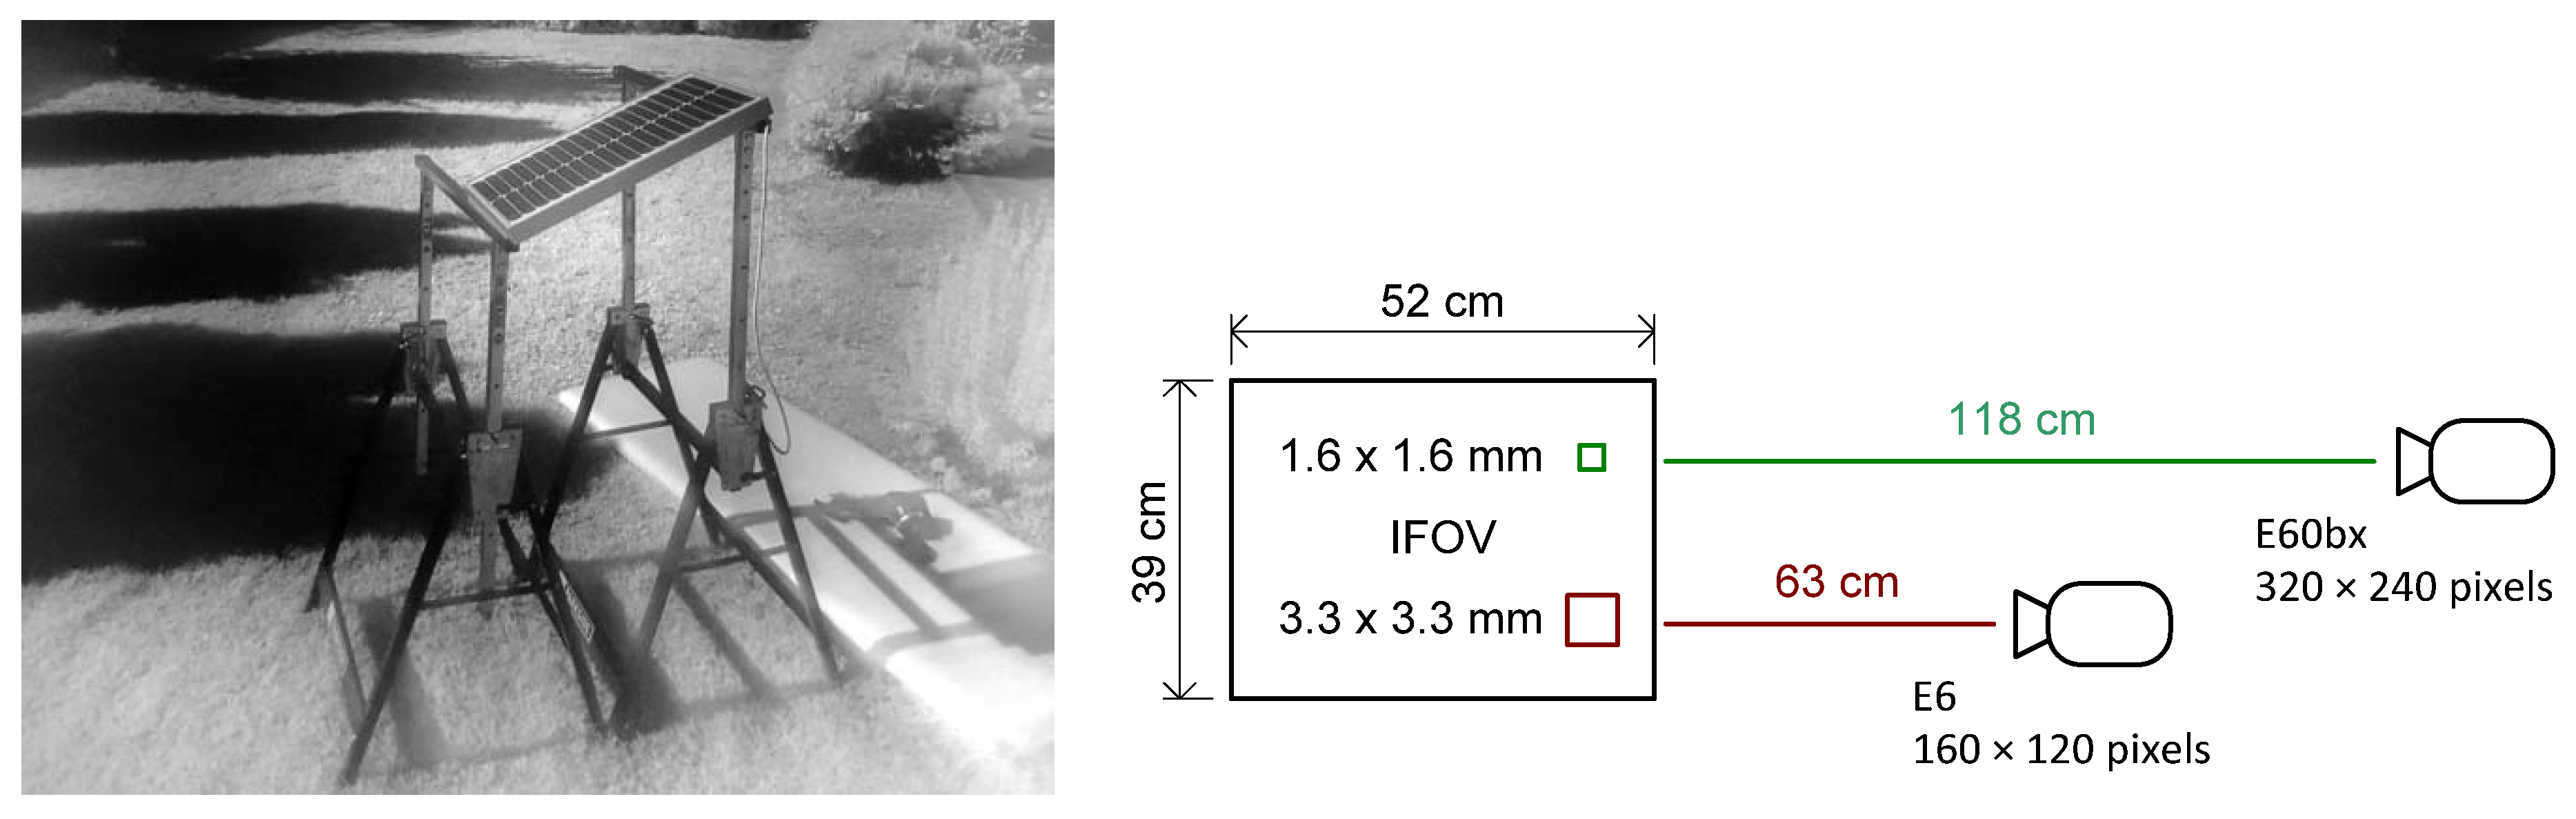
Applsci 12 00745 g006
Figure 7. Photograph of the pilot setup, taken at 720 nm.
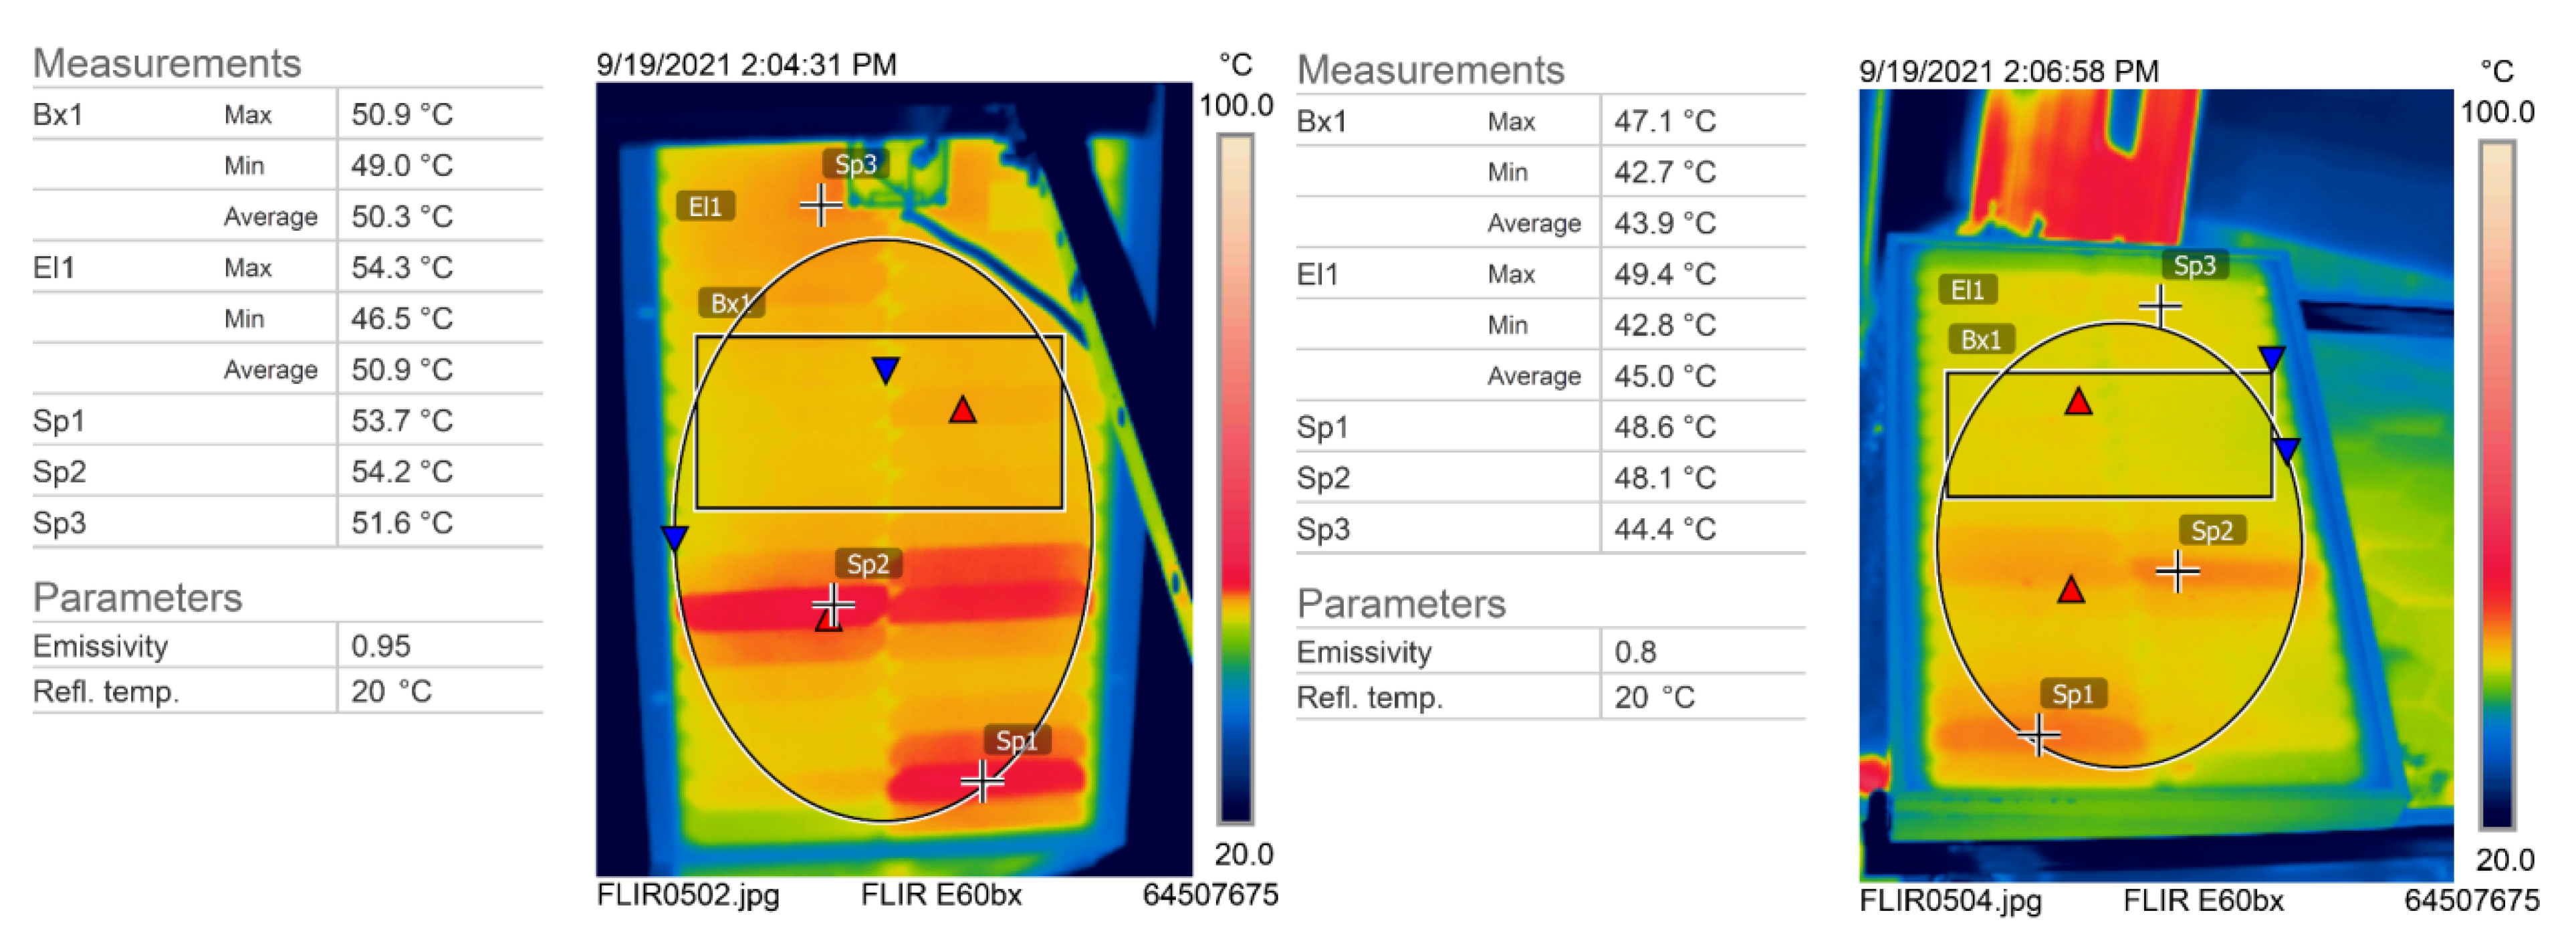
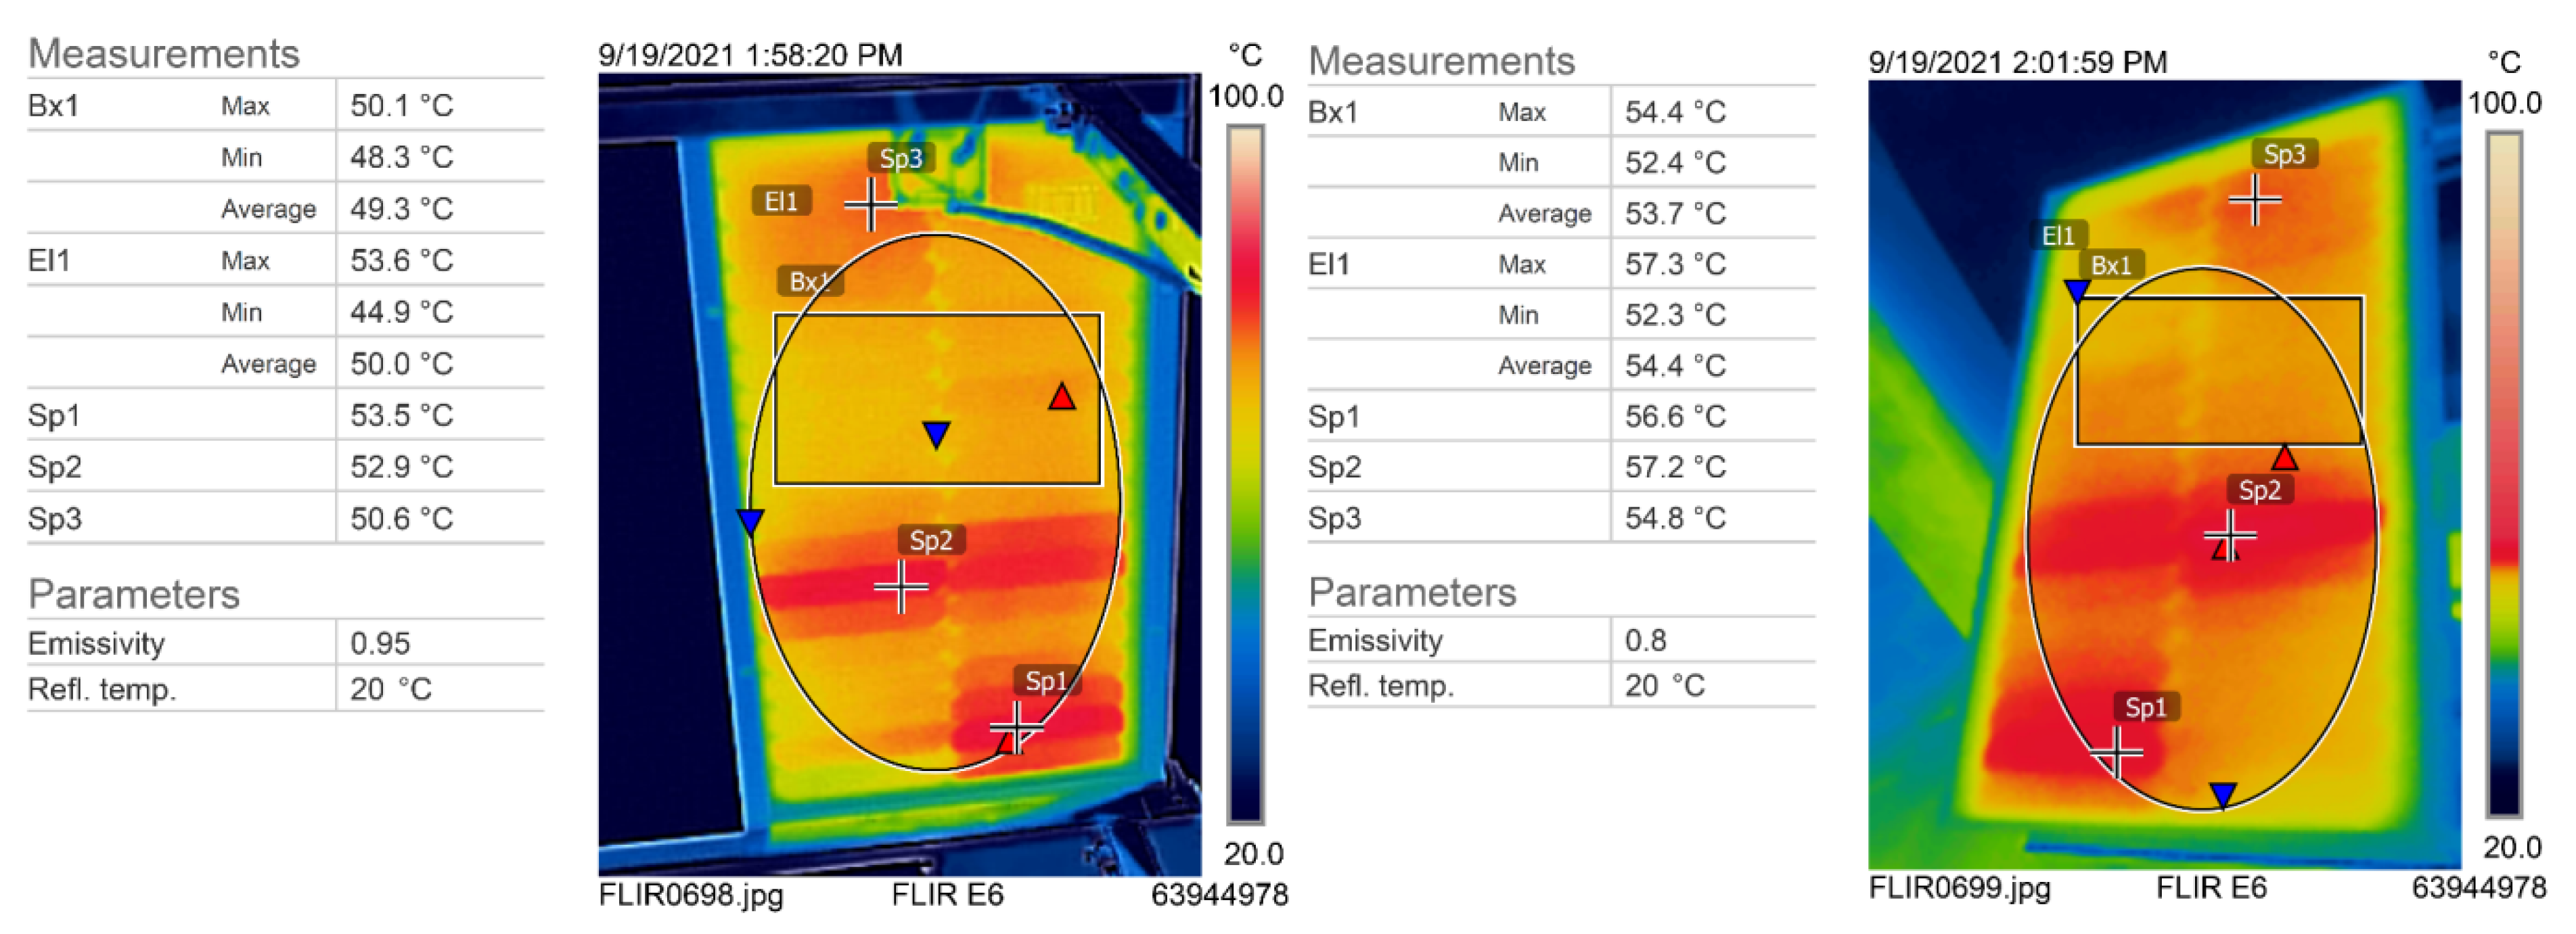
Applsci 12 00745 g007
Figure 8. Pilot module thermogram recorded by the FLIR E60bx camera: bottom side (left), top side (right).
Applsci 12 00745 g008
Figure 9. Pilot module thermogram recorded with the FLIR E6 camera: bottom side (left), top side (right).
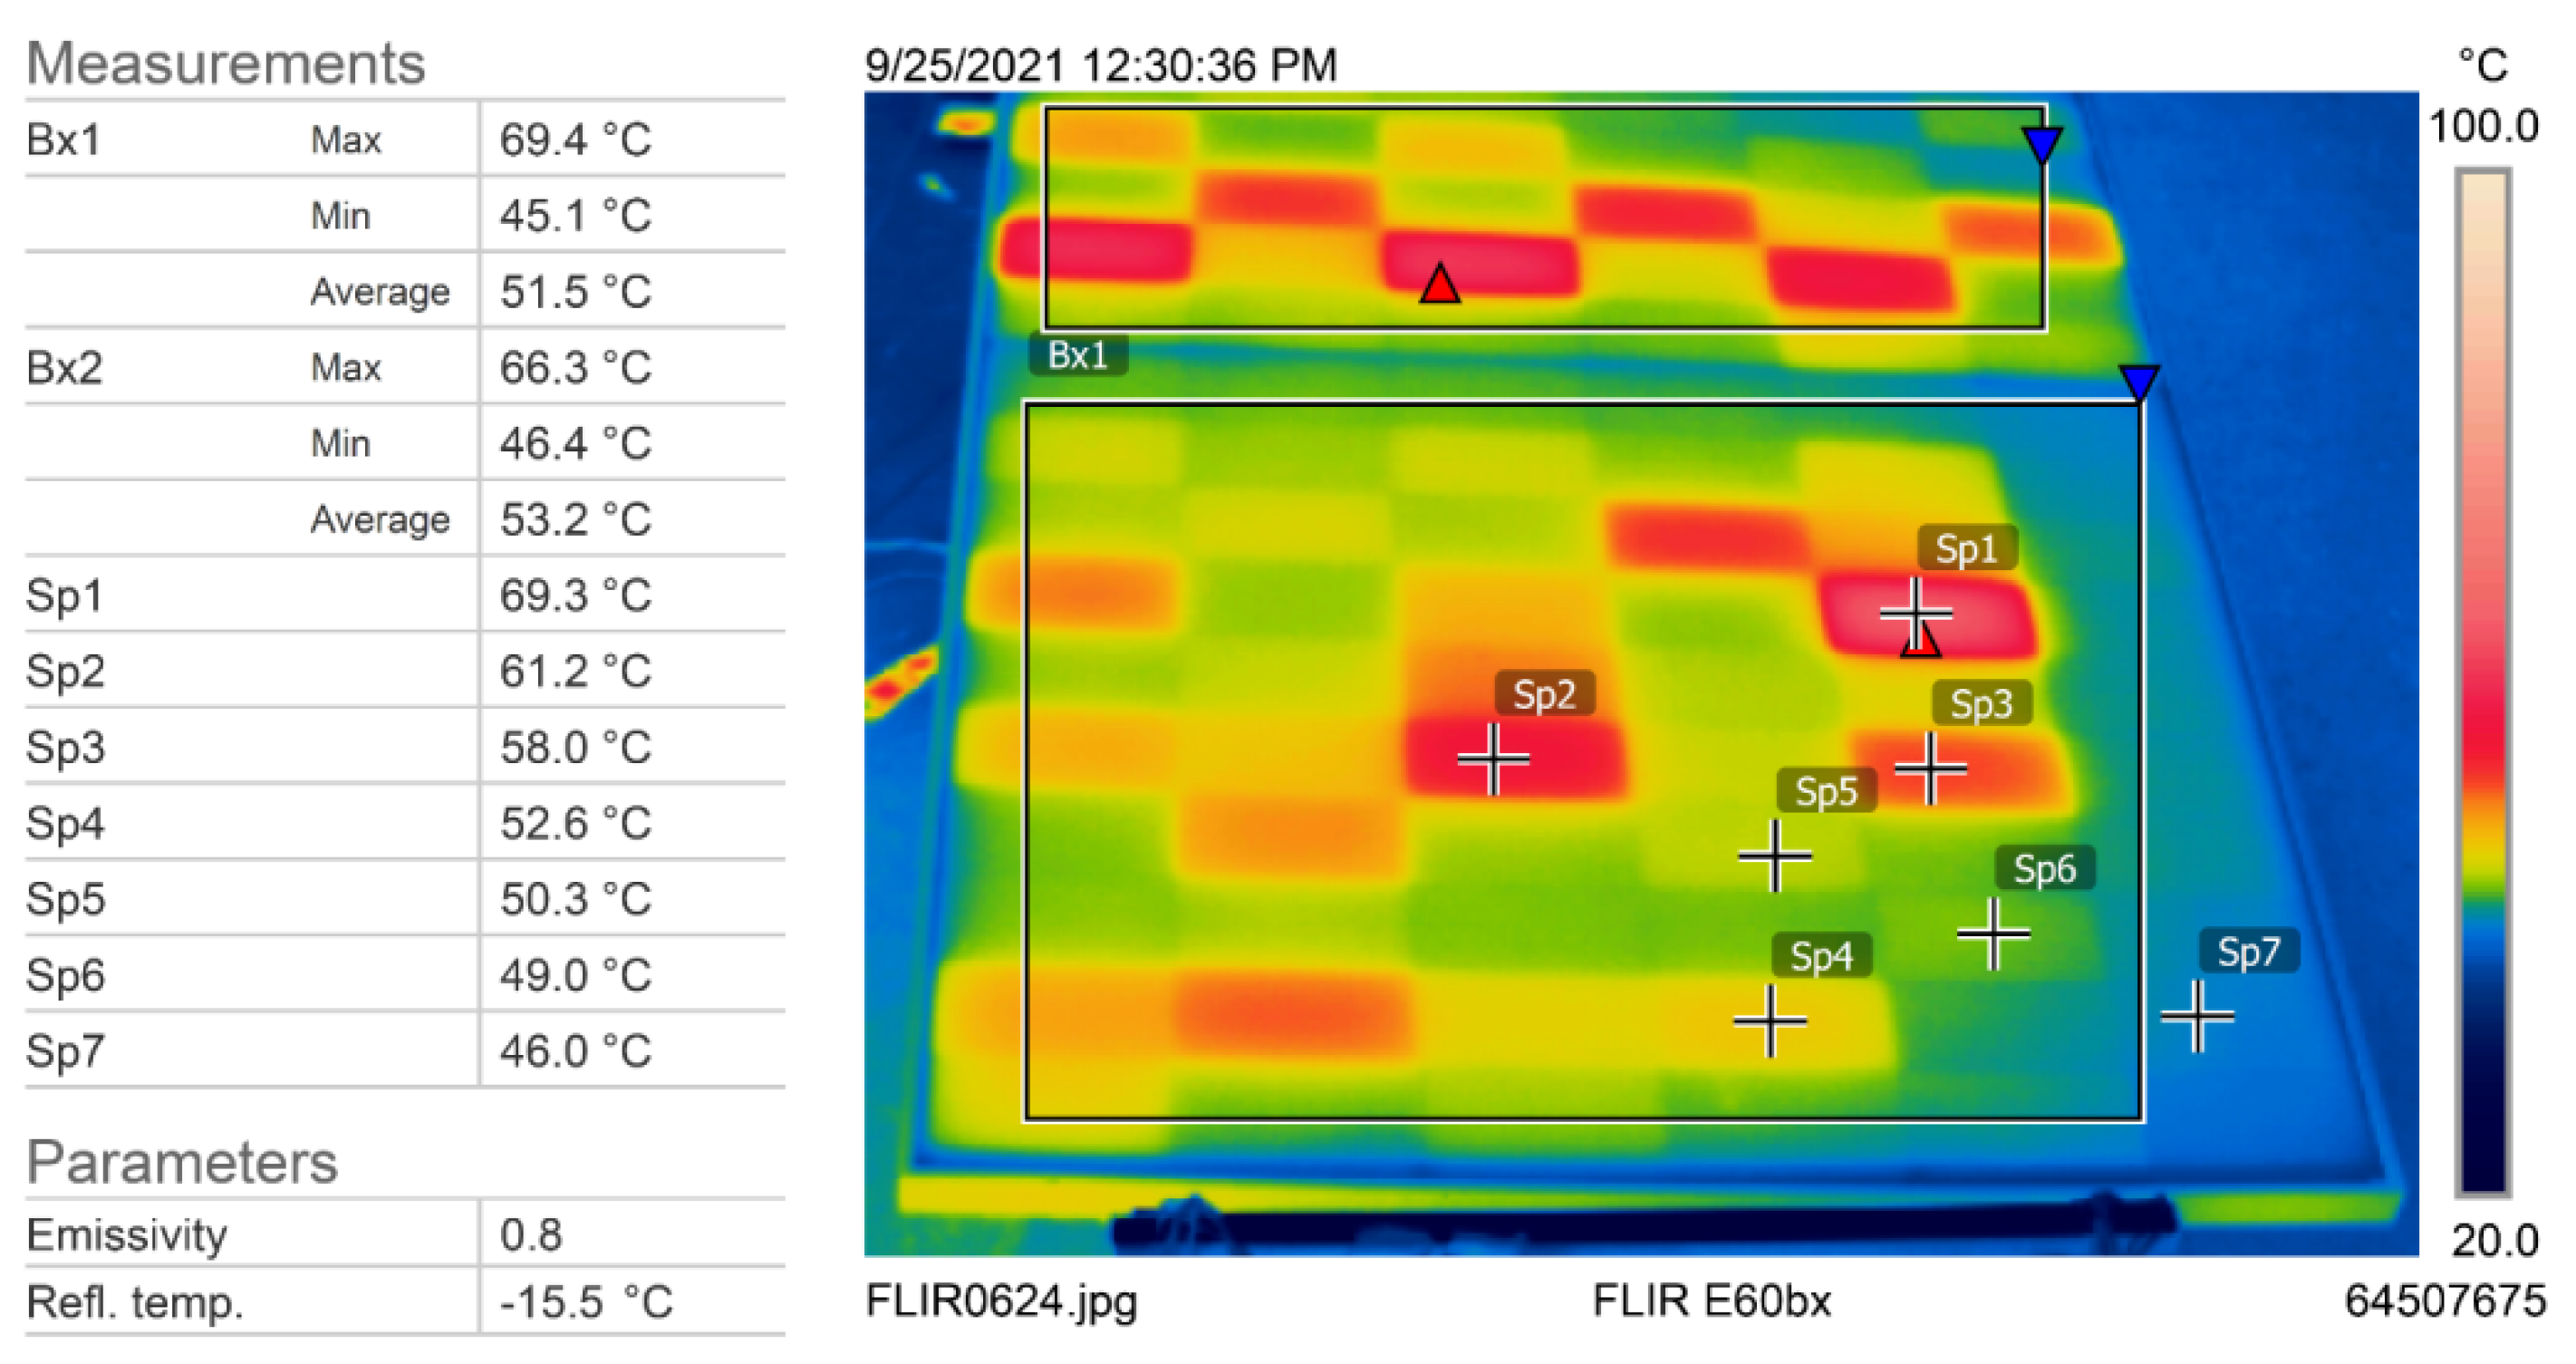
Applsci 12 00745 g009
Figure 10. Thermography analysis of the new module.
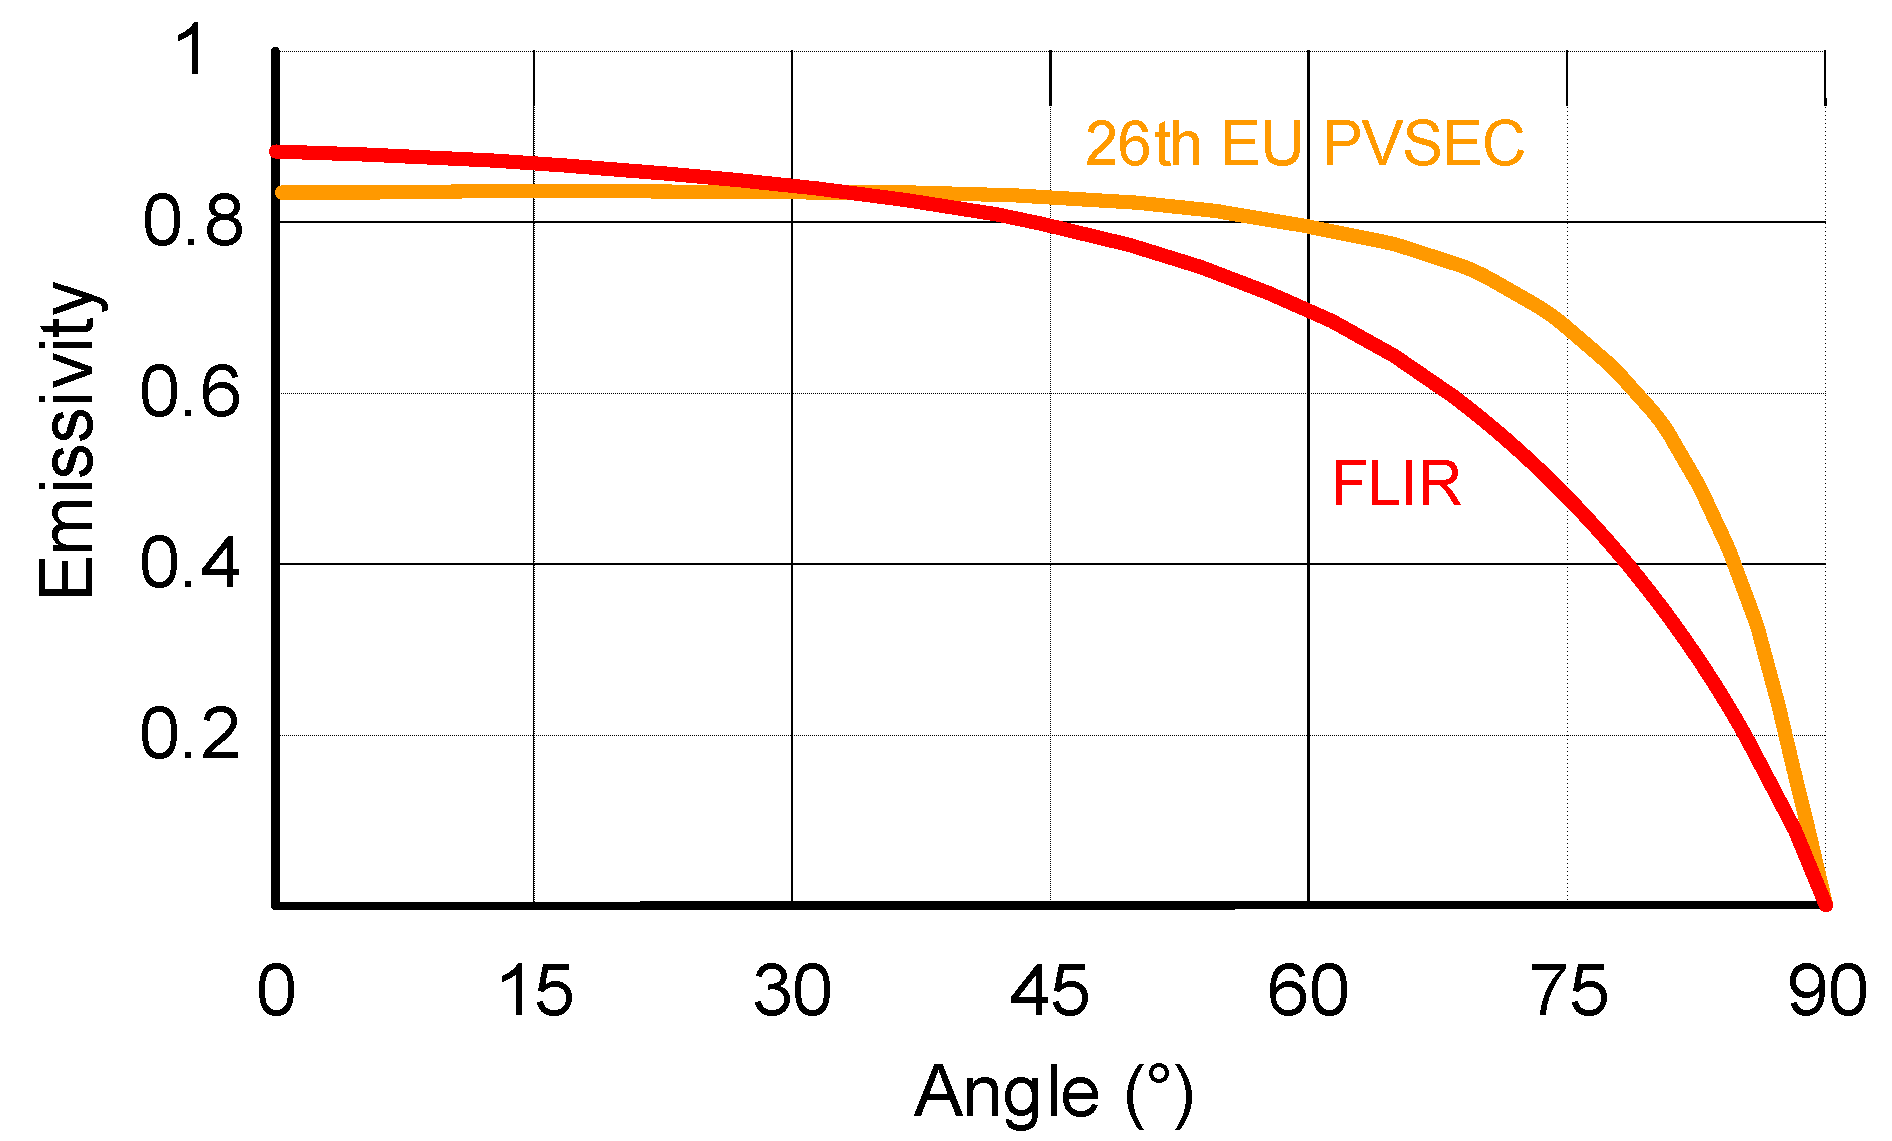
Applsci 12 00745 g010
Figure 11. Emissivity of glass as a function of reflection angle.
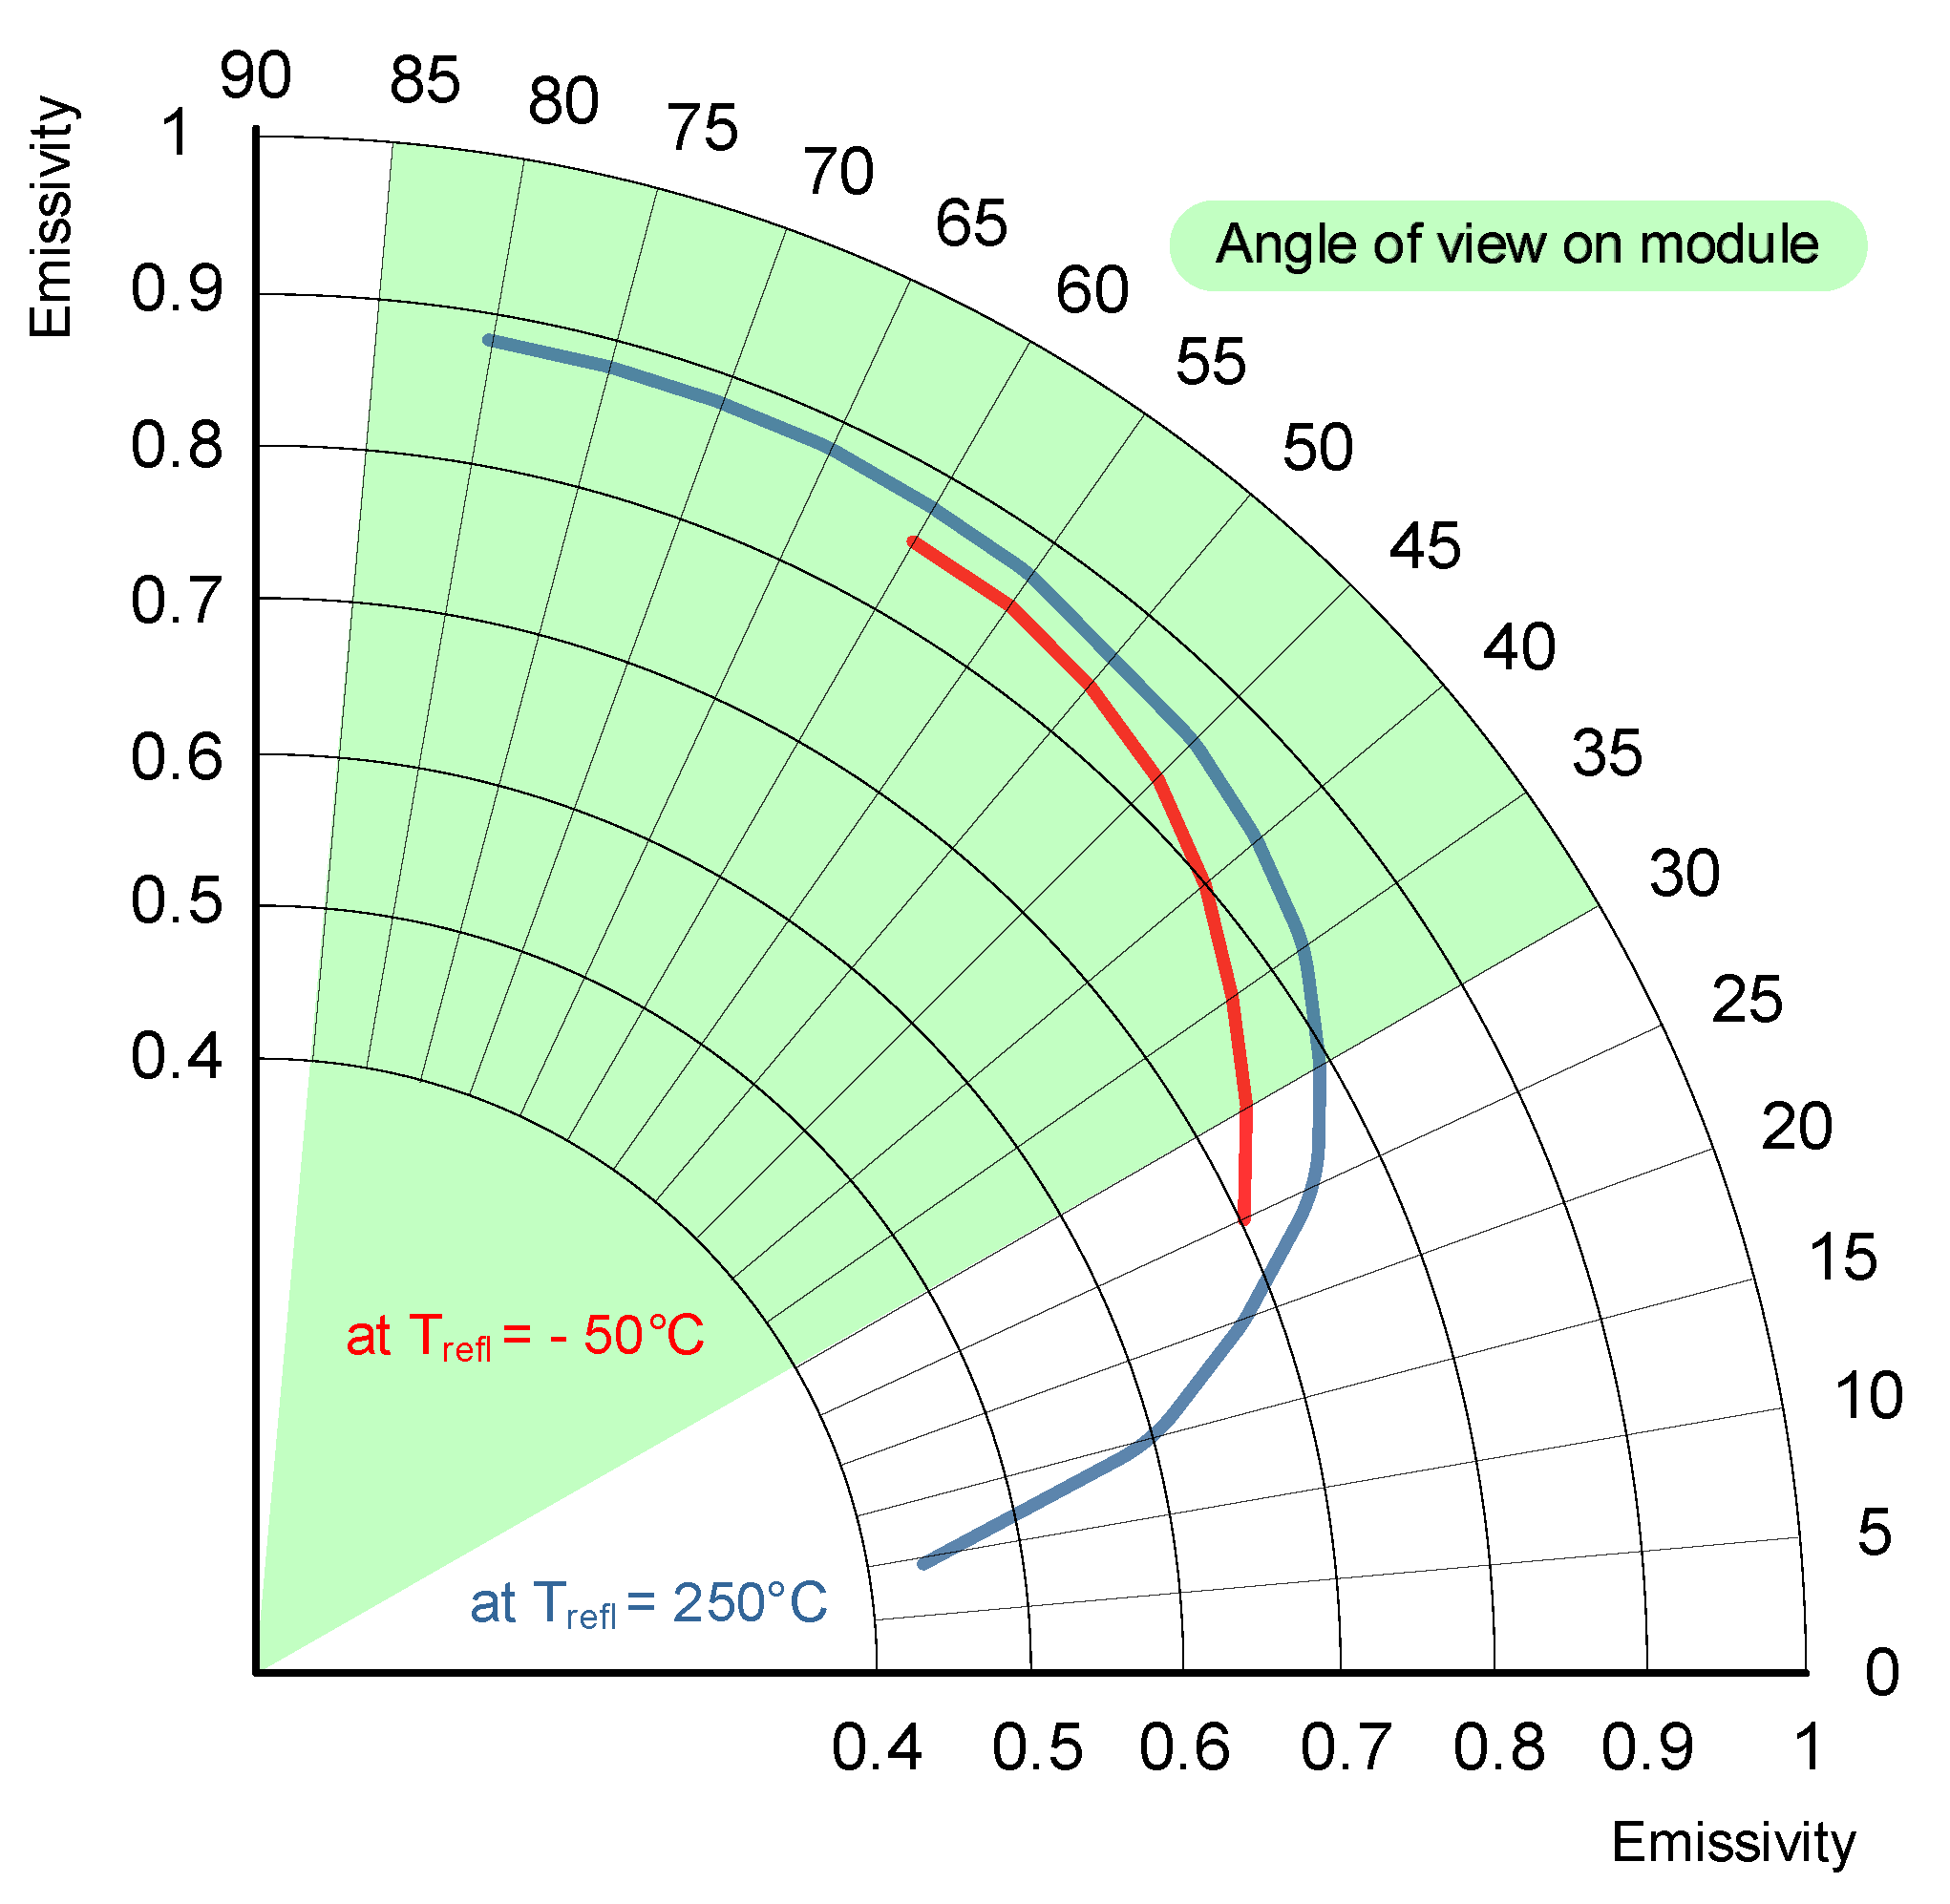
Applsci 12 00745 g011
Figure 12. Dependence of module emissivity on the shooting angle.
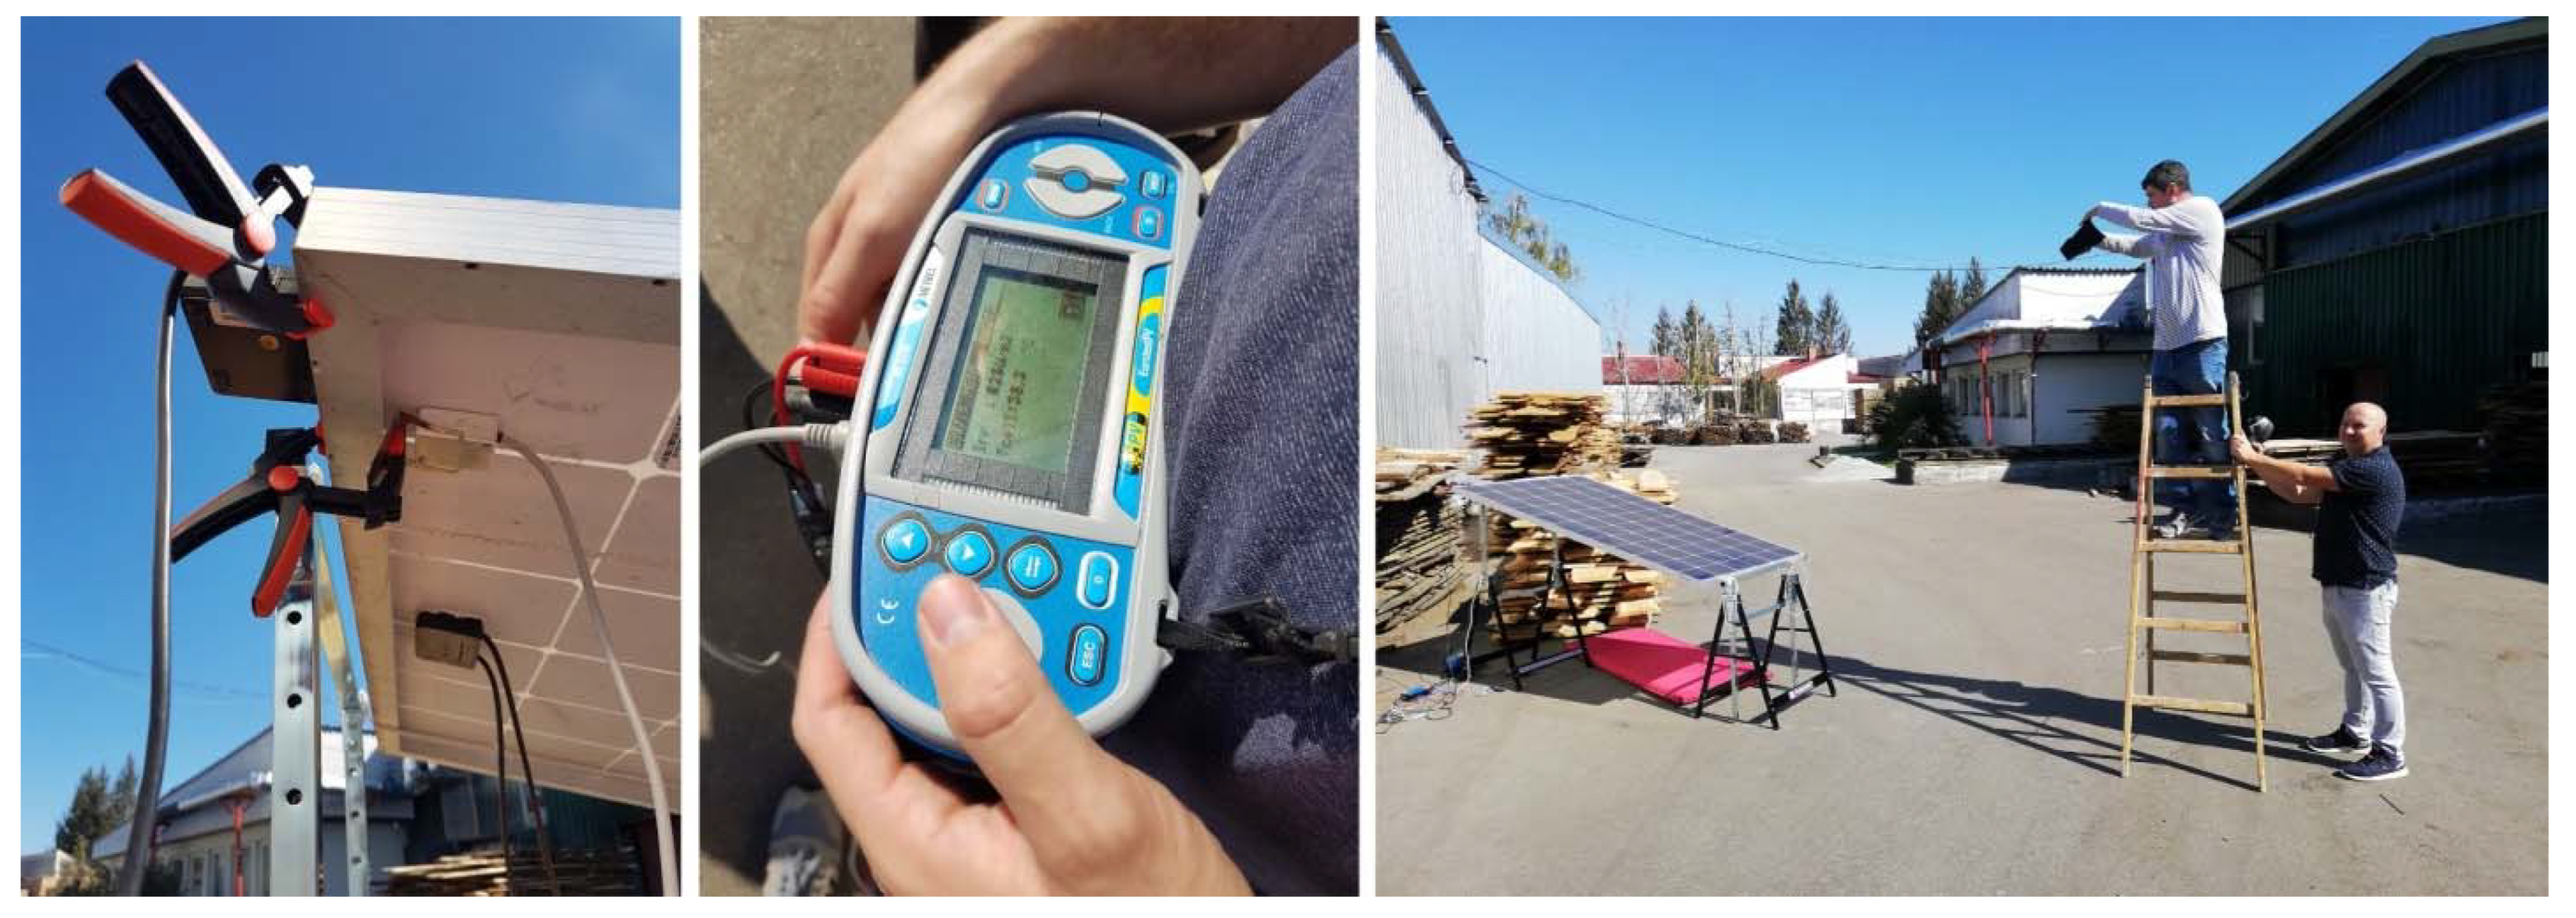
Applsci 12 00745 g012
Figure 13. Photo documentation of the measurement procedure.
Applsci 12 00745 g013
Figure 14. PV module I-V curve measurement procedure with the PV tester.
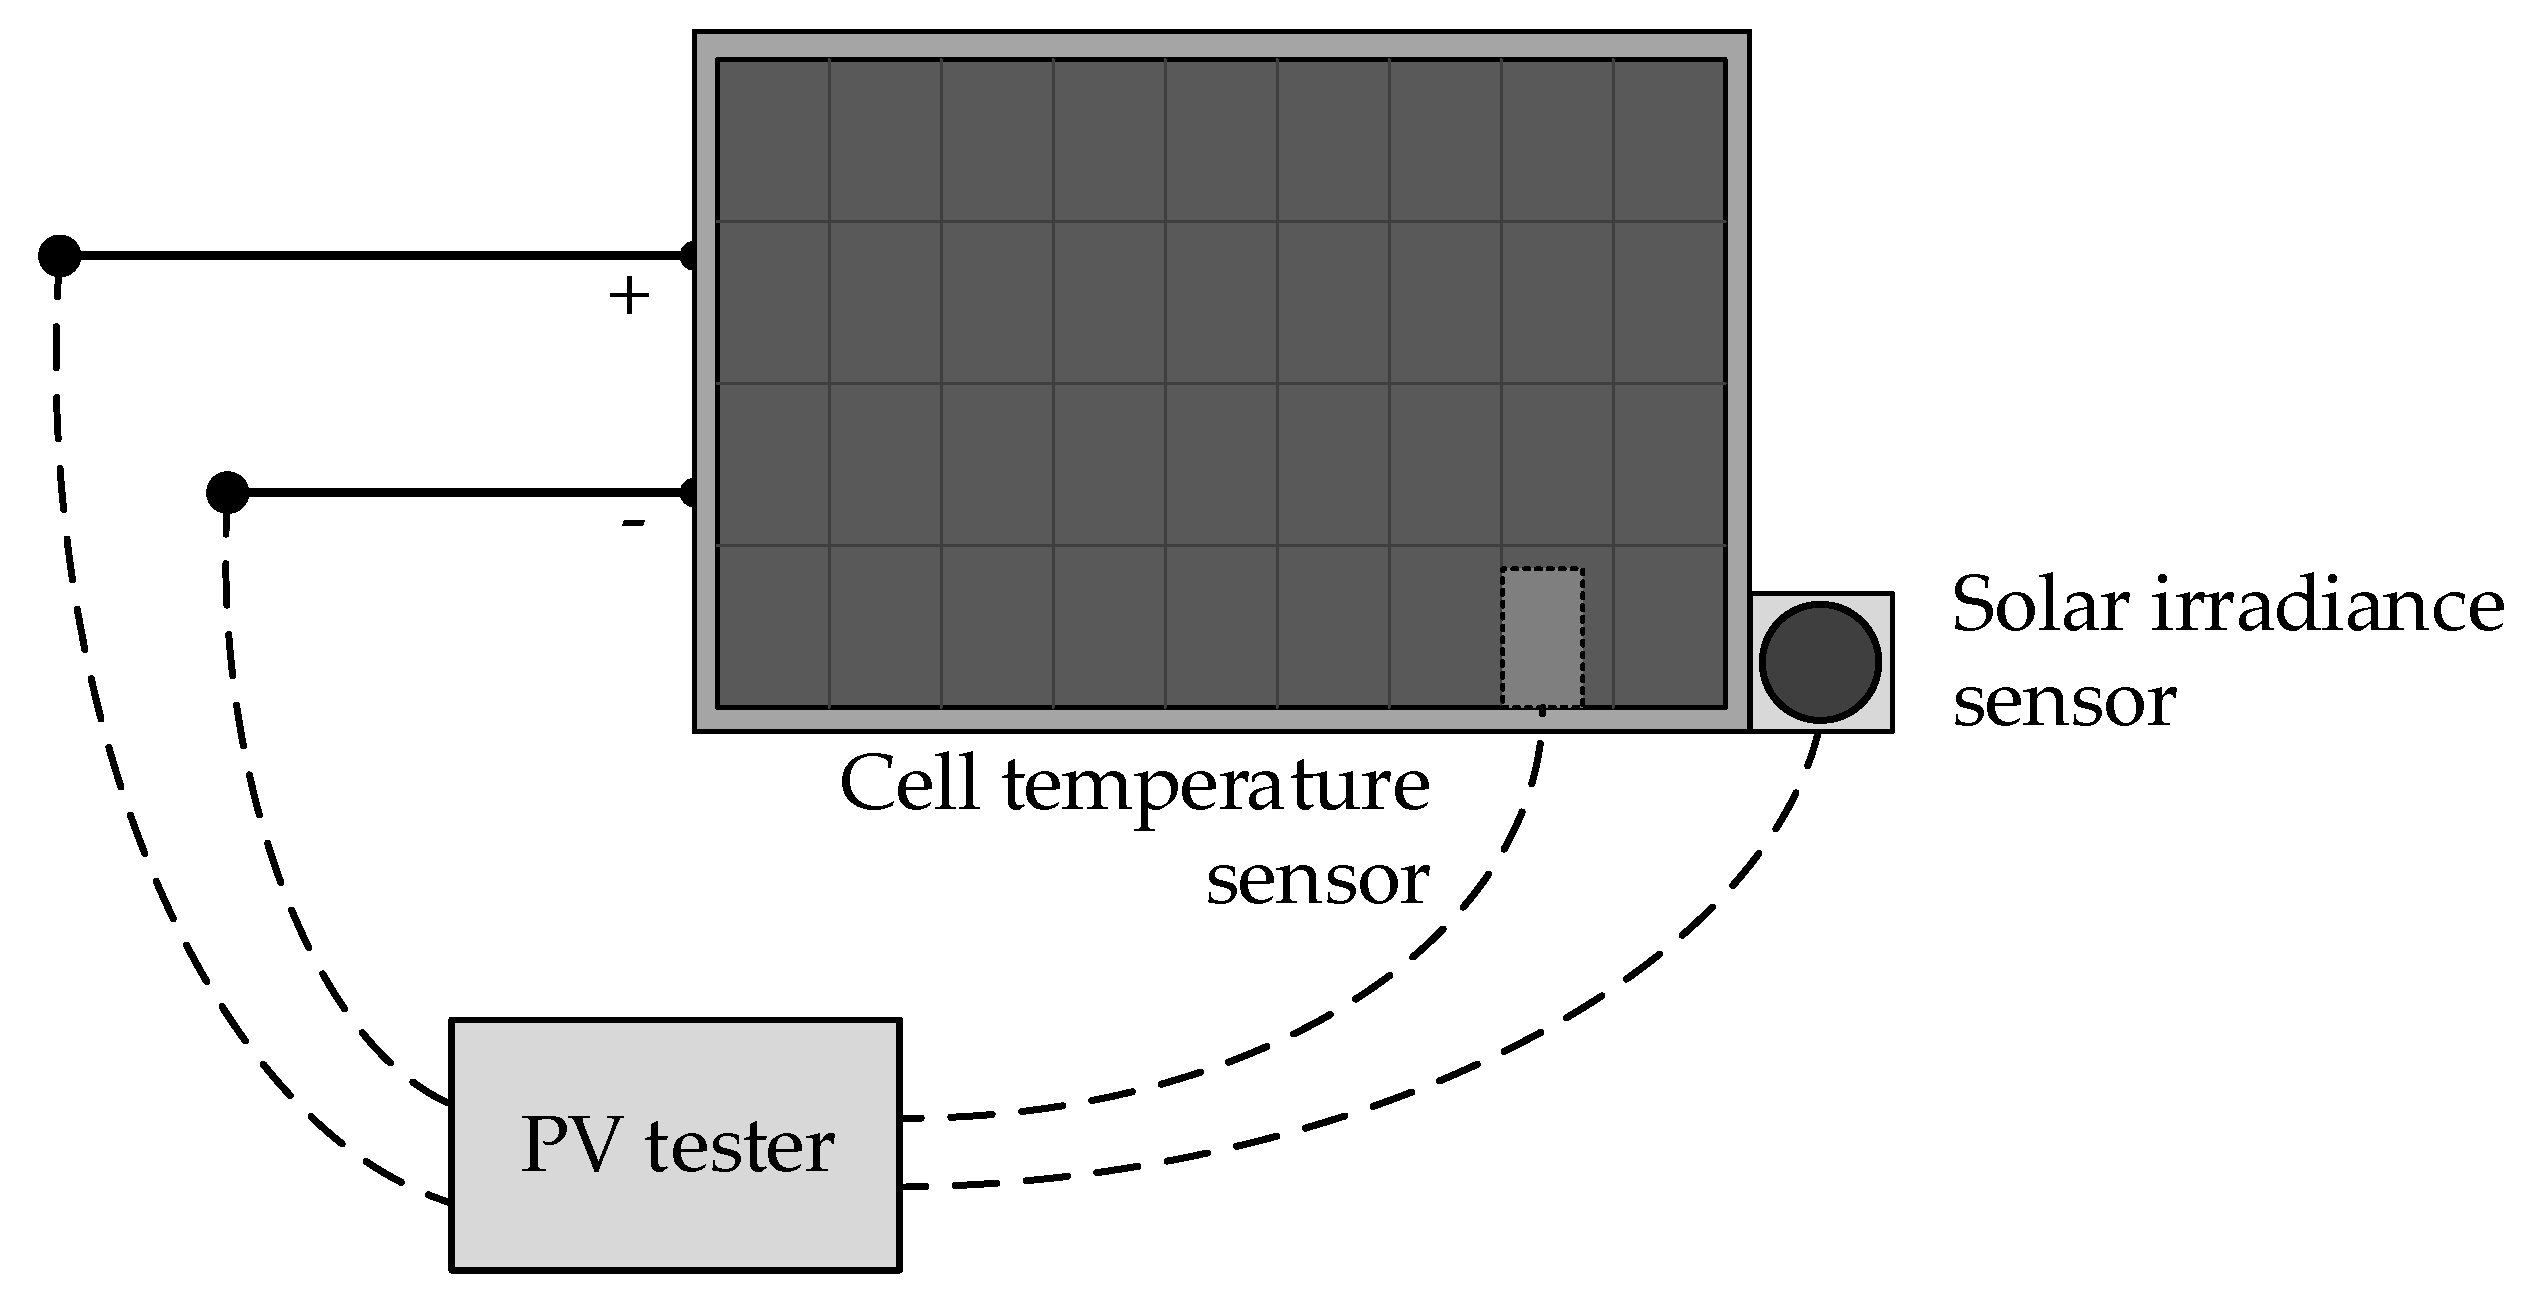
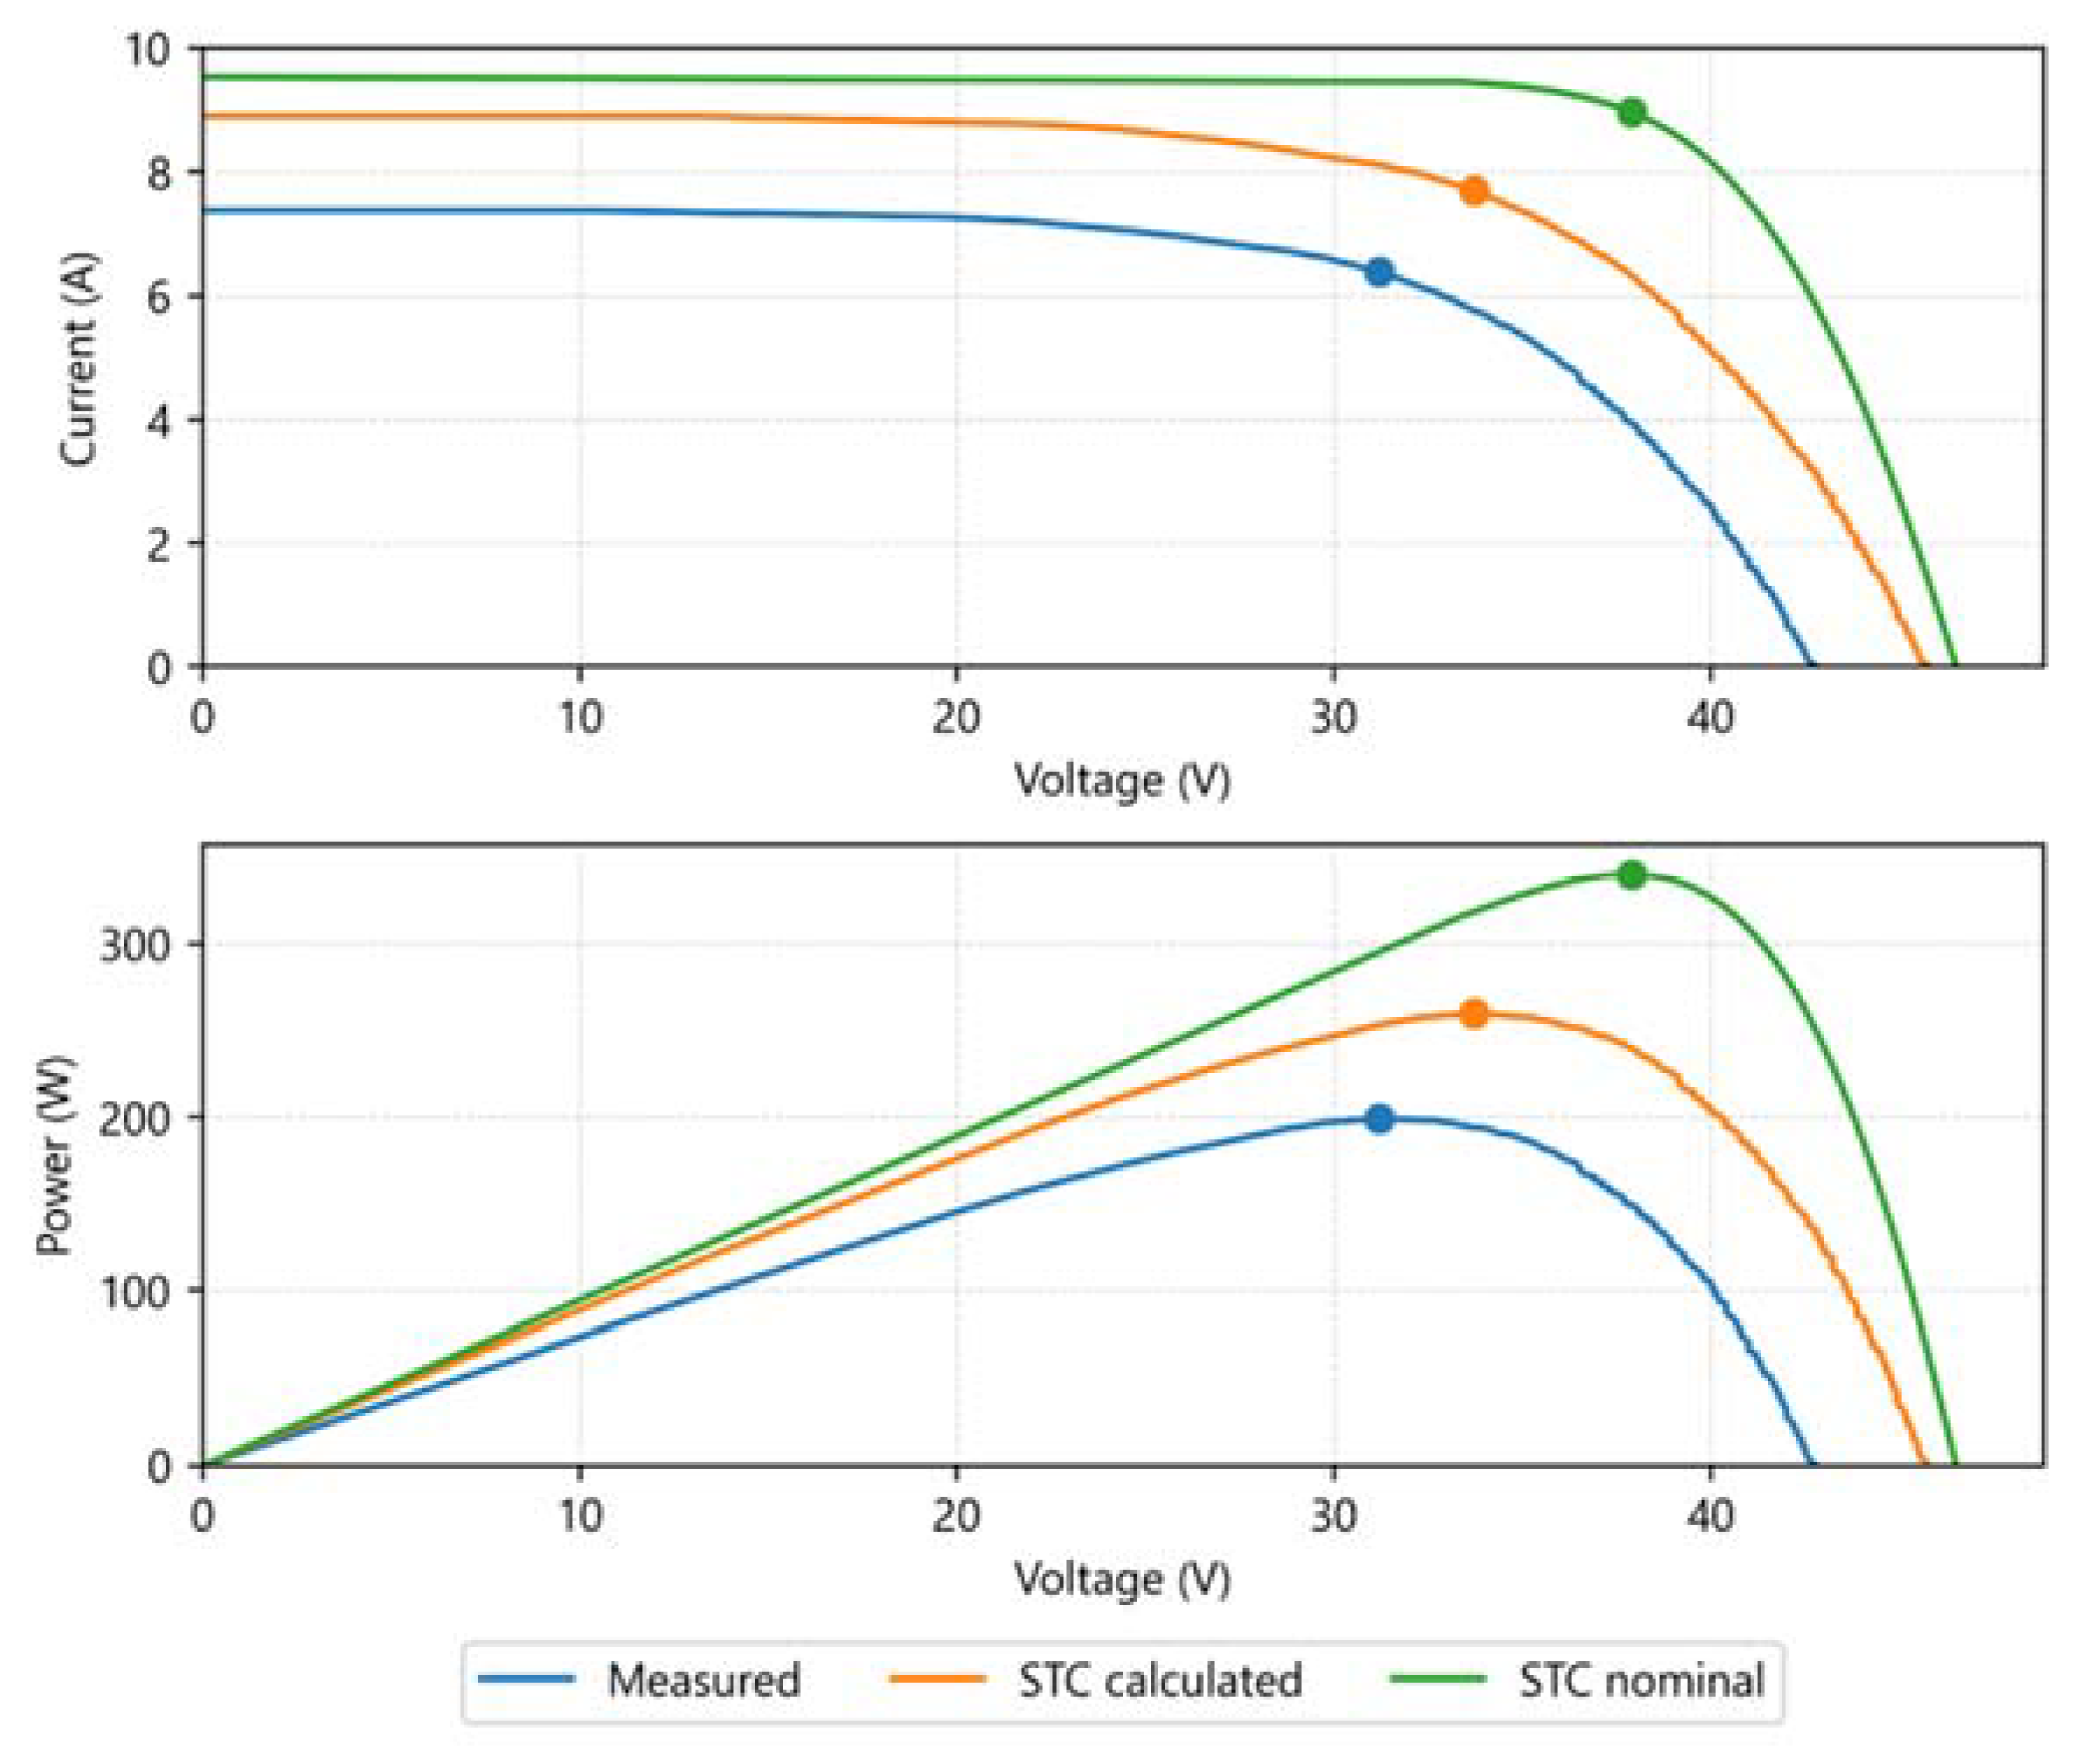
Applsci 12 00745 g014
Figure 15. I-V and P-V curves of the PV module 1 (washed).
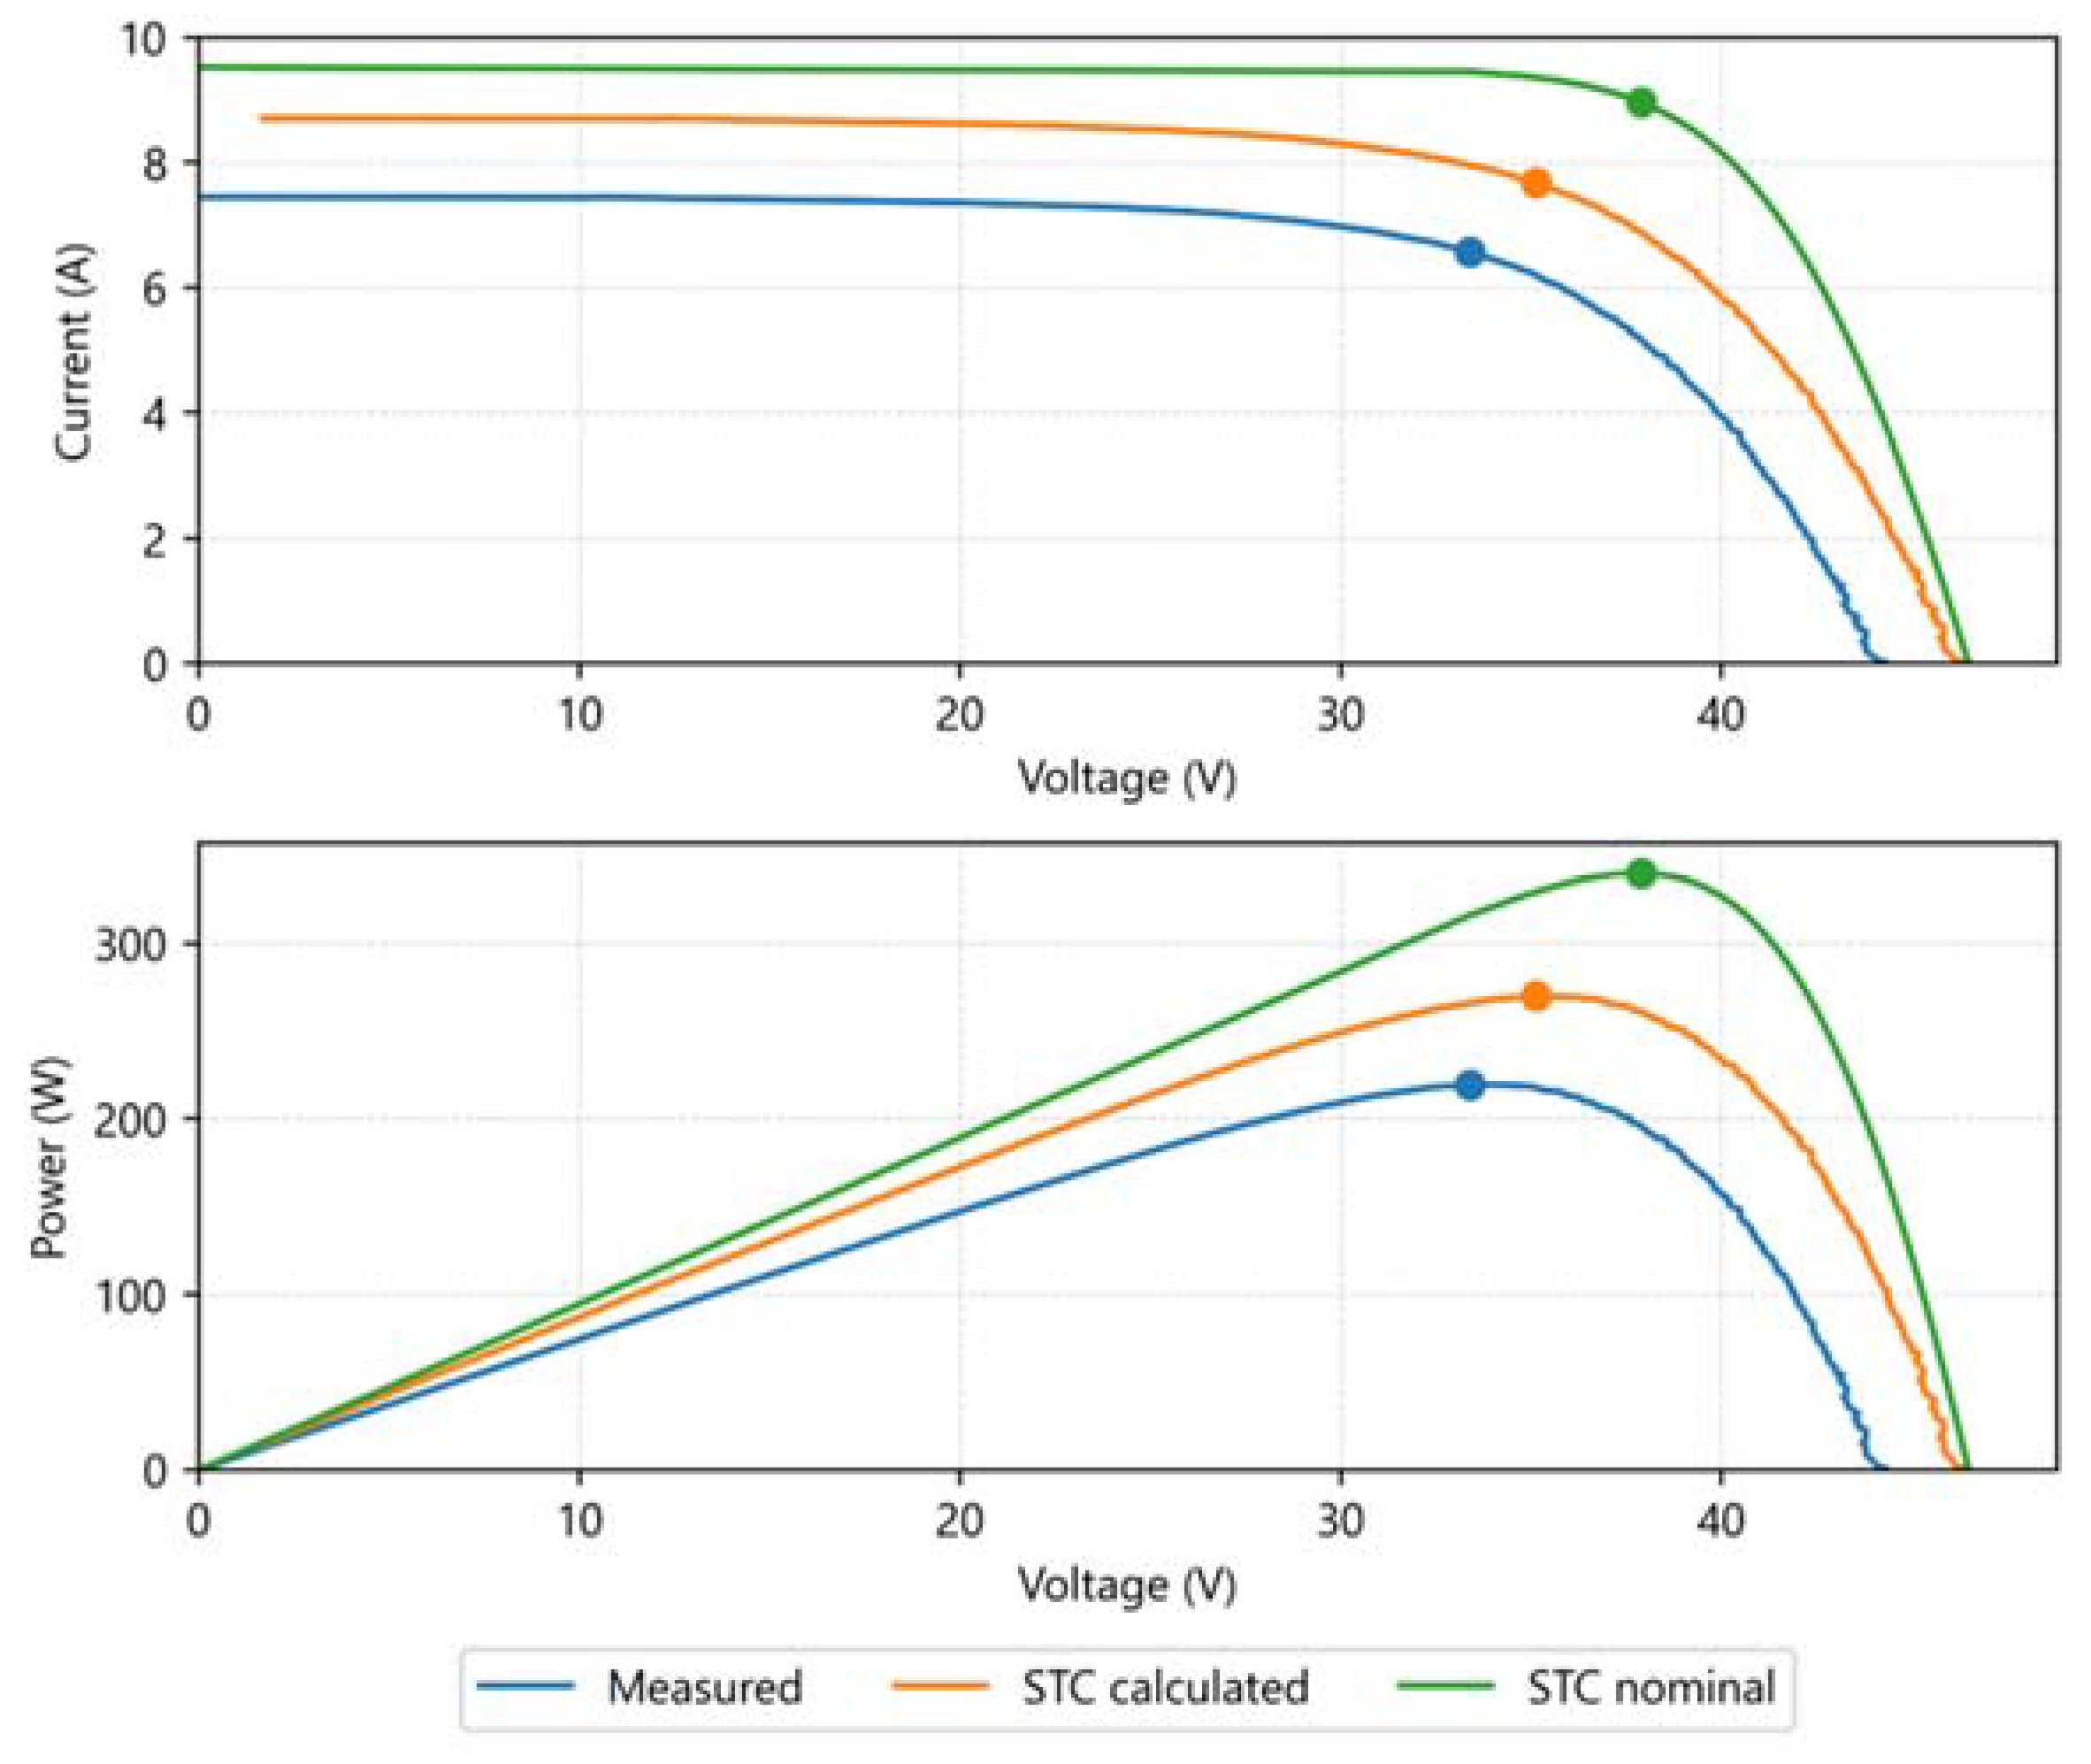
Applsci 12 00745 g015
Figure 16. I-V and P-V curves of the PV module 2 (washed).
Applsci 12 00745 g016
Figure 17. Thermographic analysis of the PV module 1 before and after washing.
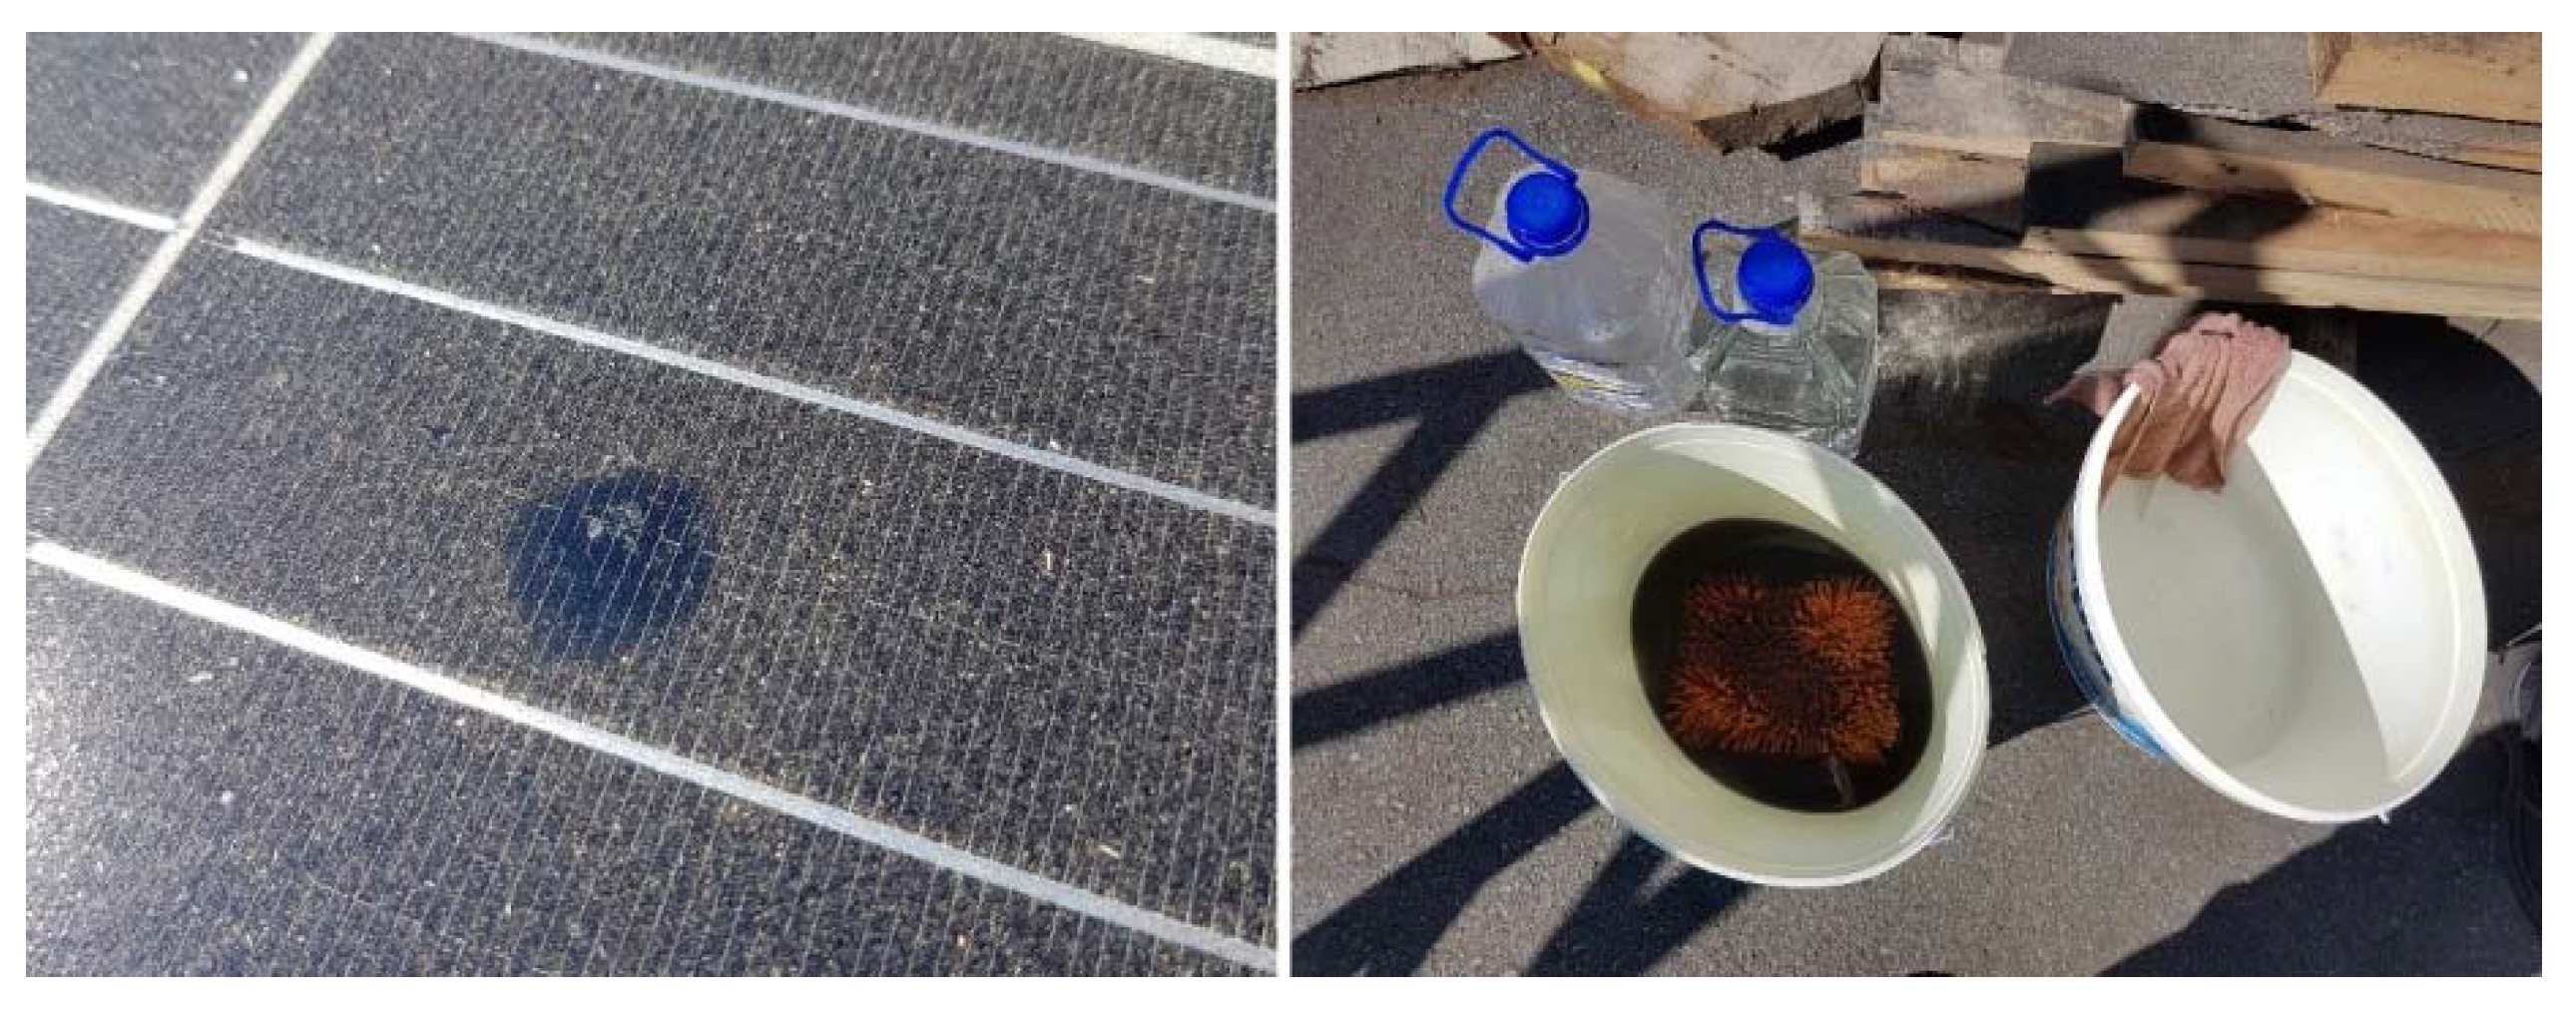
Applsci 12 00745 g017
Figure 18. Dusted PV module appearance and washing equipment used for cleaning.
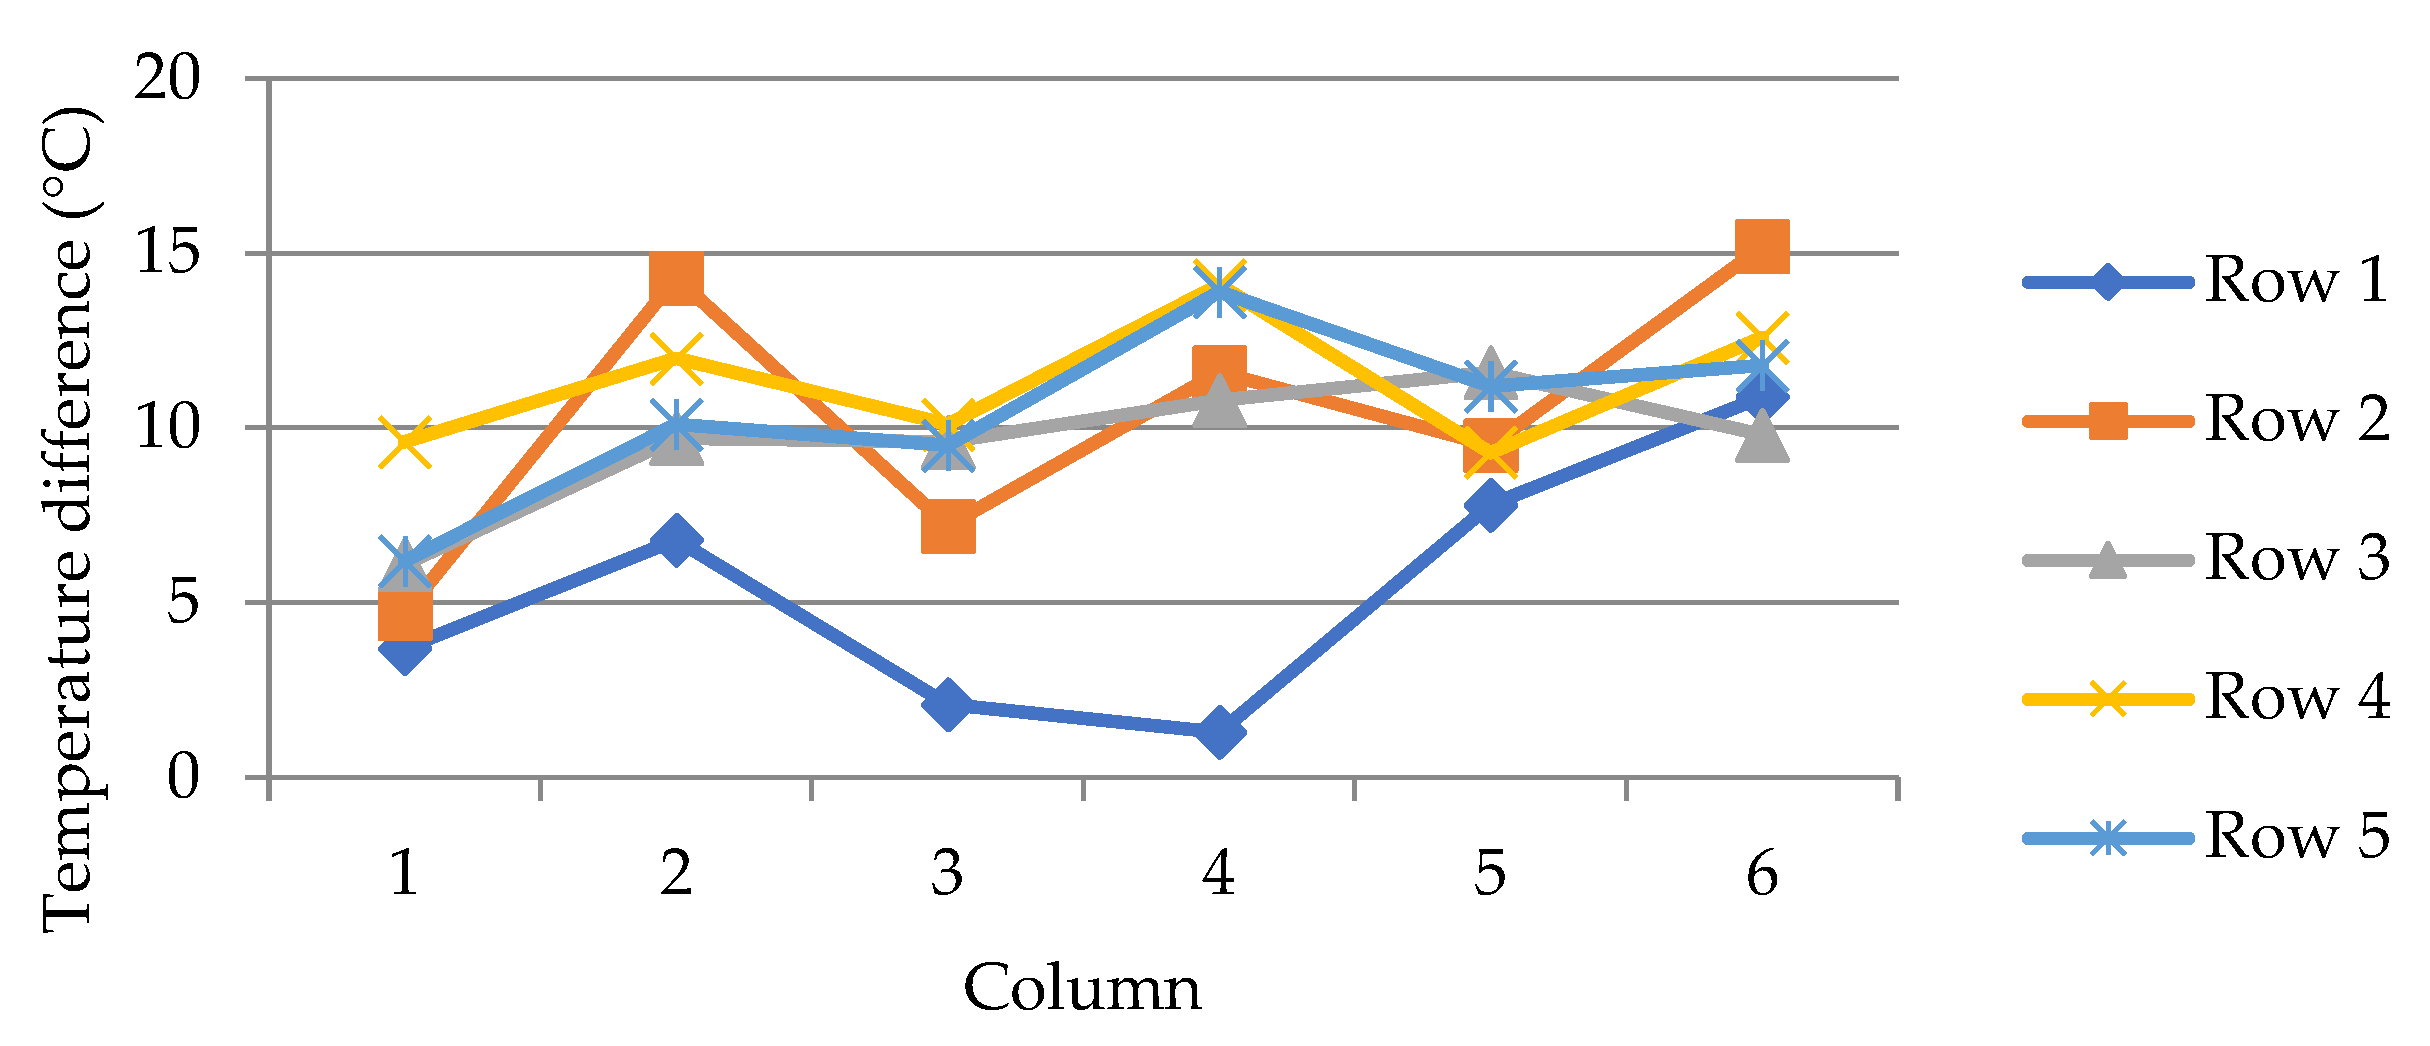
Applsci 12 00745 g018
Figure 19. Change in cell temperature of the first five rows of module.
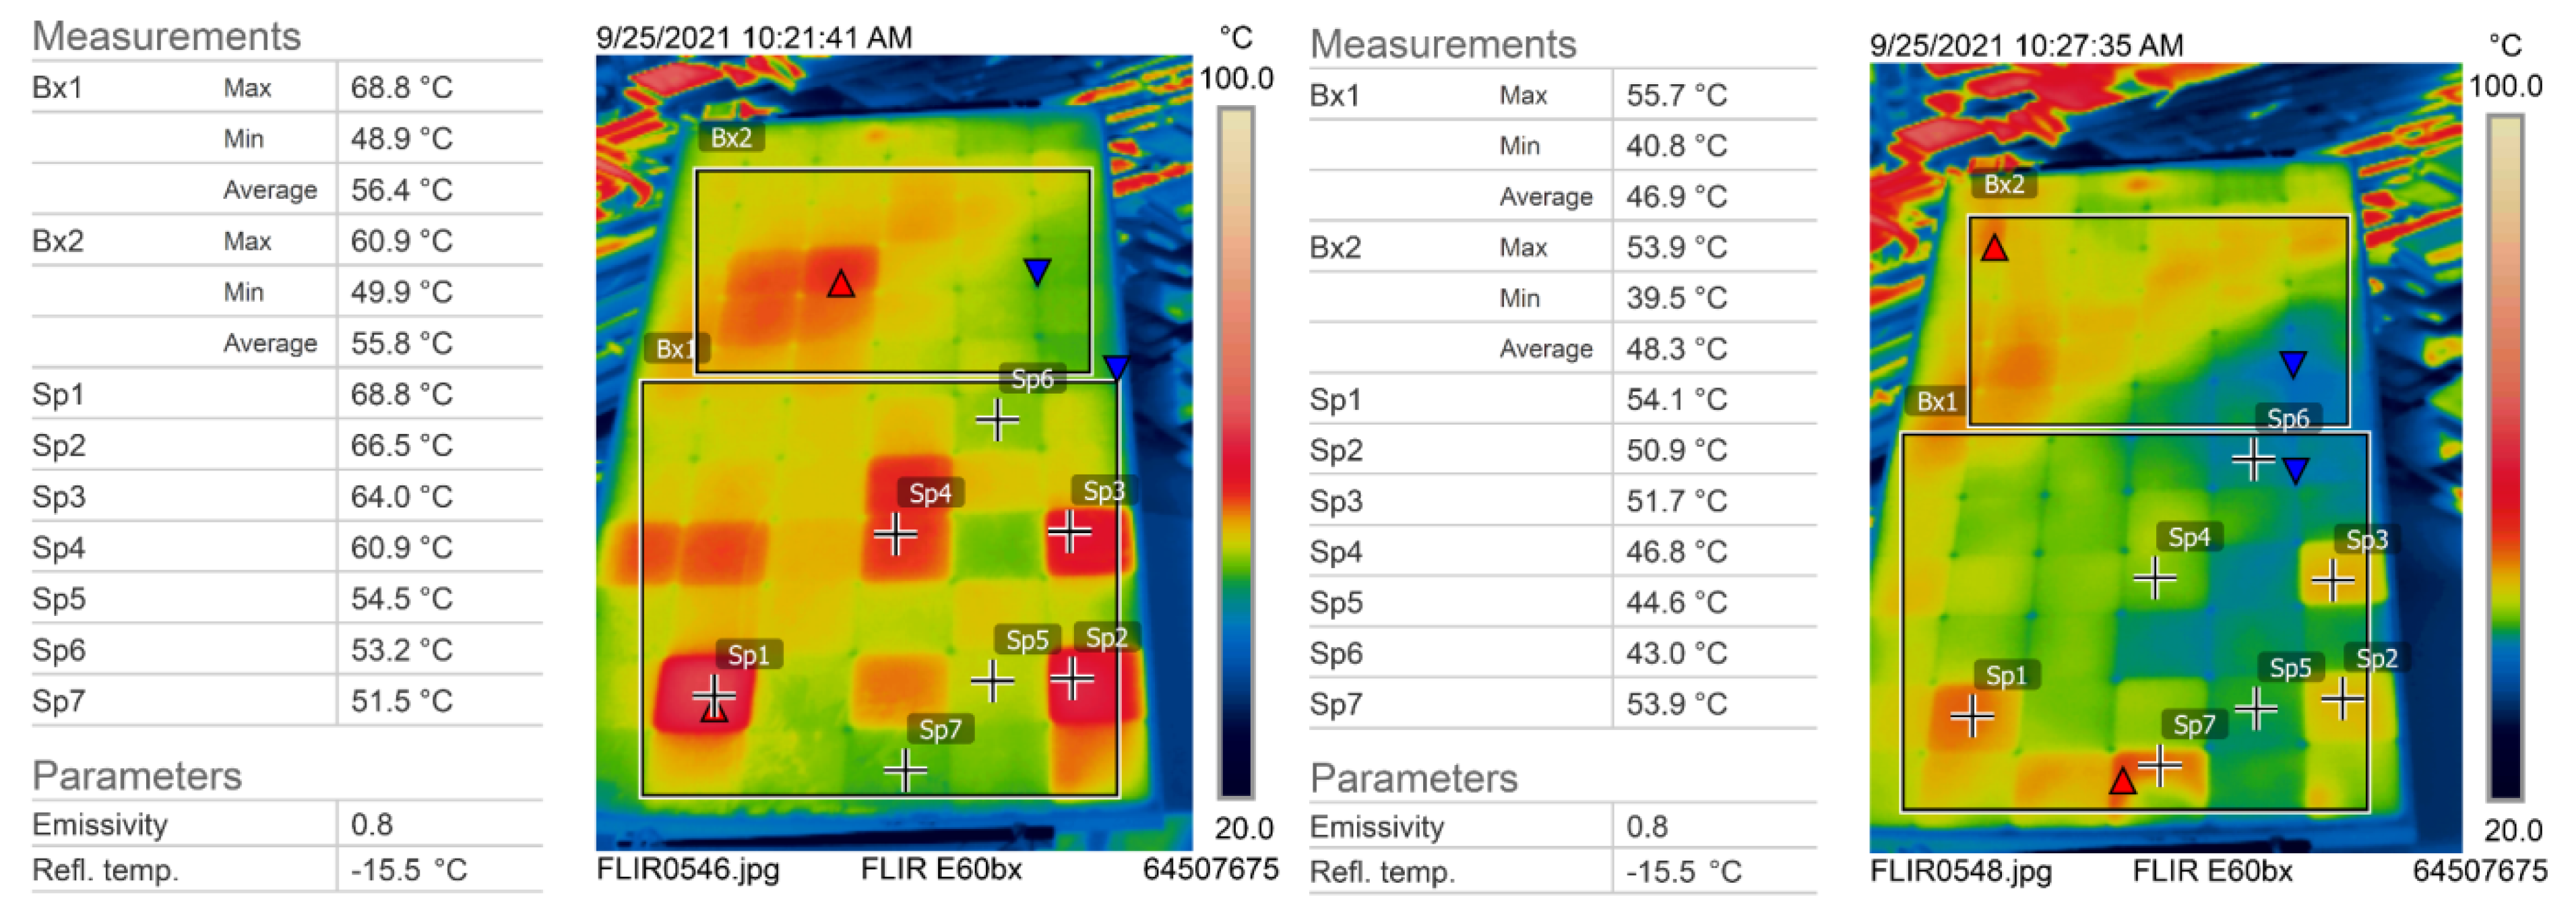
Applsci 12 00745 g019
Figure 20. Thermographic analysis of module number 2 (left) and number 3 (right).
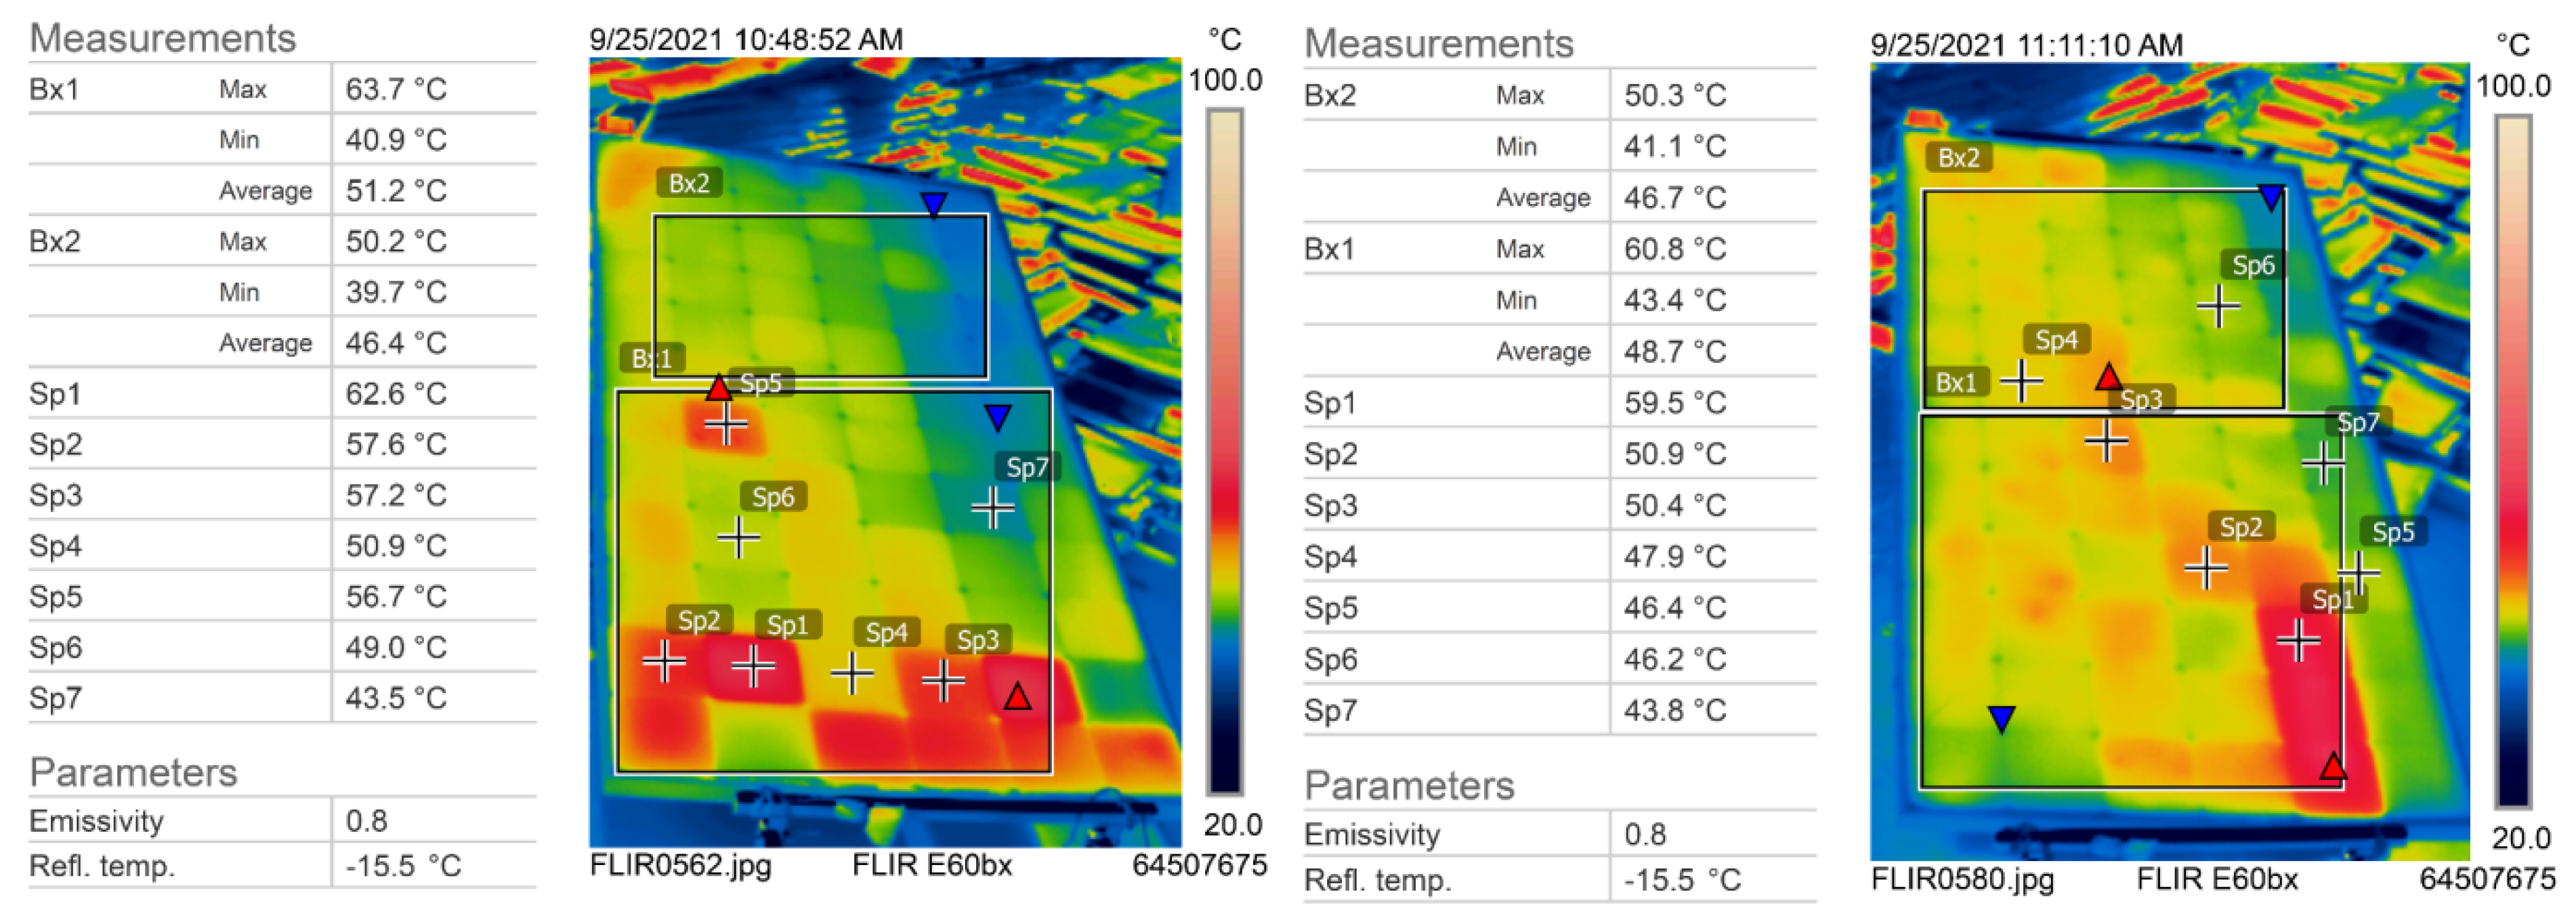
Applsci 12 00745 g020
Figure 21. Thermographic analysis of the frontside (up) and backside (down) of module number 4.
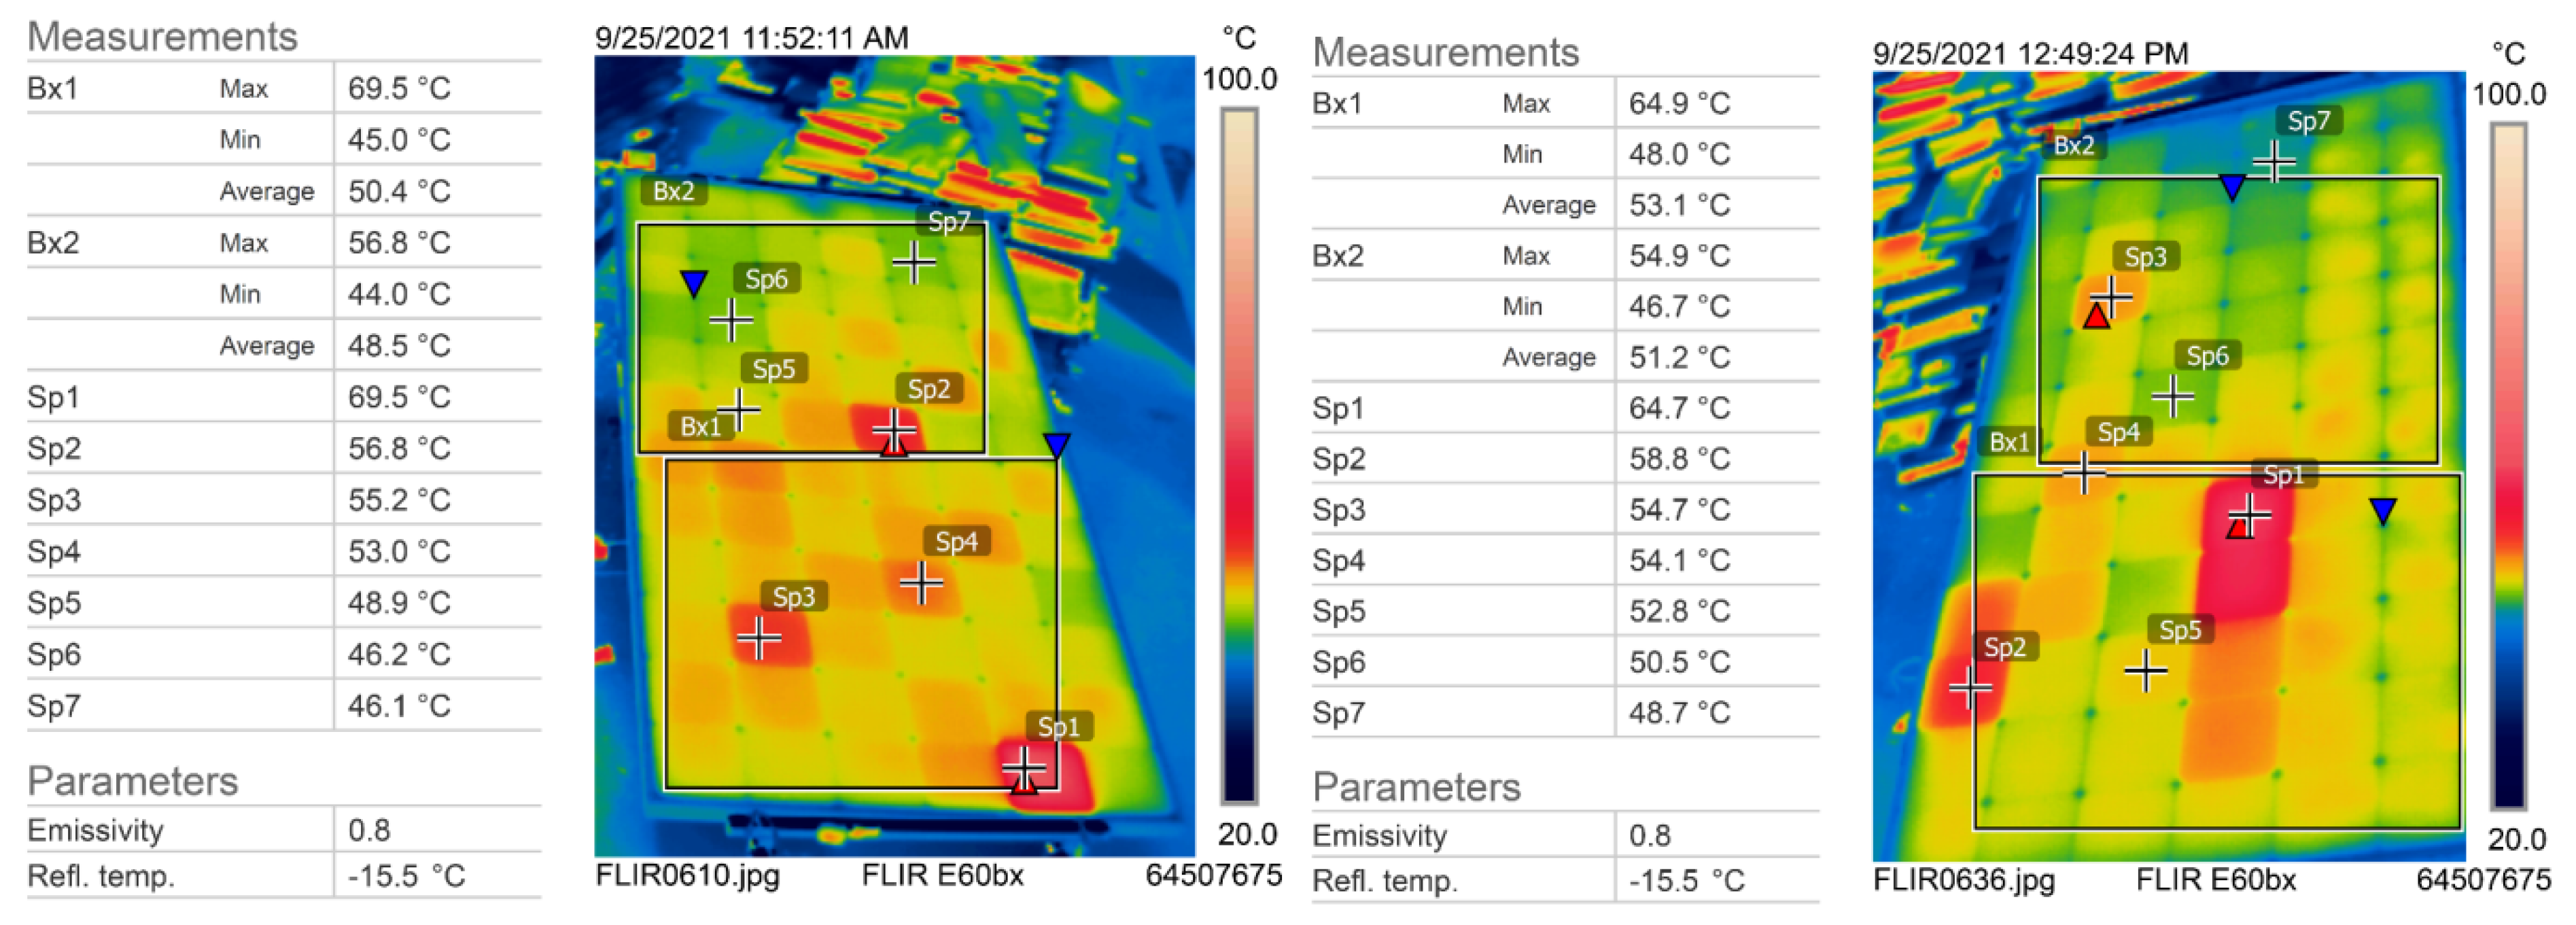
Applsci 12 00745 g021
Figure 22. Thermographic analysis of module number 5 (left) and module number 6 (right).
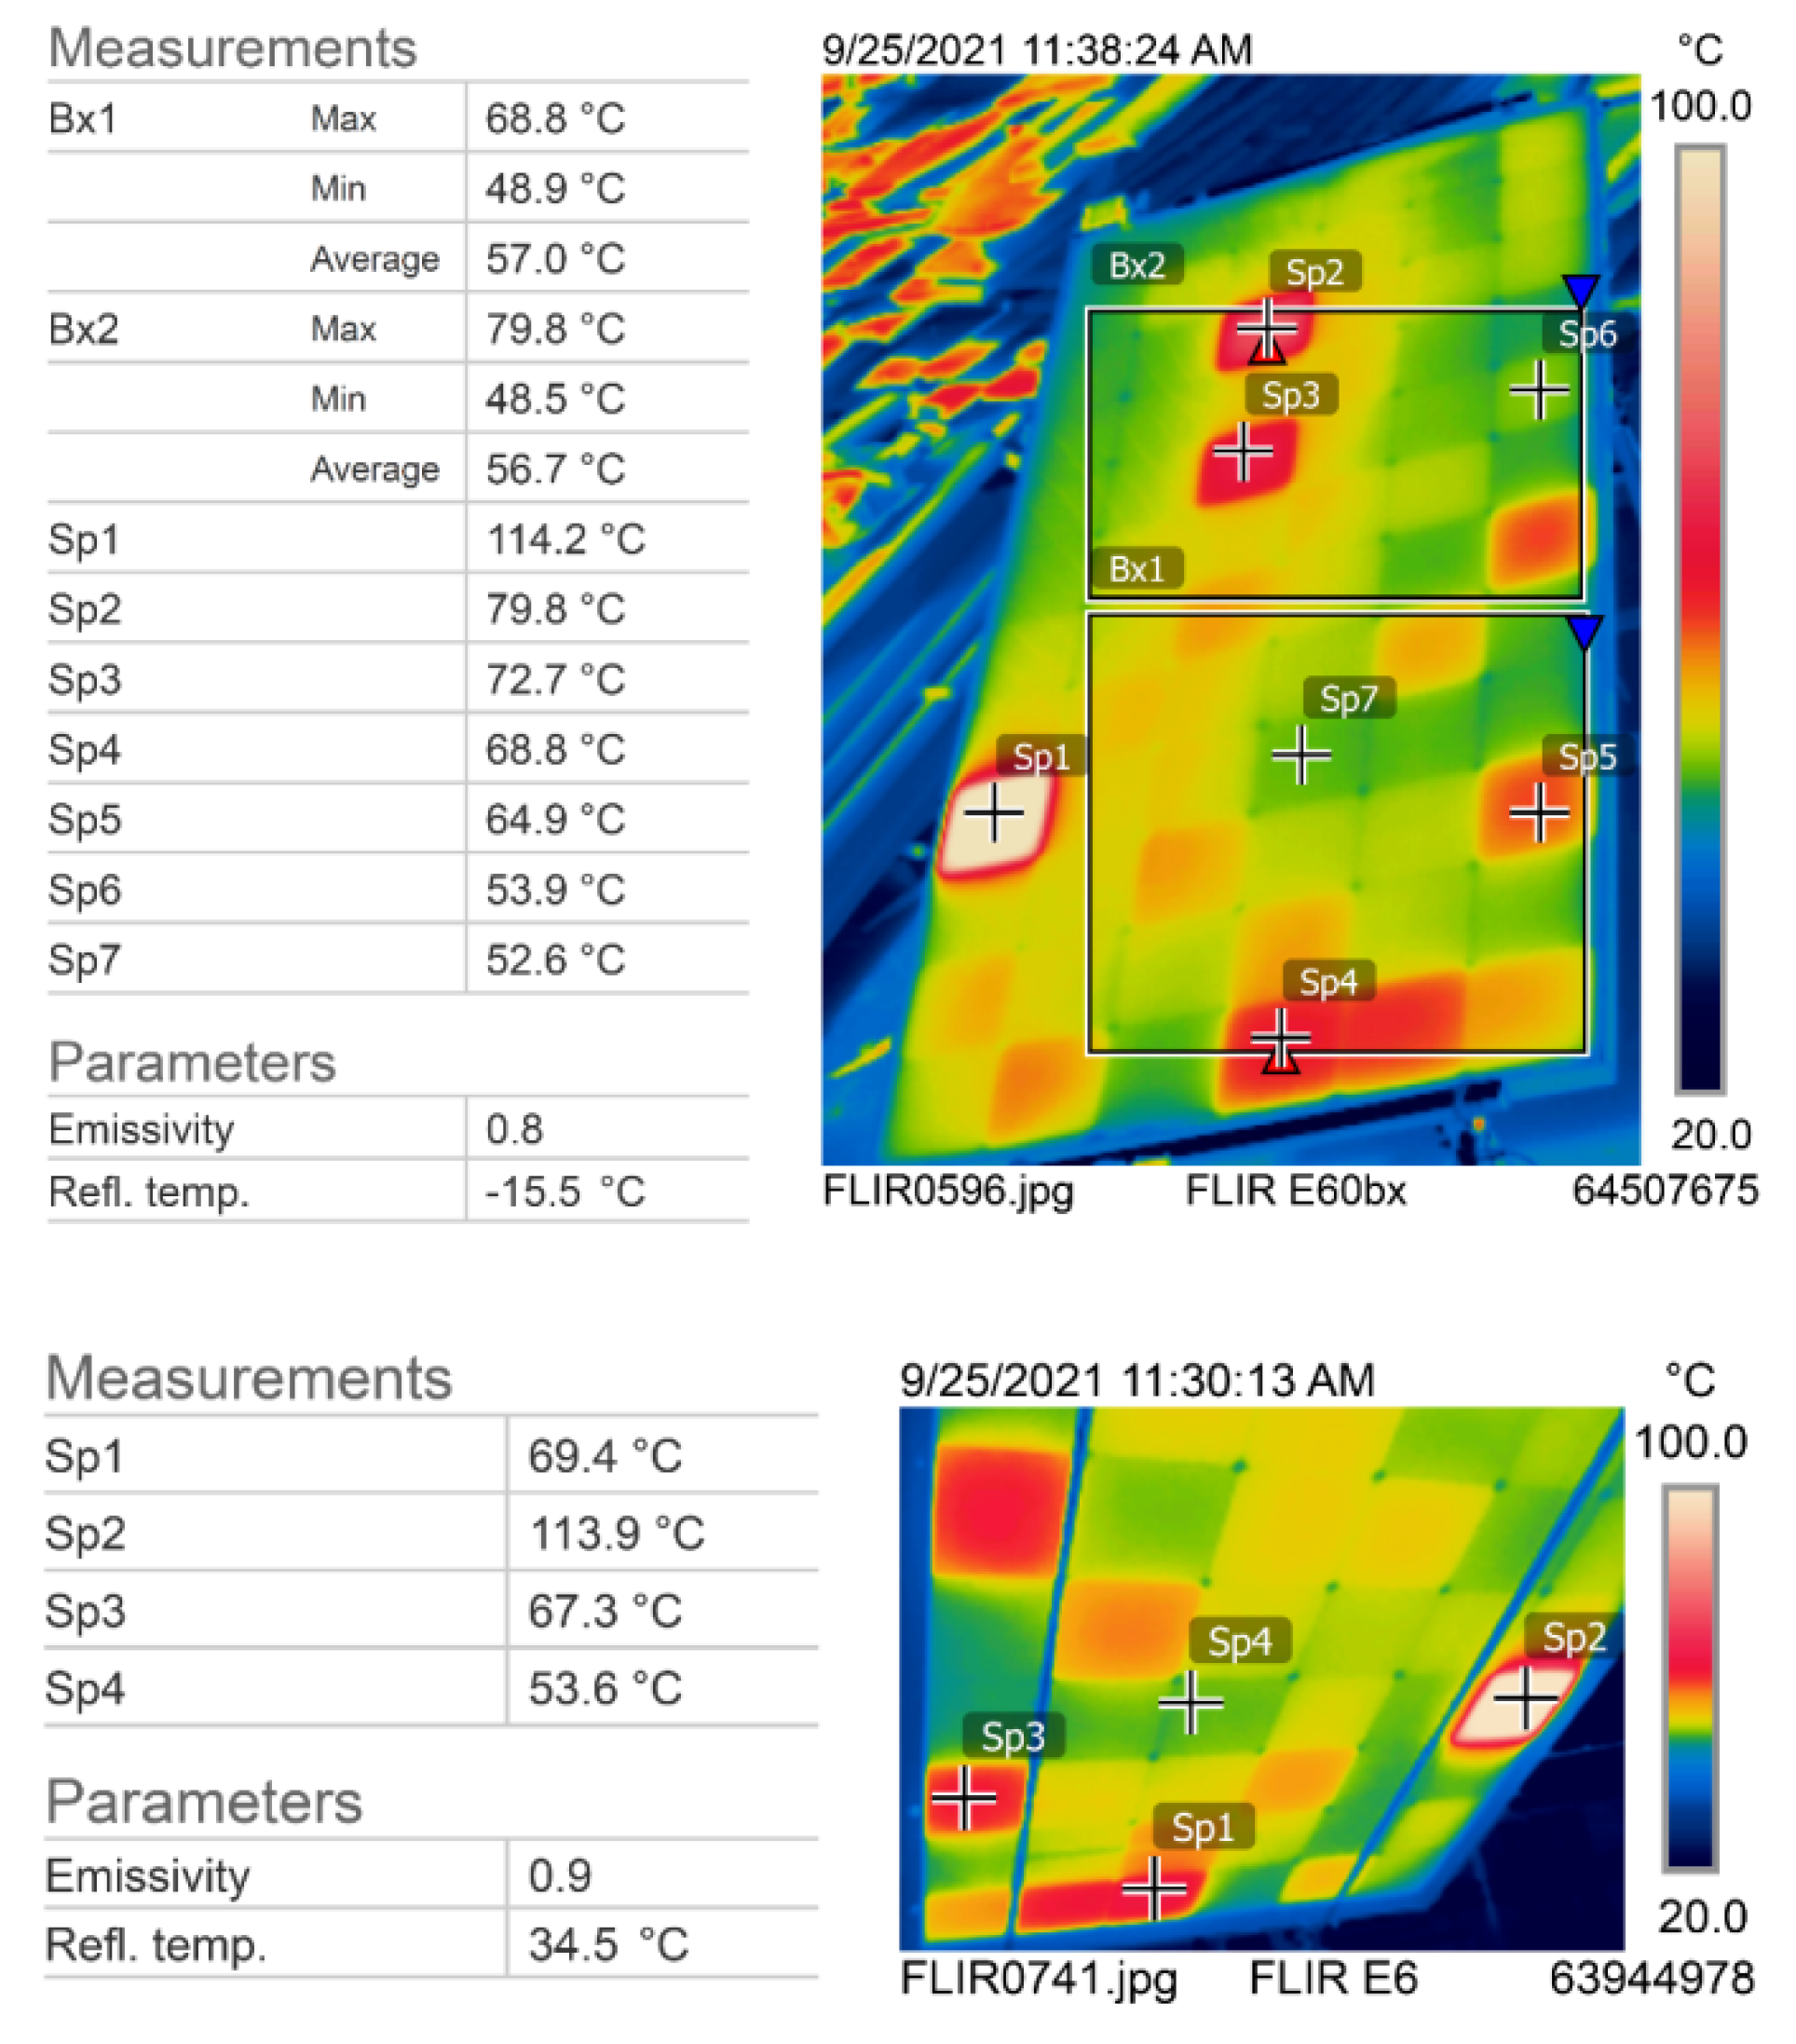
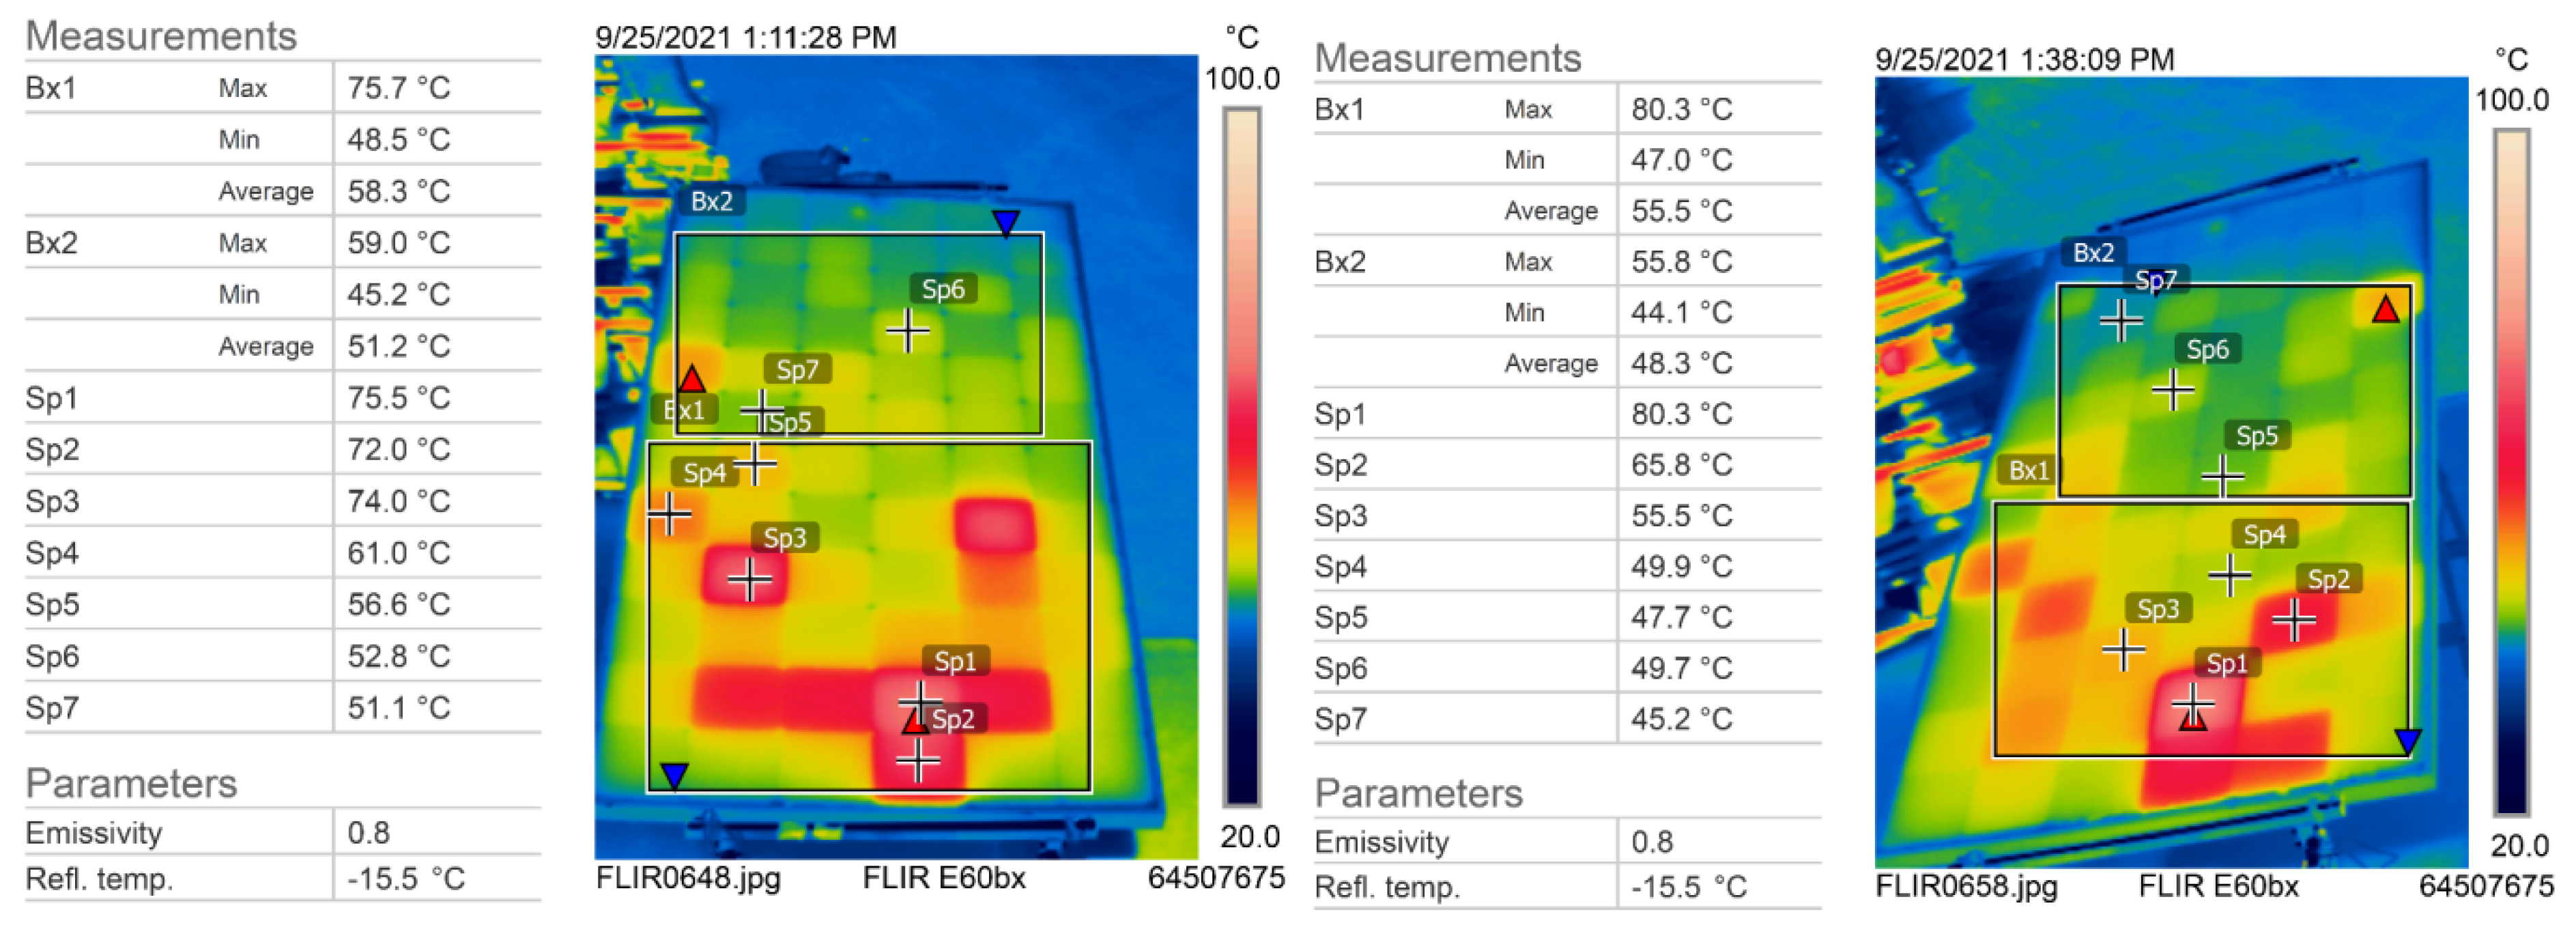
Applsci 12 00745 g022
Figure 23. Thermographic analysis of module number 7 (left) and module number 8 (right).
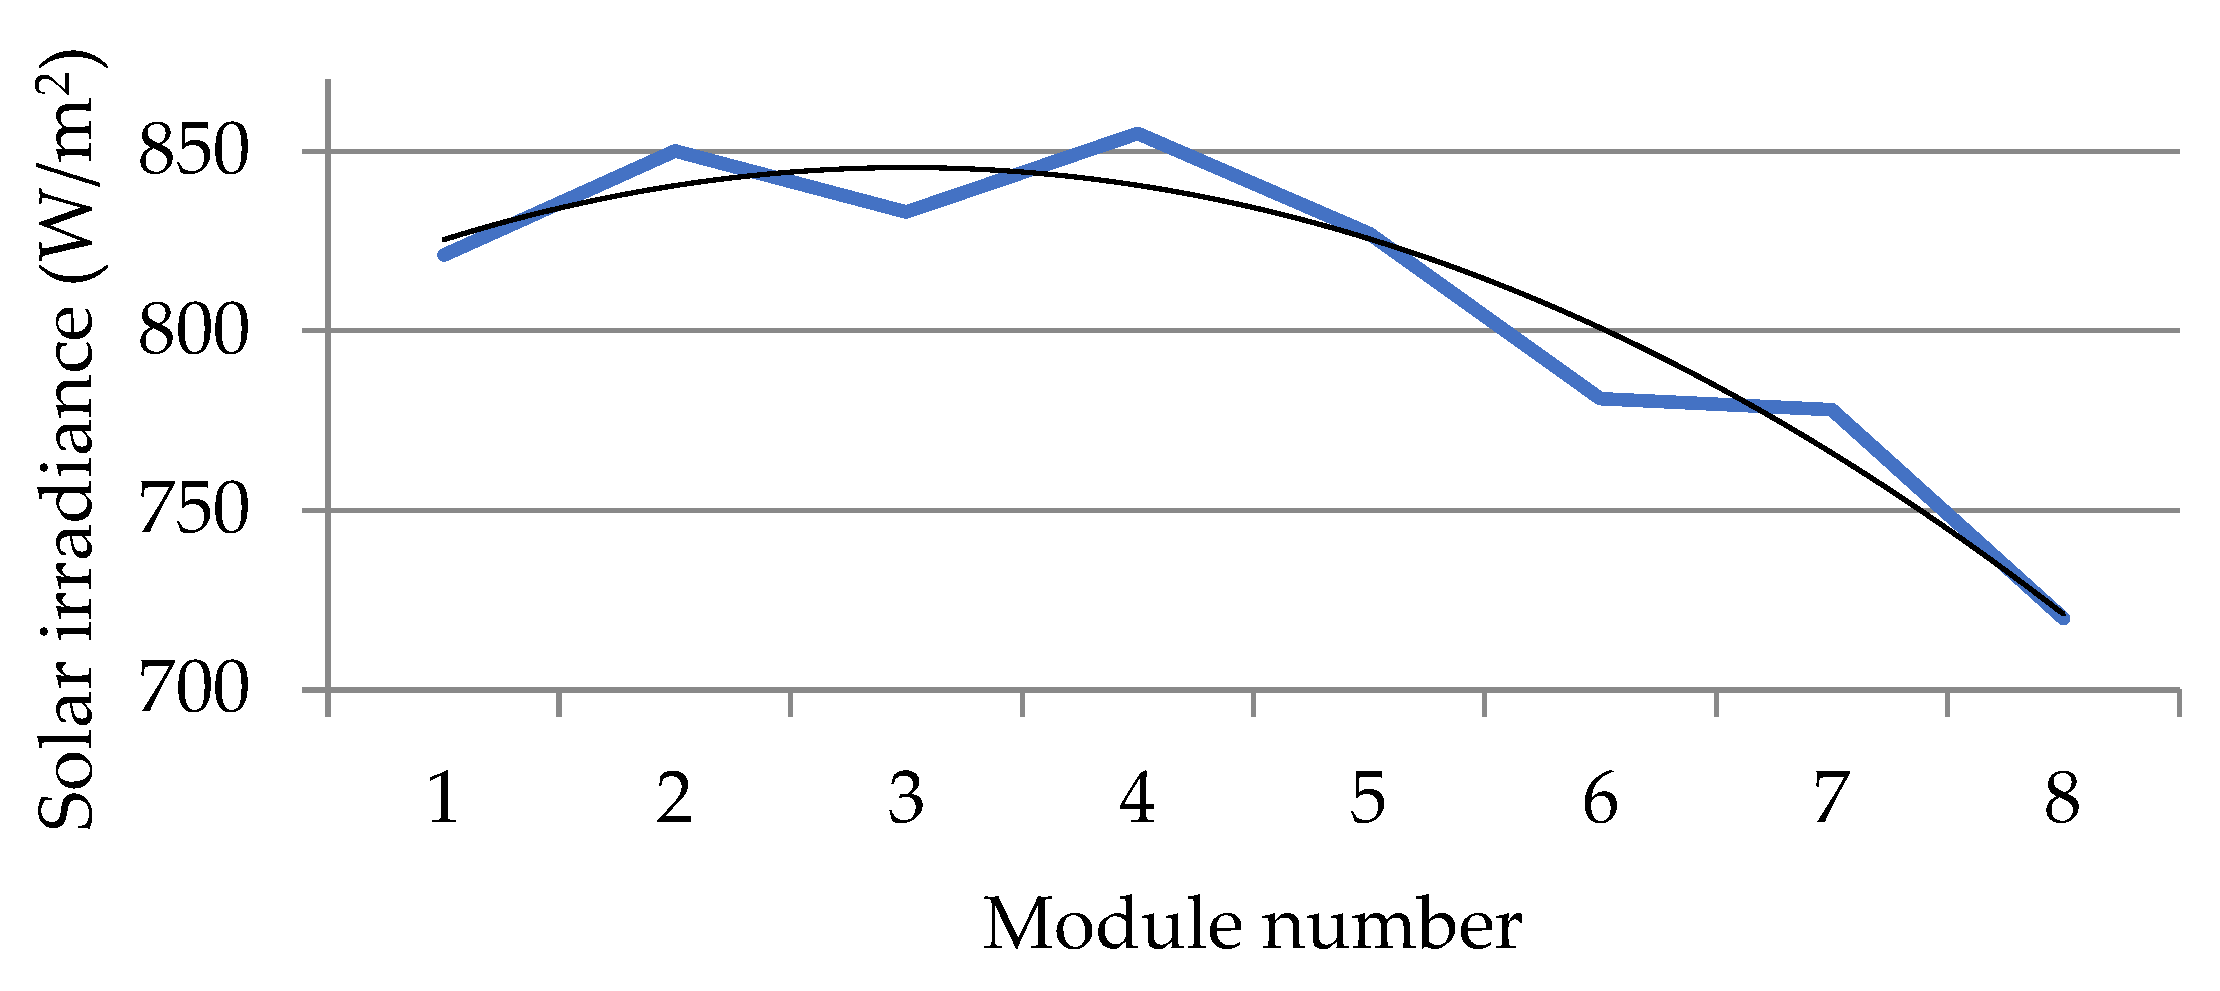
Applsci 12 00745 g023
Figure 24. Graphical representation of the solar irradiance over thermographic measurements on the modules.
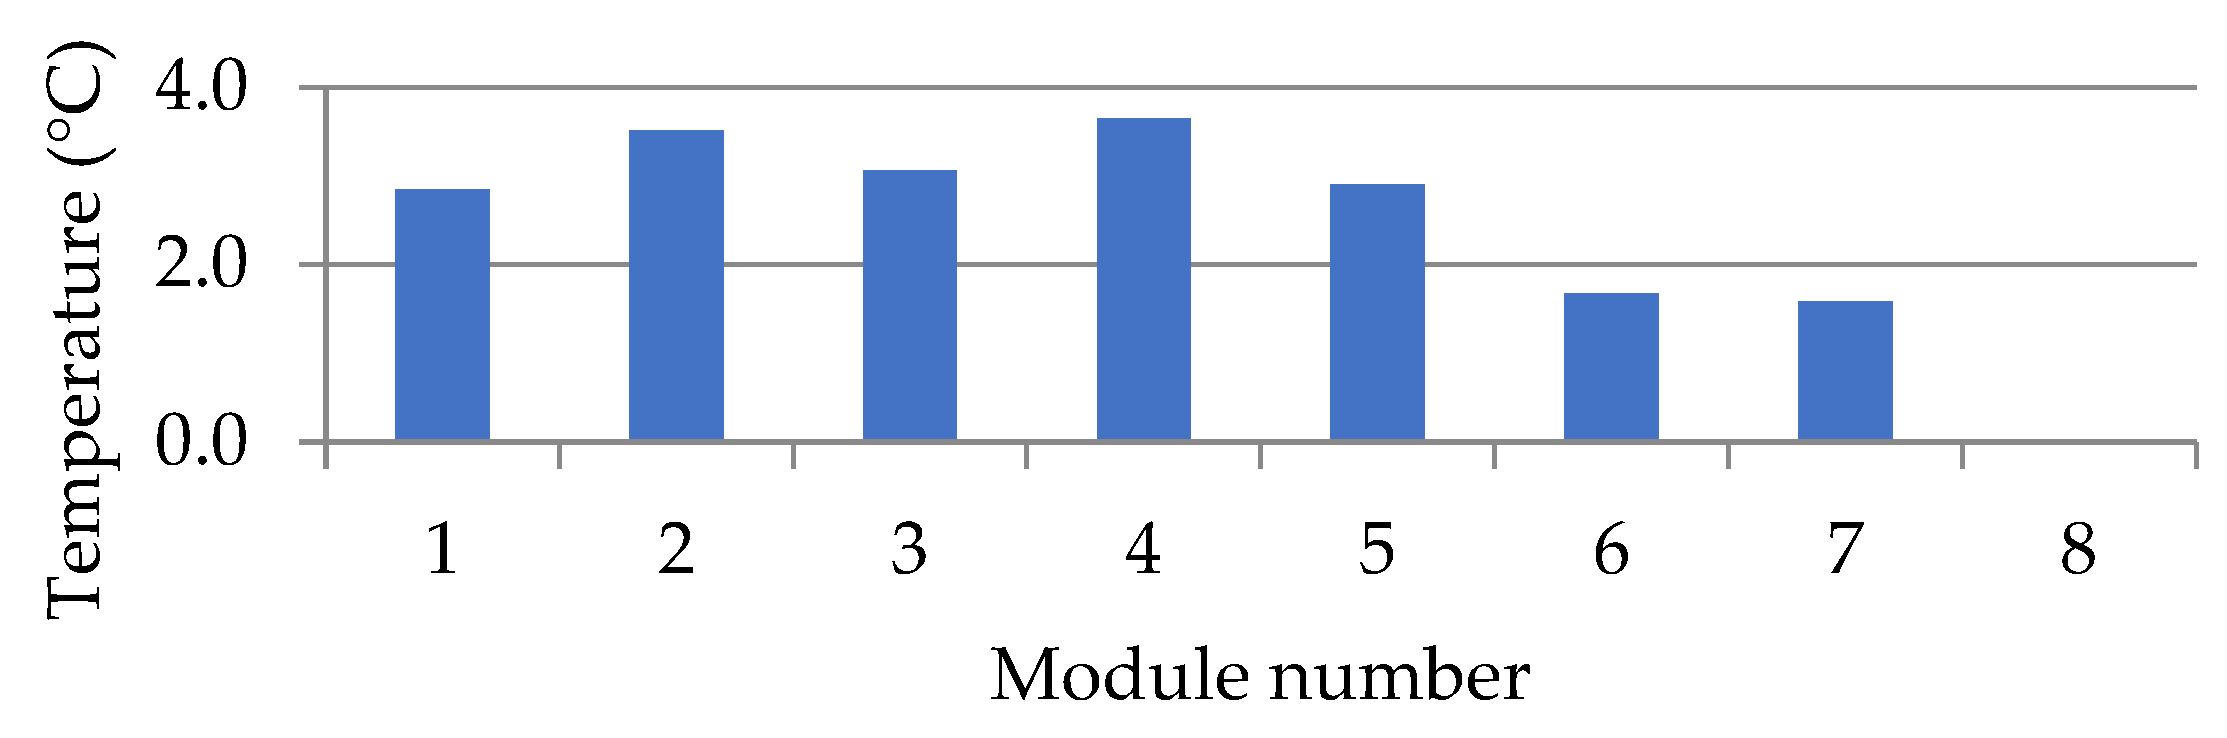
Applsci 12 00745 g024
Figure 25. Temperature correction values for equalization of the results due to the influence of different amounts of solar irradiance.
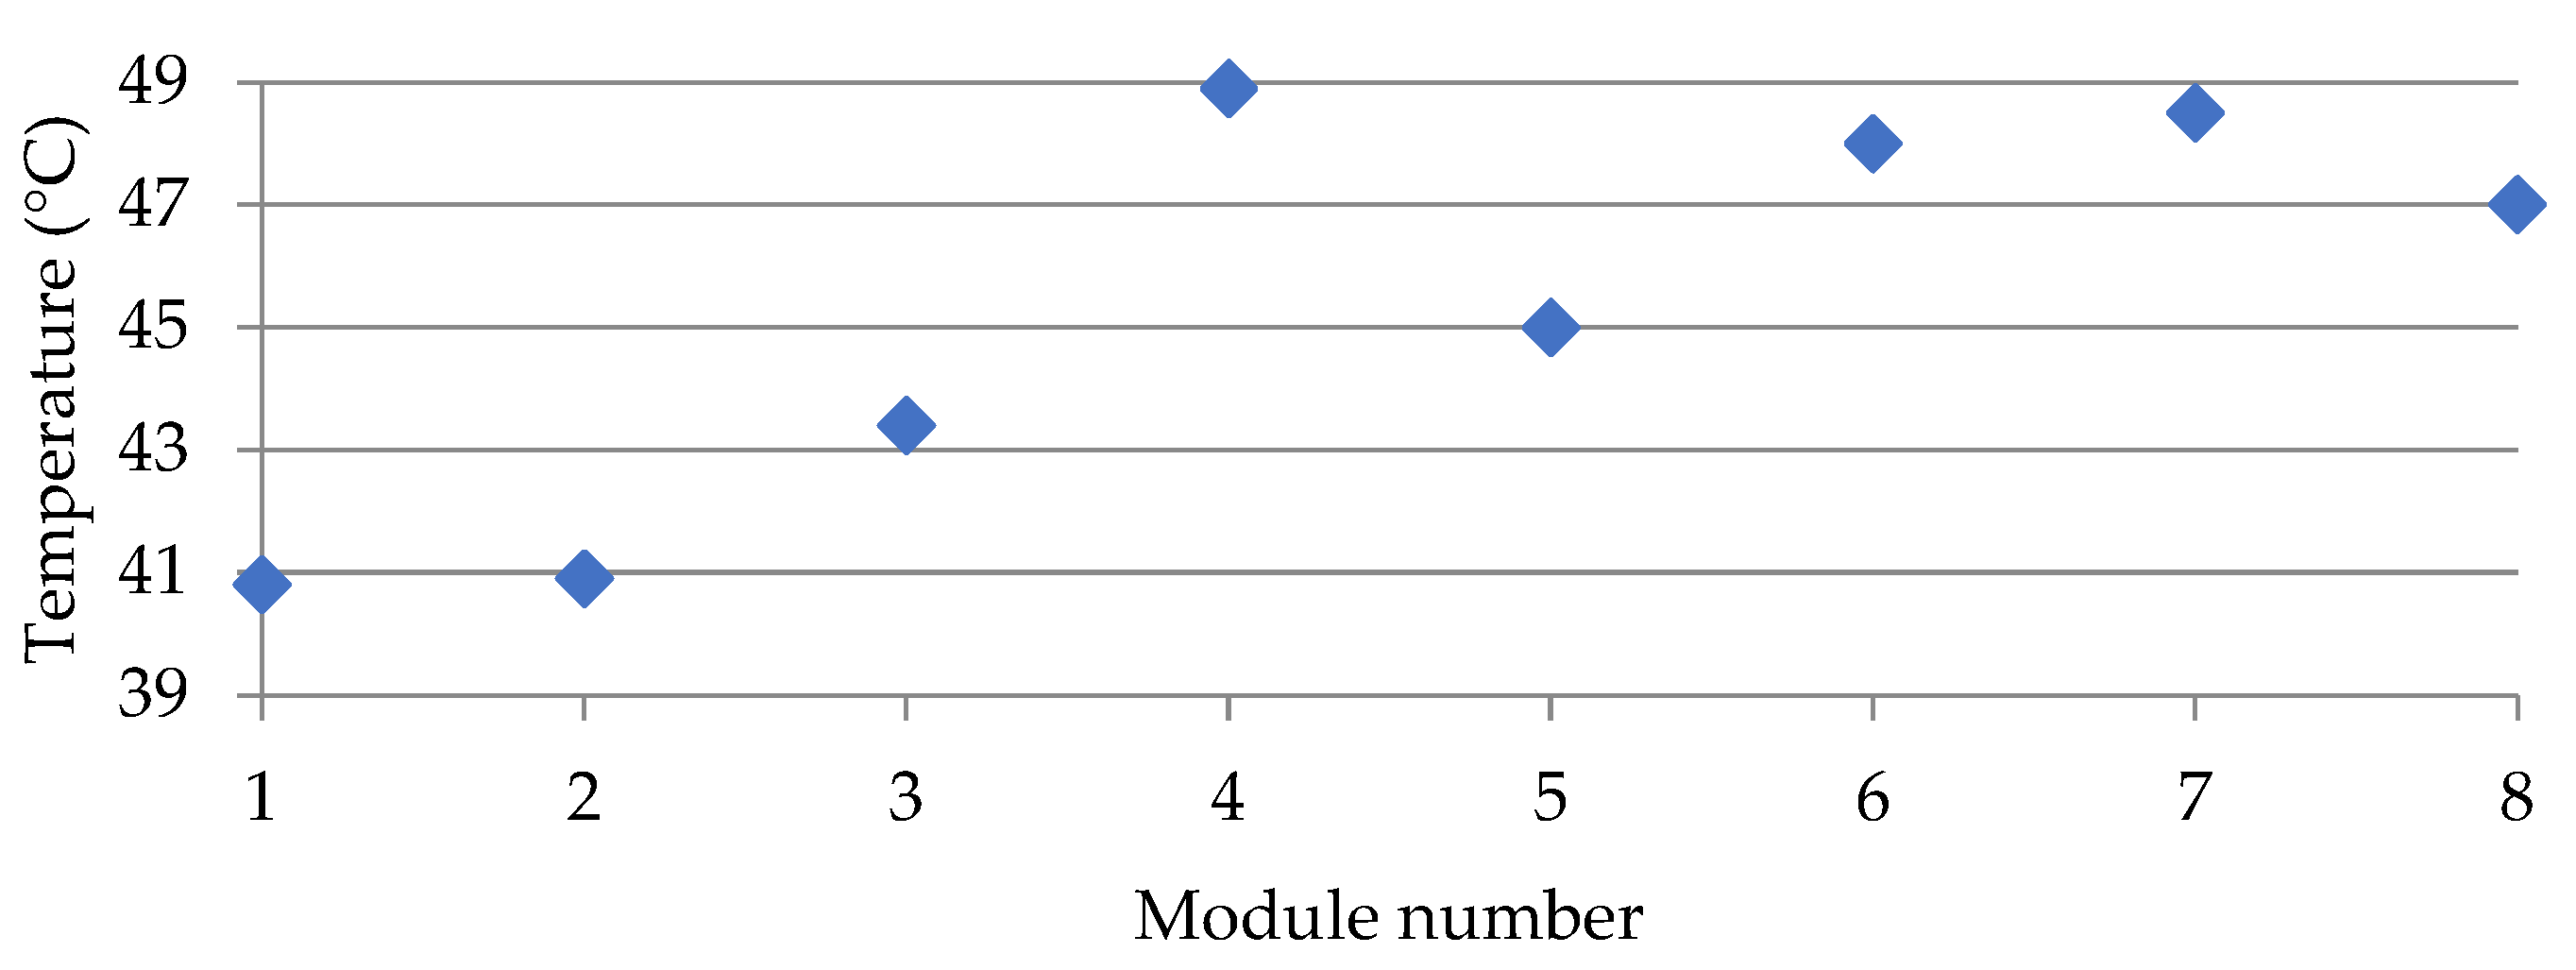
Applsci 12 00745 g025
Figure 26. Minimum temperature of modules during measurements.
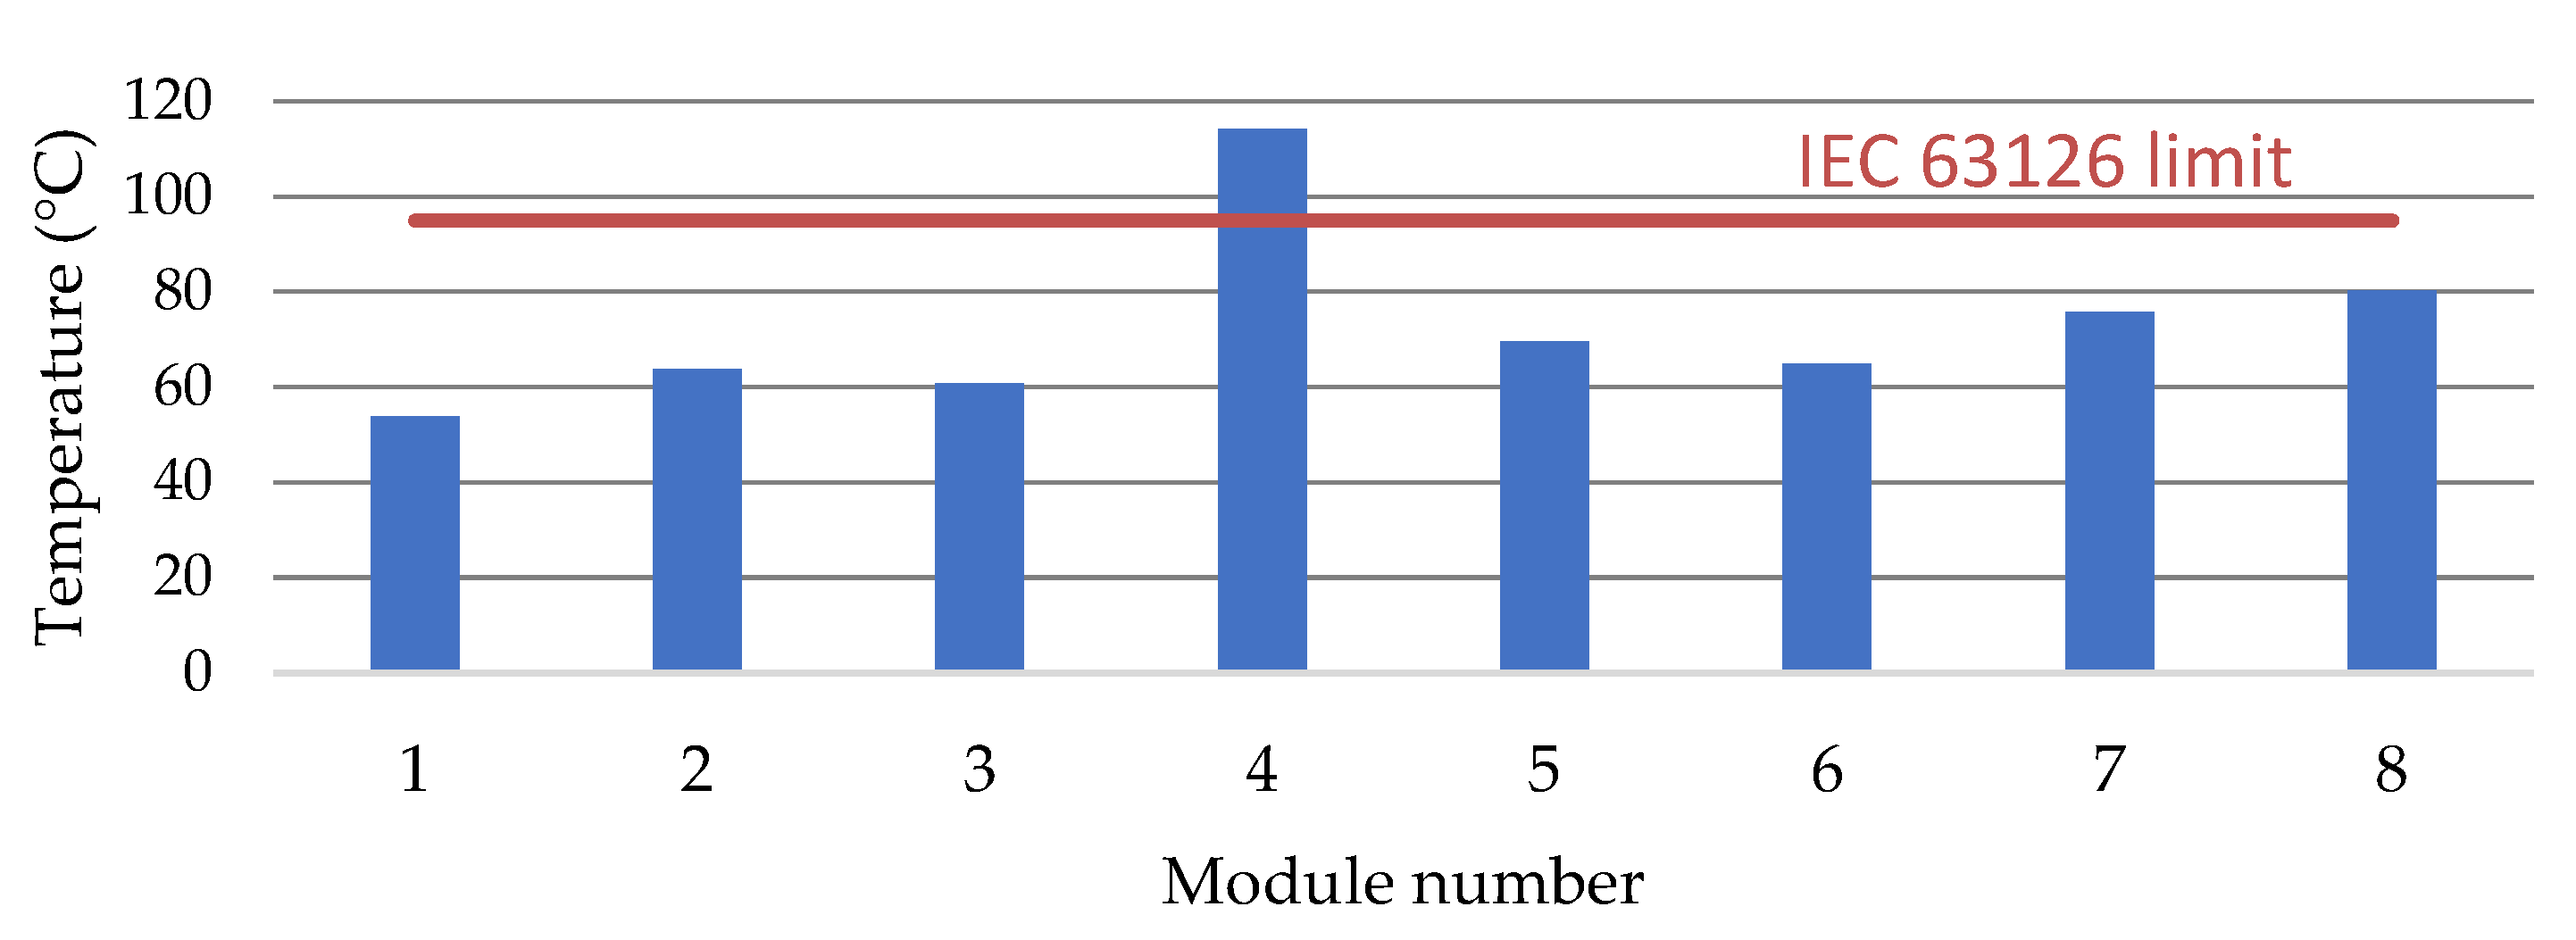
Applsci 12 00745 g026
Figure 27. Maximum temperature values of the module surface.
Applsci 12 00745 g027
Figure 28. Observed damage determined by visual inspection of the module.
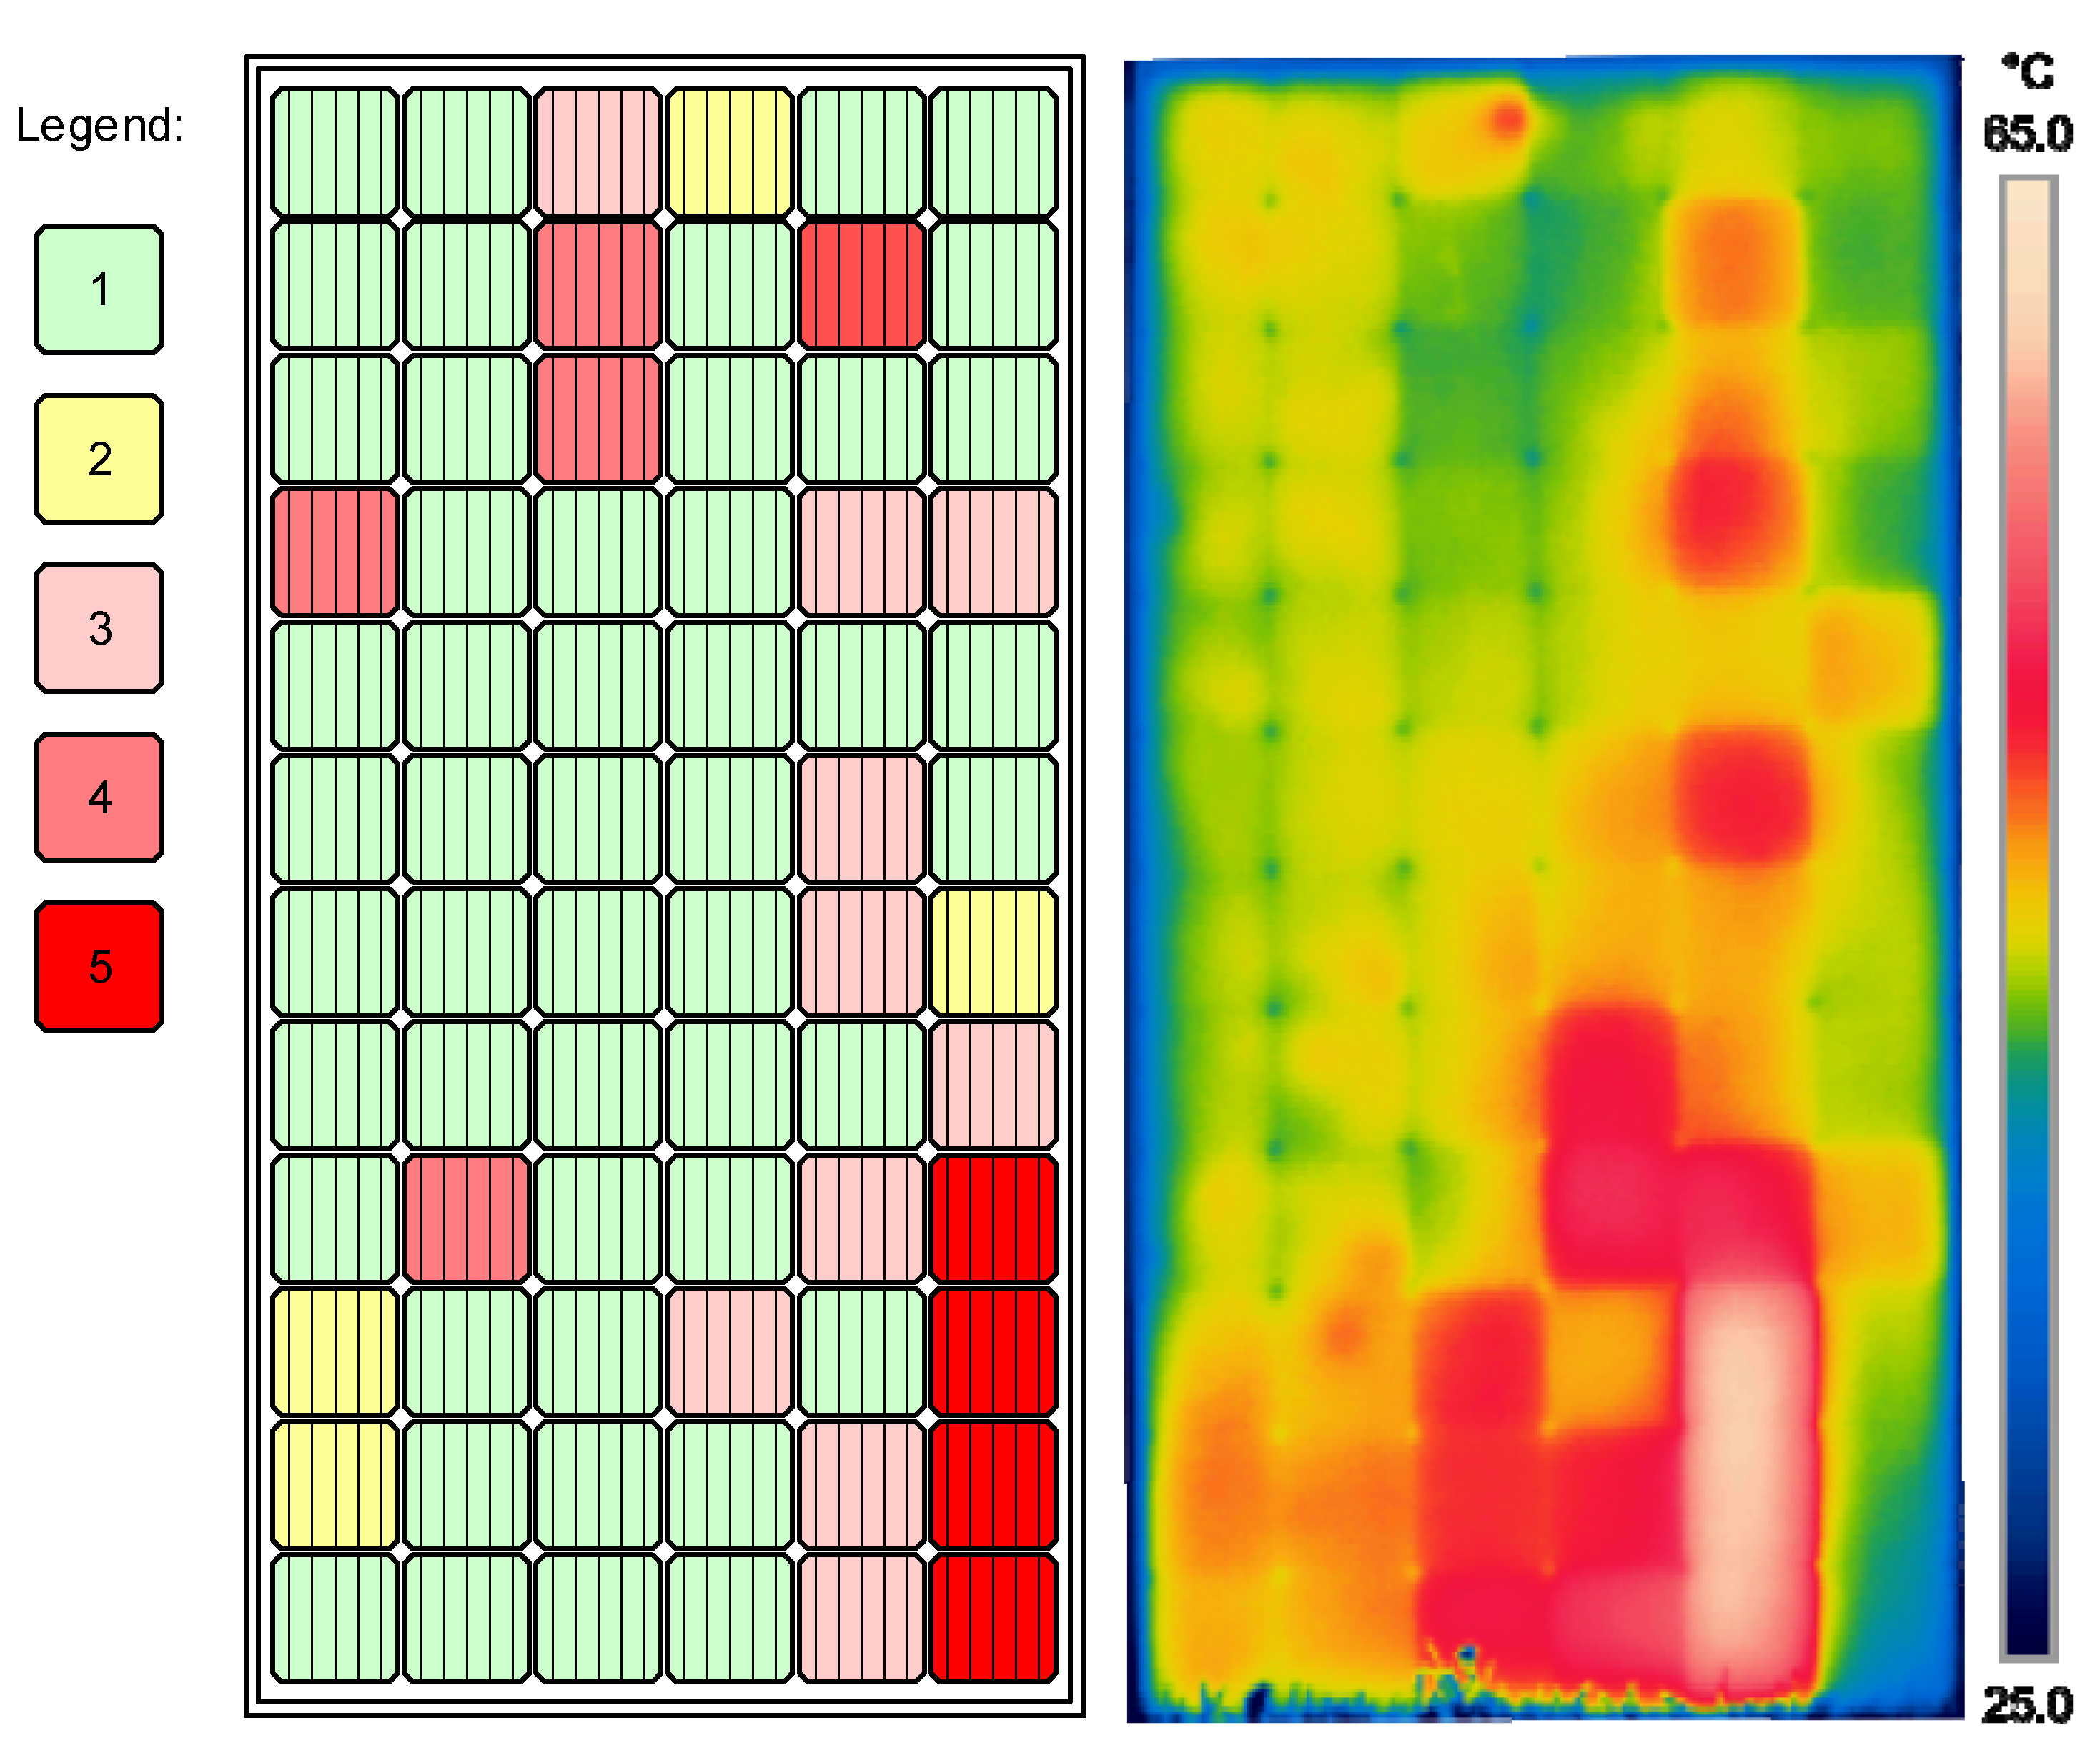
Applsci 12 00745 g028
Figure 29. Damage classification by visual inspection (left) and thermogram (right) of module number 3.
Applsci 12 00745 g029
Table 1. Technical characteristics of the original 340 Wp monocrystalline silicon PV modules.
ModelGSPV M6-340JAM60S10-345/MR
Cell number72 (6 × 12)120 (6 × 20)
Maximum static load, front side (ex. snow, wind)5400 Pa5400 Pa
Maximum static load, back side (ex. wind)2400 Pa2400 Pa
Glass3.2 mm tempered glassn/a
Encapsulant typeEthylene vinyl acetaten/a
Nominal output power 1340 Wp345 Wp
Cell efficiency 119.83%20.5 %
Open-circuit voltage 146.49 V41.76 V
MPP voltage 137.8 V34.99 V
Short-circuit current 19.53 A10.54 A
MPP current 18.99 A9.86 A
Current temperature coefficient+0.06%/K+0.044%/K
Voltage temperature coefficient−0.32%/K−0.272%/K
Power temperature coefficient−0.45%/K−0.354%/K
Dimensions1956 × 992 × 40 mm1689 × 996 × 35 mm
1 Electrical parameters are given as the standard test conditions.
Table 2. Comparison of FLIR E60bx and E6 specifications.
CameraFlir E60bxFlir E6
IR resolution 320 × 240 pixels160 × 120 pixels
Thermal sensitivity/NETD <0.045 °C @ +30 °C/45 mK<0.06 °C/<60 mK
Field of view (FOV)25° × 19°45° × 34°
Minimum focus distance 0.4 m0.5 m
Spatial resolution (IFOV) 1.36 mrad5.2 mrad
Spectral range 7.5–13 μm7.5–13 μm
Object temperature range –20 °C to +120 °C–20 °C to +250 °C
Accuracy
±2 °C or ±2% of reading, for ambient temperature 10 °C to 35 °C±2 °C or ±2% of reading, for ambient temperature 10 °C to 35 °C
Built-in digital camera3.1 Mpixel (2048 × 1536),
FOV 53° × 41°
0.3 Mpix (640 × 480)
FOV 55° × 43°
Table 3. Comparison of the apparent temperature of the glass surface and the temperature of the plastic substrate of the module.
E60bxE6E60bx-E6
T (°C)BackplateGlassTemperature Difference (ΔT)BackplateGlassTemperature Difference (ΔT)BackplateGlass
max50.947.13.850.154.4−4.30.8−7.3
min49.042.76.348.352.4−4.10.7−9.7
Bx150.343.96.449.353.7−4.41.0−9.8
max54.349.44.953.657.3−3.70.7−7.9
min46.542.83.744.952.3−7.41.6−9.5
El150.945.05.950.054.4−4.40.9−9.4
S153.748.65.153.556.7−3.20.2−8.1
S254.248.16.152.957.2−4.31.3−9.1
S351.644.47.250.654.8−4.21.0−10.4
Table 4. Temperature indicators of pilot PV module test.
Module temperature46.6 °C
Average cell temperature51.0 °C
Maximum cell temperature54.0 °C
Minimum cell temperature48.0 °C
Cell temperature difference 6.0 °C
Module maximum temperature difference7.4 °C
Table 5. Distribution of the apparent temperature value of the new (reference) PV module.
Column
123456
Row141.942.742.442.442.441.4
243.443.543.543.243.542.6
343.543.443.443.643.443.4
444.243.442.644.444.443.4
547.344.750.044.044.243.1
645.647.046.445.243.645.5
751.345.749.745.746.343.9
846.754.747.155.548.453.8
961.049.662.148.058.546.1
1046.746.646.746.248.246.6
1148.748.948.948.447.246.2
1250.949.850.749.851.946.8
1350.251.150.158.854.147.2
1456.249.653.649.668.947.2
1549.950.656.450.151.147.0
1654.153.060.950.757.947.2
1749.355.549.950.549.147.0
1849.650.249.349.249.346.3
1954.657.151.952.847.946.0
2052.148.849.748.447.344.8
Table 6. Statistical data of the apparent temperature of the new module.
Module temperature41.0 °C
Average cell temperature48.6 °C
Maximum cell temperature68.9 °C
Minimum cell temperature41.4 °C
Cell temperature difference 27.5 °C
Module maximum temperature difference27.9 °C
Table 7. Allocation in classes of abnormalities.
Class of Abnormality (CoA)1 (No Abnormalities—OK)2 (Thermal Abnormality—tA)3 (Safety Relevant Thermal Abnormality—dtA)
Recommendation for actionsNo imminent actionChecking the cause and, if necessary, rectification in a reasonable periodPrompt interruption of operation, checking the cause and rectification in a reasonable period
Table 8. PV tester I-V curve measurement module technical characteristics.
ParameterMeasuring Range
DC voltage0–999 V
DC current0–15 A
DC power0–15,000 W
Solar irradiance0–1750 W/m2
Cell temperature−10–85 °C
Table 9. Environmental conditions at the moment of the I-V curve measurements.
PV Module No.Solar IrradiancePV Module Temperature
1821 W/m244.3 °C
2850 W/m237.3 °C
Table 10. PV module 2 (washed) I-V curve test results.
ParameterMeasuredSTC CalculatedSTC NominalDeviation
Open-circuit voltage42.80 V45.78 V46.50 V−1.55%
Short-circuit current7.38 A8.90 A9.53 A−6.61%
MPP voltage31.20 V33.72 V37.80 V−10.79%
MPP current6.39 A7.71 A8.99 A−14.24
Fill factor63.12%63.81%76.68%−12.87%
MPP power199.37 W259.9 W340 W−23.56%
Table 11. PV module 1 (washed) I-V curve test results.
ParameterMeasuredSTC CalculatedSTC NominalDeviation
Open-circuit voltage44.30 V46.36 V46.50 V−0.30%
Short-circuit current7.45 A8.71 A9.53 A−8.60%
MPP voltage33.40 V35.13 V37.80 V−7.06%
MPP current6.57 A7.68 A8.99 A−14.57%
Fill factor66.49%66.82%76.68%−9.86%
MPP power219. 44 W269.84 W340 W−20.64%
Table 12. Solar irradiance and module temperature at the time of the measurement.
Module12345678
W/m2825850833855827781778720
T (°C)38.337.334.841.845.339.340.341.3
Table 13. Numerical data comparison of the thermographic analysis.
Module Number12345678Average
Minimum temperature [°C]40.840.943.448.945.048.048.547.045.3
Maximum temperature [°C]55.763.760.869.869.564.975.766.065.8
Difference [°C]14.922.817.420.924.516.927.219.020.5
Percentage difference [%]36.5255.7540.0942.7454.4435.2156.0840.4345.16
Measurement time [h]10:2710:4811:1111:3811:5212:4913:1113:38
Publisher’s Note: MDPI stays neutral with regard to jurisdictional claims in published maps and institutional affiliations.

