1. Introduction
Volatile organic compounds (VOCs) are often associated with the quality of alcoholic drinks. Among others, one of the most important and well-known VOCs in distilled beverages is ethanol. In Europe, the quantity of ethanol in beverages depends on the product category, which is categorized by EU regulations [
1]. Besides fulfilling these specific regulations, the drinking industry must have precise control of ethanol quantity in beverages to refine and contribute to its aroma [
2]. Therefore, the development of sensing devices for ethanol detection in beverages is of utmost importance to allow reliable and real-time monitoring, especially during the different stages of fermentation.
The most common techniques to detect and monitor VOCs in alcoholic beverages are the semiconductor-based detectors, chemiresistors, colorimetric sensors, mass spectroscopy, and high-performance liquid chromatography [
3]. However, most of them are time consuming and do not allow for in situ analysis, which can compromise the correct determination of the VOCs concentration [
4,
5,
6]. Therefore, non-contact techniques to detect the concentration of ethanol in beverages must be developed, namely based on the VOCs vapor phase, since the risk of contaminating the beverage is much lower.
Recently, optical fiber sensors (OFSs) have been emerging as a powerful tool to detect gases, namely VOCs in gaseous phase [
3,
7,
8]. Despite not being as sensitive or selective as analytical techniques, OFSs have several advantages, such as being lightweight, having a small footprint, compactness, and fast-response. Different types of optical fiber gas sensors have been reported based on different sensing structures, such as bare/coated fibers [
9,
10], fiber Bragg gratings [
11], tapered fibers [
6], long period gratings [
12], or microstructured fibers [
13,
14]. It is very challenging to make a fair comparison between the works reported in the literature for the detection of gases, as there is a myriad of configurations and experimental setups, which lead to different types of analysis [
3,
15,
16]. This also reveals the interest of the scientific community in finding new solutions for the detection of VOCs for different applications.
In this work, an optical fiber tip sensor based on a suspended core fiber is presented for the monitoring of gaseous ethanol. The sensor is silica-based and is produced by using a standard fusion splicer and a cleaver. Given the easiness of fabrication, sub-millimeter dimensions, and the fact that it operates in reflection without direct contact with the liquid sample, this sensor is proposed for applications related to alcoholic beverages, such as wines or distilled beverages.
2. Materials and Methods
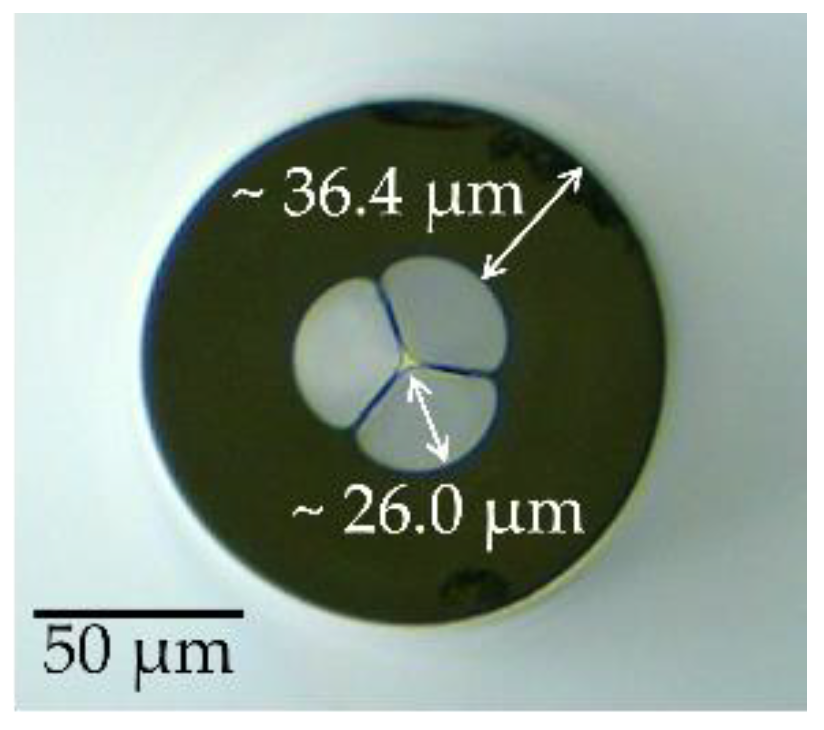
The suspended core fiber (SCF) used in this work, whose cross-section is shown in
Figure 1, was fabricated at the Leibniz Institute of Photonic Technology. It consists of a pure silica core with a diameter of ~2 μm, surrounded by three air holes with a dimension of ~26 μm. Between the holes, there is a bridge with a thickness of ~360 nm, which acts as a supporting structure for the suspended core. The silica cladding of this optical fiber has a thickness of ~36.4 μm and an outer diameter of ~125 μm. The optical fiber was fabricated via stack-and-draw technique, and coated with a standard acrylate.
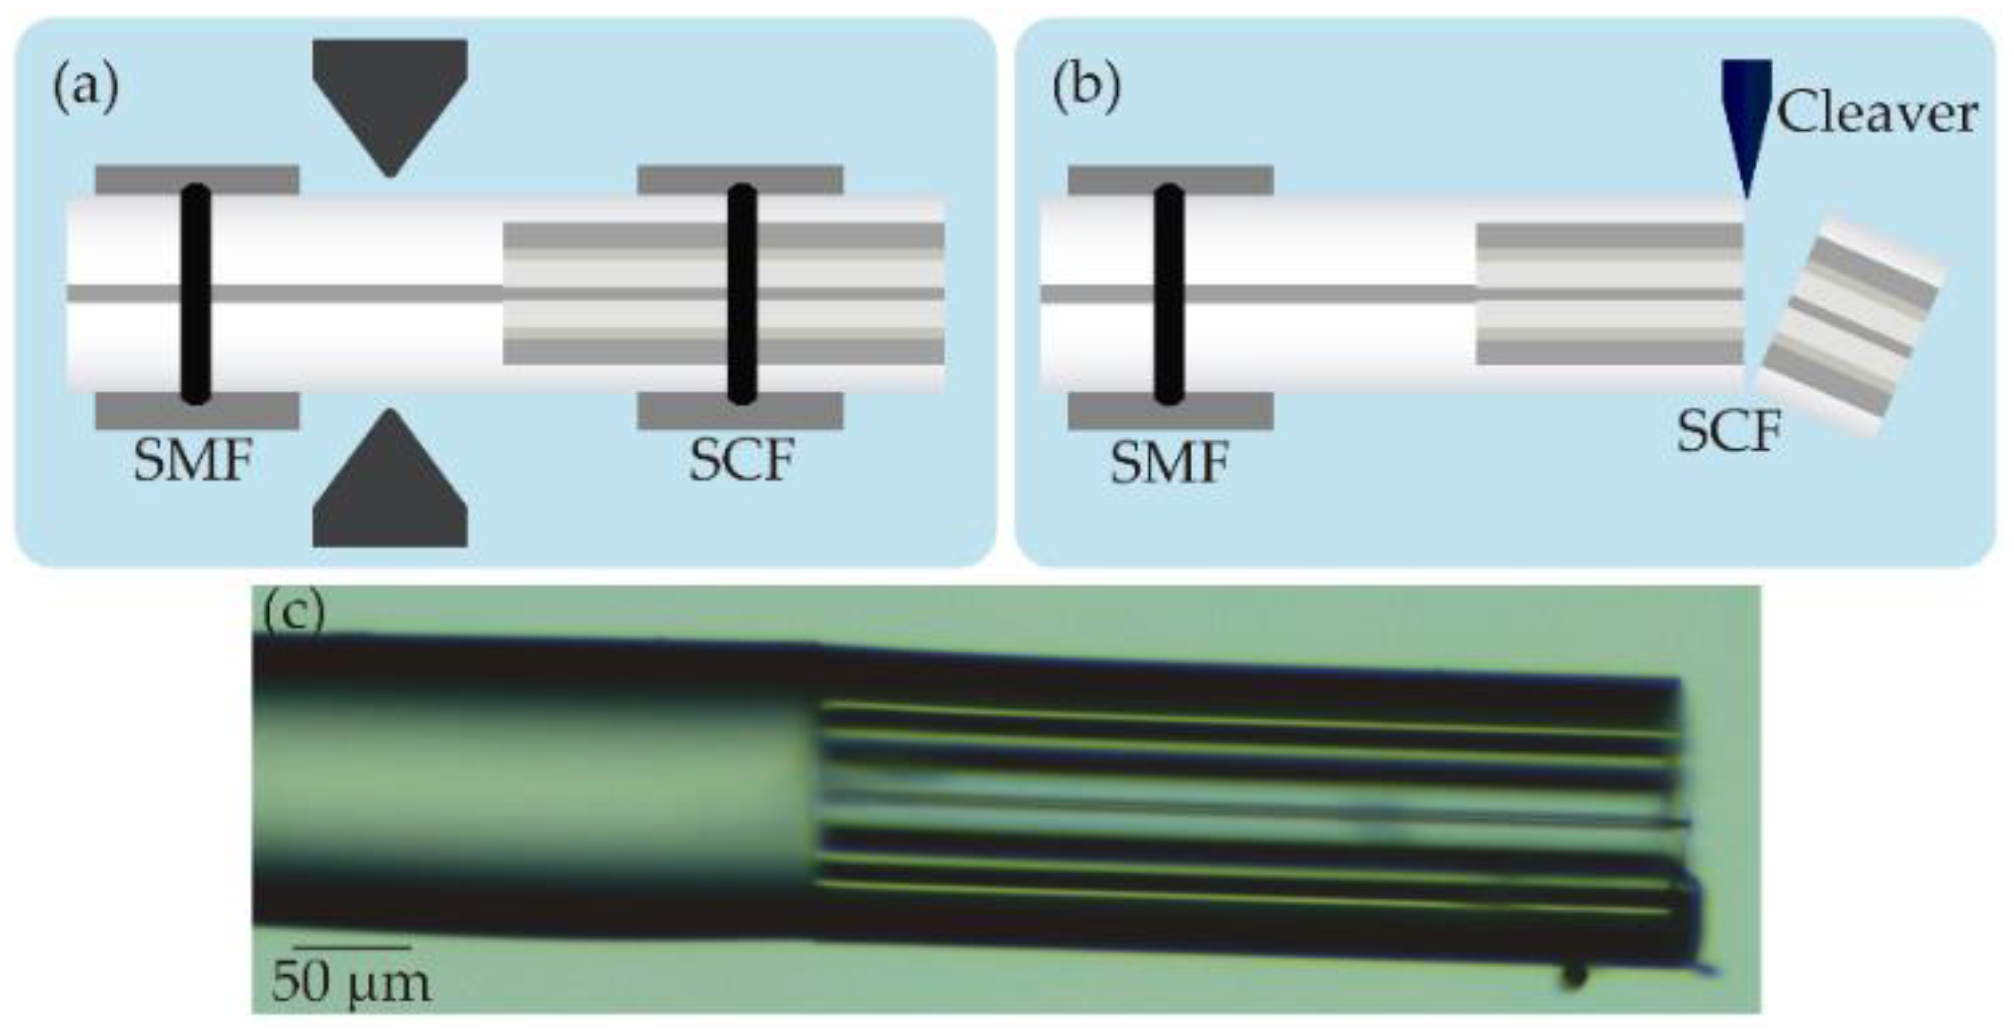
To fabricate the sensing head, the SCF was firstly stripped and spliced to a section of a commercial single mode fiber (SMF28, from Corning, New York, USA) using the manual mode of the fusion splicer. The splicing power and time were set to 10 arb. units and 500 ms, respectively. For comparison purposes, the splicing parameters in the automatic mode are 20 arb. units and 2000 ms. The splicing was done with a lateral offset to minimize potential damage produced by the arc discharge to the suspended core. Therefore, the arc discharge was mainly applied in the SMF, as evidenced in
Figure 2a. After the splicing procedure, the SCF was cleaved under a magnifying lens, assuring a balanced compromise between the sensor compactness and spectral readability (
Figure 2b). Several sensing heads were produced and characterized to achieve the optimal parameters (both splicing parameters and cavity length).
Figure 2c presents the micrograph of the sensing head, which has a length (
LFP) of 365 μm.
The sensor was then connected in a typical reflection scheme, has shown in
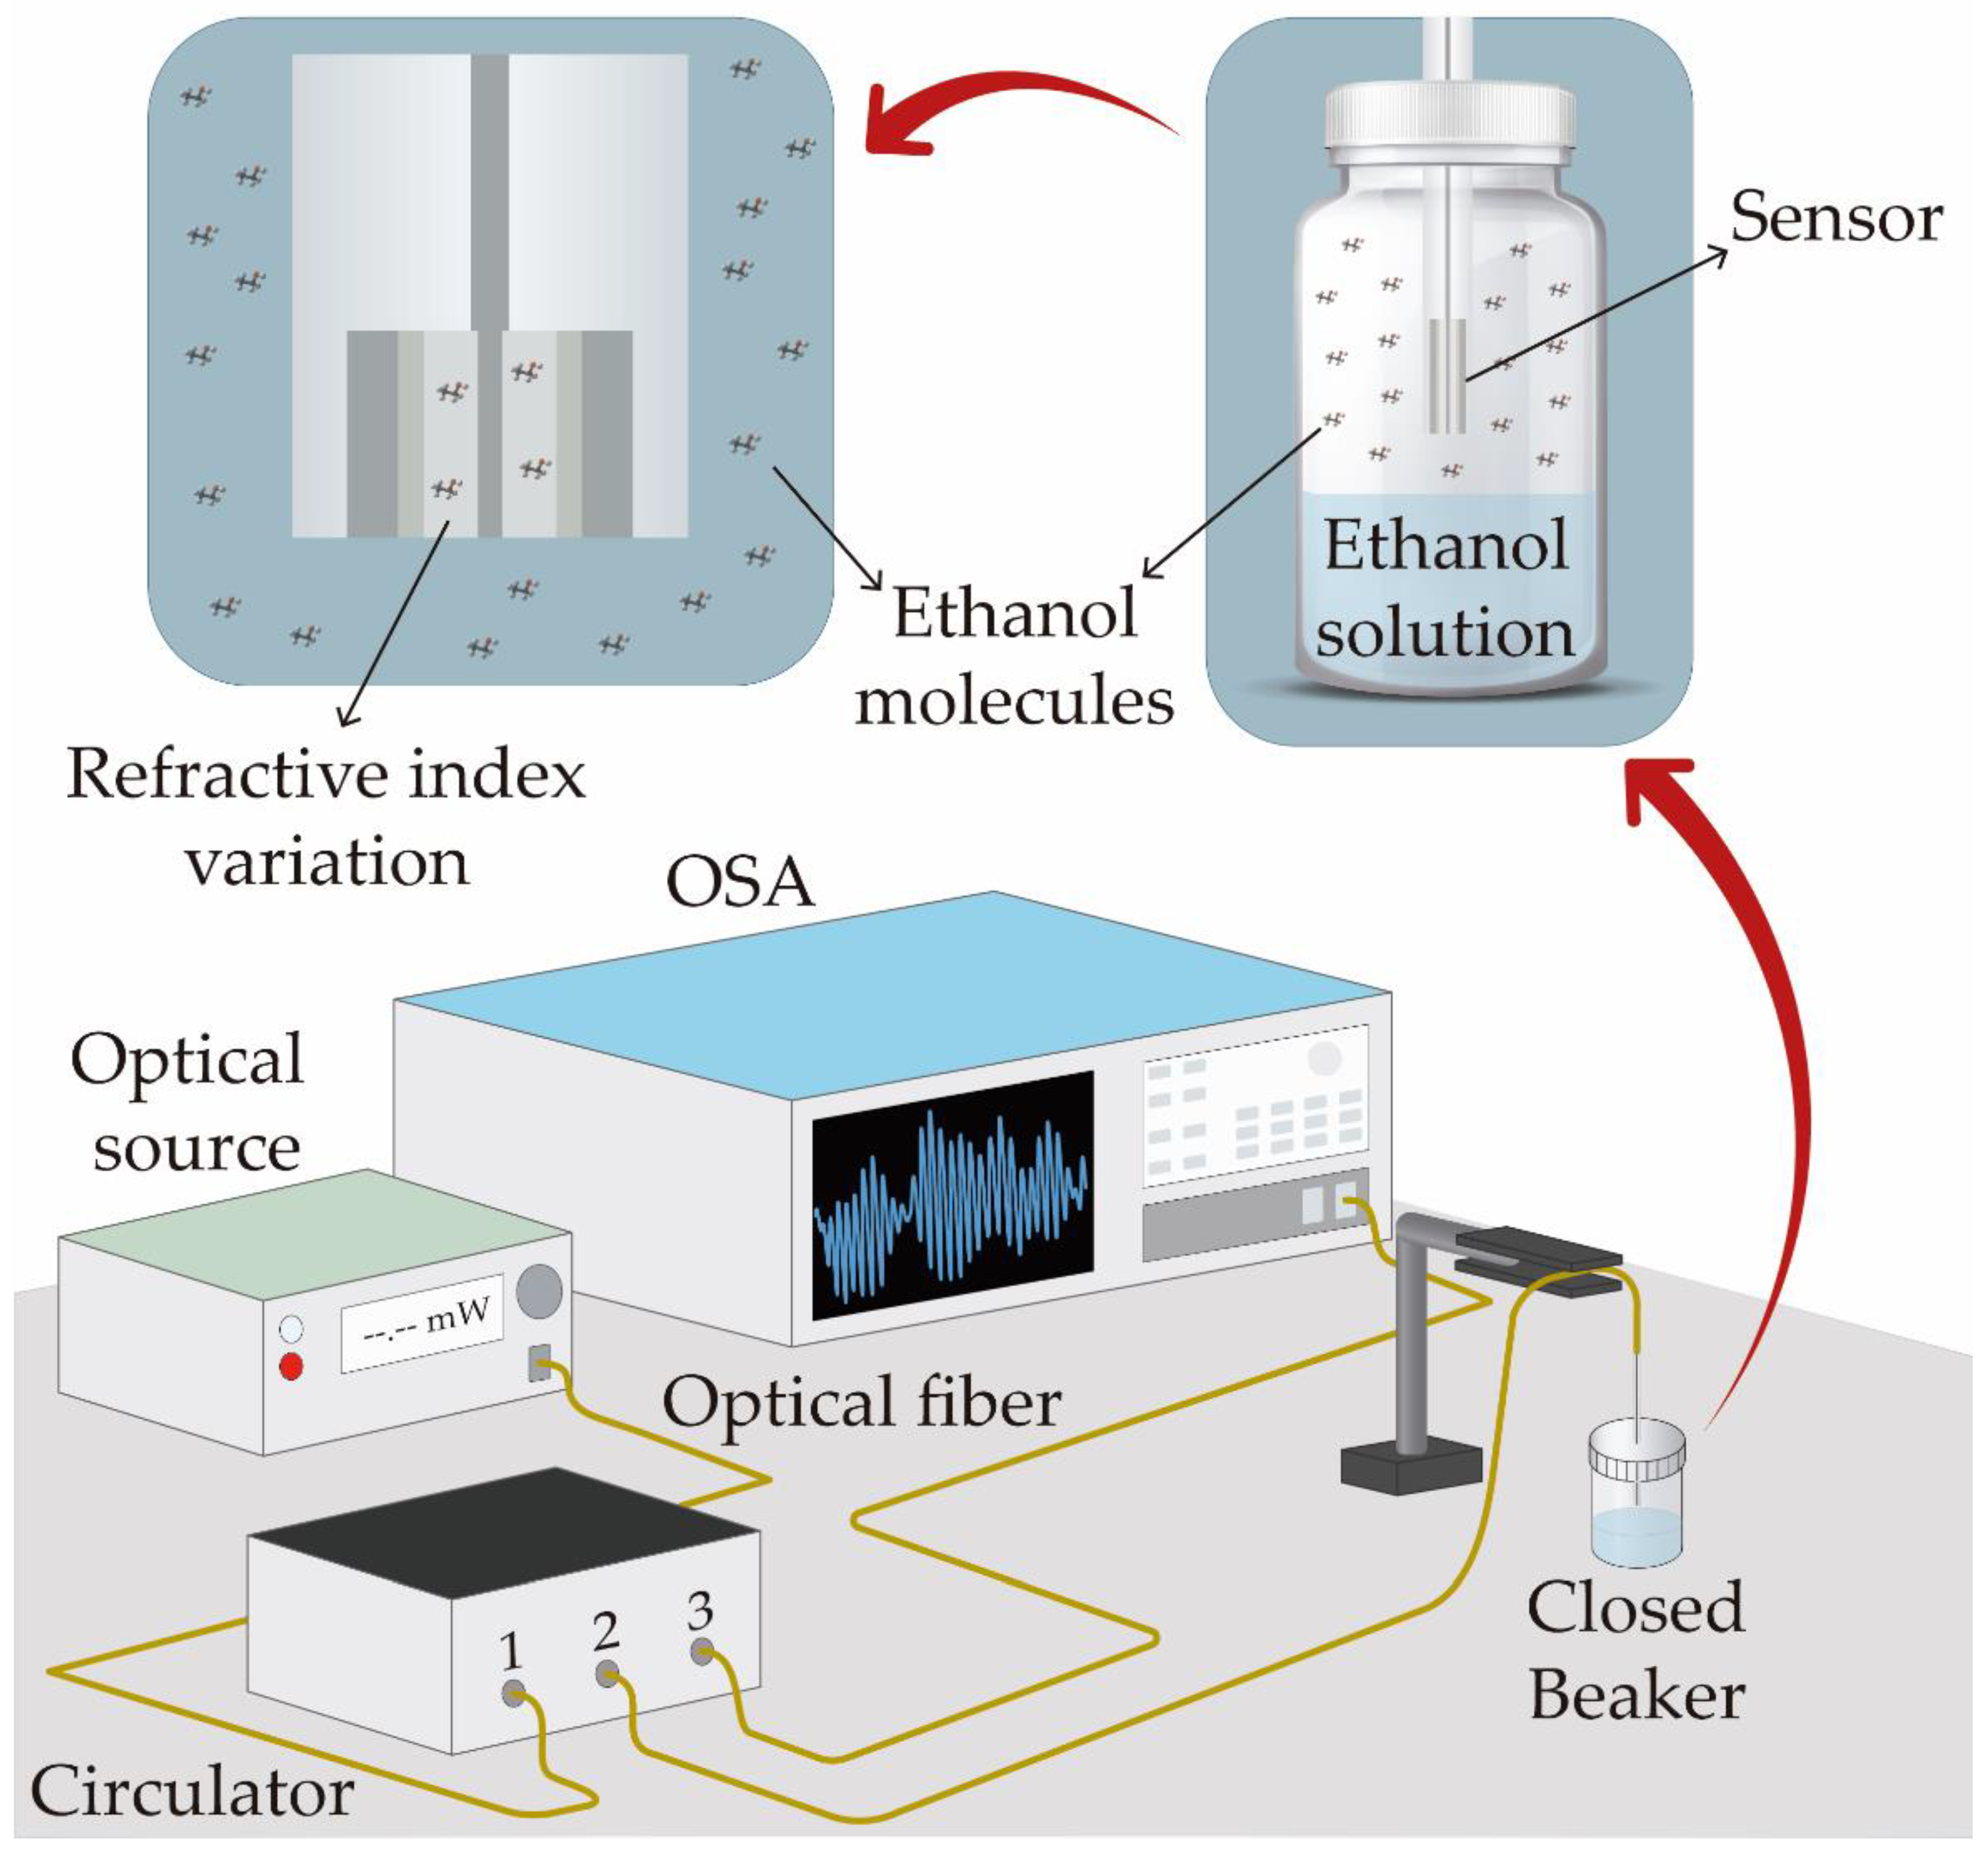
Figure 3. The broadband optical source (Amonics LS—CL-17-B-FA, Hong Kong), centered at 1570 nm, with a bandwidth of 80 nm, was connected to the first port of an optical circulator. The sensor was connected to the second port, whereas the optical spectrum analyzer (OSA, Anritsu MS9740A, Kanagawa, Japan), operating with a resolution of 0.02 nm, was connected to the third port.
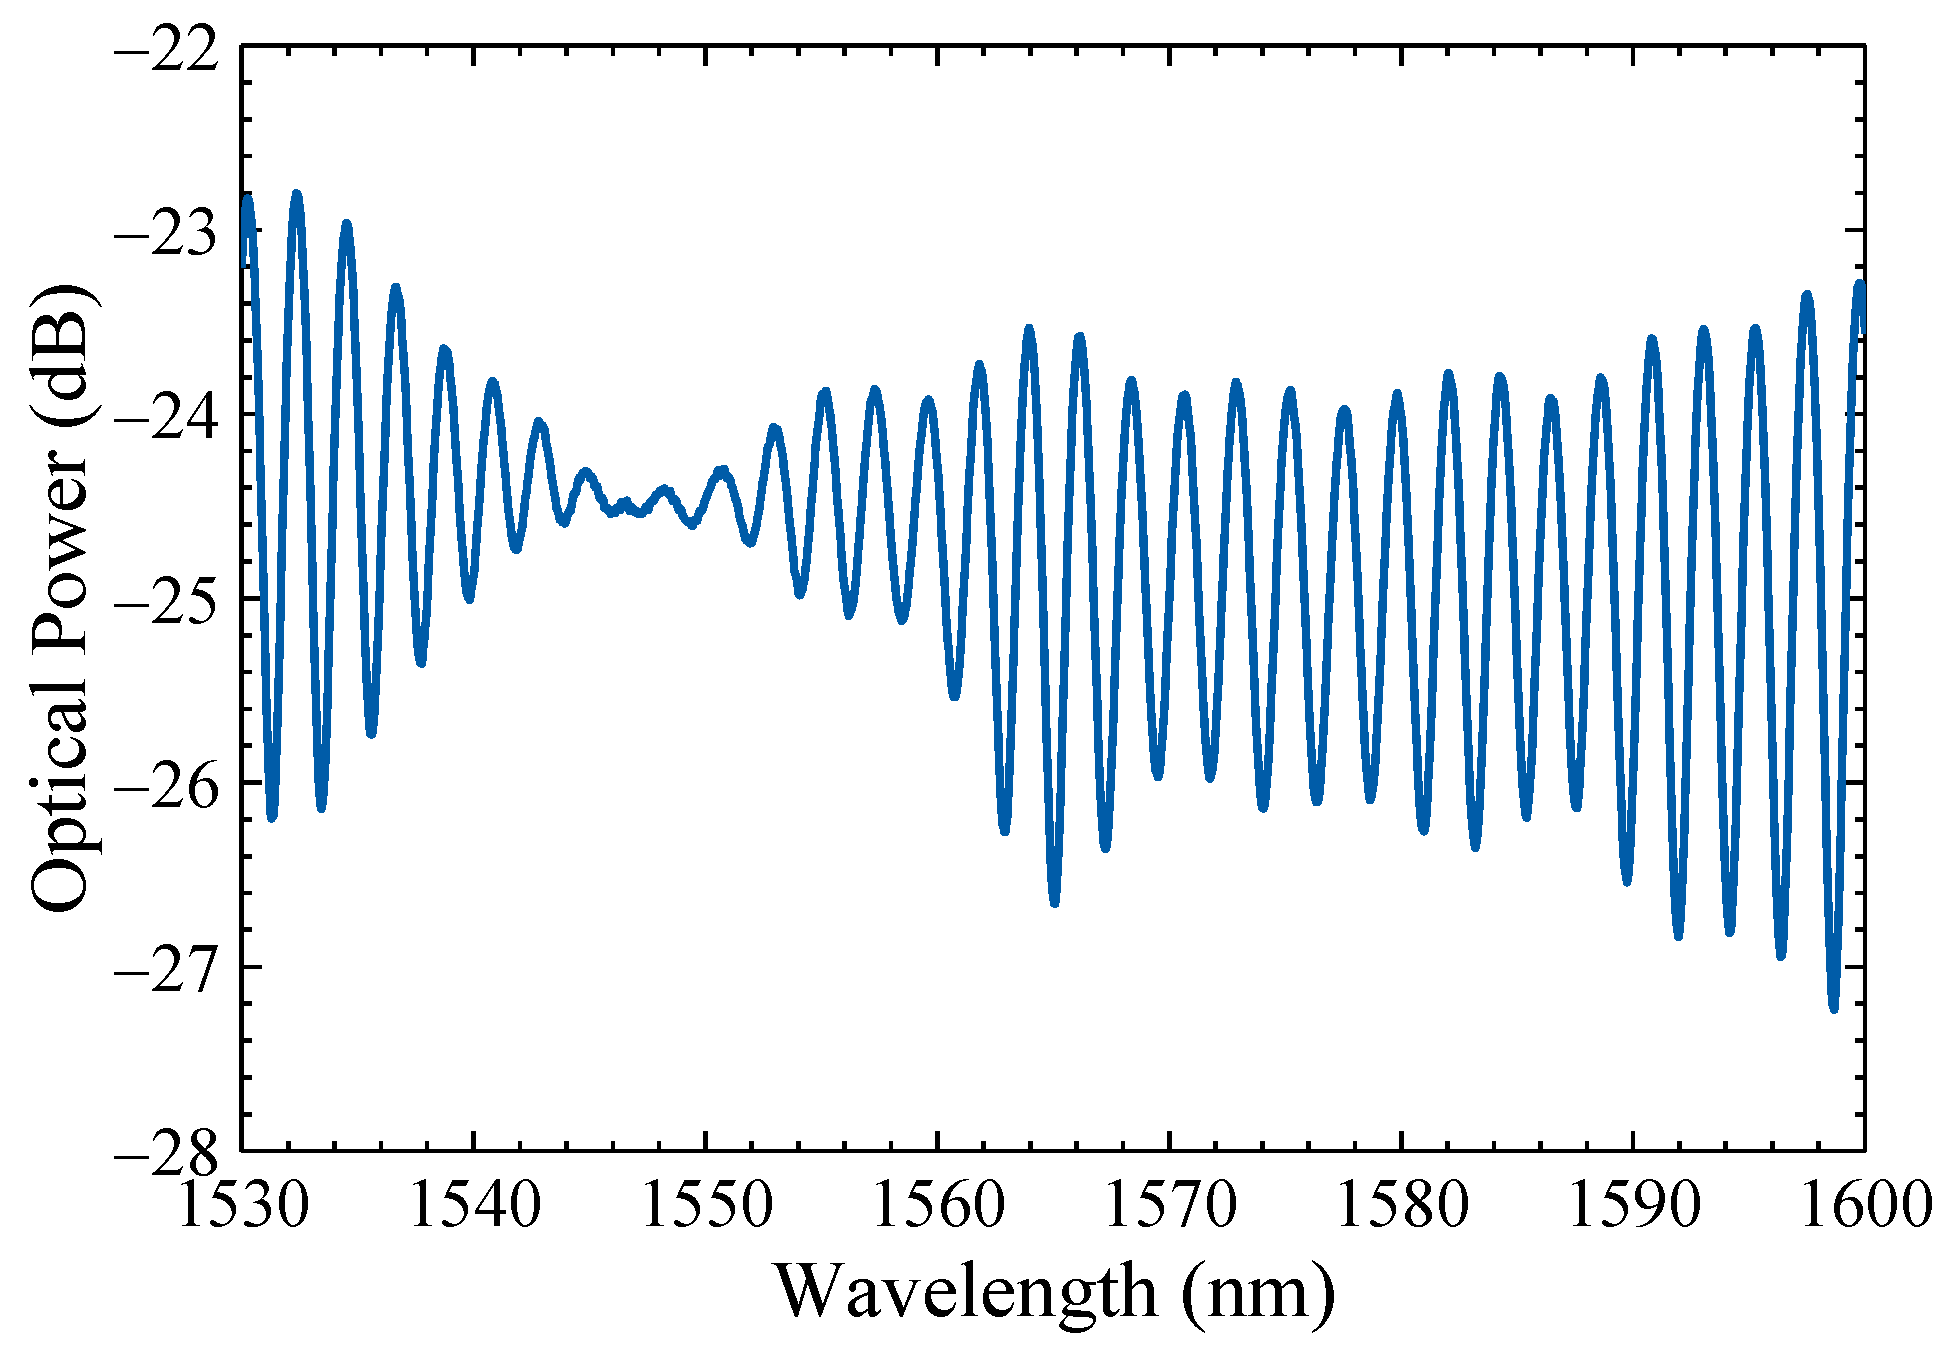
The sensor reflection spectrum, shown in
Figure 4, shows an interferometric pattern typical of a Fabry–Perot interferometer. For simplicity purposes, the two-wave interferometer was considered, which allows us to consider the wavelengths of two adjacent maxima, and the expression:
to calculate the effective refractive index of light propagating in the suspended core, obtaining a value of 1.433, was used.
To attain atmospheres with different concentrations of ethanol molecules, a set of 11 ethanol-water mixtures was done, starting with pure ethanol (99.9% purity from Sigma-Aldrich, St. Louis, MO, USA) up to 100% deionized water, in steps of 10 wt.% of ethanol. The mixtures were prepared with a magnetic stirrer and let to stabilize during 24 h at room temperature (~19 °C). The experiments were carried out at constant room temperature (~19 °C) by placing the sensor head in the gas atmosphere of the closed beakers, each one containing different ethanol concentrations. For each ethanol mixture, there was a waiting time of 90 min to achieve stabilization, recording several spectra during this time. Between measurements, the sensor head was left in the ambient atmosphere for 10 min to eliminate cumulative fluctuations between solutions, mainly due to possible condensation effects.
3. Results
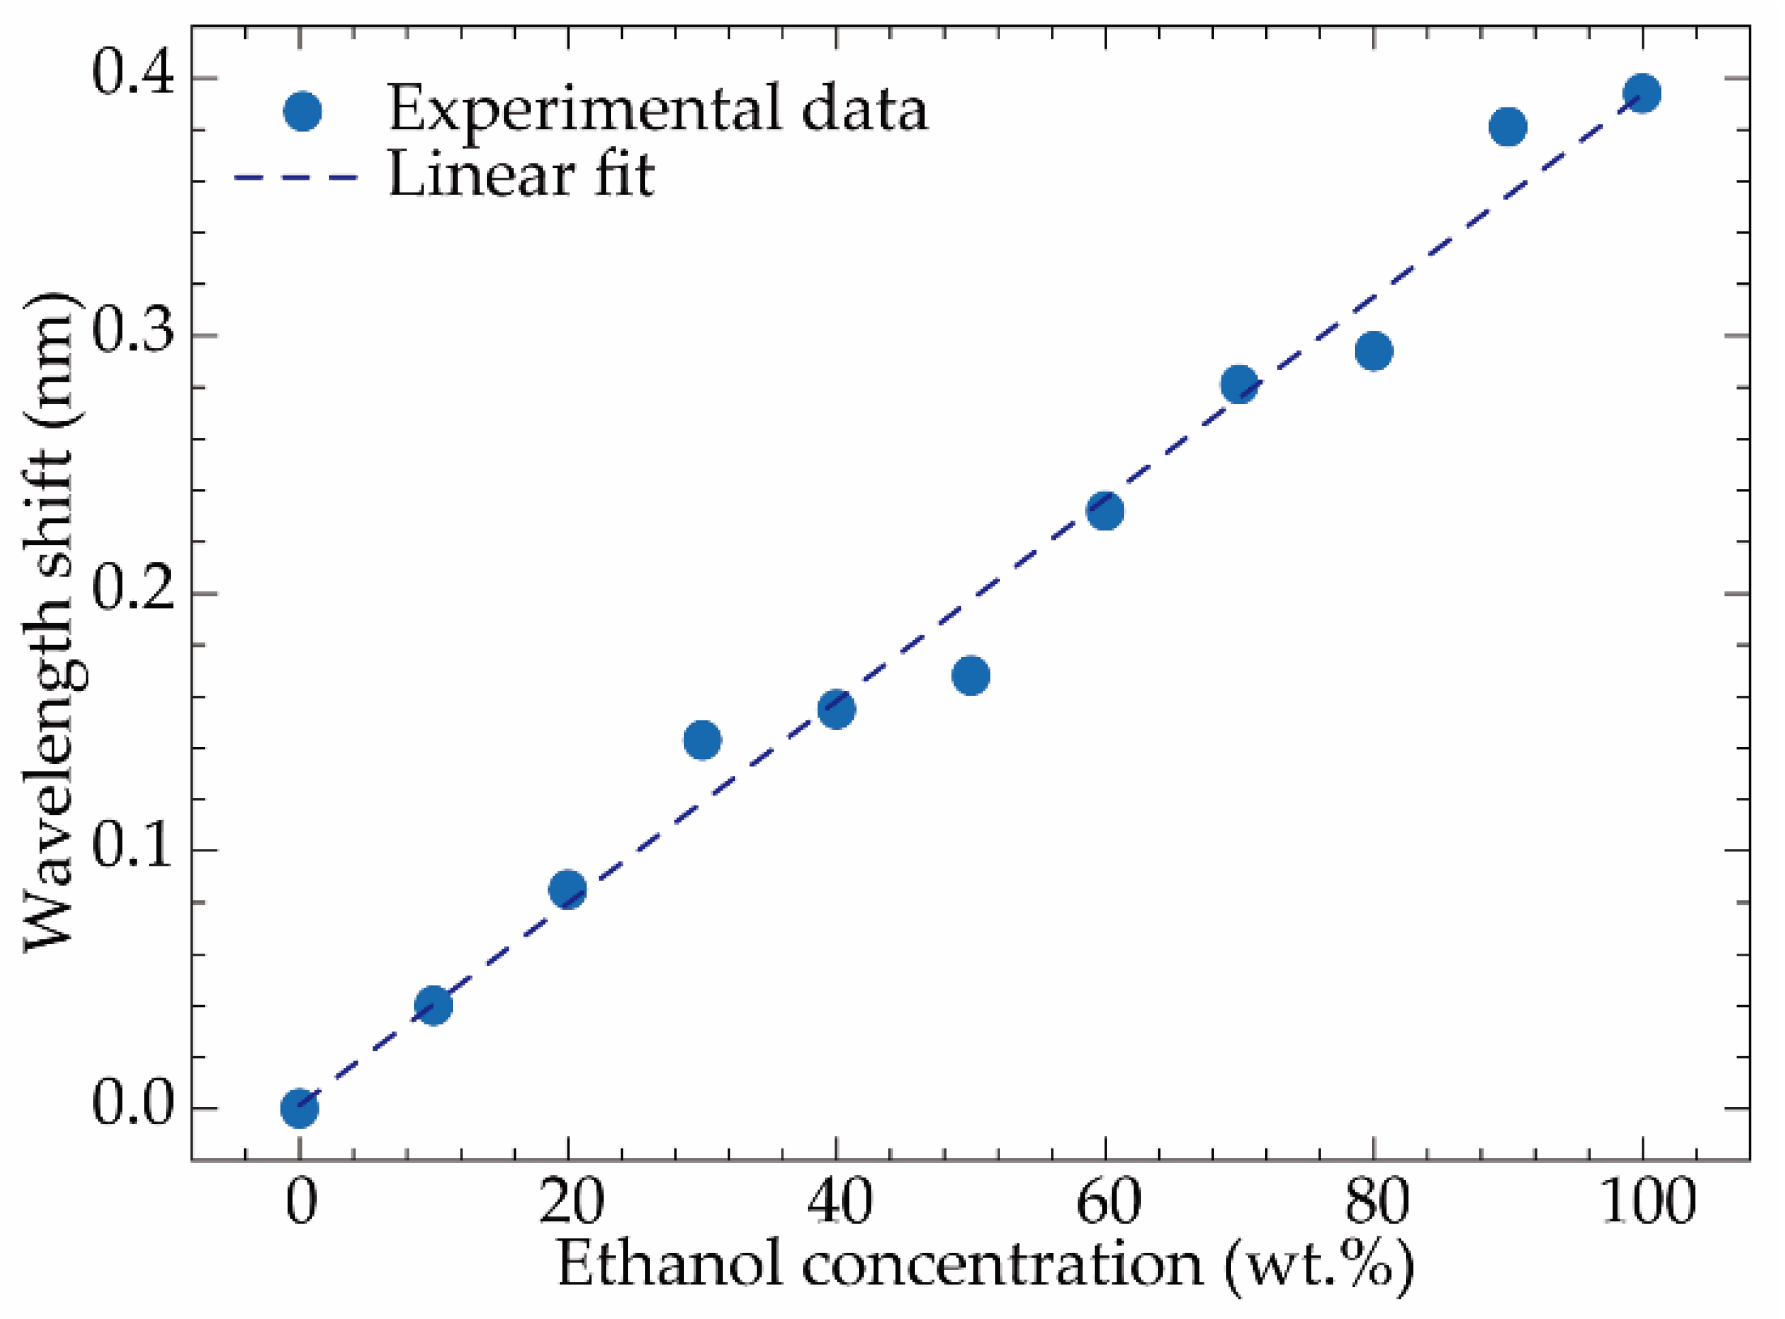
As the sensor is subjected to atmospheres with different concentrations of ethanol, a shift towards longer wavelengths (red shift) is observed in the spectral response. This is due to an increase in the refractive index of the atmosphere with the increase in ethanol concentration. The wavelength shift of one peak is shown in
Figure 5. By applying a linear fitting to the entire dynamic range, a sensitivity of (3.9 ± 0.2) pm/wt.% (R
2 > 0.983) is attained. As the refractive index in the hollow regions increases, there is also a change in the effective refractive index of the mode propagating in the SCF, due to the evanescent field [
17]. This leads to the red shift observed in
Figure 5.
Notice that, although the changes in the ethanol concentration resulted in a variation in the atmosphere refractive index, with the current experimental setup, it was not possible to estimate this variation. Further studies should be carried out with an adequate experimental procedure to estimate the sensor sensitivity towards refractive index and to better compare with other sensors presented in the literature. To assess the sensor reproducibility, the same experiment was carried out using other sensing heads. The behavior was similar, although the sensitivity attained was slightly affected by the sensor length. Therefore, in the context of a real application, a previous calibration should be done to each sensing head produced.
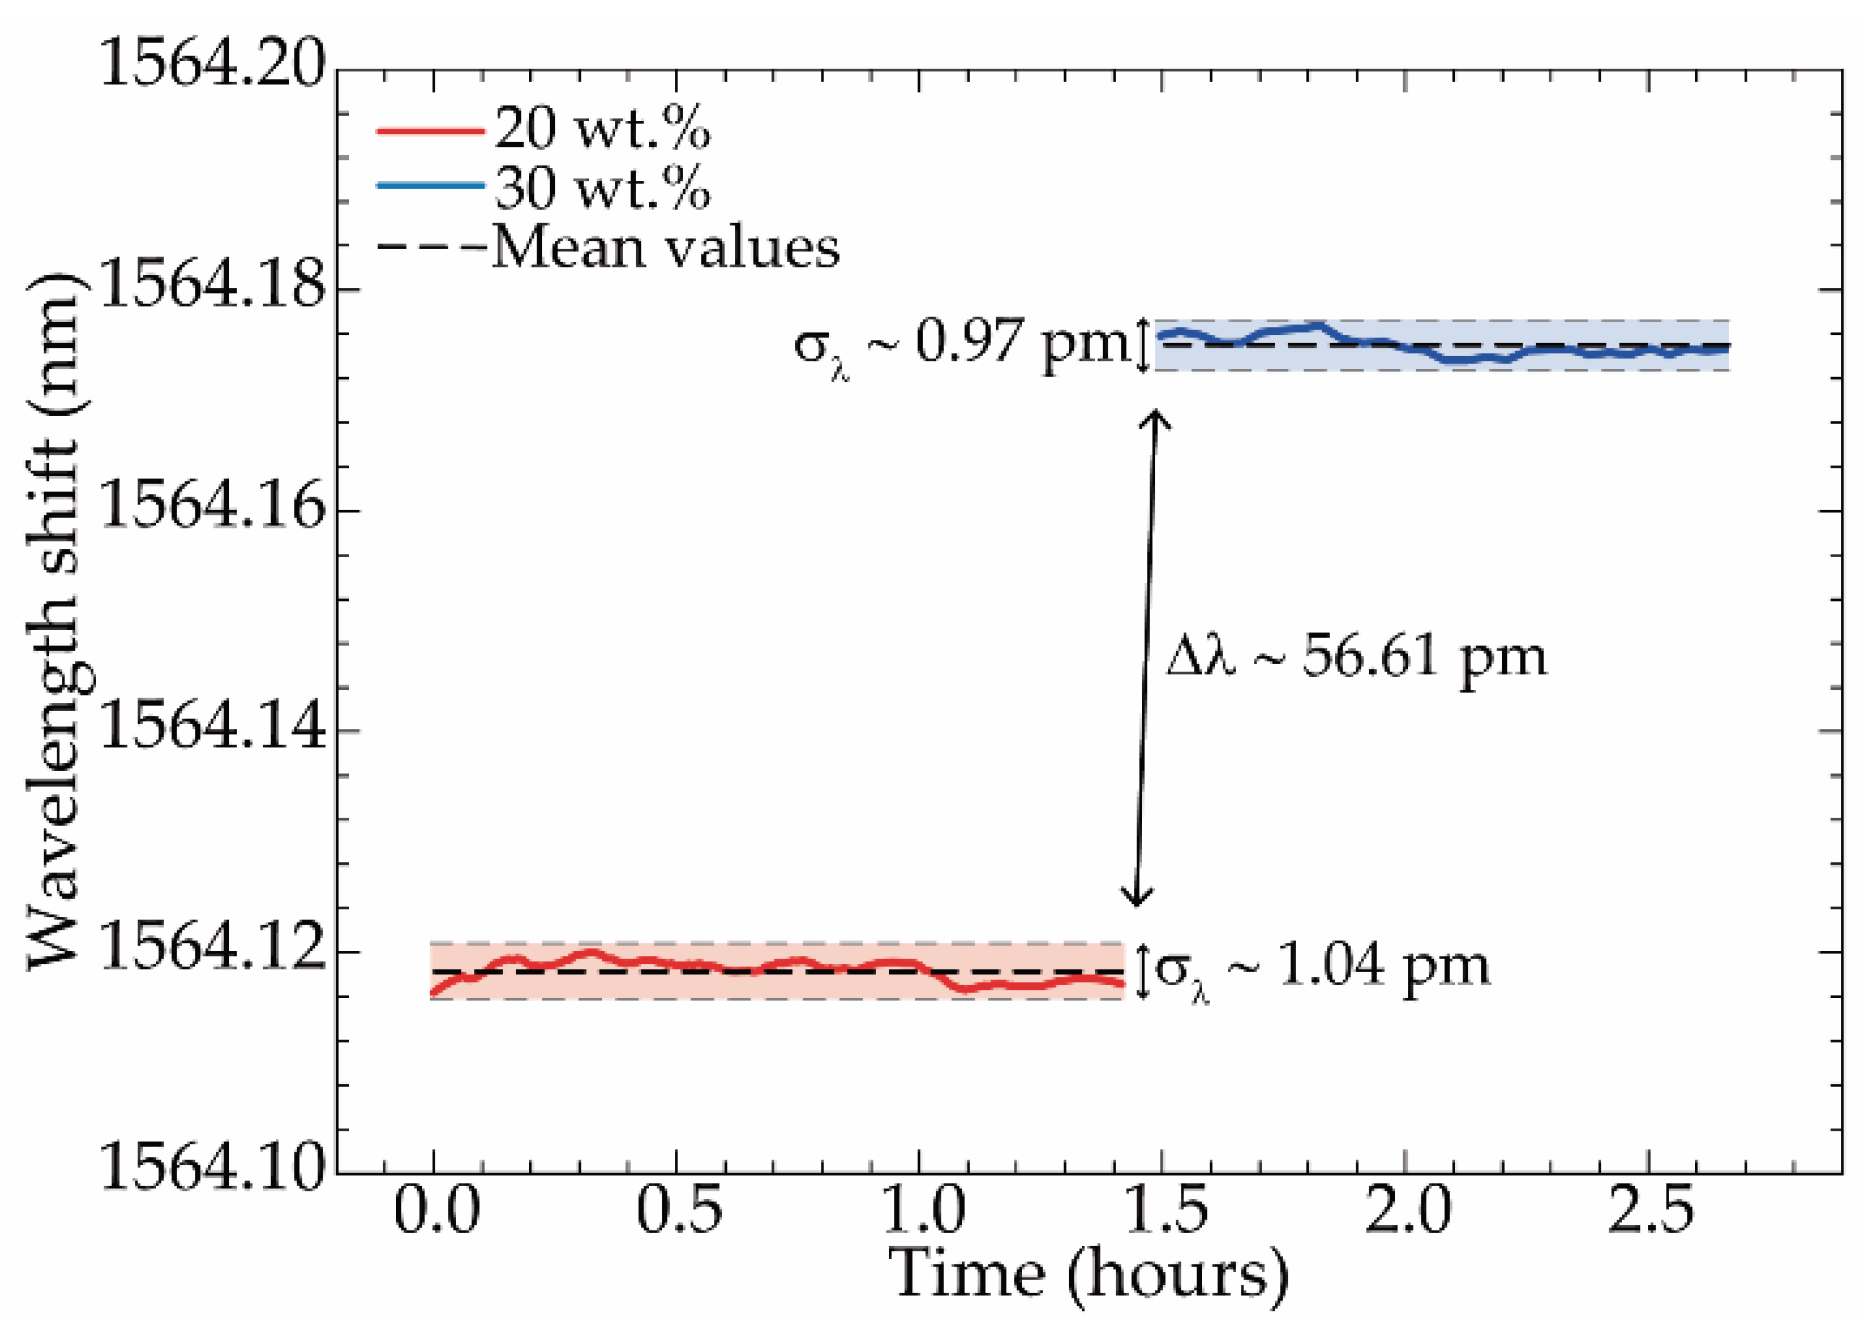
To determine the sensor’s resolution for the detection of gaseous ethanol, its spectral response was monitored over a period of 90 min (intervals of 30 s) at room temperature, for the steps of 20 wt.% and 30 wt.% of gaseous ethanol concentration, as depicted in
Figure 6. These two steps were chosen for the resolution analysis since they comprise the range of alcoholic concentration present in most fortified wines and distilled drinks.
The wavelength mean values of 1564.118 and 1564.175 nm were obtained for the 20 wt.% and 30 wt.% steps, respectively, and a resolution value (δ
%m) of 0.7 wt.% was attained through the following equation.
where
σλ is the maximum wavelength standard deviation, and Δ(wt.%) and Δ
λ are the ethanol concentration and wavelength differences between each step, respectively.
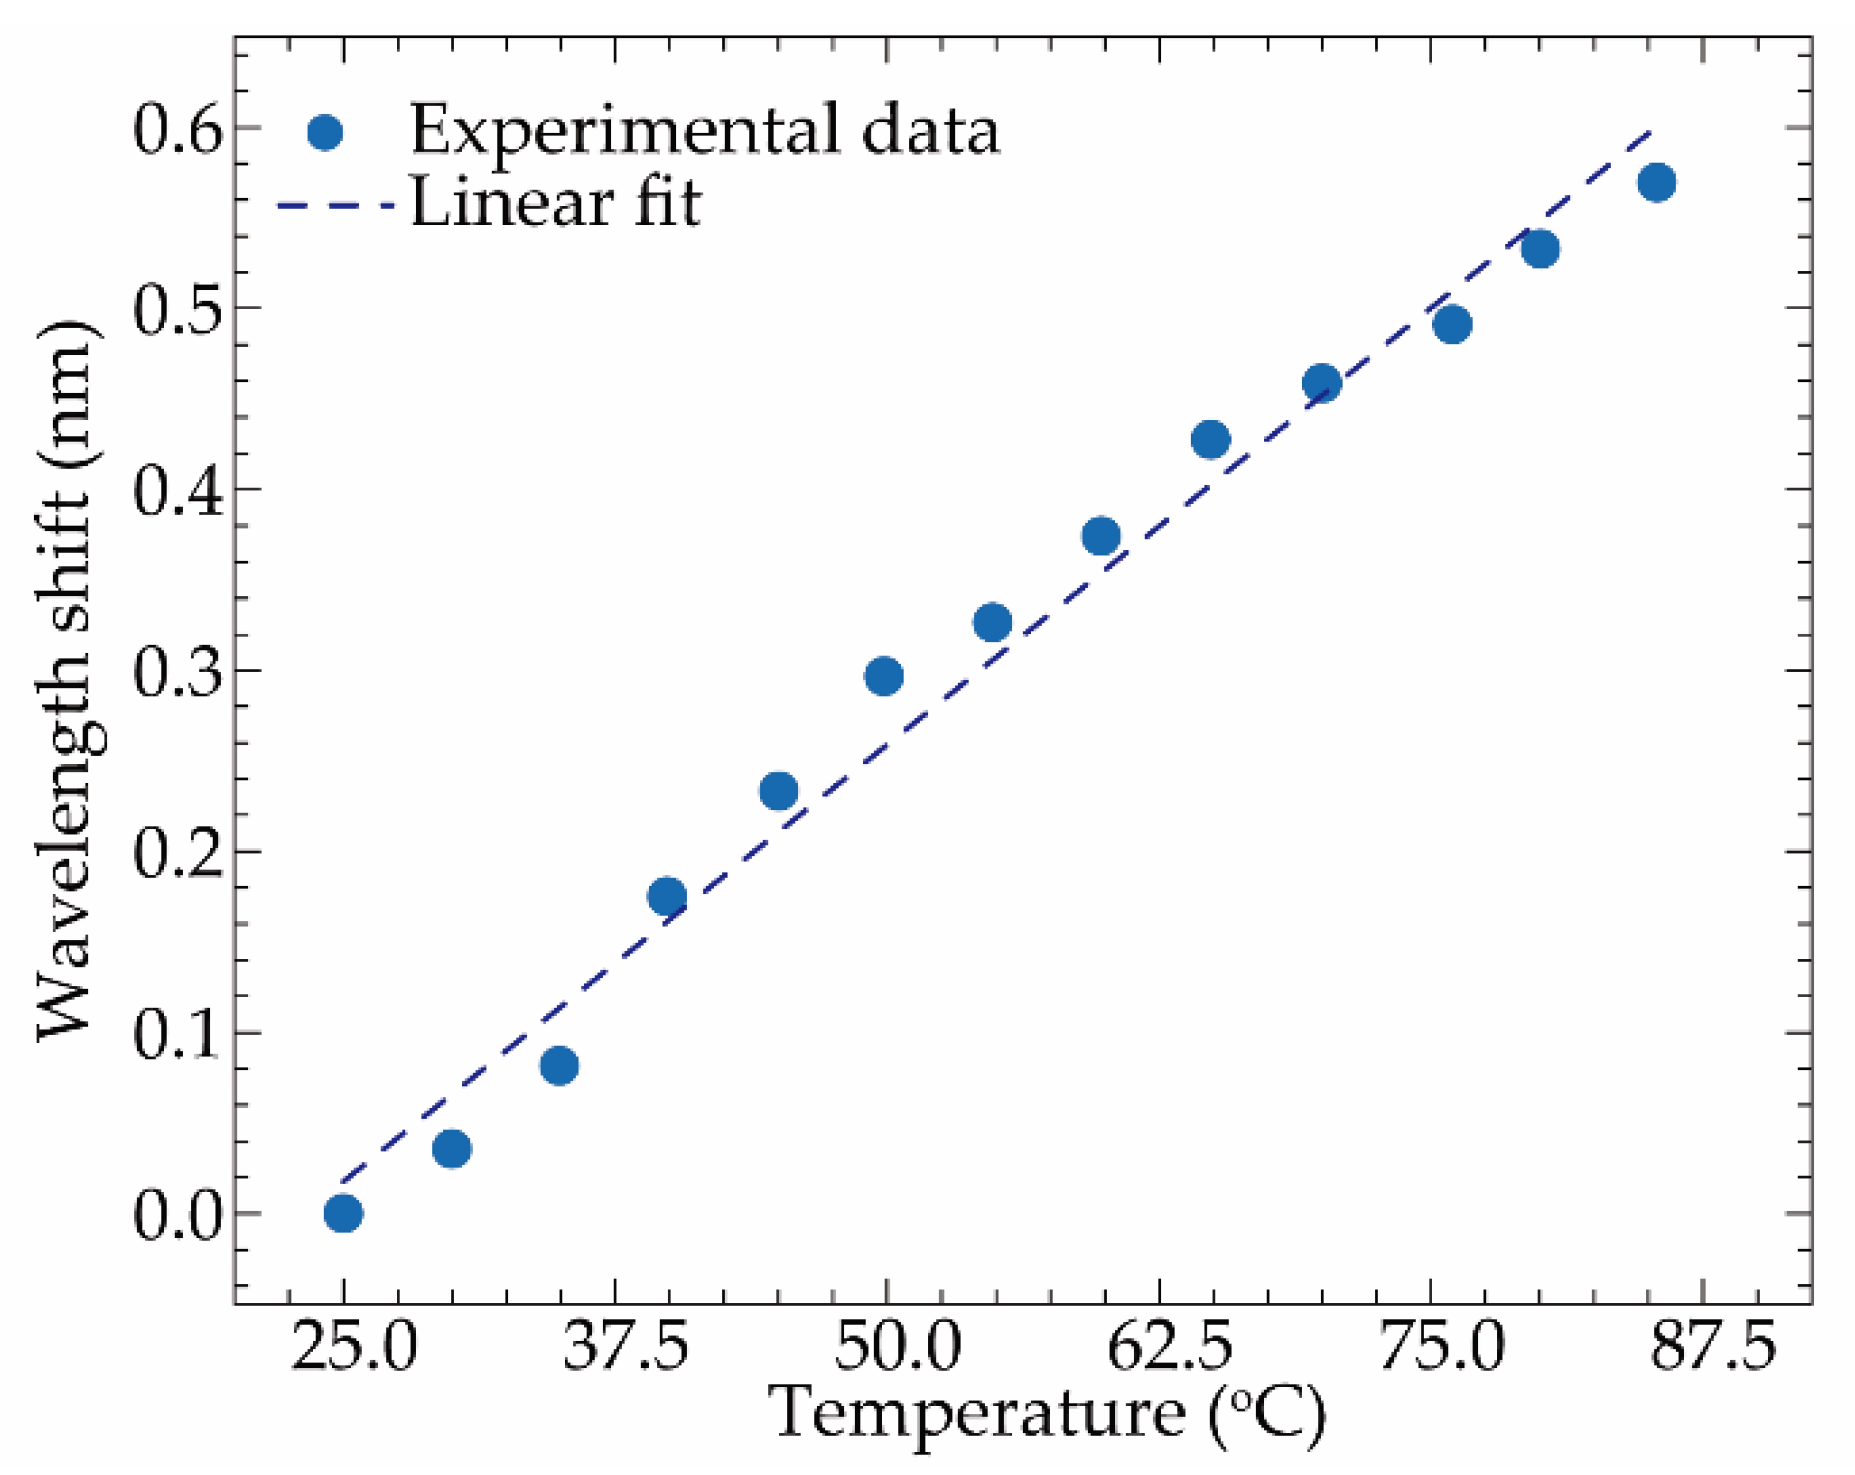
To assess the sensor cross-sensitivity with temperature variations, a thermal characterization was conducted using a custom thermal chamber based on a Peltier module. A total of 13 temperature steps were used in the thermal characterization, with the temperature ranging between 25 and 87 °C and a stabilization time of 10 min. The experimental data, and correspondent linear fit, are depicted in
Figure 7.
A thermal sensitivity of (9.7 ± 0.4) pm/°C was obtained from the linear fitting (R
2 = 0.981), which is a similar result to the ones attained with typical fiber sensors solely based on silica’s thermal expansion coefficient and thermo-optic effect (e.g., fiber Bragg gratings [
18]). Therefore, a cross-sensitivity value of 2.49 wt.%/°C was attained, verifying the sensor’s suitability for the detection of gaseous ethanol concentration in controlled environments (stable and constant temperature). This cross-sensitivity could be mitigated by adding an extra sensing element that would only detect temperature variations. Still, the sensor linear performance for such a wide range of ethanol concentration makes it a suitable solution to monitor, for instance, the fortification stage of several wines (e.g., Madeira wine 18–20% (
v/
v) [
19]), or to assess the distillation/aging stages of stronger drinks, such as distilled beverages (e.g., whiskey 40–50% (
v/
v) [
20]).
4. Conclusions
In summary, a novel optical fiber tip sensor, based on a Fabry–Perot interferometer comprised by a small section of SCF spliced to a standard SMF, was developed for the detection and monitoring of volatile organic compounds in the gas phase. The device experimental characterization to different concentrations of ethanol/water mixtures revealed a linear response through the entire range, attaining a maximum sensitivity of 3.9 pm/wt.%. To assess the temperature influence on its response, a thermal characterization was performed, revealing a sensitivity of 9.7 pm/°C, thus achieving a cross-sensitivity of 2.49 wt.%/°C. Despite the existence of a small cross-sensitivity, any issues could be addressed in the future by adding a temperature sensor (e.g., a fiber Bragg grating), or by assuring thermal stabilization of the environment. Therefore, the reduced footprint, electric passivity linear response, stability, and sensitivity to VOCs concentrations make the developed sensor a strong candidate to monitor several applications comprising the detection of VOCs molecules in the gas phase, such as the different stages of the production of several wines and distilled beverages.
Author Contributions
Conceptualization, T.P., M.S.F. and A.S.N.; methodology, T.P., M.S.F. and A.S.N.; validation, T.P., M.S.F. and A.S.N.; formal analysis, T.P., M.S.F. and A.S.N.; investigation, T.P., M.S.F. and A.S.N.; resources, J.B. and J.K.; data curation, T.P., M.S.F. and A.S.N.; writing—original draft preparation, T.P. and M.S.F.; fiber drawing: J.B. and J.K.; writing—review and editing, T.P., M.S.F., J.B. and J.K.; supervision, M.S.F.; project administration, M.S.F.; funding acquisition, M.S.F., J.B. and J.K. All authors have read and agreed to the published version of the manuscript.
Funding
This work was financially supported by the project AROMA, funded by FEDER, through CENTRO2020-Programa Operacional Regional do Centro, CENTRO-01-0145-FEDER-031568, and by national funds (OE), PTDC/EEI-EEE/31568/2017, UIDB/50025/2020 & UIDP/50025/2020, through FCT/MCTES. The work of Marta S. Ferreira was supported by the research fellowship CEECIND/00777/2018. The work was also funded by the German Federal Ministry of Education and Research (BMBF): “The Innovative Growth Core TOF” (Tailored Optical Fibers, FKZ 03WKCV03E) as well as the bilateral cooperation FCT/DAAD (FLOW, Project ID: 57518590).
Institutional Review Board Statement
Not applicable.
Informed Consent Statement
Not applicable.
Data Availability Statement
Not applicable.
Conflicts of Interest
The authors declare no conflict of interest.
References
- European Union. European Commission Regulation (EU) 2019/787 of the European Parliament and of the Council. Off. J. Eur. Union 2019, L 130, 1–54. [Google Scholar]
- Coldea, T.E.; Mudura, E.; Socaciu, C. Advances in distilled beverages authenticity and quality testing. In Ideas and Applications Toward Sample Preparation for Food and Beverage Analysis; InTech: London, UK, 2017. [Google Scholar]
- Elosua, C.; Matias, I.R.; Bariain, C.; Arregui, F.J. Volatile organic compound optical fiber sensors: A review. Sensors 2006, 6, 1440–1465. [Google Scholar] [CrossRef] [Green Version]
- Mitsubayashi, K.; Kon, T.; Hashimoto, Y. Optical bio-sniffer for ethanol vapor using an oxygen-sensitive optical fiber. Biosens. Bioelectron. 2003, 19, 193–198. [Google Scholar] [CrossRef]
- Aziz, A.; Lim, H.N.; Girei, S.H.; Yaacob, M.H.; Mahdi, M.A.; Huang, N.M.; Pandikumar, A. Silver/graphene nanocomposite-modified optical fiber sensor platform for ethanol detection in water medium. Sens. Actuators B Chem. 2015, 206, 119–125. [Google Scholar] [CrossRef]
- Liu, D.; Kumar, R.; Wei, F.; Han, W.; Mallik, A.K.; Yuan, J.; Wan, S.; He, X.; Kang, Z.; Li, F.; et al. High sensitivity optical fiber sensors for simultaneous measurement of methanol and ethanol. Sens. Actuators B Chem. 2018, 271, 1–8. [Google Scholar] [CrossRef]
- Joe, H.-E.; Yun, H.; Jo, S.-H.; Jun, M.B.G.; Min, B.-K. A review on optical fiber sensors for environmental monitoring. Int. J. Precis. Eng. Manuf. Technol. 2018, 5, 173–191. [Google Scholar] [CrossRef]
- Zhao, Y.; Li, X.; Zhou, X.; Zhang, Y. Review on the graphene based optical fiber chemical and biological sensors. Sens. Actuators B Chem. 2016, 231, 324–340. [Google Scholar] [CrossRef]
- Yang, Y.; Zhou, D.; Liu, X.; Liu, Y.; Liu, S.; Miao, P.; Shi, Y.; Sun, W. Optical fiber sensor based on a cholesteric liquid crystal film for mixed VOC sensing. Opt. Express 2020, 28, 31872. [Google Scholar] [CrossRef] [PubMed]
- Grassini, S.; Ishtaiwi, M.; Parvis, M.; Vallan, A. Design and deployment of low-cost plastic optical fiber sensors for gas monitoring. Sensors 2014, 15, 485–498. [Google Scholar] [CrossRef] [PubMed]
- Lowder, T.L.; Gordon, J.D.; Schultz, S.M.; Selfridge, R.H. Volatile organic compound sensing using a surface-relief D-shaped fiber Bragg grating and a polydimethylsiloxane layer. Opt. Lett. 2007, 32, 2523–2525. [Google Scholar] [CrossRef] [PubMed]
- Wang, T.; Yasukochi, W.; Korposh, S.; James, S.W.; Tatam, R.P.; Lee, S.-W. A long period grating optical fiber sensor with nano-assembled porphyrin layers for detecting ammonia gas. Sens. Actuators B Chem. 2016, 228, 573–580. [Google Scholar] [CrossRef]
- Villatoro, J.; Kreuzer, M.P.; Jha, R.; Minkovich, V.P.; Finazzi, V.; Badenes, G.; Pruneri, V. Photonic crystal fiber interferometer for chemical vapor detection with high sensitivity. Opt. Express 2009, 17, 1447. [Google Scholar] [CrossRef] [PubMed] [Green Version]
- Lopez-Torres, D.; Lopez-Aldaba, A.; Elosua, C.; Auguste, J.; Jamier, R.; Roy, P.; Lopez-Amo, M.; Arregui, F. Comparison between different structures of suspended-core microstructured optical fibers for volatiles sensing. Sensors 2018, 18, 2523. [Google Scholar] [CrossRef] [PubMed] [Green Version]
- Jin, W.; Ho, H.L.; Cao, Y.C.; Ju, J.; Qi, L.F. Gas detection with micro- and nano-engineered optical fibers. Opt. Fiber Technol. 2013, 19, 741–759. [Google Scholar] [CrossRef] [Green Version]
- Lopez-Torres, D.; Elosua, C.; Arregui, F.J. Optical fiber sensors based on microstructured optical fibers to detect gases and volatile organic compounds—A review. Sensors 2020, 20, 2555; [Google Scholar] [CrossRef] [PubMed]
- Martan, T.; Nemecek, T.; Komanec, M.; Ahmad, R.; Zvanovec, S. Refractometric detection of liquids using tapered optical fiber and suspended core microstructured fiber: A comparison of methods. Appl. Opt. 2017, 56, 2388–2396. [Google Scholar] [CrossRef] [PubMed]
- Riza, M.A.; Go, Y.I.; Harun, S.W.; Maier, R.R.J. FBG Sensors for environmental and biochemical applications—A review. IEEE Sens. J. 2020, 20, 7614–7627. [Google Scholar] [CrossRef]
- Câmara, J.S.; Alves, M.A.; Marques, J.C. Changes in volatile composition of Madeira wines during their oxidative ageing. Anal. Chim. Acta 2006, 563, 188–197. [Google Scholar] [CrossRef] [Green Version]
- DiLoreto, J.T.; Siegel, M.; Hinchey, D.; Valerio, H.; Kinzel, K.; Lee, S.; Chen, K.; Shoaff, J.R.; Kenney, J.; Jernigan, D.H.; et al. Assessment of the average price and ethanol content of alcoholic beverages by brand—United States, 2011. Alcohol. Clin. Exp. Res. 2012, 36, 1288–1297. [Google Scholar] [CrossRef] [PubMed] [Green Version]
| Publisher’s Note: MDPI stays neutral with regard to jurisdictional claims in published maps and institutional affiliations. |
© 2022 by the authors. Licensee MDPI, Basel, Switzerland. This article is an open access article distributed under the terms and conditions of the Creative Commons Attribution (CC BY) license (https://creativecommons.org/licenses/by/4.0/).


