Article

Clinical Comparison of the Glomerular Filtration Rate Calculated from Different Renal Depths and Formulae

1
Department of Nuclear Medicine, Kaohsiung Medical University Hospital, No.100, Tzyou 1st Road, Kaohsiung 80756, Taiwan
2
Department of Medical Imaging and Radiological Sciences, Kaohsiung Medical University, Kaohsiung 80756, Taiwan
3
Department of Electrical Engineering, I-Shou University, Kaohsiung 84001, Taiwan
4
School of Medicine, College of Medicine, Kaohsiung Medical University, Kaohsiung 80756, Taiwan
5
Neuroscience Research Center, Kaohsiung Medical University, Kaohsiung 80756, Taiwan
*
Author to whom correspondence should be addressed.
Appl. Sci. 2022, 12(2), 698; https://doi.org/10.3390/app12020698
Submission received: 19 November 2021 / Revised: 3 January 2022 / Accepted: 6 January 2022 / Published: 11 January 2022

Abstract

:
A camera-based method using Technetium-99m diethylenetriaminepentaacetic acid (Tc-99m DTPA) is commonly used to calculate glomerular filtration rate (GFR), especially, as it can easily calculate split renal function. Renal depth is the main factor affecting the measurement of GFR accuracy. This study aimed to compare the difference of renal depths between three formulae and a CT scan, and, additionally, to calculate the GFRs by four methods. We retrospectively reviewed the medical records of patients receiving a renal dynamic scan. All patients underwent a laboratory test within one month, and a computed tomography (CT) scan within two months, before or after the renal dynamic scan. The GFRs were calculated by employing a renal dynamic scan using renal depth measured in three formulae (Tonnesen’s, Itoh K’s, and Taylor’s), and a CT scan. The renal depths measured by the above four methods were compared, and the GFRs were compared to the modified estimated GFR (eGFR). Fifty-one patients were enrolled in the study. The mean modified eGFR was 60.5 ± 42.7 mL/min. The mean GFRs calculated by three formulae and CT were 45.3 ± 23.3, 54.7 ± 27.5, 56.5 ± 26.3, and 63.7 ± 30.0, respectively. All of them correlated well with the modified eGFR (r = 0.87, 0.87, 0.87, and 0.84, respectively). The Bland–Altman plot revealed good consistency between the calculated GFR by Tonnesen’s and the modified eGFR. The renal depths measured using the three formulae were smaller than those measured using the CT scan, and the right renal depth was always larger than the left. In patients with modified eGFR > 60 mL/min, the GFR calculated by CT was the closest to the modified eGFR. The Renal depth measured by CT scan is deeper than that using formula, and it influences the GFR calculated by Gate’s method. The GFR calculated by CT is more closely related to modified eGFR when modified eGFR > 60 mL/min.

1. Introduction

Globally, people suffering from chronic kidney disease (CKD), acute kidney injury (AKI), and renal replacement therapy exceed 805 million in total [1]. Renal diseases are a notable public health issue and a leading, heavy, burden on the medical system. By 2040, CKD is predicted to become the fifth leading cause of death [2]. Renal diseases are not easily diagnosed, as they are asymptomatic in their early stages. Therefore, the accurate measurement of the glomerular filtration rate (GFR) is critical for detecting renal function and for clinical treatment.
Although inulin clearance has been the widely accepted gold standard [3] for measuring the GFR, this methodology is time-consuming, expensive, and not easily available, making it unsuitable for routine clinical use. Some equations such as Cockcroft–Gault (CG) [4], modification of diet in renal disease (MDRD) [5], and CKD epidemiology collaboration (CKD-EPI) [6], which estimate GFRs based on serum creatinine measurement with ease and convenience, have been widely accepted for clinical use.
Among other techniques aimed to estimate GFR, the camera-based method with technetium-99m (Tc-99m) diethylenetriaminepentaacetic acid (DTPA) using modified Gate’s method represent an easy way to estimate unilateral renal function. In addition, it can determine unilateral renal blood flow and distinguish between renal pelvic ectasia and post-renal obstruction. This is important clinical information for patients with unilateral renal disease, and for kidney donations. Unfortunately, some researchers have questioned the method [7,8].
The most important factor of Gate’s method affecting the GFR is renal depth [9]. The more accurate the measurement of renal depth, the more accurate the GFR calculation will be. The renal depths have been measured by techniques such as ultrasound (US), lateral view in radionuclide renal scintigraphy, and the computed tomography (CT), with varied precisions [10,11]. The current study aimed to compare the renal depth measured by different formulae and a CT scan, and it additionally sought to compare the GFR calculated from different methods with the reference value.

2. Materials and Methods

2.1. Patients

This is a retrospective study that analyzed the medical records of patients from nuclear medicine databases from September 2019 to September 2020 in Kaohsiung Medical University Hospital. Patients were accepted if they fulfilled the following criteria: (i) had received radionuclide renal dynamic imaging; (ii) had received an abdominal CT scan within two months before or after the radionuclide renal scan; (iii) had undergone a laboratory test for plasma creatinine (Pcr) within a month; and (iv) were more than 20 years old. The study review process was approved by the Institutional Review Board of Kaohsiung Medical University Hospital. (KMUHIRB-E(I)-20210244).

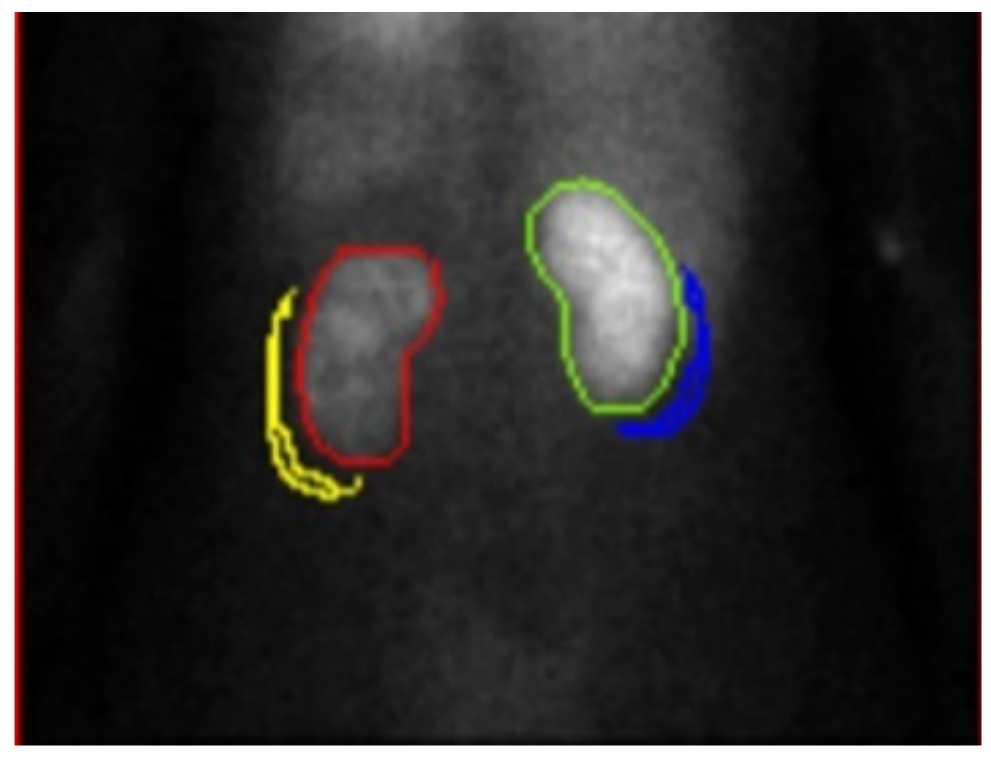
2.2. Renal Dynamic Image

Thirty minutes before the exam, patients were encouraged to drink at least 300 mL of water. Each patient’s age, sex, body weight, and body height were entered into the workstation. We noted the full syringe dose at the beginning and the empty syringe dose at the end of the examination. Patients were placed supine, and the procedure began immediately after the bolus intravenous injection of 6 mCi Tc-99m DTPA. The renal dynamic image was acquired in a 128 × 128 frame matrix for the ensuing 22 min using a Siemens E. CAM gamma camera (Siemens, Erlangen, Germany) equipped with a low-energy high-resolution collimator.
The regions of interest for each kidney were drawn manually by an experienced nuclear medicine radiographer. The background ROI for subtraction was drawn automatically by placing a semilunar region around the outer-lower aspect of each kidney (Figure 1). The GFRs were calculated by Gate’s method using the following formula [9].
Dual renal uptake (%) = [(Cr − Crb)/e−μRD + (Cl − Clb/e−μLD)]/(Full − Empty)
GFR = dual renal uptake (%) × 100 × 9.8127 − 6.82519
where Cr: right kidney counts, Crb: right background counts, Cl: left kidney counts, Clb: left background counts, RD: right kidney depth, LD: left kidney depth, μ: attenuation coefficient of Tc-99m in soft tissue (0.153 cm−1), e: Euler’s number, Full: full syringe counts, Empty: empty syringe counts
The renal depth was estimated by the following three formulae (developed by Tonnesen, Itoh K, and Taylor, respectively) [12,13,14] and a CT scan.

2.3. Assessment of Renal Depth by Tonnesen’ s Formula

The right renal (dR) and left renal (dL) depths were estimated from the body height and weight using the following equations [12]:
dR = 13.3 × (BW/BH) + 0.7
dL = 13.2 × (BW/BH) + 0.7
where BW: body weight(kg), BH: body height(cm).

2.4. Assessment of Renal Depth by Itoh K’s Formula

The right renal (dR) and left renal (dL) depths were estimated from body height and weight using the following equations [13]:
dR = 13.6361 × (BW/BH)0.6996
dL = 14.0285 × (BW/BH)0.7554
where BW: body weight(kg), BH: body height(cm).

2.5. Assessment of Renal Depth by Taylor’s Formula

The right renal (dR) and left renal (dL) depths were estimated from the body height, body weight, and age using the following equations [14]:
dR = 15.31 × (BW/BH) + 0.022 × age + 0.077
dL = 16.17 × (BW/BH) + 0.027 × age − 0.94
where BW: body weight (kg), BH: body height (cm), age: patient’s age (year).

2.6. Assessment of Renal Depth by CT

The CT scan was performed in the supine position with a 5 mm slice thickness spiral scan covering the whole abdomen (Figure 2). We chose the axial views, including the middle point of the long axis of each kidney, and the renal depth was defined as the distance from the middle point of the anteroposterior diameter to the body surface on the back in each view.

2.7. Estimated GFR (eGFR)

The eGFR was a creatinine-based equation and was modified with CKD patients in Chinese patients. The GFRs were calculated with renal depth assessed by three formulae and a CT scan, and they were compared with the eGFR estimated using the following equations [15]:
eGFR (mL/min/1.73 m2) = 175 × (Pcr)−1.234 × (Age)−0.179 (×0.79 if female)
where Pcr was in unit of mg/dL; Age was in years.

2.8. Modified Estimated GFR (Modified eGFR)

We use the body surface area (BSA) according to Du Bois to modify the estimated GFR [16]:
Modified eGFR(ml/min) = eGFR × (BSA/1.73)
BSA (m2) = 0.20247 × BH0.725 × BW0.425
where BH: body height (m); BW: body weight (kg).

2.9. Statistical Analysis
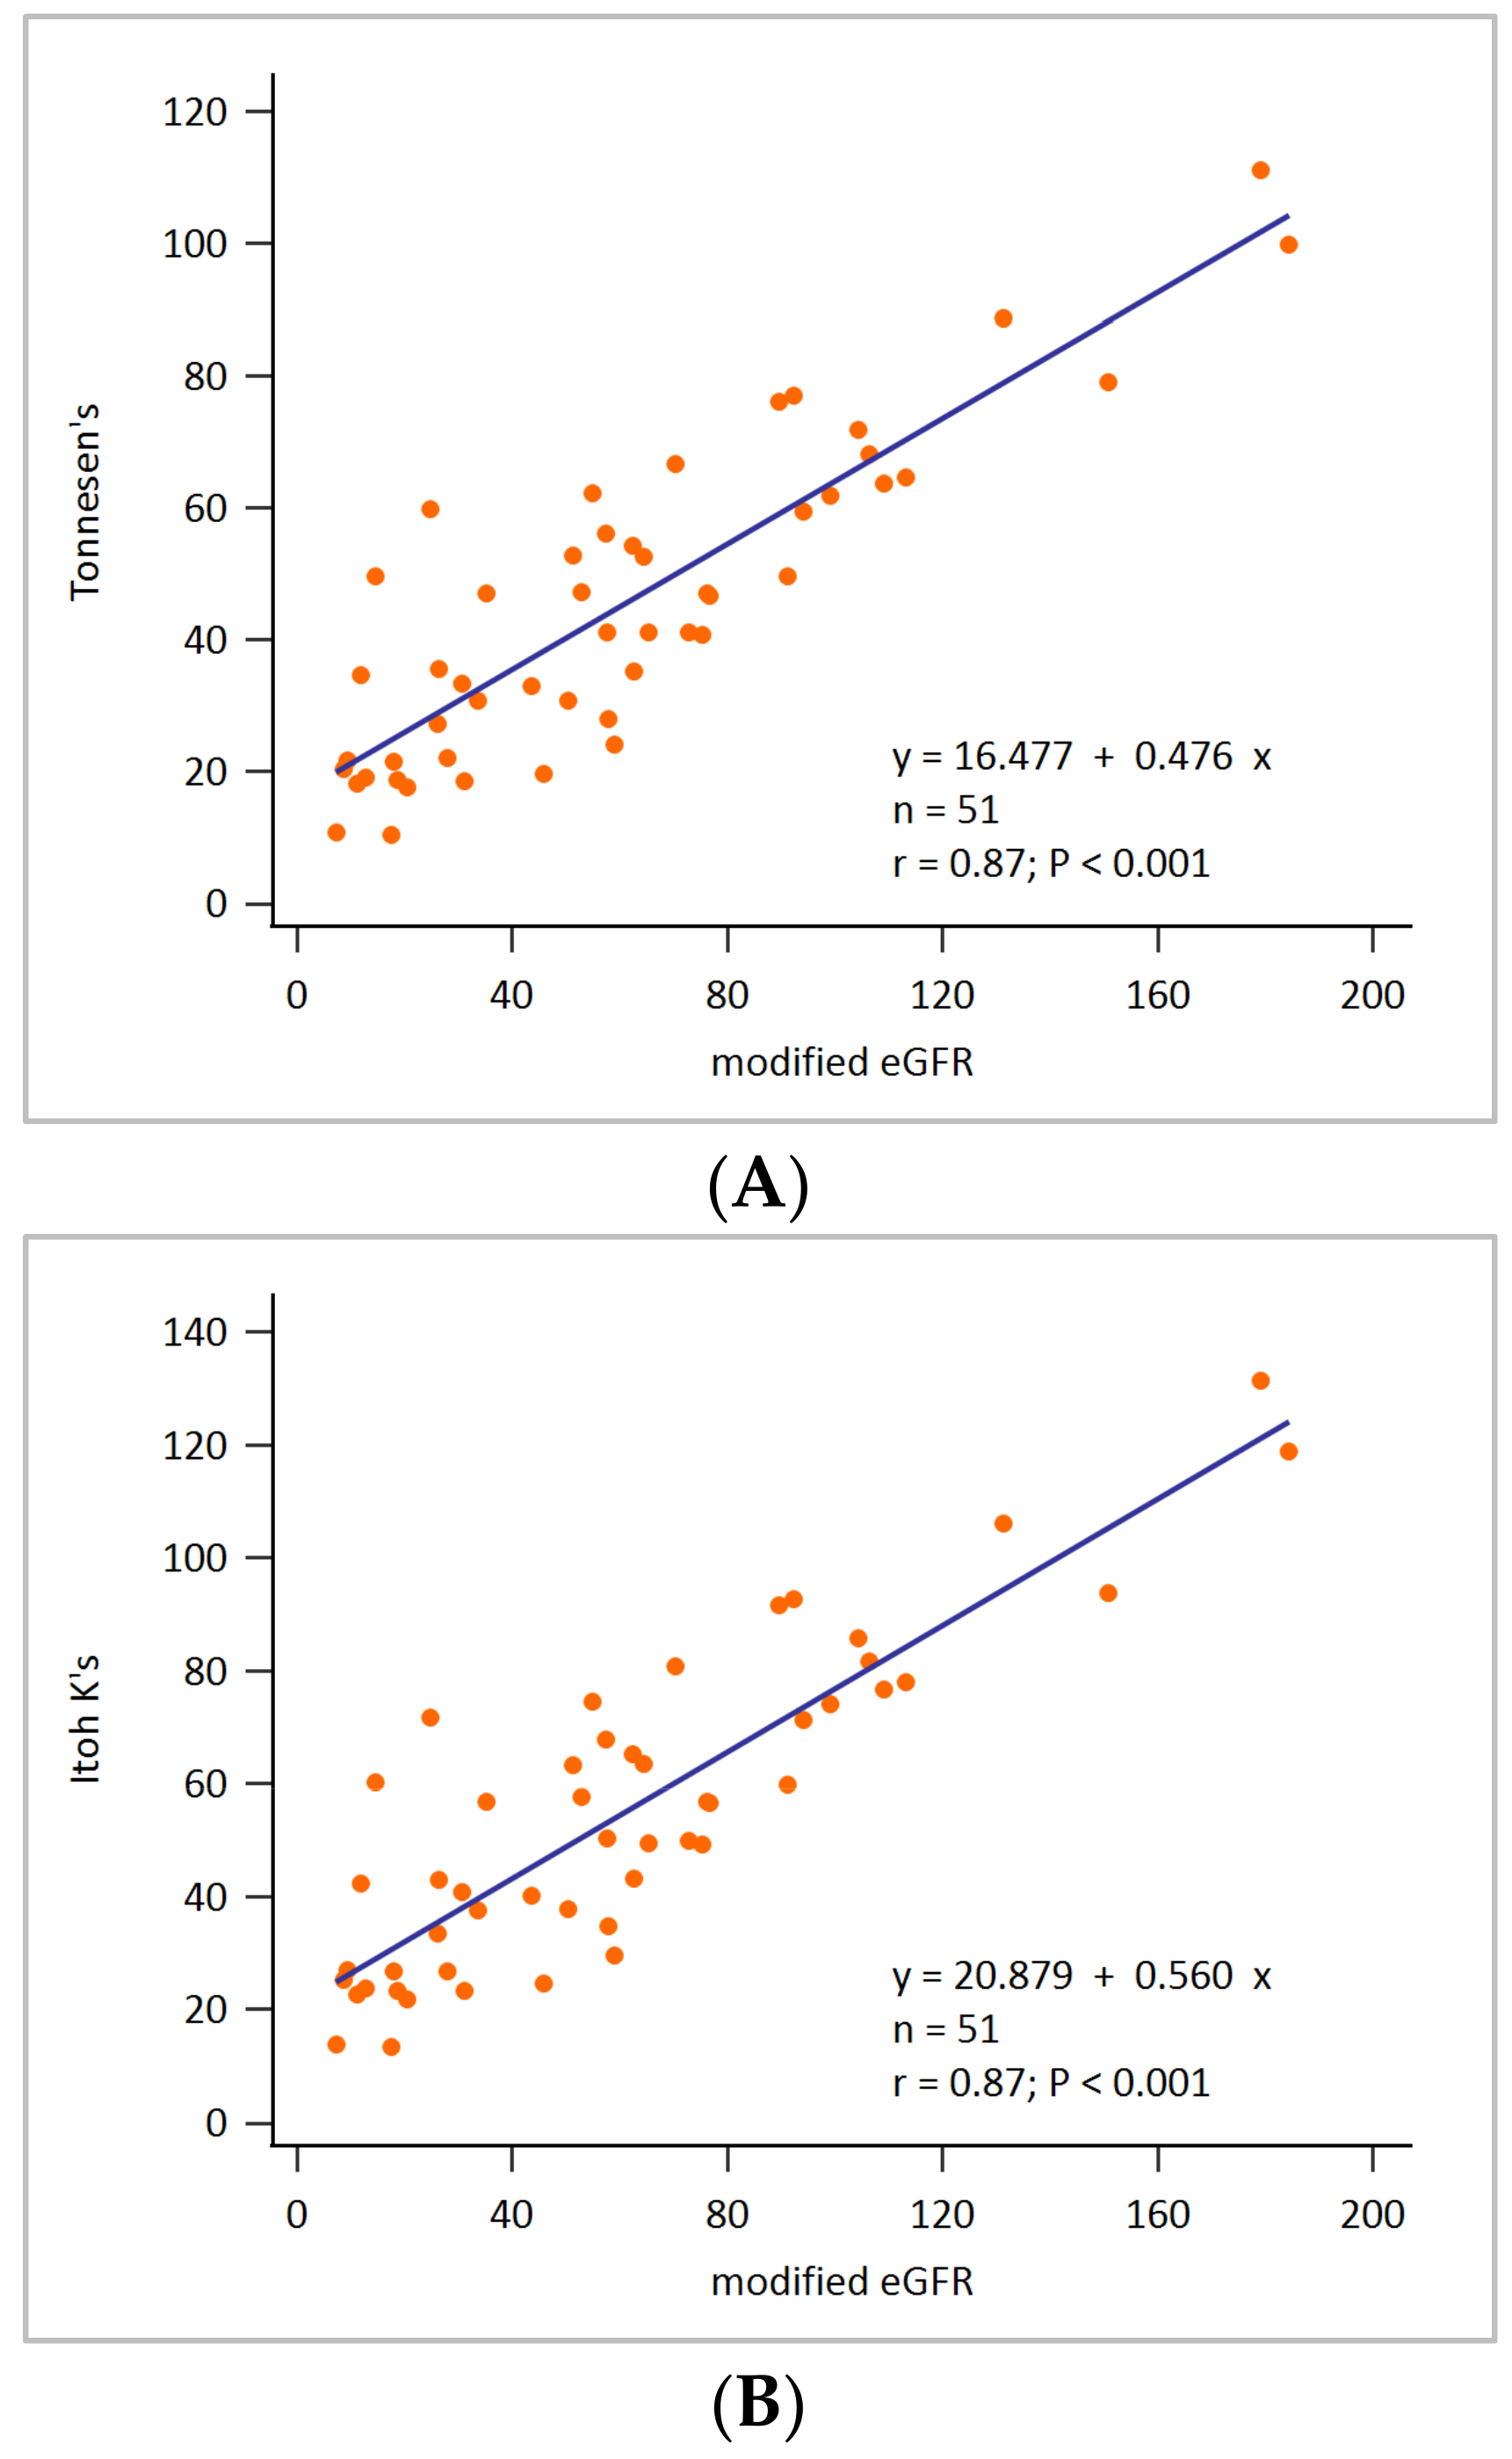
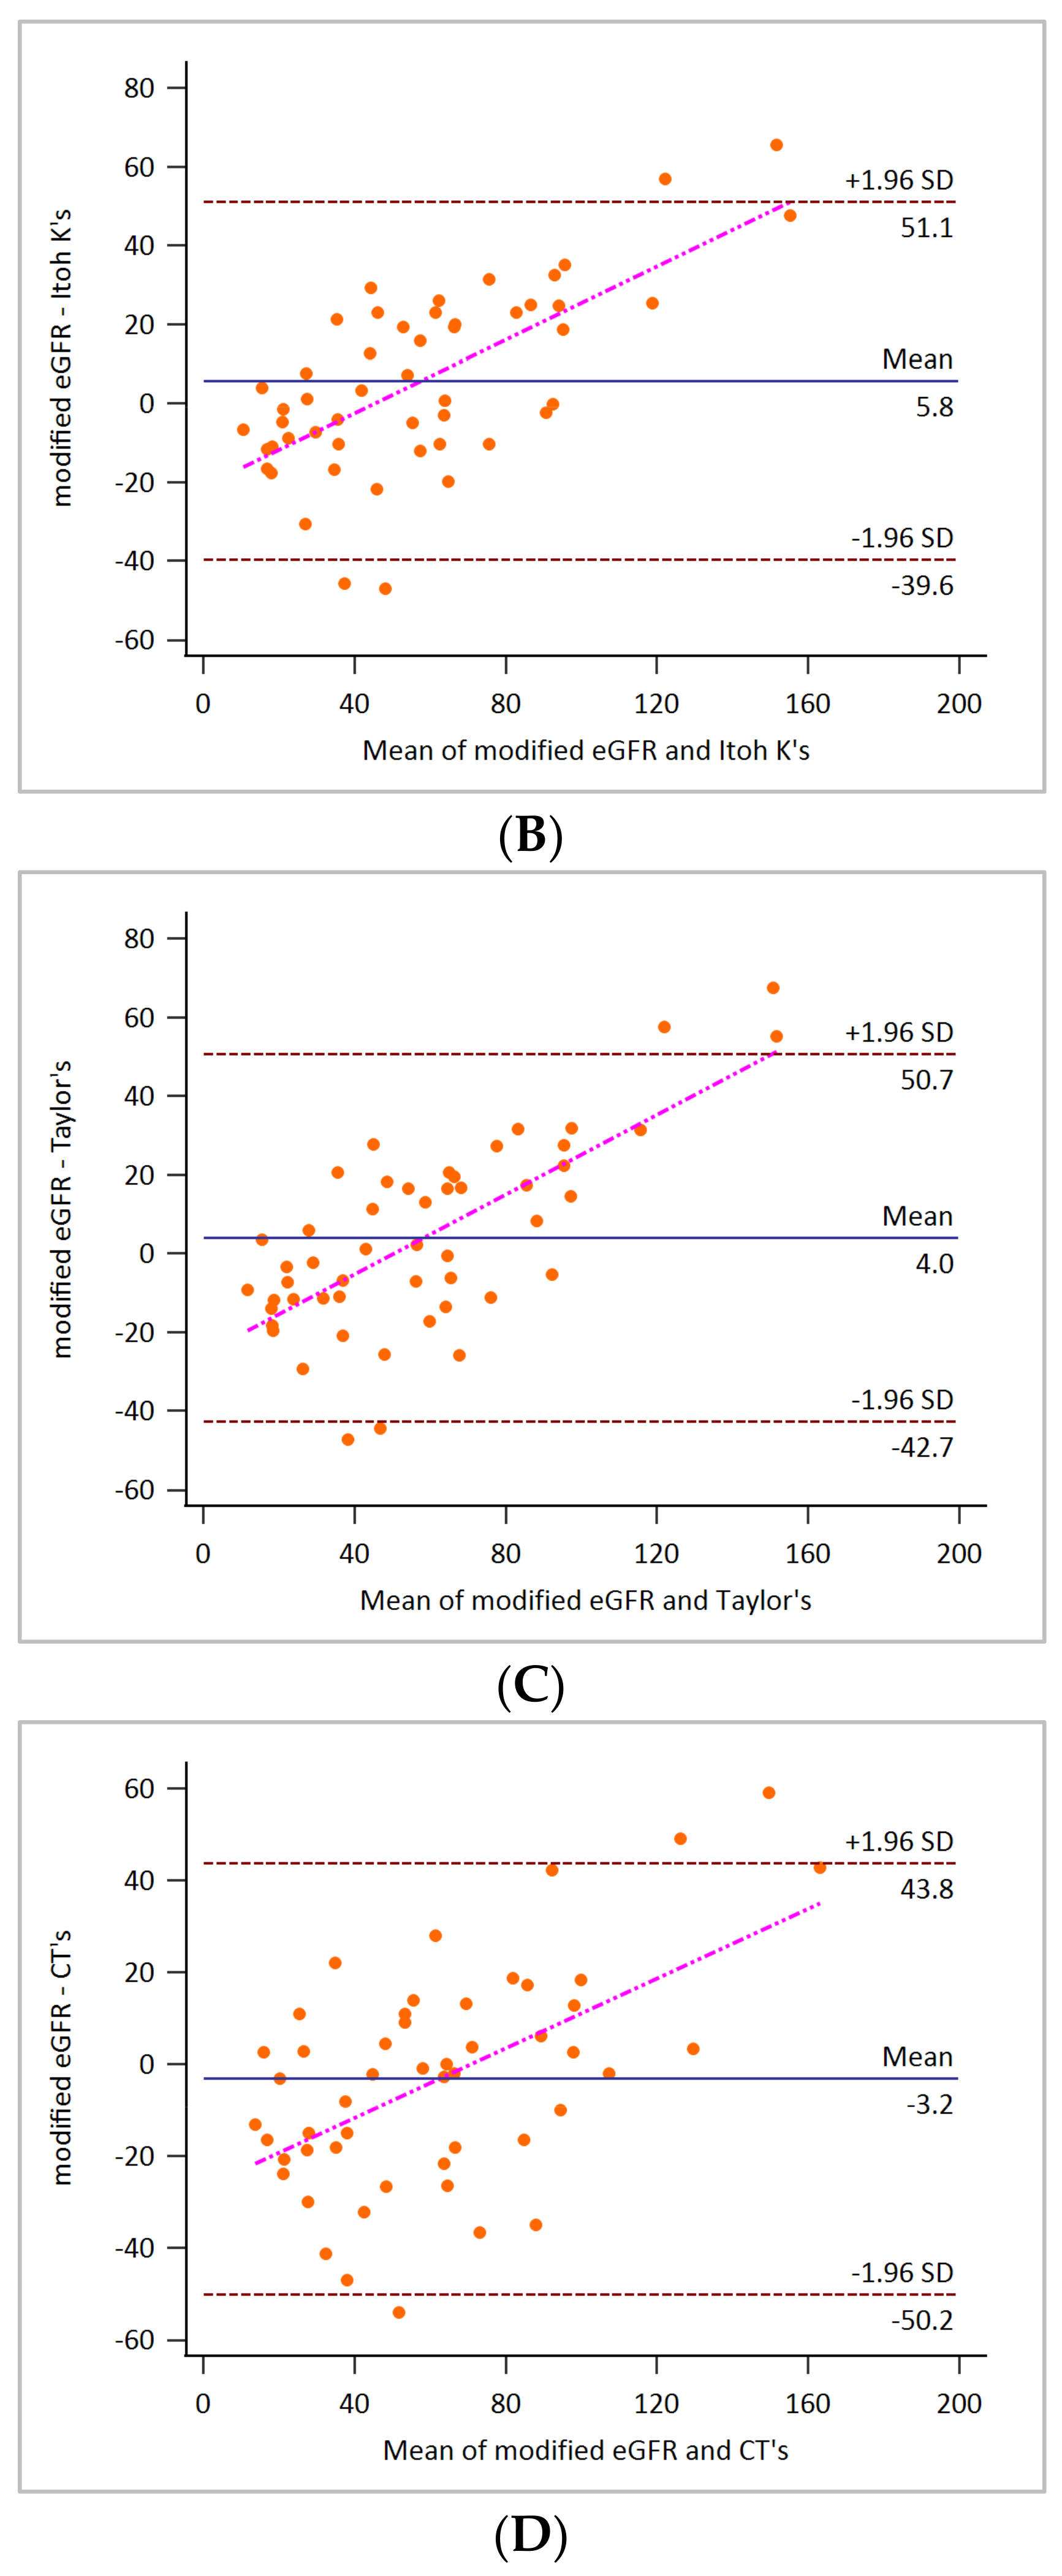
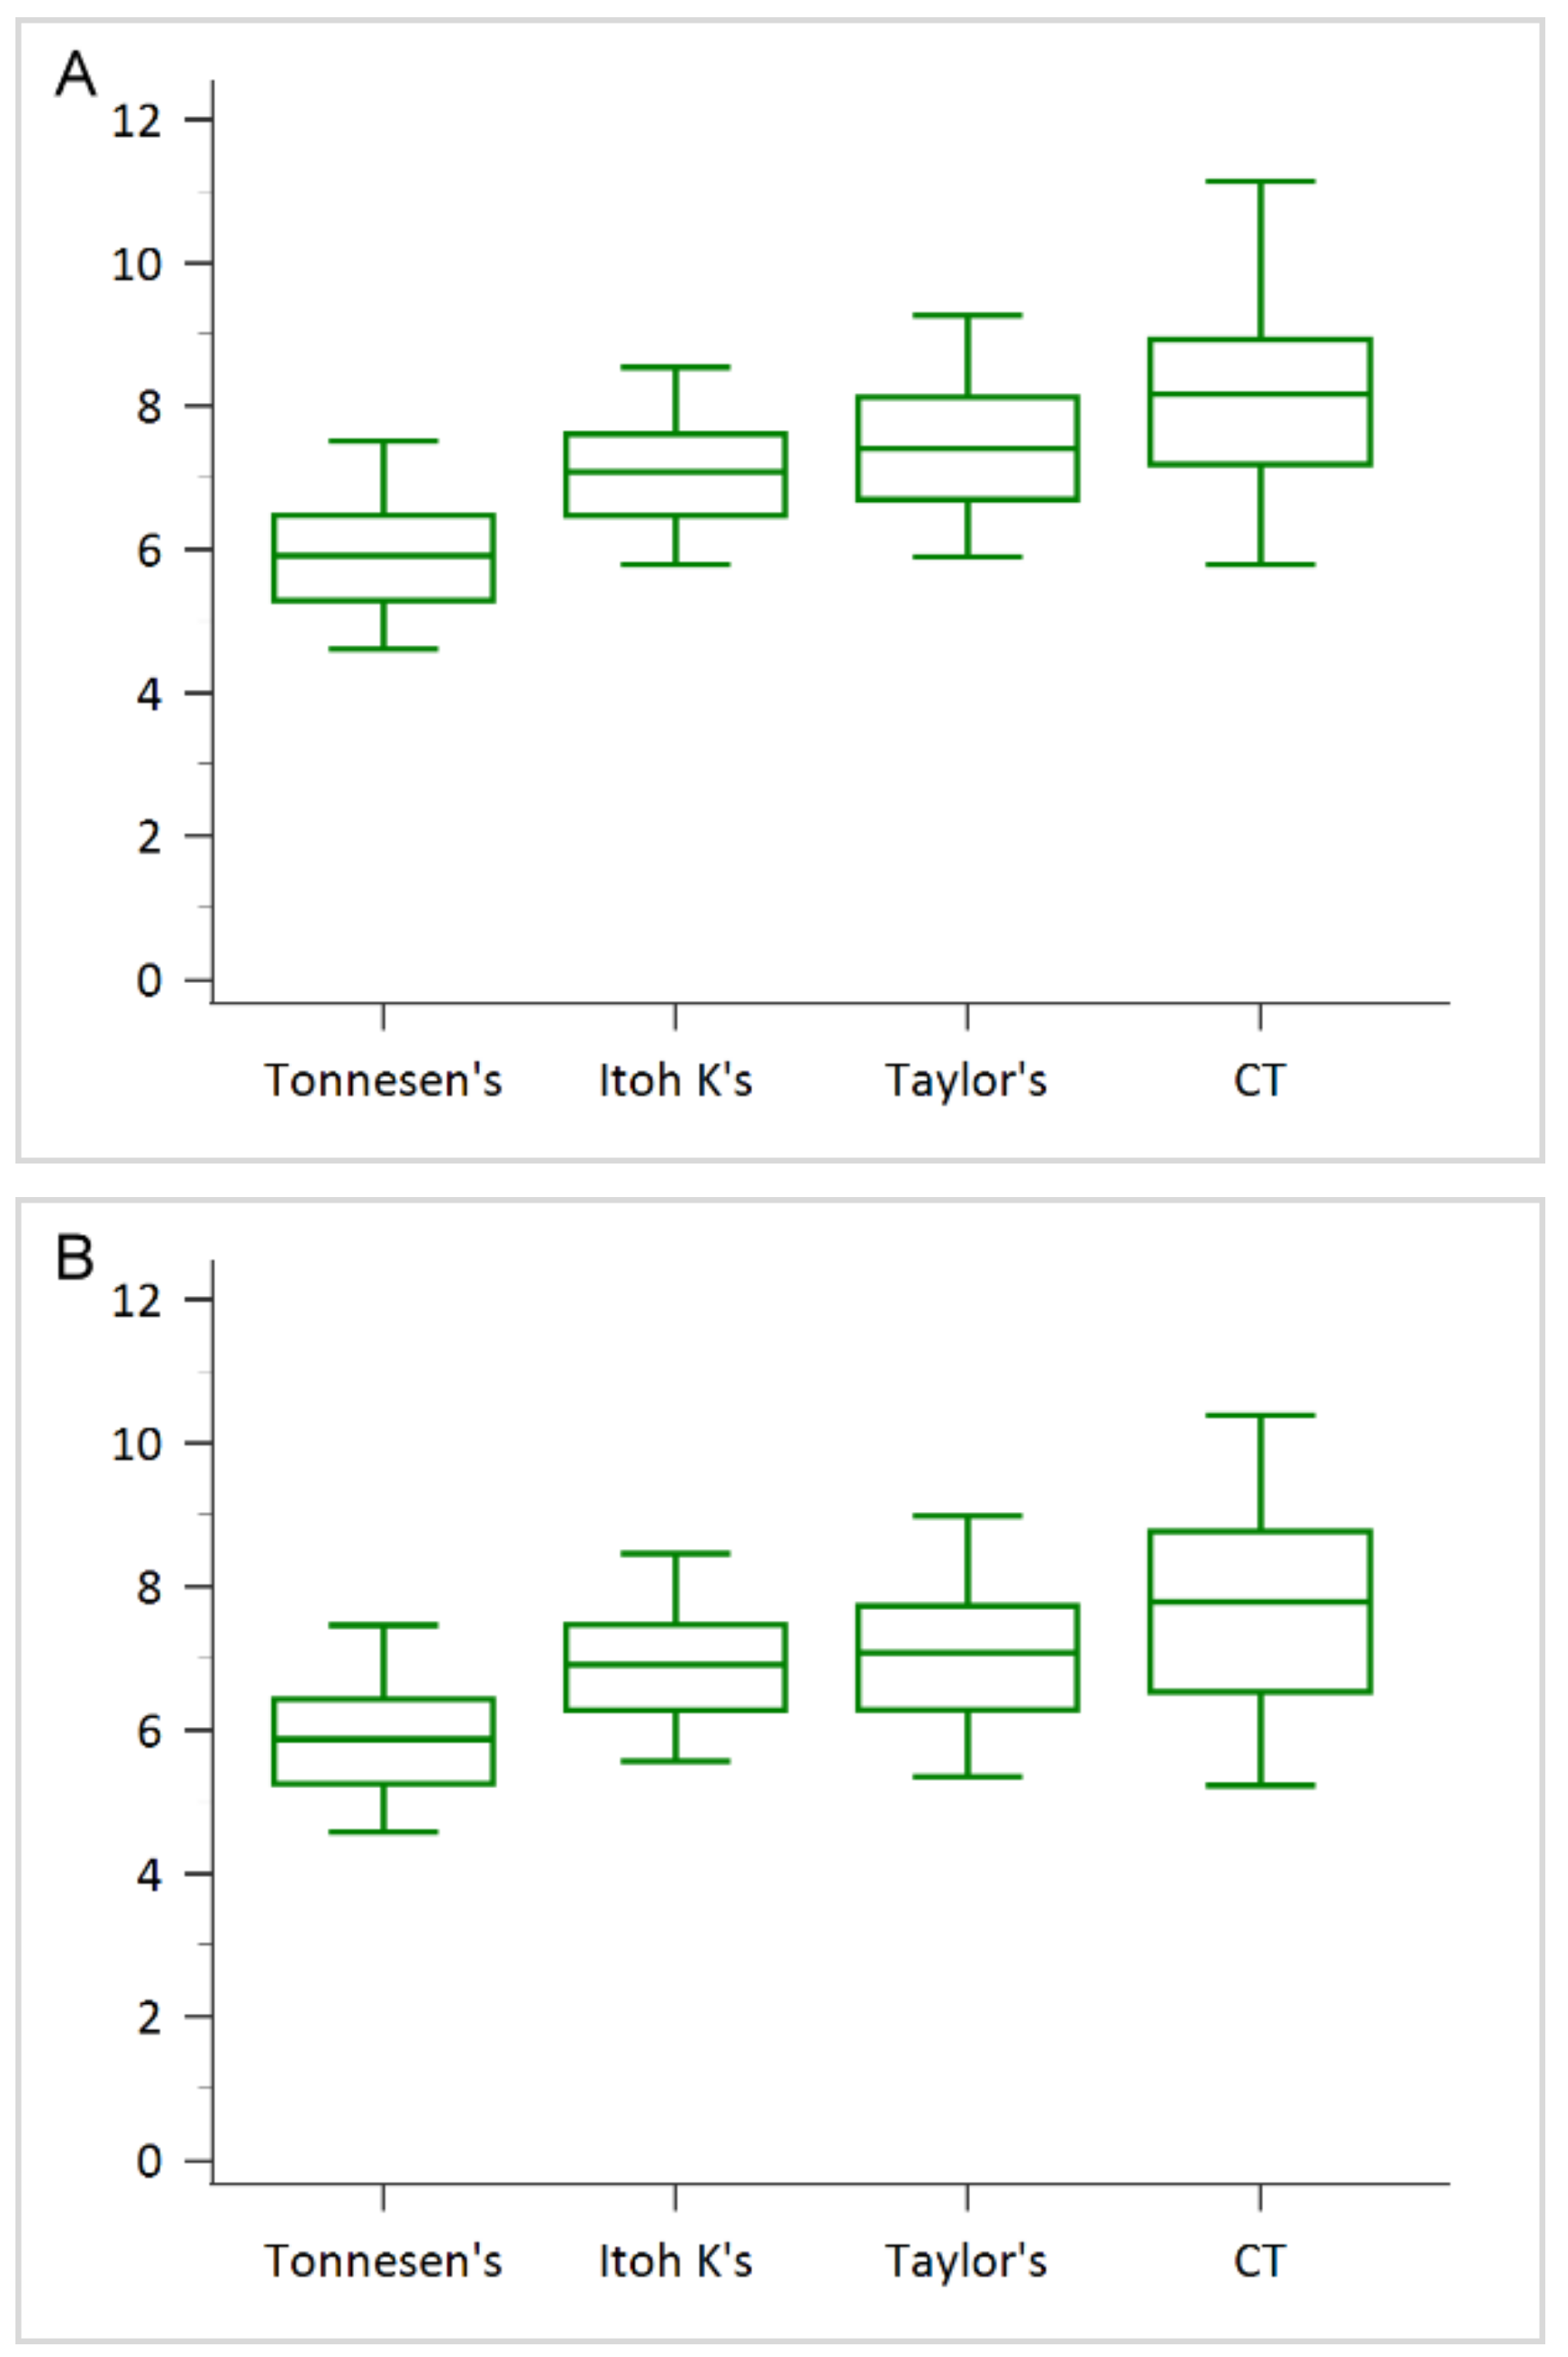
Continuous variables of measurement data were expressed as mean ± standard deviation (SD). A regression test was performed to compare the correlations between the calculated GFRs and modified eGFR. The Bland–Altman, boxplots, and data were analyzed using the MedCalc Statistical Software, version 20.014 (MedCalc Software Ltd., Ostend, Belgium; https://www.medcalc.org; lasted accessed on 17 November 2021). A p-value < 0.05 was considered statistically significant.

3. Results

A total of 51 patients, consisting of 21 males and 30 females with a mean age of 60.5 years (range 25–86 years), were enrolled in this study (Table 1). Among them, ten patients were diagnosed with comorbid diabetes mellitus. Clinical manifestations of these patients included hydronephrosis and renal calculus (n = 32, 62.7%), renal tumors (n = 10, 19.6%), urinary tract infection (n = 2, 3.9%), acute kidney injury (n = 1, 2.0%), and some other or undetermined diagnosis (n = 6, 11.8%). Plasma creatinine level ranged from 0.48 mg/dL to 6.12 mg/dL, and the mean value was 1.8 ± 1.3 mg/dL. The average modified eGFR was 60.5 ± 42.7 mL/min. The mean GFRs calculated by Tonnesen’s formula, Itoh K’s formula, Taylor’s formula, and CT were 45.3 ± 23.3, 54.7 ± 27.5, 56.5 ± 26.3, and 63.7 ± 30.0, respectively.
The scatter plot and regression lines are seen in Figure 3. The correlation coefficient of the calculated GFRs (Tonnesen’s, Itoh K’s, Taylor’s, and CT) and modified eGFR were 0.87, 0.87, 0.87, and 0.84, respectively. All were statistically significant with a p-value < 0.001. The Bland–Altman plot showed good agreement between GFRs calculated by Tonnesen’s (p = 0.0001) and the modified eGFRs. However, no statistical difference was observed between the GFRs calculated by Itoh K’s (p = 0.0818), Taylor’s (p = 0.2355) methods, and by a CT scan (p = 0.3402) and the modified eGFR (Figure 4).
The renal depth, when estimated by the three formulae, was significantly smaller than that estimated by a CT scan (all for p < 0.05), and the right side was somewhat larger than the left side (p < 0.05; Figure 5). On the contrary, the deeper right renal depth was found only in 63% of the patients when estimated by CT scans. In patients with modified eGFR > 60 mL/min, the GFRs calculated using Tonnesen’s formula were obviously low, leading to the underestimation of the GFR in the clinical setting. The GFRs calculated using CT scans were closer when the modified eGFR was more than 60 mL/min (Figure 6).

4. Discussion

This is a retrospective study that analyzed and compared how the renal depth influences the GFR. As previously mentioned, renal depth is the main factor affecting Gate’s method [9]. In our study, we found that the GFR calculated by four methods (three formulae and the CT scan) were all well correlated to the modified eGFR. However, the depths of both kidneys measured by CT were significantly deeper than those measured by the other three formulae. Further, in the current study we noticed that, in the patients with a modified eGFR over 60 mL/min, the GFR calculated by Tonnesen’s is underestimated due to the smallest renal depths. Moreover, the GFR calculated by CT renal depth is closest to the modified eGFR. The result is compatible with that described in the previous studies, in which it was stated that Gate’s method underestimated GFR because Tonnesen’s formula underestimated the renal depth [14,17,18].
The plasma creatinine equation and creatinine clearance have been used widely in estimating the GFR, and, thus, were used as the reference in the current study. It is a simple method in clinical practice, but there are some limitations. First, the separate renal GFR cannot be assessed and calculated. Second, it is not suitable in some patient groups, such as obese individuals, children, pregnant women, and patients without CKD. It has been reported to overestimate GFR in malnourished patients [4], and underestimate it in healthy people [5].
Nowadays, Gate’s method is still the method most preferred in the clinical evaluation of the GFR. It has the advantage of providing total GFR while also calculating the separate renal GFR at the same time. In clinical practice, patients who received the renal dynamic imaging may have various conditions of unilateral renal disease, e.g., urinary tract obstruction, tumor, renal artery anomaly, congenital renal abnormality, and pyelonephritis, etc. Measuring the renal depths accurately is crucial, but it is not always easy in calculating the GFR. Some previous studies reported that the depth of the right kidney is deeper than that of the left side [12,13,14]; however, in the current study, only 63% of patients had deeper right kidney than left side. The exact reason for this finding is not certain, but we speculate that there may be selection bias due to different clinical backgrounds and relatively smaller patient populations. We need to consider this situation when we estimate unilateral renal function. It will help improve the accuracy of clinical diagnosis.
Acquiring the lateral view when conducting the dynamic renal imaging is simple and clinically feasible without additional radiation exposure for accurate GFR measurement [19]. However, in patients with clinical situations such as hydronephrosis and tumor, radiotracers cannot be detected completely and, therefore, this decreases the scanning validity. Based on the attenuation coefficient of Tc-99m in soft tissue of 0.153, even a 1-cm error (either positive or negative) in the renal depth measurement will lead to a 14–16% error, either under or over-estimation, in the calculation of the GFR [20,21]. In the current study, 82.3% of patients had hydronephrosis, renal calculi, and/or renal tumor, so we did not use lateral view acquiring for renal depth evaluation.
With respect to the CT scan, the advantage is found in the clear anatomic depiction. It measures objective renal depth while also providing information of renal location and morphology, and, thus, it helps to raise the accuracy when evaluating the GFR. The multidetector CT had been used to measure unilateral renal GFR [22,23]. Kwon et al., reported that unilateral GFR measured by contrast enhanced CT was reproducible and it agreed well with the iothalamate clearance [22]. An additional article by You et al. reported that, with a renal dynamic image as the reference, the unilateral renal GFR measured by CT revealed a well and significant correlation [23]. We have found similar results in the current study, especially for patients with modified eGFR over 60 mL/min. However, there is a disadvantage pertaining to additional radiation exposure during the CT scan, and this should be taken into consideration in clinical settings.
Dynamic contrast-enhanced magnetic resonance imaging (DCE-MRI), based on the intrarenal kinetics of contrast, is another clinical technique for evaluating the GFR, and this has now been studied [24,25]. The best advantage of using DCE-MRI to measure GFR is that patients receive no ionizing radiation exposure. However, the accuracy of the technique has not yet been validated with the standard reference. Additionally, checking renal function before administrating the contrast agents in patients with renal function impairment is also important.
The current study compared the clinical roles of three formulae, and CT scans, on evaluating bilateral renal depths and calculating the GFR. There are some limitations in the current study. First, it was a retrospective study design with relatively smaller patient population. Second, the patients’ background was relatively diverse although more than half of the patients displayed clinical symptoms of urinary tract obstruction and/or hydronephrosis. Further prospective studies dealing with larger patient populations and similar clinical settings may be conducted.

5. Conclusions

According to our results, it is found that the renal depth estimated by CT scans is evidently deeper than that measured by the three formulae. The value of the GFR calculated by CT scans is closer to the modified eGFR in patients with modified eGFR over 60 mL/min. It is potentially valuable for us to take these findings into consideration when clinically dealing with the GFR.

Author Contributions

Conceptualization, W.-L.H. and C.-C.C.; Data curation, S.-M.C.; Formal analysis, W.-L.H.; Investigation, C.-C.C.; Methodology, W.-L.H. and C.-C.C.; Resources, S.-M.C.; Supervision, C.-C.C.; Writing—original draft, W.-L.H.; and Writing—review and editing, C.-C.C. All authors have read and agreed to the published version of the manuscript.

Funding

This research received no external funding.

Institutional Review Board Statement

The study was conducted according to the guidelines of the 221 Declaration of Helsinki, and approved by the Institutional Review Board of Kaohsiung Medical University Hospital (KMUHIRB-E(I)-20210244, approved on 28 October 2021).

Informed Consent Statement

Patient consent was waived due to clinical data were retrospectively collected by the chart reviewing.

Acknowledgments

We would like to thank our medical and non-medical staff including nephrologists, urologist, nurses and secretaries for their efforts.

Conflicts of Interest

The authors declare no conflict of interest existed.

References

  1. Jager, K.J.; Kovesdy, C.; Langham, R.; Rosenberg, M.; Jha, V.; Zoccali, C. A single number for advocacy and communication-worldwide more than 850 million individuals have kidney diseases. Nephrol. Dial. Transpl. 2019, 34, 1803–1805. [Google Scholar] [CrossRef] [Green Version]
  2. Luyckx, V.A.; Al-Aly, Z.; Bello, A.K.; Bellorin-Font, E.; Carlini, R.G.; Fabian, J.; Garcia-Garcia, G.; Iyengar, A.; Sekkarie, M.; van Biesen, W. Sustainable Development Goals relevant to kidney health: An update on progress. Nat. Rev. Nephrol. 2021, 17, 15–32. [Google Scholar] [CrossRef]
  3. Price, M. Comparison of creatinine clearance to inulin clearance in the determination of glomerular filtration rate. J. Urol. 1972, 107, 339–340. [Google Scholar] [CrossRef]
  4. Cockcroft, D.W.; Gault, H. Prediction of creatinine clearance from serum creatinine. Nephron 1976, 16, 31–41. [Google Scholar] [CrossRef]
  5. Levey, A.S.; Bosch, J.P.; Lewis, J.B.; Greene, T.; Rogers, N.; Roth, D. A more accurate method to estimate glomerular filtration rate from serum creatinine: A new prediction equation. Ann. Intern. Med. 1999, 130, 461–470. [Google Scholar] [CrossRef]
  6. Levey, A.S.; Stevens, L.A.; Schmid, C.H.; Zhang, Y.L.; Castro, A.F., 3rd; Feldman, H.I.; Kusek, J.W.; Eggers, P.; Van Lente, F.; Greene, T.; et al. A new equation to estimate glomerular filtration rate. Ann. Intern. Med. 2009, 150, 604–612. [Google Scholar] [CrossRef]
  7. Chen, L.-I.; Kuo, M.-C.; Hwang, S.-J.; Chen, Y.-W.; Wu, K.-D.; Chen, H.-C. Comparisons of technetium-99m diethylenetriaminepentaacetic acid plasma clearance and renal dynamic imaging with inulin clearance. Am. J. Kidney Dis. 2011, 58, 1043–1045. [Google Scholar] [CrossRef]
  8. De Santo, N.G.; Anastasio, P.; Cirillo, M.; Santoro, D.; Spitali, L.; Mansi, L.; Celentano, L.; Capodicasa, D.; Cirillo, E.; Del Vecchio, E. Measurement of Glomerular FiltrationRate by the 99mTc-DTPA Renogram Is Less Precise than Measured and Predicted Creatinine Clearance. Nephron 1999, 81, 136–140. [Google Scholar] [CrossRef] [PubMed]
  9. Gates, G.F. Glomerular filtration rate: Estimation from fractional renal accumulation of 99mTc-DTPA (stannous). Am. J. Roentgenol. 1982, 138, 565–570. [Google Scholar] [CrossRef] [PubMed]
  10. Granerus, G.; Moonen, M. Effects of extra-renal background subtraction and kidney depth correction in the measurement of GFR by gamma camera renography. Nucl. Med. Commun. 1991, 12, 519–527. [Google Scholar] [CrossRef] [PubMed]
  11. Maneval, D.C.; Magill, H.L.; Cypess, A.M.; Rodman, J.H. Measurement of skin-to-kidney distance in children: Implications for quantitative renography. J. Nucl. Med. 1990, 31, 287–291. [Google Scholar]
  12. Tonnesen, K. Influence on the radiorenogram of variation in skin to kidney distance and the clinical importance hereof. In Radionuclides in Nephrology; Thieme: Stuttgart, Germany, 1975; pp. 79–86. [Google Scholar]
  13. Itoh, K.; Arakawa, M. Re-estimation of renal function with 99m Tc-DTPA by the Gates’ method. Kaku Igaku 1987, 24, 389–396. [Google Scholar] [PubMed]
  14. Taylor, A.; Lewis, C.; Giacometti, A.; Hall, E.C.; Barefield, K.P. Improved formulas for the estimation of renal depth in adults. J. Nucl. Med. 1993, 34, 1766–1769. [Google Scholar] [PubMed]
  15. Ma, Y.-C.; Zuo, L.; Chen, J.-H.; Luo, Q.; Yu, X.-Q.; Li, Y.; Xu, J.-S.; Huang, S.-M.; Wang, L.-N.; Huang, W.; et al. Modified glomerular filtration rate estimating equation for Chinese patients with chronic kidney disease. J. Am. Soc. Nephrol. 2006, 17, 2937–2944. [Google Scholar] [CrossRef] [Green Version]
  16. DuBois, D. A formula to estimate the approximate surface area if height and body mass be known. Arch. Intern. Med. 1916, 17, 863–871. [Google Scholar] [CrossRef] [Green Version]
  17. Liu, Y.; Zhao, A.; Lu, X.; Wang, Q.; Yang, L.; Zhang, Y.; Yan, A.; Tian, P.; Xue, J. Renal depth measured by CT optimize the glomerular filtration rate using the Gates method in living donor kidney transplantation. Chin. J. Organ Transpl. 2019, 12, 195–199. [Google Scholar]
  18. Xue, J.; Deng, H.; Jia, X.; Wang, Y.; Lu, X.; Ding, X.; Li, Q.; Yang, A. Establishing a new formula for estimating renal depth in a Chinese adult population. Medicine 2017, 96, e5940. [Google Scholar] [CrossRef]
  19. Sugawara, S.; Ishii, S.; Kojima, Y.; Ito, H.; Suzuki, Y.; Oriuchi, N. Feasibility of gamma camera-based GFR measurement using renal depth evaluated by lateral scan of 99mTc-DTPA renography. Ann. Nucl. Med. 2020, 34, 349–357. [Google Scholar] [CrossRef] [PubMed]
  20. Awdeh, M.; Kouris, K.; Hassan, I.M.; Abdel-Dayem, H.M. Factors affecting the Gates’ measurement of glomerular filtration rate. Am. J. Physiol. Imaging 1990, 5, 36–41. [Google Scholar]
  21. Gruenewald, S.; Collins, L.; Fawdry, R. Kidney depth measurement and its influence on quantitation of function from gamma camera renography. Clin. Nucl. Med. 1985, 10, 398–401. [Google Scholar] [CrossRef] [PubMed]
  22. Kwon, S.H.; Saad, A.; Herrmann, S.M.; Textor, S.C.; Lerman, L.O. Determination of single-kidney glomerular filtration rate in human subjects by using CT. Radiology 2015, 276, 490–498. [Google Scholar] [CrossRef] [PubMed] [Green Version]
  23. You, S.; Ma, X.W.; Zhang, C.Z.; Li, Q.; Shi, W.W.; Zhang, J.; Yuan, X.D. Determination of single-kidney glomerular filtration rate (GFR) with CT urography versus renal dynamic imaging Gates method. Eur. Radiol. 2018, 28, 1077–1084. [Google Scholar] [CrossRef] [PubMed]
  24. Buckley, D.L.; Shurrab, A.E.; Cheung, C.M.; Jones, A.P.; Mamtora, H.; Kalra, P.A. Measurement of single kidney function using dynamic contrast-enhanced MRI: Comparison of two models in human subjects. J. Magn. Reson. Imaging Off. J. Int. Soc. Magn. Reson. Med. 2006, 24, 1117–1123. [Google Scholar] [CrossRef] [PubMed]
  25. Tipirneni-Sajja, A.; Loeffler, R.B.; Oesingmann, N.; Bissler, J.; Song, R.; McCarville, B.; Jones, D.P.; Hudson, M.; Spunt, S.L.; Hillenbrand, C.M. Measurement of glomerular filtration rate by dynamic contrast-enhanced magnetic resonance imaging using a subject-specific two-compartment model. Physiol. Rep. 2016, 4, e12755. [Google Scholar] [CrossRef]
Figure 1. Demonstration of the region of interest (ROI) when calculating the glomerular filtration rate (GFR) by Gate’s method from a 33-year-old woman. The ROIs for each kidney were drawn manually via the compression posterior image. Background subtraction was drawn by placing a semilunar ROI in the outer-lower of each kidney automatically.
Applsci 12 00698 g001
Figure 2. Demonstration of measuring the renal depth via CT image. Two axial slices including the middle of each kidney were collected. The point of deepest (D) and superficial (S) to back body surface were drawn. The renal depth was calculated as (D + S)/2.
Applsci 12 00698 g002
Figure 3. The correlation between GFRs calculated using renal depth by four ways and modified eGFR. (A), the GFR calculated using the renal depth estimated by Tonnesen’s formula (r = 0.87, y = 0.476x + 16.477). (B), the GFR calculated using the renal depth estimated by Itoh K’s formula (r = 0.87, y = 0.560x + 20.879). (C), the GFR calculated using the renal depth estimated by Taylor’s formula (r = 0.87, y = 0.534x + 24.170). (D), the GFR calculated using the renal depth estimated by CT (r = 0.84, y = 0.589x + 28.101).
Applsci 12 00698 g003aApplsci 12 00698 g003b
Figure 4. The Bland–Altman plot for GFRs calculated through four methods and the modified eGFR. (A), GFR calculated by Tonnesen’s formula (p = 0.0001). (B), GFR calculated by Itoh K’s formula (p = 0.0818). (C), GFR calculated by Taylor’s formula (p = 0.2355). (D), GFR calculated by CT scan (p = 0.3402).
Applsci 12 00698 g004aApplsci 12 00698 g004b
Figure 5. The boxplots for comparison of the bilateral renal depth measured by three formulas (Tonnesen’s, Itoh K’s, and Taylor’s) and the CT scan. (A), right renal depth. (B), left renal depth.
Applsci 12 00698 g005
Figure 6. The boxplots for comparison of the GFRs calculated by Tonnesen’s, Itoh K’s, Taylor’s formula, CT scan, and the modified eGFR. (A), patients with modified eGFR more than 60 mL/min. (B), patients with modified eGFR less than 60 mL/min.
Applsci 12 00698 g006
Table 1. Clinical characteristics of 51 patients enrolled in this study.
VariableValues a
Age60.5 ± 13.3
Sex
      Male21 (41)
      Female30 (59)
Height (cm)160.6 ± 8.3
Weight (kg)63.4 ± 10.9
BMI (kg/m2)24.5 ± 3.5
Plasma creatinine (mg/dL)1.8 ± 1.3
Modified eGFR (ml/min)60.5 ± 42.7
Tonnesen’s GFR (ml/min)45.3 ± 23.3
Itoh K’s GFR (ml/min)54.7 ± 27.5
Taylor’s GFR (ml/min)56.5 ± 26.3
CT GFR (ml/min)63.7 ± 30.0
Abbreviations: BMI, body mass index; modified eGFR, estimated GFR by modified abbreviated modification of diet in renal disease study equation and modify by body surface area; GFR, glomerular filtration rate; SD, standard deviation; CT, computed tomography. a Values are presented as No. (%) or mean ± SD.
Publisher’s Note: MDPI stays neutral with regard to jurisdictional claims in published maps and institutional affiliations.

