1. Introduction
Besides systemic chemotherapy, local treatments, such as radiation and hyperthermia treatments, are typically used for cancer treatment. In these methods, the level of cell death induction is used as an indicator of therapeutic effectiveness. Despite a wide range of possible methodological options, there is a lack of valid strategies, based not only on the effect of high temperatures, but with a valuable effect per se. Among these, ultrasound technology has emerged as a possible novel therapeutic approach, despite the need for proper validation.
Shock waves are heterogeneous, discontinuous, rapid mechanical phenomena that have been observed in the laboratory and in nature, in microscopic as well as in macroscopic dimensions, and in all states of matter.
In the management of solid cancer, the possible application of shock waves is ascribable to the pure mechanical effects on the cells. Differently, in addition to traditional surgery and chemotherapy, the use of high intensity focused ultrasound (HIFU) has been established as a noninvasive technique for tumor therapy.
In particular, the method of laser-induced shockwave generation is able to permeabilize cell membrane and increase drug delivery. Laser-induced methods for shock wave generation are reproducible on the macroscopic level and they have proven to prevent lithotripter related side-effects, such as heating and cavitation [
1].
The research on ultrasound (US) therapy is focused on interactions of ultrasound mechanical energy delivered to biological tissues and the related phenomena that cause temperature rises. In the field of diagnostics and therapy, in fact, several simplified models have been developed to estimate the variation in temperature, inertial and non-inertial cavitation [
2], and their biological consequences. The use of US for cancer treatment relies on both thermal and non-thermal effects, i.e., hyperthermia and acoustic streaming/radiation force, respectively.
US used in medicine can be divided into two main categories: US high intensity HIFU (high intensity focused ultrasound) and US low intensity LIU (low intensity ultrasound). The literature shows there is a limited value of the intensity from which the two types of ultrasounds are distinguished (Low: 0.5 MHz ≤ f ≤ 5 MHz, 0.1 MPa ≤ P
a ≤ 1.5 MPa; High: 0.8 MHz ≤ f ≤ 7 MHz, P
a > 10 MPa) [
3].
Another classification of US is based on the intensity, ranging from 0.05–0.5 W/cm
2 for diagnostic imaging, to surgical applications with a range of 0.2–10 × 10
3 W/cm, to therapeutic applications that can use both high and low intensities [
4]. An essential feature that characterizes ultrasounds is that, with increasing frequency, the attenuation for dissipative effects is very pronounced and it is therefore necessary to determine the value of the energy lost in propagation.
Among different US, high intensity focused ultrasound (HIFU) has been investigated extensively and found to be highly effective in treating different cancers via hyperthermia. The US has also been very effective in creating stroma in the cell membrane thus enhancing the drug intake. Tumor cells demonstrated the ability to acquire thermo-resistance due to repeated hyperthermia and the efficiency of hyperthermia-based treatments, hence, decreases with repeated use. Therefore, among magnetic and US based treatments, the latter demonstrated more effectiveness and strong application potential.
Low intensity pulsed ultrasound (LIPUS) is a technology that can be used for therapeutic purposes. It exploits low intensity and pulsed mechanical waves to induce regenerative and anti-inflammatory effects on biological tissues, such as bone, cartilage, and tendons. Even if the real mechanism underlying its effectiveness has not been understood yet, it is plausible that the treatment relies on non-thermal phenomena, such as microbubbles and microjets induced by cavitation, acoustic streaming, and mechanical stimulation. The typical frequency range of LIPUS is between 40 kHz and 5 MHz with intensity levels between 5 and 1000 mW/cm
2 and the commonly burst excitation used is characterized by a pulse width of 200 μs and pulse repetition frequency (PRF) of 1 kHz, corresponding to a duty cycle of 20%. LIPUS is used for stimulating healing in different tissues for a variety of applications, especially in rehabilitation medicine, bone-fracture healing, soft-tissue regeneration, and inflammatory responses inhibition. At a cellular level, LIPUS has also been observed to increase migration and proliferation of aortic endothelial cells, proliferation of fibroblasts, Schwann cells, and other cell types [
5].
While the effect of HIFU is associated with generated heat, the therapeutic effects of LIPUS are traced back to low intensities within the range of 0.07–3 W/cm
2 Spatial Average Temporal Average (SATA) [
6] and frequencies of 0.5–5 MHz and a treatment duration of 5–20 min per day [
7]. Many studies showed evidence that LIPUS could regulate cell proliferation and differentiation [
8]. Induced biomechanical effects, such as radiation force, acoustic streaming, and strain gradients, seem to play a major role in triggering cellular responses at LIPUS exposures.
In order to provide good understanding on the effects of magnetic fields and US on cancer cells and tissues, further studies are required to establish their efficiency in clinical environments. For example, comparison of results in different literature appears to be very difficult due to large variations in US treatment conditions [
9].
Pancreatic Ductal Adeno Carcinoma (PDAC) is one of the most common causes of cancer-related death with a 1-year survival rate lower than 20% and a 5-year survival rate of 8%, regardless of the stage. The disease is almost always fatal, and its incidence is forecasted to continuously grow in the next years, unlike other cancer types, whose incidence is declining. For these reasons, PDAC represents an urgent medical need, and the accomplishment of new treatments is therefore mandatory. The aim of this study is the research and optimization of the parameters for the ultrasound treatment of pancreatic cancer cell lines, PANC-1, Mia PaCa-2 and BxPc3, in order to induce a resonance effect in cell capable of damaging them and eventually leading to cell death [
10].
2. Materials and Methods
2.1. Experimental Set-Up
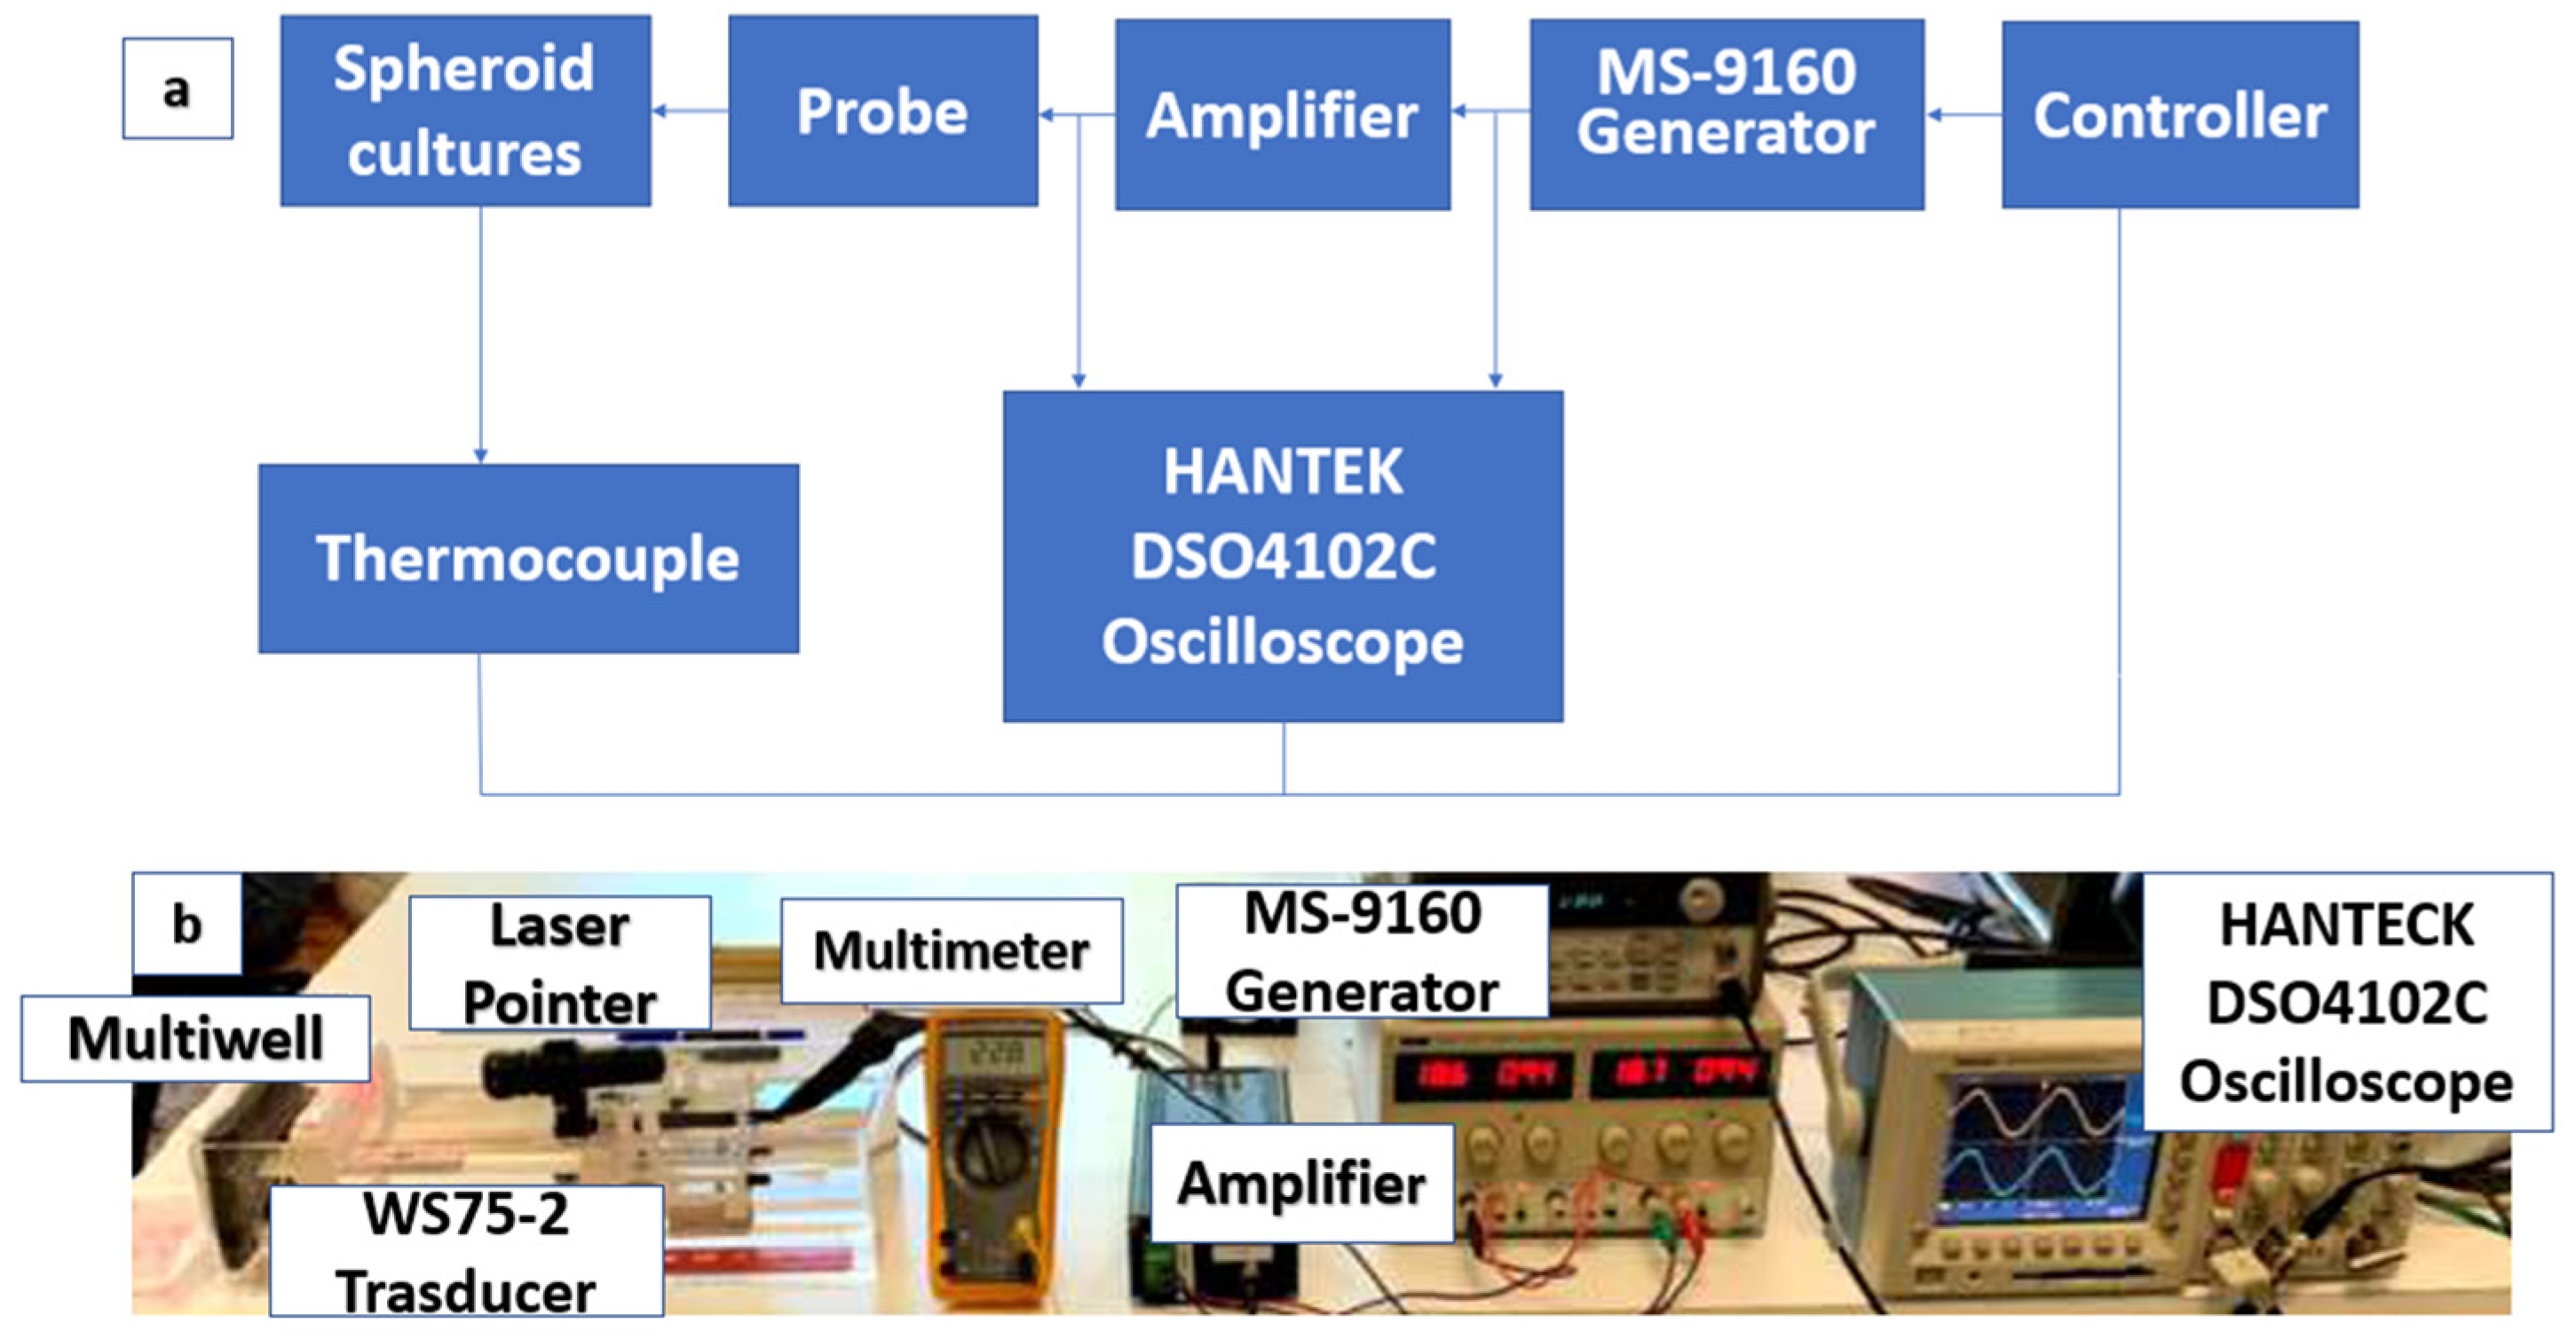
The ultrasonic setup (
Figure 1) for cell stimulation is composed of a programmable sinusoidal wave generator (MS-9160 by Universal System, Hirschau, Germany) connected in series to a power amplifier and an immersion US transducer (WS75-2, Ultran Group) with an active diameter of 19 mm. The controller can read the amplified signal by monitoring the input signal to ensure the proper stimulation signal power. A broadband linear power amplifier designed by the University of Florence was used [
11]. An oscilloscope, HANTECK DSO4102C (Qingdao Hanteck Electronics & Co. Qingdao, Shandong, China), is connected to the linear power amplifier to measure the actual signal amplitude applied to the probe and the relative power when excited in continuous wave (CW) mode. The low distortion of this amplifier [
10], even at very low transducer impedance, makes it suitable to define the ultrasound power parameters. The transducer and the sample were coaxially aligned in a small tank of deionized and degassed water of dimension 400 × 150 × 100 mm and 5 mm thickness. To allow the probe to move in the three directions, it was placed on a mechanical support that allows the US beam to be centered on the target spheroids using a laser pointer.
All cell stimulation experiments were performed in water with samples positioned at the point of maximum pressure. The control of the latter is an important task for understanding the biomechanical and biophysical effects and a detail description will be provided in this section.
Nowadays, in vitro and in vivo studies are conducted on the biological effects of low intensity ultrasound stimulations to find out the basic mechanisms and parameters to focus on in order to optimize the treatment of cancer cells.
The experimental setup involved the Ultran WS75-2 (Ultran Group, State College, PA 16801 USA) ultrasound probe, made of lead metaniobate piezoelectric material (PbNb2O6) and characterized by a geometric focus, a nominal frequency of 2 MHz and a frequency band between 1 MHz and 3.5 MHz (Ultran Group, State College, PA 16801 USA).
In particular, water was used as the transmission medium for its extremely small attenuation coefficient, equal to 0.002 dBcm−1 MHz−1 at 25 °C, resulting in an acceptable attenuation for the probe focal distance, calculated at the three respective stimulation frequencies.
For the stimulation at the three different frequencies, which correspond the three different focal distances, a slide was made on the bottom of the tank allowing the probe to be fixed at the required focal distance. The probe support is designed to allow translation on all three axes, keeping the US beam perpendicular to the surface of the multiwell containing cell cultures (
Figure 2).
2.2. Cell Culture and Methodology Description
The heating inside the multiwell was monitored and quantified using a mixture consisting of agarose and culture medium was prepared: the thermocouple was positioned inside the mixture, the multiwell was sealed, and stimulation was started.
For experimental tests, PANC-1 (ATCC-LGC, Manassas, VA, USA), human pancreatic ductal adenocarcinoma cell line along with Mia Paca2 (ATCC-LGC, Manassas, VA, USA) and BxPc3 (ATCC-LGC, Manassas, VA, USA) human pancreatic cancer cell lines were stimulated. All the cells were purchased from ATCC (American Type Culture Collection).
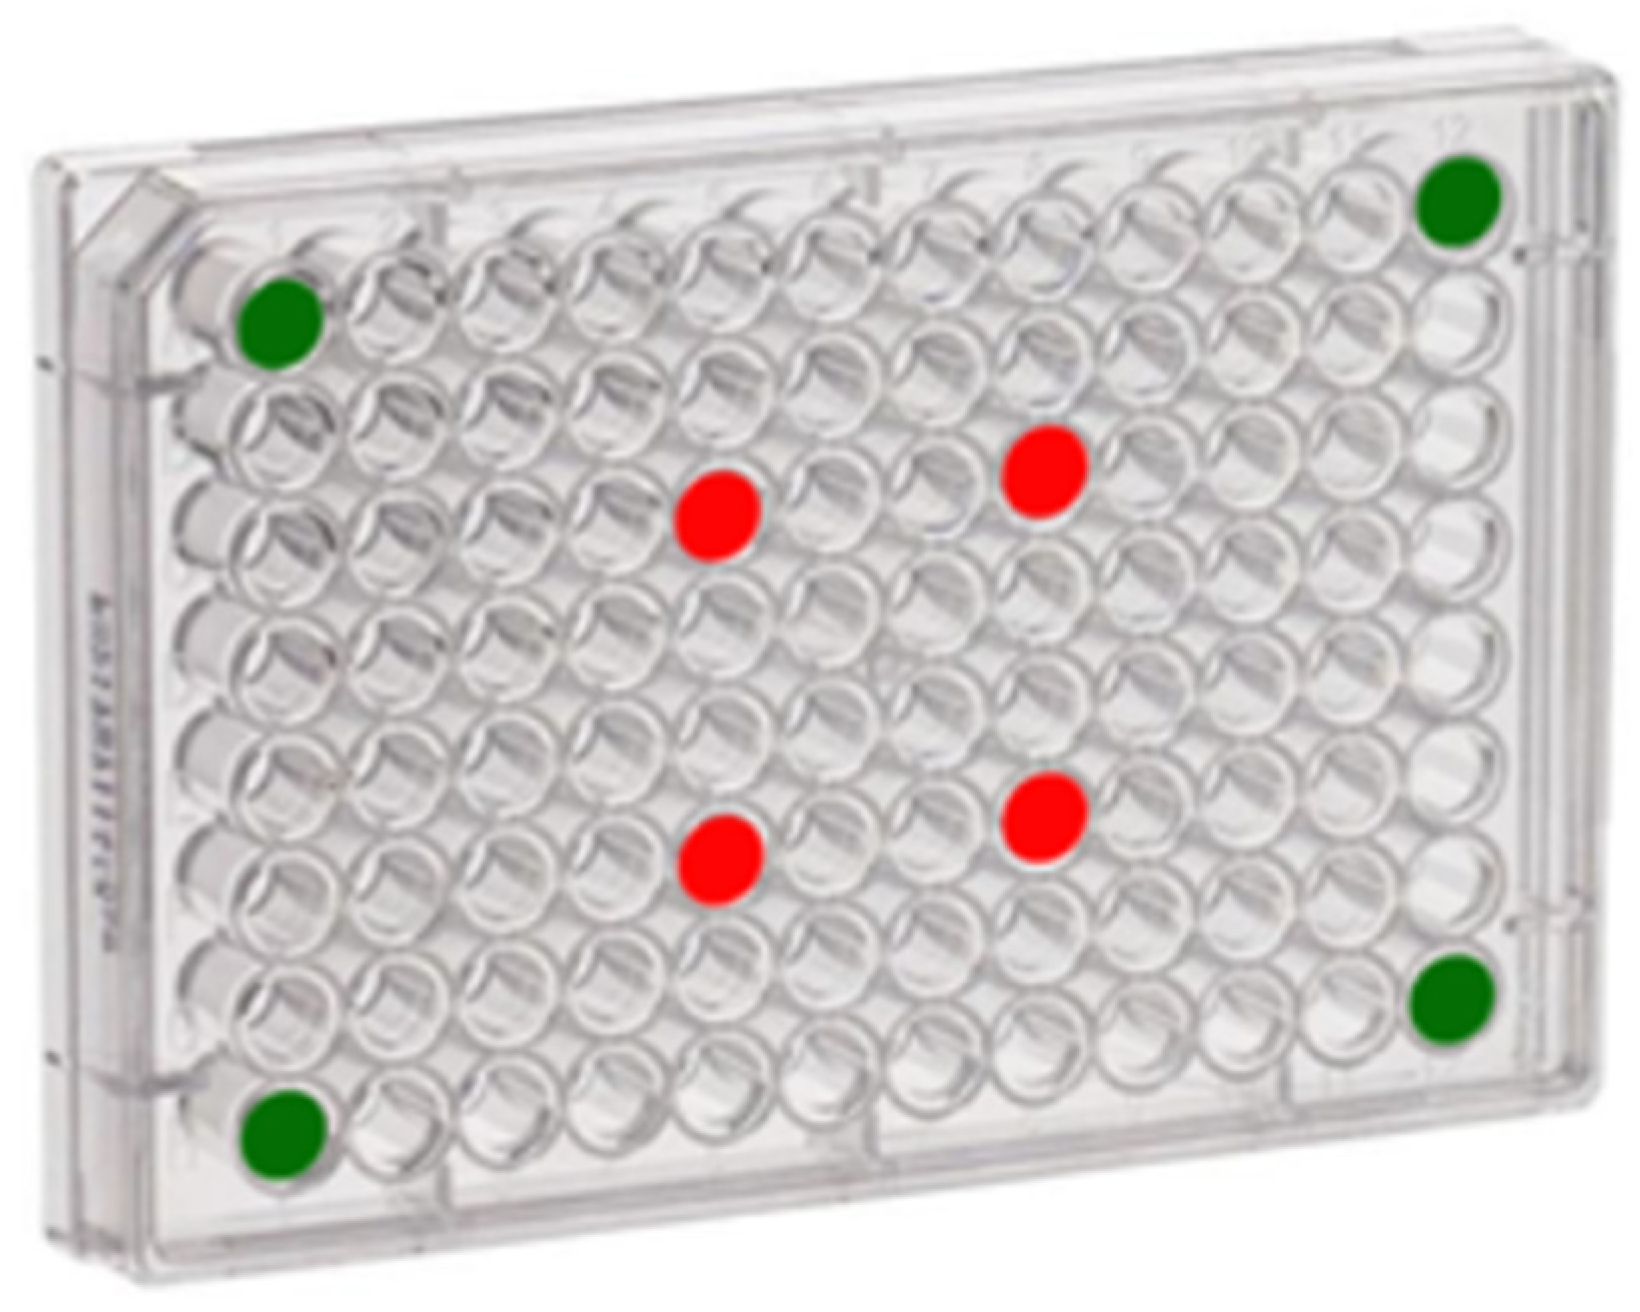
Thanks to the probe field intensity characterization it was possible to establish for each working frequency where to place cells cultures within a 96-well multiwell (Fisher Scientific Italia, Rodano (MI) Italy) avoiding the overlap of the US beam. This configuration has permitted the testing of major number of spheroids in the same day test, reducing the cell mortality by quiescent effect. Each multiwell has four spheroids to stimulate and four control spheroids, as shown in
Figure 3. Since four multiwells (one for each stimulation frequency) have been prepared for the experimental tests, the results obtained from each frequency have been evaluated on four different cultures. It was important to insert the control group inside the multiwell, because they had to stay in the same environmental and suffer transportation, immersion in water at 20 °C, to a good comparison.
To avoid water infiltration inside the multiwell, the latter was sealed using a transparent PVC film positioned between the multiwell and the multiwell cover. By properly adhering the film to the multiwell and sealing the system, it is possible to avoid contamination of cell cultures.
For every test, PANC-1 cells were cultured in an up-to-date 3D conformation, which is that of a spheroid. The latter are usually non-scaffold-based cultures formed by rounded cellular aggregates [
12]. Cells were routinely cultured in a humidified incubator at 37 °C with 5% CO
2 using DMEM Dulbecco’s Modified Eagle Medium (DMEM) (Fisher Scientific Italia, Rodano (MI), Italy), High Glucose (Euroclone S.p.A, Pero (MI), Italy) supplemented with 4 mM L-Gln (Glutamine) and 10% FBS (Fetal Bovine Serum) (Euroclone S.p.A, Pero (MI), Italy). For 3D spheroid cultures, cells were detached with trypsin and counted using trypan blue. Trypan blue dye exclusion test was used to determine the number of viable cells present in a cell suspension. It is based on the principle that live cells possess intact cell membranes that exclude certain dyes, such as trypan blue. The 10
3 cells were seeded on an agarose base layer (1.5 g/l) in a 96-well plate and grown for 96 h in a humidified incubator at 37 °C and 5% CO
2.
All four spheroids for each stimulation frequency were treated for 15 min. Before proceeding, the initial temperatures of the water contained in the tank and the wells containing the target cultures were acquired. The same acquisitions were repeated every 5 min until the end of the treatment for a total of five acquisitions, in order to verify a thermal increase of less than 2 °C at the target well. The 96-well plate after the incubation in the experimental set up was immediately moved to the cell incubator using a portable 37 °C incubator set up with controlled temperature parameters.
2.3. Calcein AM and Annexin/PI Assay
Calcein AM//PI (AcetoxyMethyl/Propidium Iodide) is a cell dye that can be used to determine cell viability in most eukaryotic cells. In live cells the nonfluorescent calcein AM is converted to a green, fluorescent calcein after acetoxymethyl ester hydrolysis by intracellular esterases. PI is internalized by necrotic cells. For Calcein AM/PI assay, cells were stained by adding fresh medium containing Calcein AM (2 µg/mL) and PI (10 µg/mL) (Euroclone S.p.A, Pero (MI), Italy), incubated for 20 min and then washed with PBS. The samples were examined using an SP8 confocal microscope (Leica, Wetzlar, Germany). Images were captured using the Leica LAS-X image acquisition software (Leica Microsystems GmbH, Wetzlar, Germany).
Apoptosis was determined using the Annexin V/PI test (Annexin-V FLUOS Staining Kit; Roche Diagnostics, Mannheim, Germany), as in [
12]. Spheroids were taken from the agarose using a micropipette with an enlarged tip, in order to achieve high harvesting efficiency with great spheroid integrity. The harvested spheroids collected using manual pipetting at this point were dissociated into single cells using trypsin-EDTA 0.25% for 5 min with gentle pipetting up and down to minimize aggregated cell population for following analysis [
13]. According to this procedure, (i) viable cells are negative for both Annexin V and PI (Q3 quadrant gate in the dot plots); (ii) cells that are in the early phases of apoptosis are Annexin V positive and PI negative (Q4 quadrant gate in the dot plots); (iii) cells that are in the late phases of apoptosis are both Annexin V and PI positive (Q2 quadrant gate in the dot plots); and (iv) dead cells are Annexin V negative and PI positive (Q1 quadrant gate in the dot plots).
2.4. Statistical Analysis
Unless otherwise indicated, data are given as mean values ± SEM. At least three independent experiments were performed. Statistical comparisons were performed with OriginPro 2015 and SAS 9.2 (SAS Institute) software. The normality of data distribution was checked with a K-S test. In the case of normal distributions, each data set was first checked for variance homogeneity, using the F test for equality of two variances and the Brown–Forsythe test for multiple comparisons. For data with unequal variances, the Welch correction was applied. For comparisons between two groups of data, we used the Student’s t test. A two-sample K-S test was performed to test whether two underlying probability distributions differed. For multiple comparisons, one-way ANOVA followed by Bonferroni’s post hoc test was performed to derive p values.
2.5. Stimulation Parameters
In this set up we used a 15 MHz bandwidth linear power amplifier [
11] and a hydrophone (0.25–20 MHz frequency range, sensitivity: 282 nV/Pa, HGL 0400 series by Onda Sonics Corp. Sunnyvale, CA, USA) was used to determine the trend of the probe pressure range and the US focus. Spheroids were treated at three different stimulation frequencies and then each well containing a treated spheroid was stained using Calcein AM/PI dye. Subsequently, spheroid images were acquired using a confocal fluorescence microscope, and cell vitality vs. mortality was assessed using the BioFilmAnalyzer software [
14].
For
f = 1 MHz stimulation, a value of F = 90 mm from the transducer was chosen as the focal distance since it is the first point on the interpolation curve (
Figure 4). This point is located in the far field and with the chosen parameters the Rayleigh length (
ZR) results at 55 mm from the Ultrasound probe surface. The Rayleigh length is an important parameter because it represents the distance along the propagation direction of the beam from the waist to the place where the area of the cross section is doubled, and it is commonly use when beams are modeled as Gaussian beams:
where
a is the radius of the piezoelectric and
c is velocity of propagation in the medium.
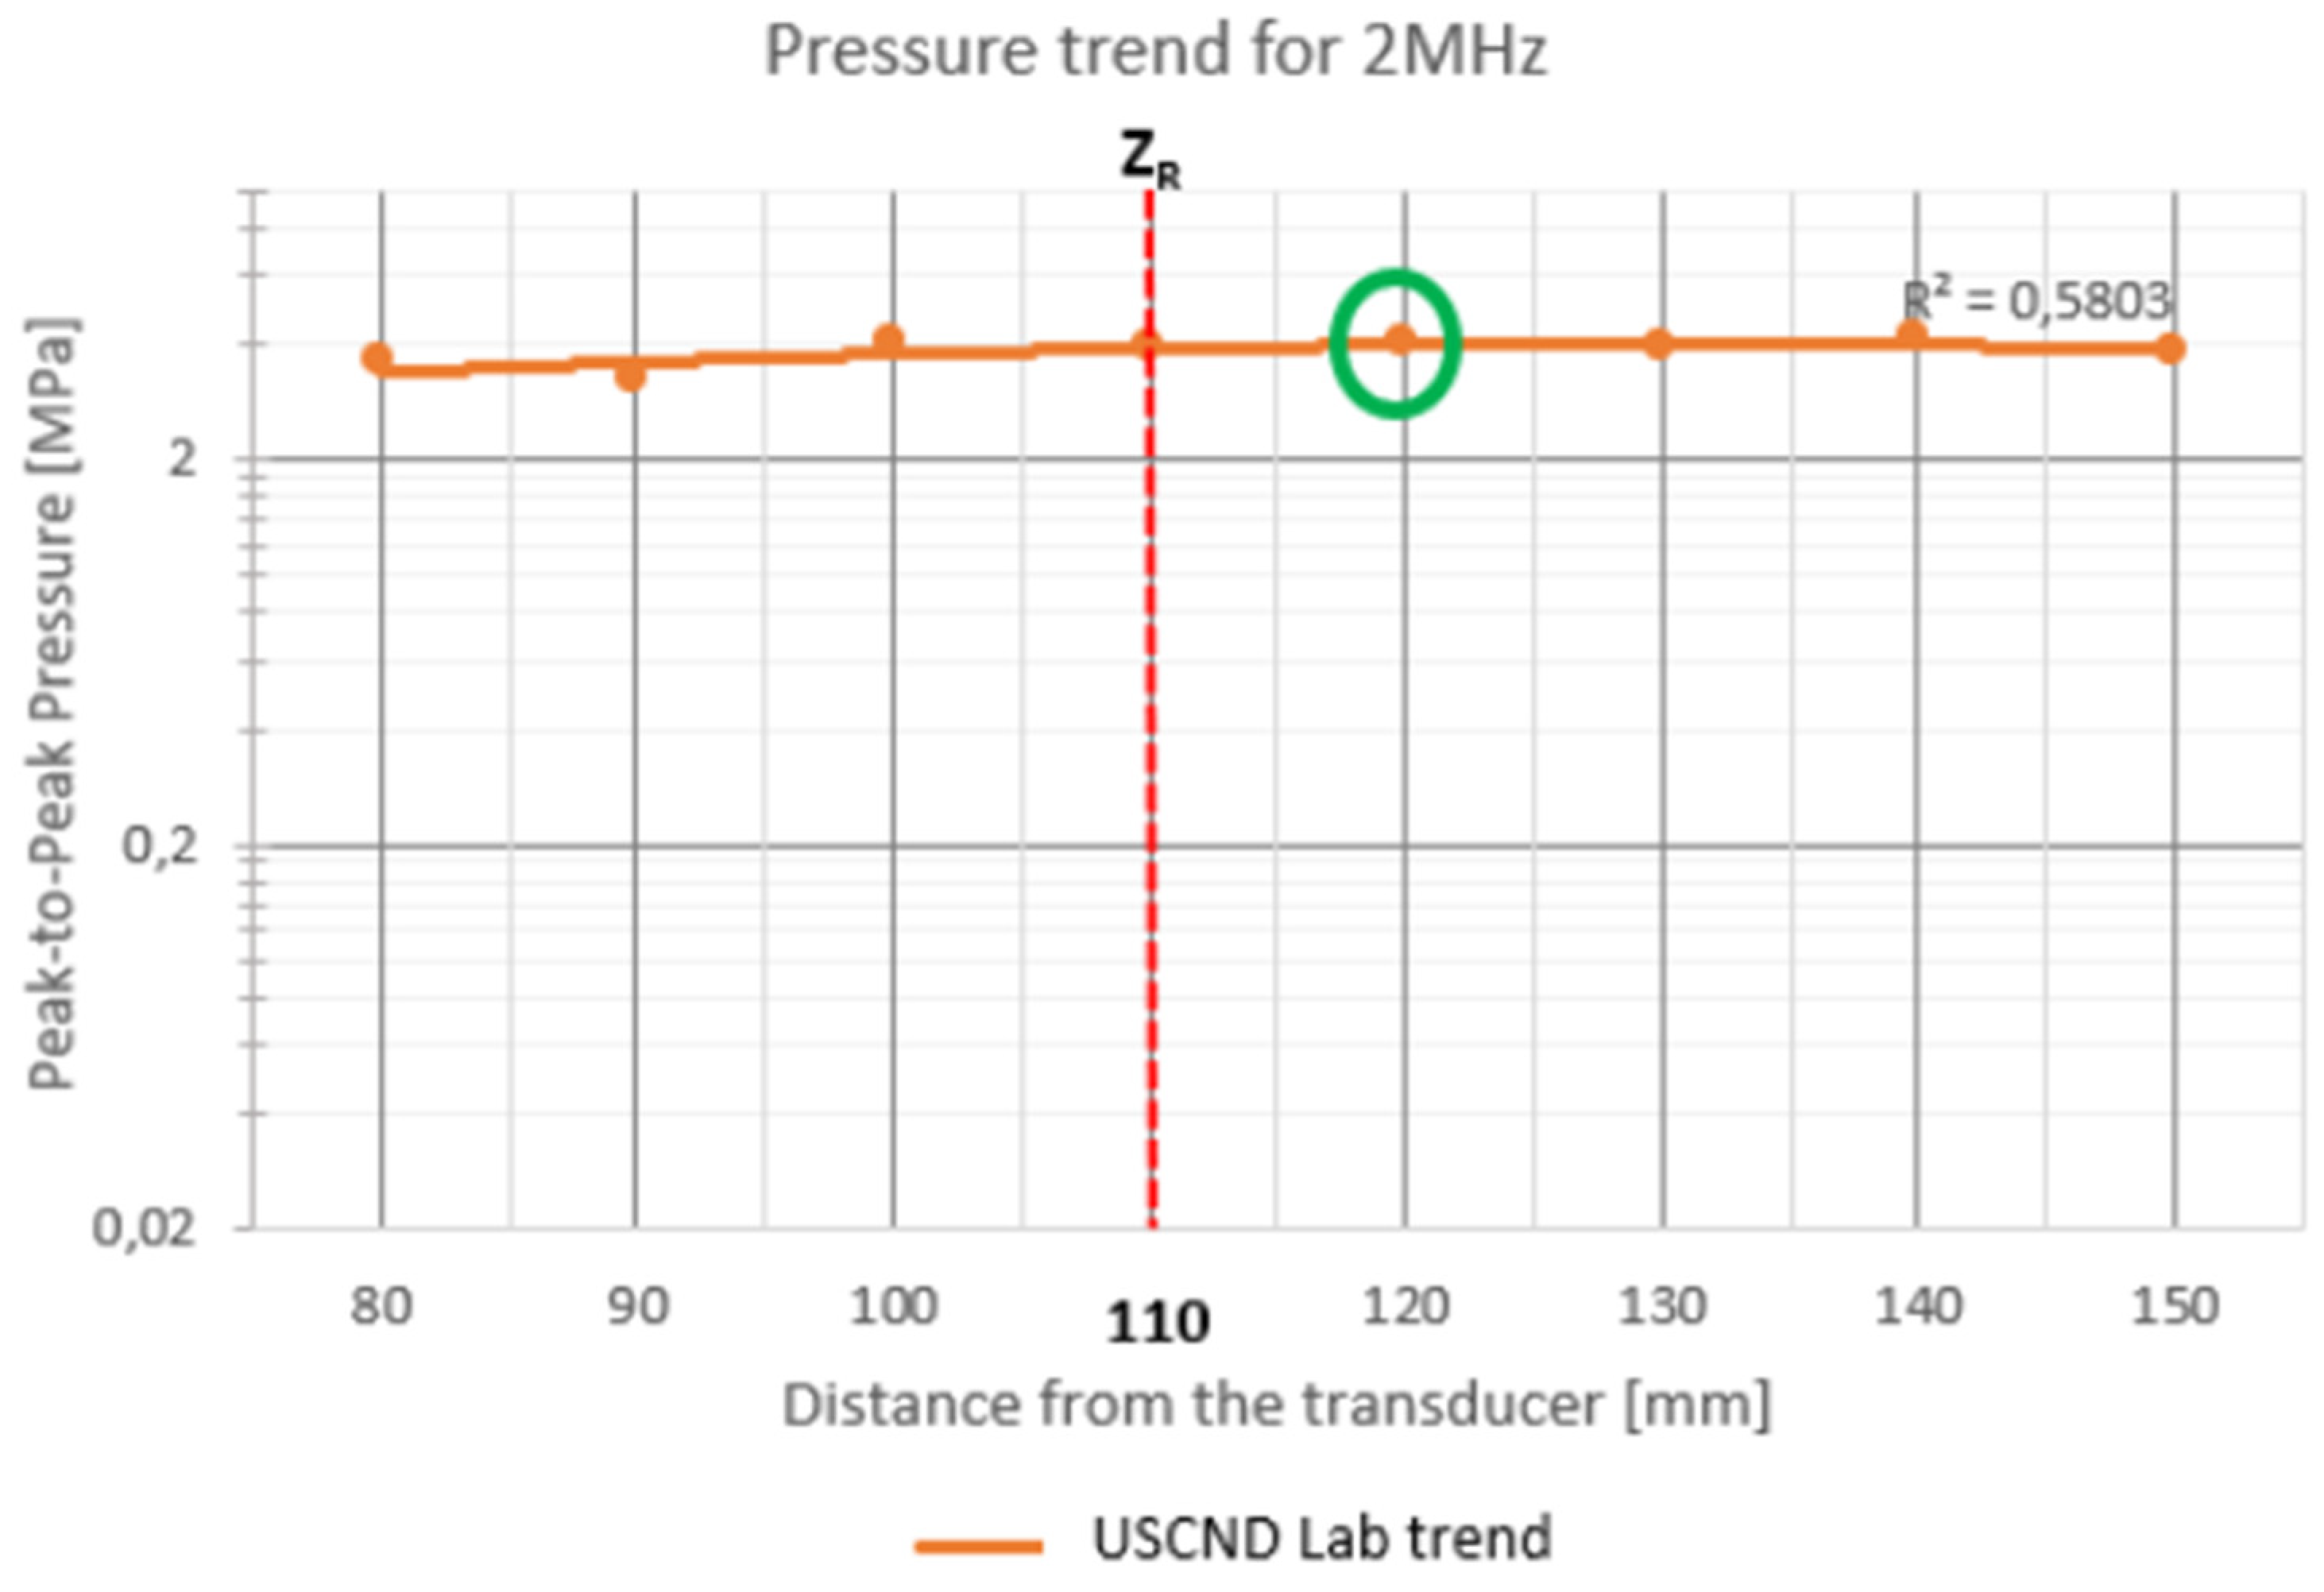
For 2 MHz stimulation (
Figure 5), measurements were taken around the Rayleigh distance (110 mm). In fact, in the graph there are points that give an irregular trend and that come out of the interpolation curve (80, 90 and 100 mm). The point chosen for stimulation is at a distance of 120 mm from the translator.
For 3 MHz stimulation (
Figure 6), the points measured by the hydrophone are located in the near field, in fact
ZR = 165 mm. The only point that is positioned around the Rayleigh distance is 150 mm, chosen as the optimal stimulation point.
To calculate the intensity, the following aspects were considered:
The difference between the acoustic impedances of the water and the multiwell cover generate a reflection of the pressure wave, which can be assessed with the following formula [
11]:
where p
i and p
t are the pressure incident on the cover of the multiwell and the pressure transmitted through the cover, respectively.
T is the transmission coefficient. Z
p and Z
a are respectively the acoustic impedance of the PMMA cover (3.23 MRayls) and of the water (1.48 MRayls).
The attenuation of the sound beam through the cover will be minimal and can be assessed using the following formula [
11]:
where
α = 1.1 dB/(cm MHz) is the attenuation coefficient of PMMA,
x is the distance traveled by the beam through the material,
p (0) the initial pressure.
According to the previous considerations, the SATA values were calculated considering the Spatial Peak Intensity (I
SP), that represents the energy provided by the beam on the area of 1 cm
2, at the three stimulation frequencies (I
sp1 = 1 Mhz; I
sp2 = 2 Mhz; I
sp3 = 3 Mhz), considering a Gaussian waveform of the beam (whence the Beam Uniformity Ratio) and a duty cycle of 20%, obtaining the following values:
These SATA values fall within the characteristic range of the low intensities 0.07–3 W/cm2 of ultrasound that involves the temporal average of all propagating pulses that are emitted during several frames and that make significant intensity contributions over a specified scan cross-sectional area.
3. Results
The thermal trends recorded during the stimulation procedure confirm a low intensity treatment; in fact, cell death is not caused by thermal effects, but only by the mechanical effects of ultrasound. The temperatures were acquired in water, in correspondence with the probe and inside the target well.
Table 1,
Table 2 and
Table 3 show the average values calculated from the four stimulations conducted for each frequency.
Ten sessions of experimental testing took place. For each treatment, three 96-well plates were used, one for each stimulation frequency, including four containing PANC-1 cell cultures to be treated, and four containing control PANC-1 cell cultures.
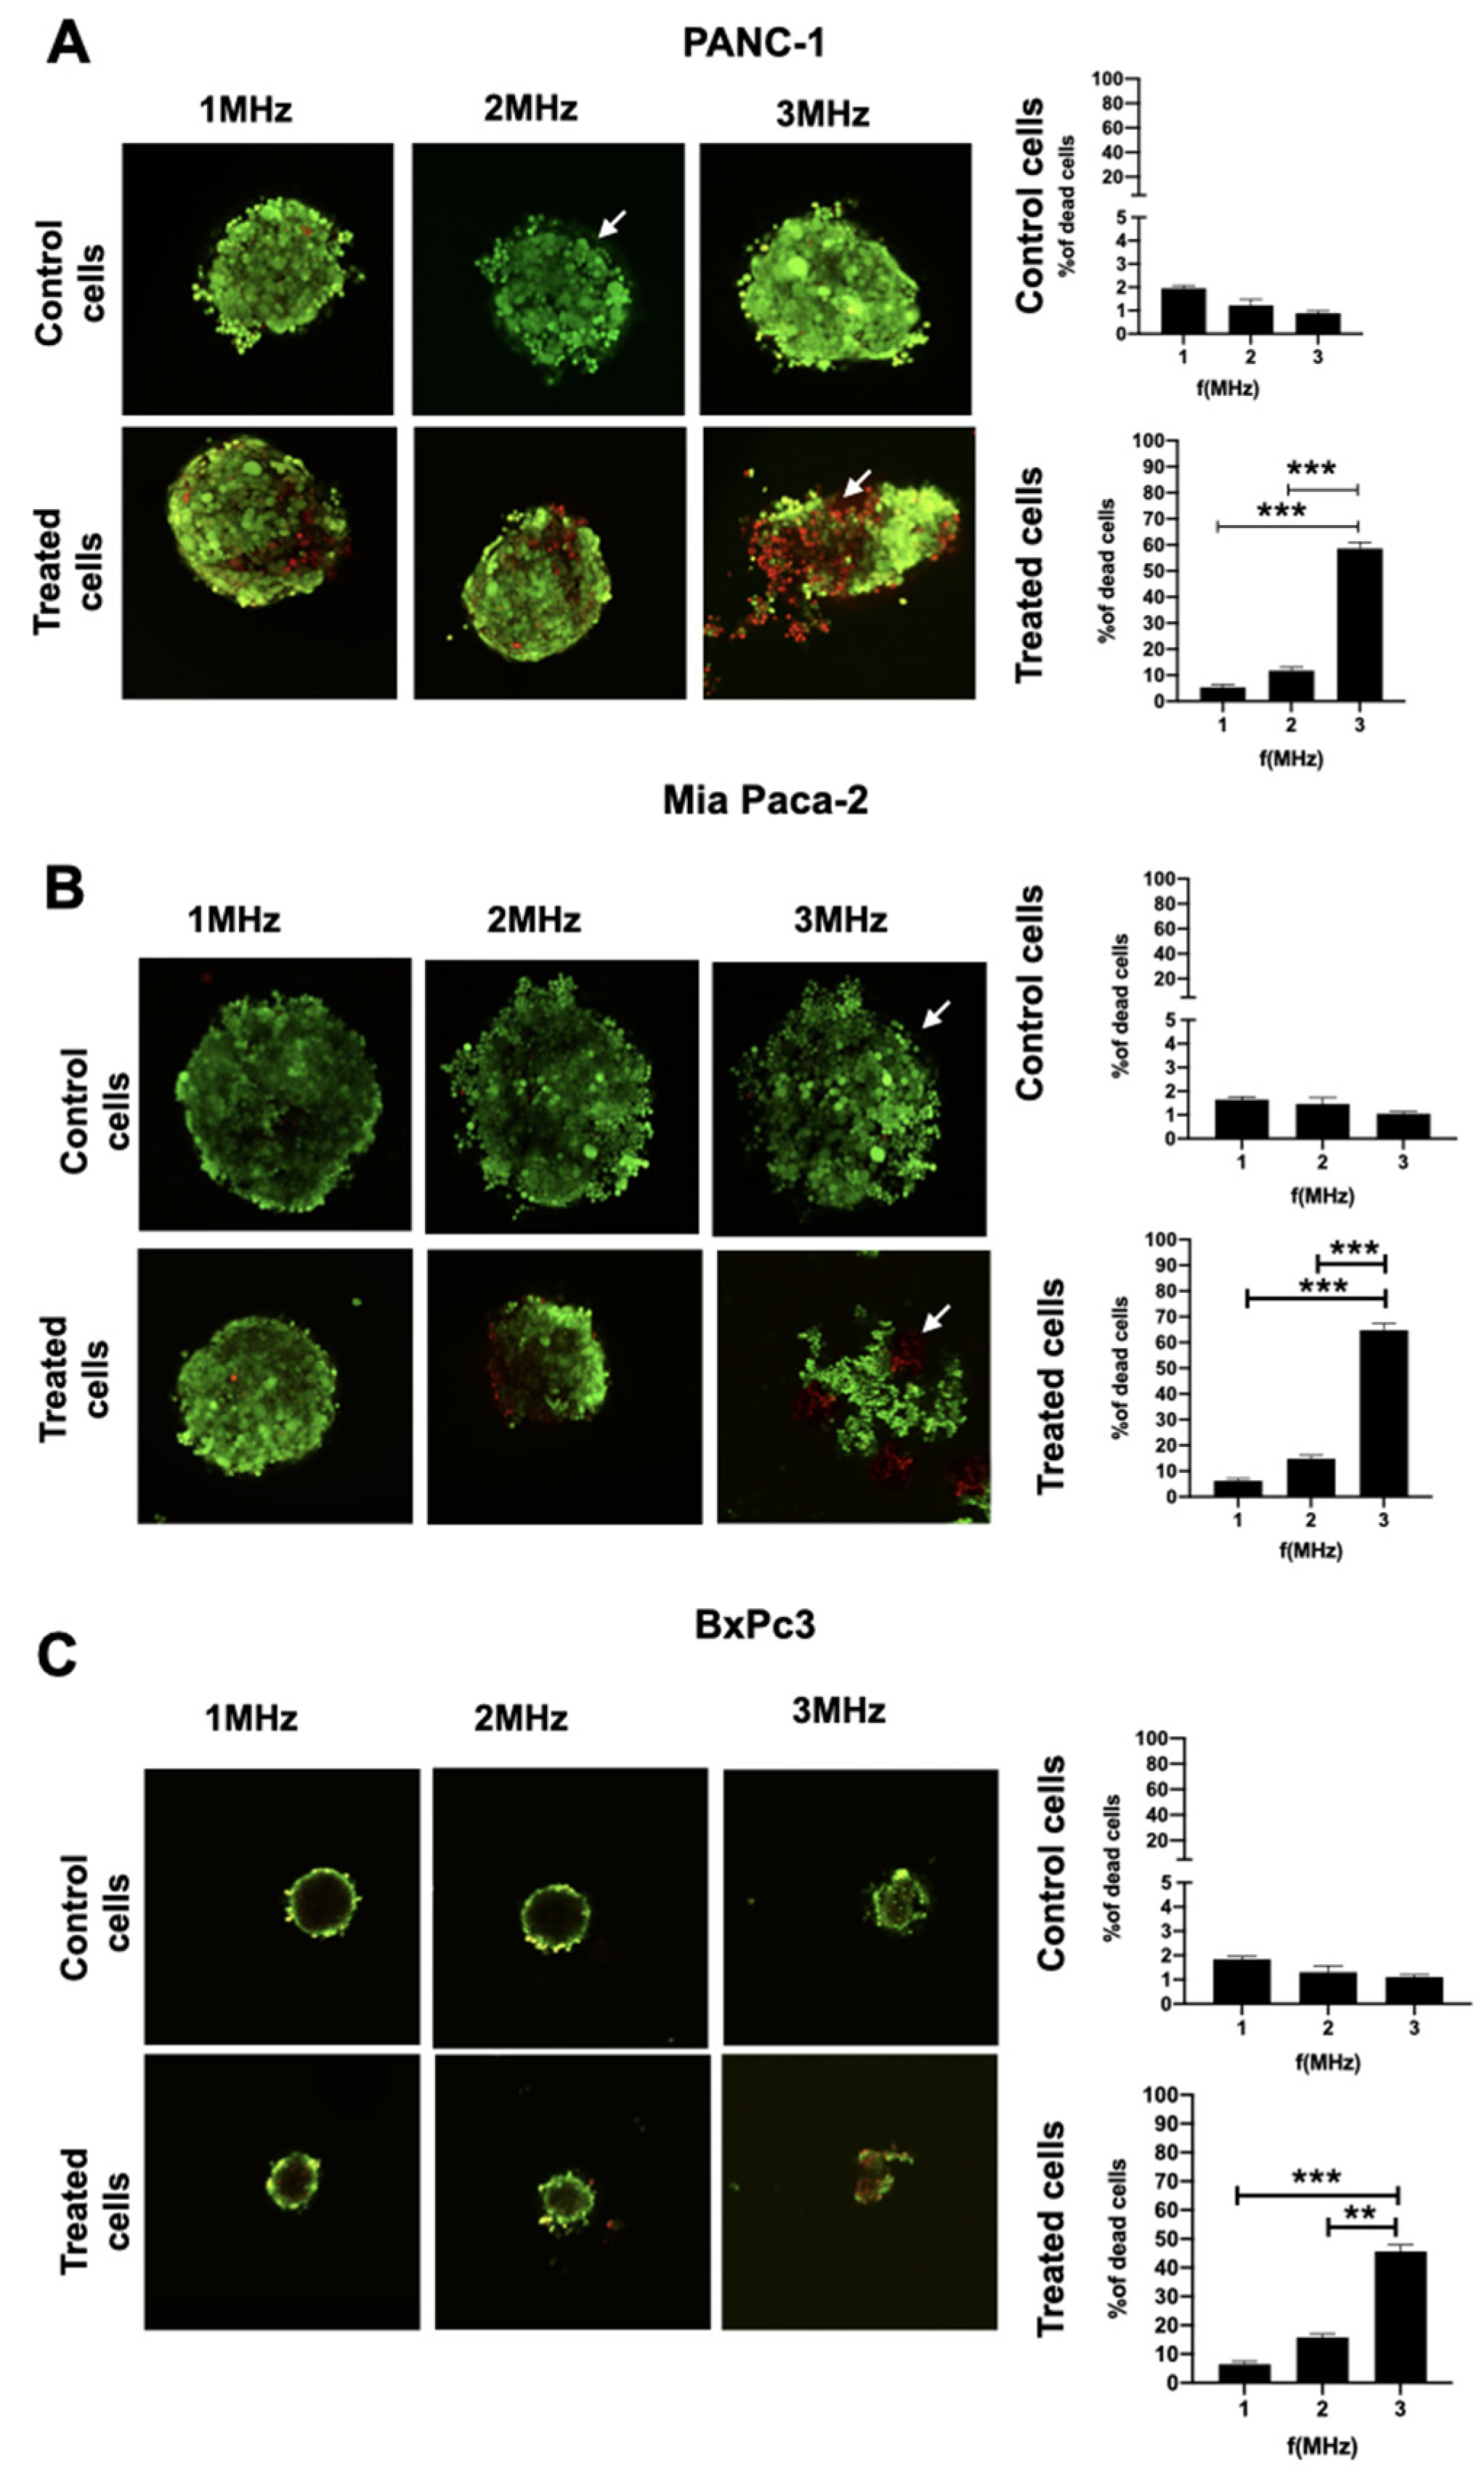
Cells treated at different frequencies were stained with Calcein AM/PI and images were acquired using Confocal microscopy at a magnification of 10× (image size for all pictures: 900 x 900 µm). The analysis provided cell death index as a ratio between red cells (dead cells) and green cells (live cells), as shown in
Figure 7. The percentage of dead cells was shown at three different frequencies for the treated spheroids. On the right side of each panel, the mortality rate of untreated spheroids due to the possible side effects induced at various frequencies at a distance of 25 mm from the stimulation beam was evaluated.
p-Values for each investigated frequency results were: 0.19 for 1 MHz, 0.0018 for 2 MHz and 0.0013 for 3 MHz, respectively. Highly significant values were obtained using 3 MHz frequencies, if compared to both 1 and 2 MHz.
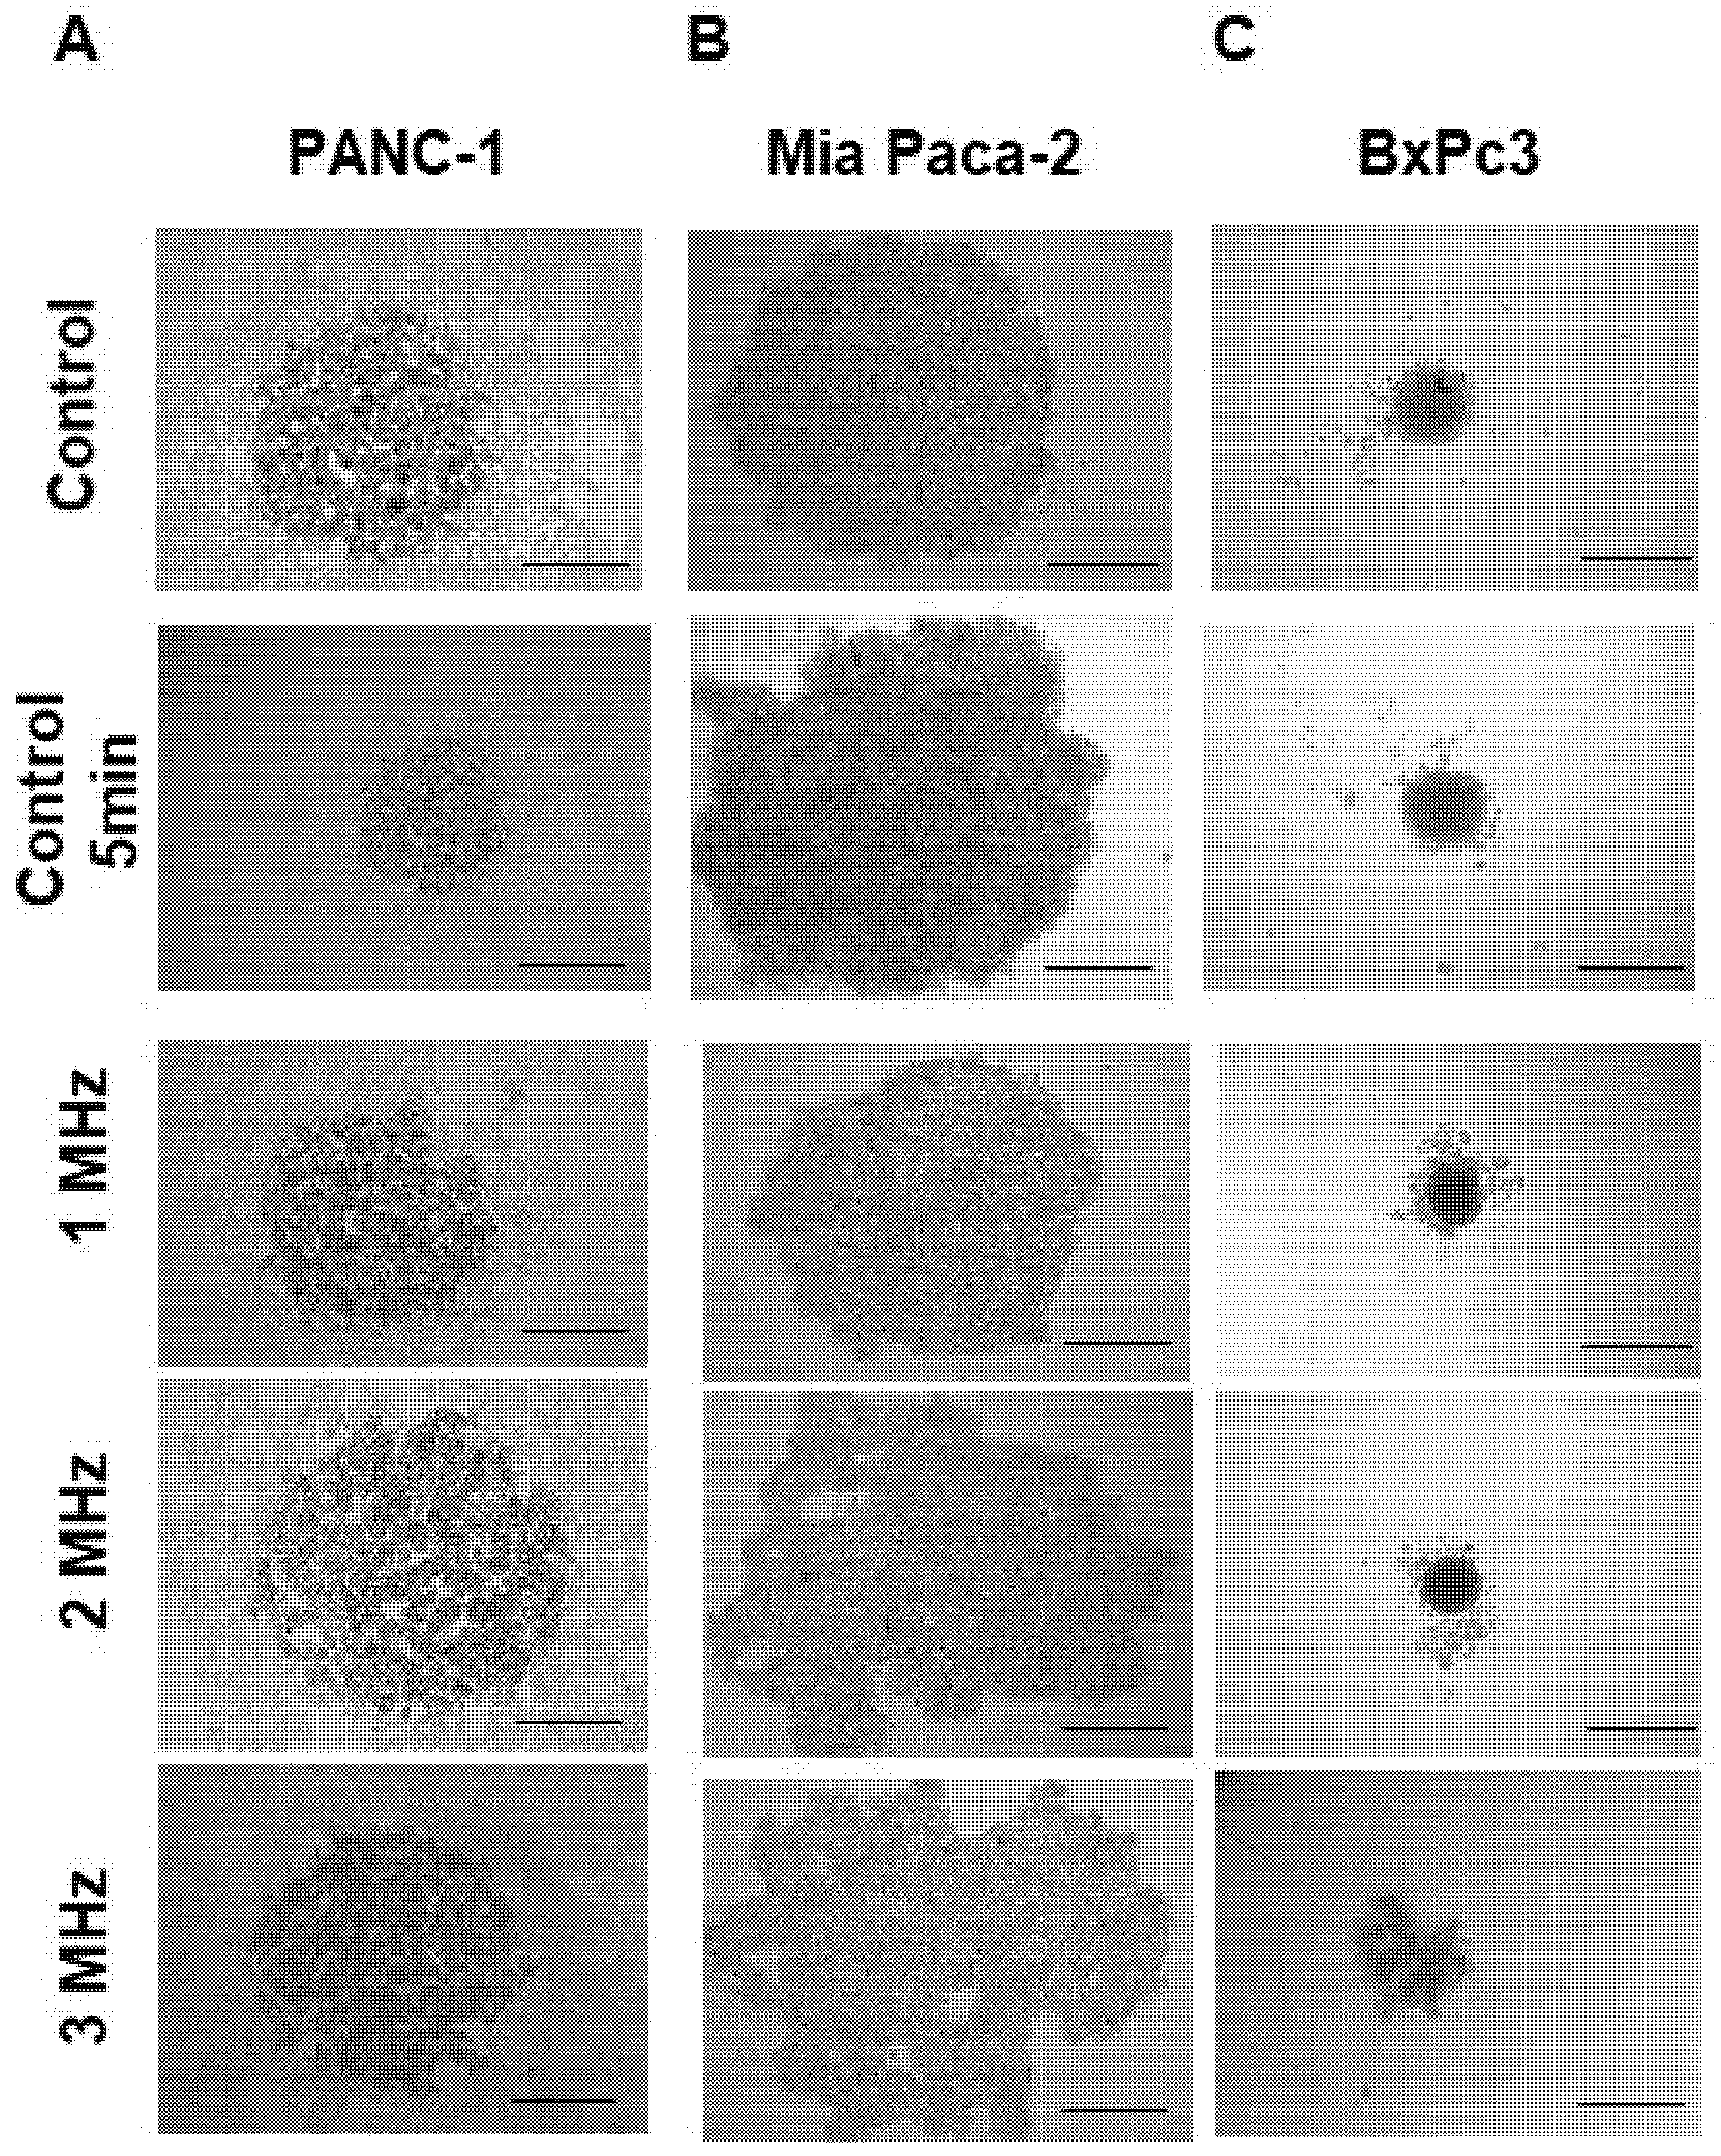
During the US treatment, total disruption of some spheroids was found with a cadency of 25% within the treated population. The frequency seems to affect only the level of cell scattering, as shown in
Figure 8. Overall, the morphology of the spheroids results appeared to be deeply affected by the US treatment. Spheroids appeared more compact in the controls, while cells tended to disaggregate after the treatment, losing their shape or appearing enlarged and round-shaped at the highest frequency of 3 MHz. After treatment, BxPc3 cells tended to disrupt and to move from the center core of the spheroids.
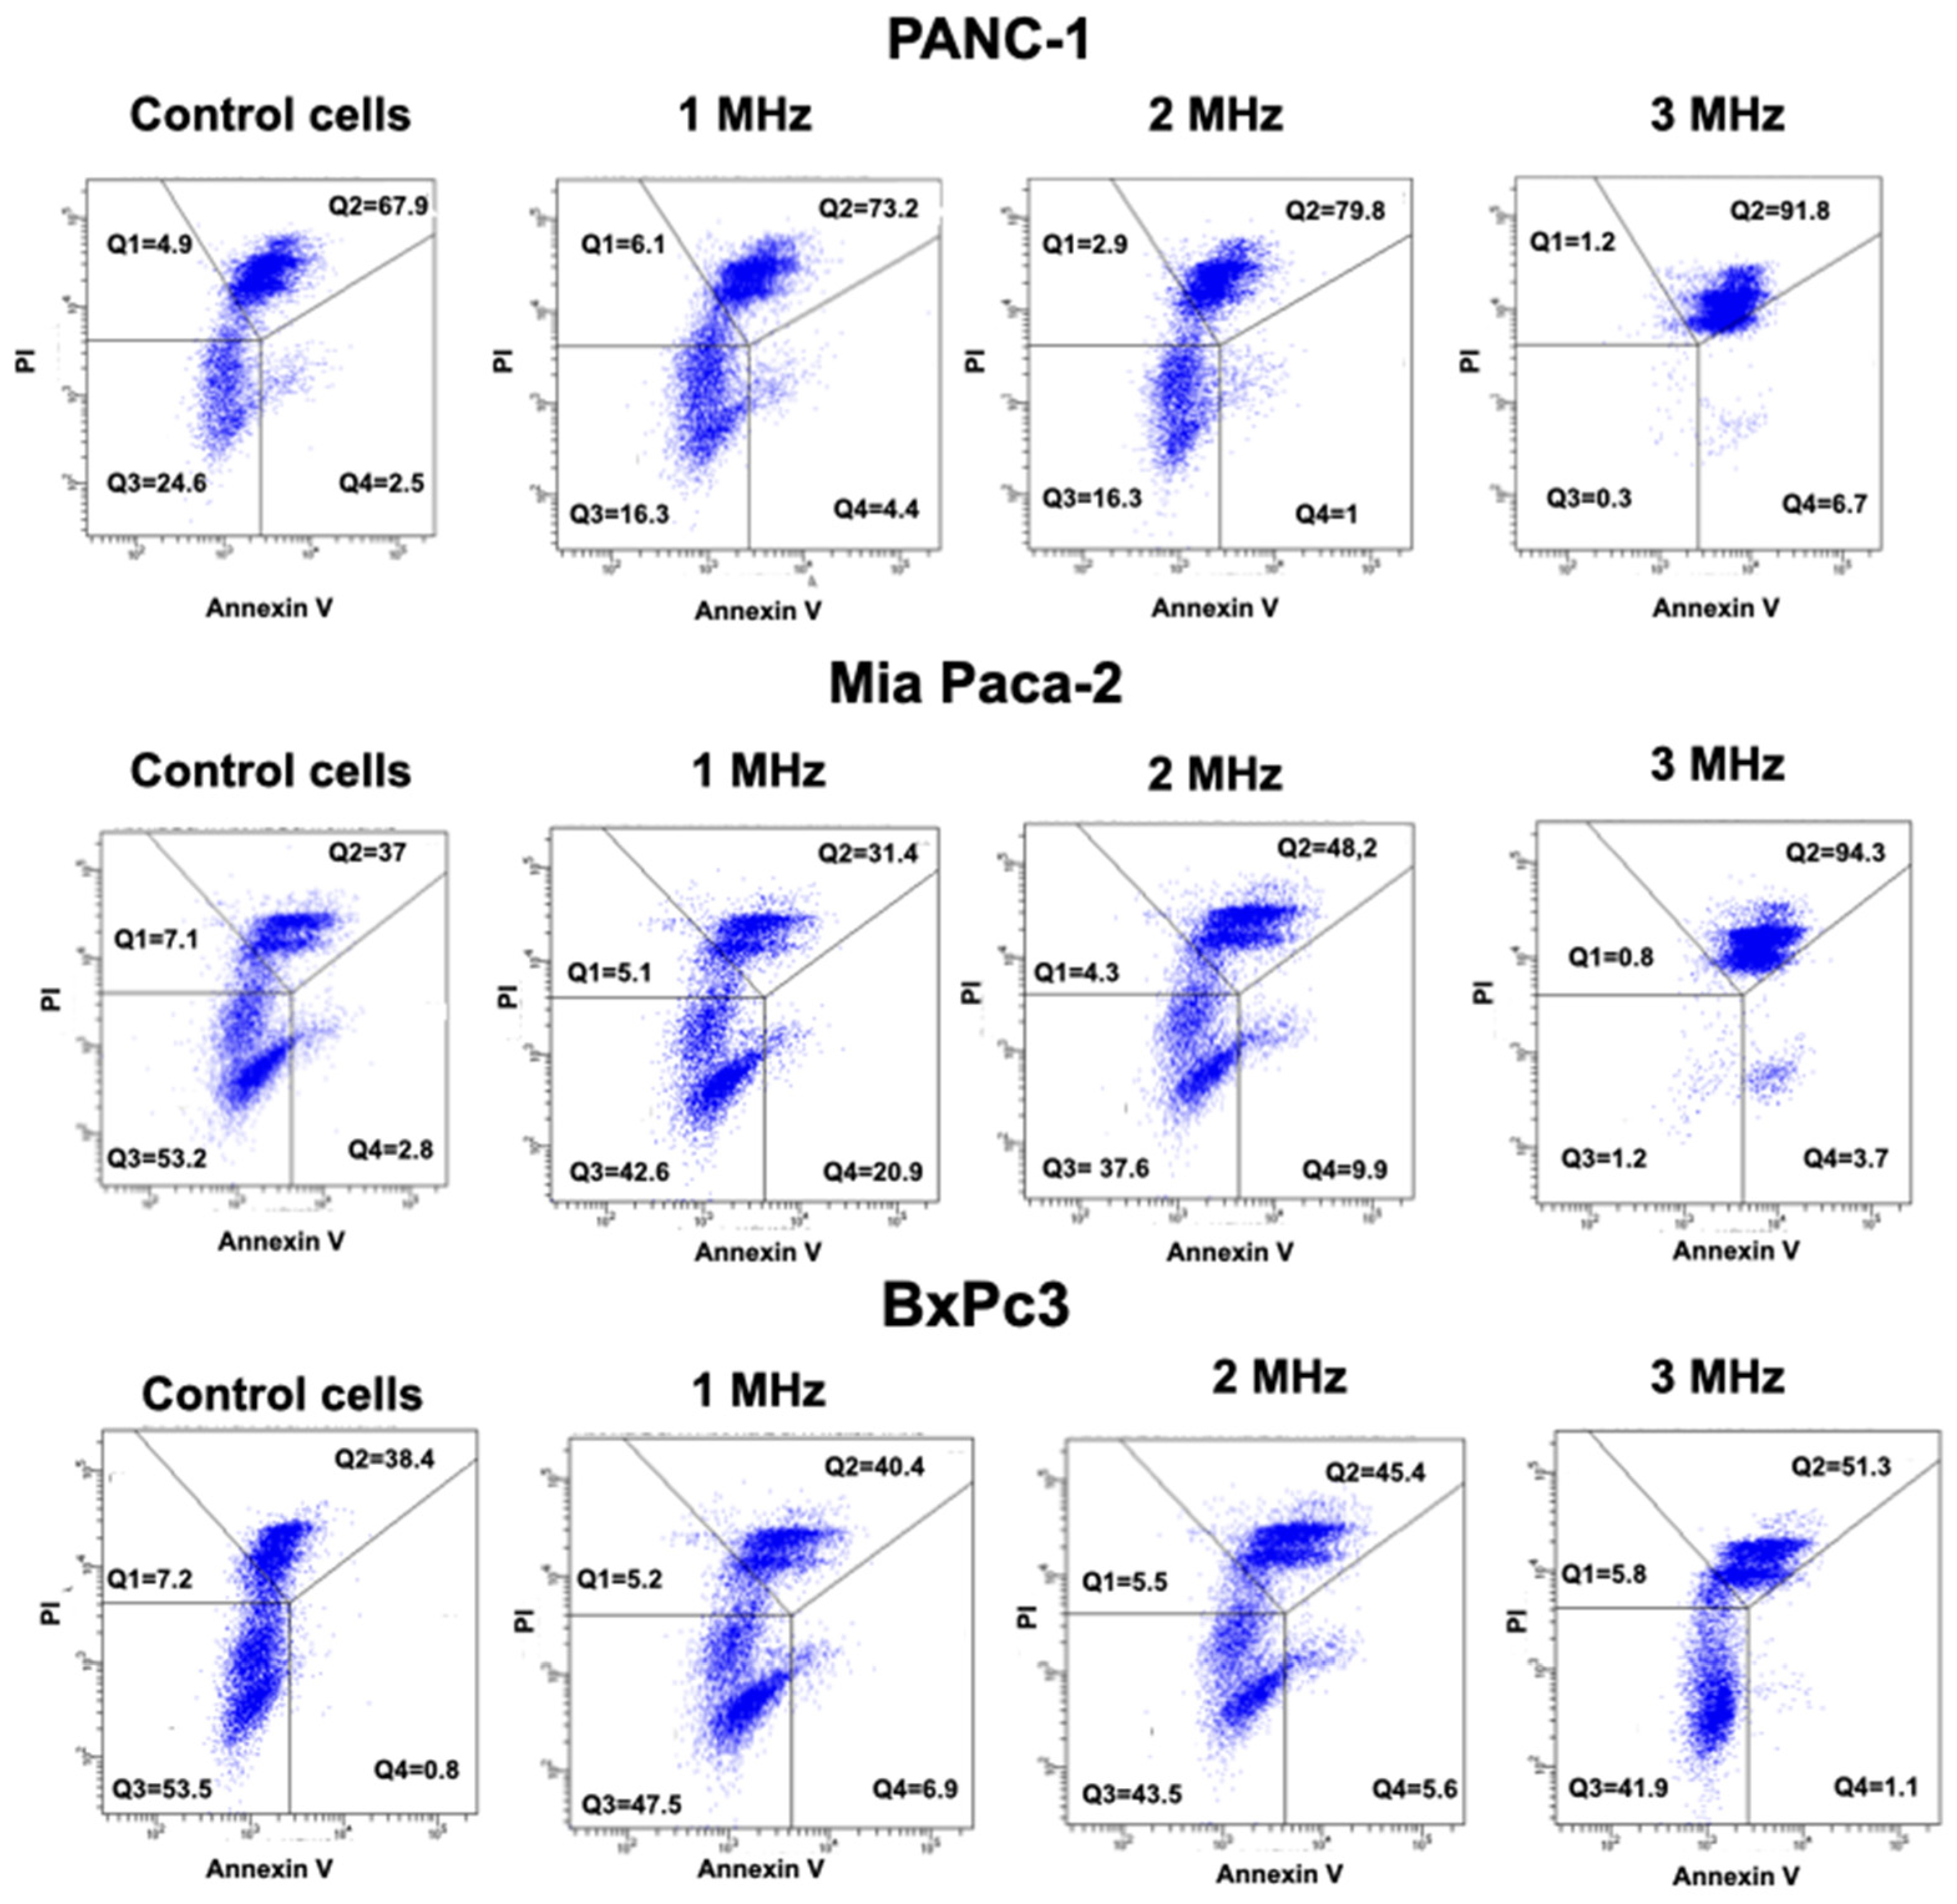
We also analyzed the Annexin/PI staining in all the three cell lines, comparing the results in control conditions, as well as after the application of 3 Hz US.
Figure 9 clearly shows that all the three PDAC cells are in late apoptosis after US treatment at 3 MHz, compared to the respective control.
In particular, PANC-1 cells show 91.8% of treated cells in Q2 (late apoptosis) compared to 67.9% of Control cells. Mia Paca-2 treated cells have 94.3% of cells in Q2, compared to 37% of Control cells. Finally, BxPc3 has 51.3% of cells in Q2 compared to 38.4% of control cells. A lower effect, but in consistence with the trend, was envisaged in cells treated at lower frequencies, as reported in
Figure 9.
4. Discussion
Literature describes the use of LIPUS in four major areas of cancer therapy: sonodynamic therapy, ultrasound-mediated chemotherapy, ultrasound-mediated gene delivery and anti-vascular ultrasound therapy. It is known that each technique has resulted in the death of cancer cells, with bio-effects attributed primarily to thermal actions and inertial cavitation. Nevertheless, protocols using ultrasounds and avoiding thermal draw backs are needed. Moreover, the application of these agents is important as it establishes a therapeutic–diagnostic platform for anti-cancer therapy [
15]. In this scenario, we have set up a protocol to test LICUS effects on a PDAC, or pancreatic cancer tumor model. The latter was chosen with the ultimate goal to address the need of therapeutic approaches to treat this oncological malignancy. It is known that pancreatic cancer has a very high mortality rate, with an incidence that is increasing in economically developed countries, such as the USA, due to lifestyle habits [
16]. We have found that the executed treatments are capable of avoiding thermal damage to the cells and that, according to literature, cell mortality can be ascribed only to LICUS effect.
Cell mortality was assessed using the BioFilmAnalyzer software, analyzing the spheroid images acquired with the confocal fluorescence microscope. We have found that the frequency capable of inducing cell death through LICUS treatment is 3 MHz.
The analysis of cell mortality allows for the definition that the 3 MHz stimulation frequency is the most effective in inducing cancer cell death. With this set up, further frequencies and intensities will be investigated to optimize treatment times. Moreover, data obtained with the Annexin PI staining suggest that the 3 MHz treatment frequency is capable of inducing cell death, which can be conceivably interpreted as a necroptosis process. This is evident from the plots in all three pancreatic cancer cell lines, where a strong increase in cells in the Q3 quadrant is evident. Such findings were also confirmed from the analysis of the brightfield images of spheroids, showing an enlarged shape of 3 MHz treated cells, which is a sign suggesting the cell transition towards necroptosis. The high percentage of dead cells emerging from the Annexin PI analysis is justified because the staining allows for the quantification of dead cells in the external surface of the spheroids, while for apoptosis analysis, spheroids are disrupted, being able to also quantify dead cells in the central core of the spheroids. Such consideration holds true both for treated and control cells. Moreover, in the brightfield image cells in spheroids treated with 3 MHz manifested a migratory behavior, which is consistent with the effect on proliferation and migration reported in literature and we truly believe it is directly due to the US treatment [
9].
We believe we have obtained preliminary but significant results in LICUS treatment of pancreatic tumor spheroids with a single US treatment.
The setup and therapeutic protocol represent an innovative strategy for cancer treatment per se and we are confident that, after a proper validation, this can be useful to achieve at least 40% reduction in grafted tumor mass, comparable to that obtained with immunotherapeutic approaches tested in vivo with the administration of nanoparticles [
17]. Despite the promising applications of the platform, some improvements will be mandatory, such as the test of the set up in a more complex 3D culture, which should encompass extracellular matrix components and the use of pancreatic stellate cells (PSC) [
18]. Moreover, in vivo tests will be a further step in order to better clarify the biological effects of US treatment, after a proper adaptation of the ultrasound set up. The system will also be useful to allow for the testing of different effects between LICUS and LIPUS efficacy using the same frequencies and exposition time, both alone and in combination with the use of small molecules and antibody fragments, which allow precise tumor penetration and can be easily administered both for therapeutic and diagnostic purposes [
12,
19,
20,
21]. The latter opens the way for a combined pharmacological approach to PDAC treatment.


 ,
, 


