Article

Thermoluminescence Sensitization of Phyllite Natural Rock

1
Department of Physics, College of Science, Princess Nourah bint Abdulrahman University, P.O. Box 84428, Riyadh 11671, Saudi Arabia
2
Department of Physics, Faculty of Science, Isra University, Amman 11622, Jordan
3
Department of Nuclear Medicine Research, Institute for Research and Medical Consultations (IRMC), Imam Abdulrahman Bin Faisal University (IAU), P.O. Box 1982, Dammam 31441, Saudi Arabia
*
Author to whom correspondence should be addressed.
Appl. Sci. 2022, 12(2), 637; https://doi.org/10.3390/app12020637
Submission received: 26 November 2021 / Revised: 16 December 2021 / Accepted: 6 January 2022 / Published: 10 January 2022
(This article belongs to the Special Issue Advances in Stone, Clay, Glass, Epoxy and Concrete)

Abstract

:
A sensitization procedure is used to enhance the thermoluminescence (TL) sensitivity of phyllite to emit radiation. Phyllite is a type of foliated metamorphic rock made from slate. This study examines naturally grown phyllite rock, which had not been previously studied. Using a Thermo 3500 manual reader, the TL sensitivity of phyllite as a function of dosage was measured. The doses required to perform this study were administered using a 60Co source. The statistical regression test of the data had a significance level of p < 0.05. The study also included thermal and pre-dose effects. Using the sensitization procedure, the nonlinearity in TL dose–response was removed, and the sensitivity was increased 44 times that of its original value. The fading study showed a dependence on the test dose. According to the obtained results, the combination of linear dose–response and high sensitivity to gamma radiation makes phyllite an important rock for dating and retrospective dosimetry.

1. Introduction

Sensitization is known as the increased luminescence response of a material as a result of a certain test dose after thermal activation [1,2,3,4,5]. Two methods are used to produce sensitization: One is to irradiate the specimen with a high dose and after that treat it thermally to an activation temperature [6,7], while the other is to anneal the sample at high temperature [8]. The first method of sensitization is called the pre-dose effect [9]. This method of sensitization is extensively used in authenticity testing of natural materials and other fields [10]. Others use the optimum particle size [11]. Over time, many models have been proposed to explain the phenomena of sensitization [5,12]. Thermal sensitization is obtained by annealing the investigated sample at higher temperatures. Thermal treatments of the investigated sample at higher temperature leads to the removal of competitors and, consequently, alterations of the recombination centers at these temperatures [13,14]. Thus, high-temperature annealing creates additional recombination centers (L) and, as a result, increases the number of holes that are captured during subsequent irradiation cycles, which improves sensitivity [12,15]. Attempts were made to elucidate the tendency of mixing up these forms of sensitization [16]. The thermal sensitization method is the main form of sensitization in unheated samples, while the pre-dose method is the prominent effect of the sensitization of annealed samples [15]. Doping is also another important factor affecting TL sensitization [17]. Additionally, the thermal history of a material, which includes the heating conditions, has also a significant bearing on its luminescence characteristics [12,18,19]. The sensitization method was also investigated for synthetic materials [20].
It has been previously reported that the TL dose responses of some natural materials are sublinear, for example, dolomite, calcite, and tuff, while a few are superlinear, such as amethyst quartz [10] and feldspar. In the present study, we report for the first time sensitization studies of naturally grown phyllite material, which is not similar to any previous reports of natural materials [4,11,18,19,20,21,22].
Other natural materials were studied, including quartz [7], mica [21,22,23], blue calcite [24], and calcitic limestone [13]. For example, Kaur et al. [23] studied the sensitization characteristics of the 180 °C thermoluminescence peak of muscovite mica. They investigated the relationship between the sensitization factor and the pre-dose and duration of heat treatment. Soliman [22] was reported the effect of pre-dose on the natural white mica. The author found that a pre-dose of 1 kGy of gamma-radiation, followed by thermal activation to 550 °C of fired mica, causes a notable increase in TL sensitivity. Hashimoto et al. [14] investigated TL properties for natural quartzes using IPDA and TLCI methods. They found a change in color from original blue to red in a Z-cut slice of Madagascar quartz due to the annealing (at about 1000 °C). David et al. [24] studied the TL for quartz and found that the TL response of the quartz is improved by 2–3 orders when the specimen received a pre-gamma exposure of about 10/sup 7/R.
The main aim of the present investigation is to study the sensitization resulting from both thermal activation and a pre-dose of 250 °C TL peak. A focus on the competitor deep electron traps far from thermal quenching effects was identified by experimental glow curve deconvolutions. The pre-doses (0.1–1.75 kGy) used in this study, and the dose–response ranges (0.1–1000 Gy) are much wider than those in previous reports.

2. Materials and Methods

2.1. Materials

Phyllite is a type of foliated metamorphic rock made from slate. Primarily, phyllite consists of quartz, sericite phyllite, and chlorite. The chemical composition including trace elements of phyllite is shown as weight percentage in Table 1.

2.2. Methods

2.2.1. Sample Preparation Grinding

Using a mechanical ball mortar, the phyllite sample was ground for approximately 20 min. To choose the appropriate particle diameter (100 µm), the obtained powder was transferred to a separator instrument.

2.2.2. Remove Magnetic Grains

To remove any magnetic traces existing in the obtained phyllite powder, a Franz magnetic separator was used.

2.2.3. Chemical Treatment

Carbonates and fine grains were also removed from the phyllite powder using chemical treatment, in which the phyllite powder was immersed in 1 N HCl and 30% H2O2 for 2 h and then deflocculated using 0.01 N sodium oxalate.

2.2.4. TL Measurements

Using the instrument thermo3500 manual reader, the TL spectra (glow curves) were measured at temperatures ranging from 20–22 °C to 400 °C. The obtained TL glow curves were measured utilizing a blue filter. This filter has a good capacity for excluding light with wavelengths longer than 500 nm, including those in the infrared region. All TL glow curves were measured during linear heating rate (increase) of order 5 °C/s. To remove any fluctuation from the TL glow curve, an average procedure was adopted. In this procedure, TL glow curves were measured many times (more than 5 times) with several aliquots of phyllite powder. To eliminate any likelihood of oxidation of phyllite powder, all heat treatments were performed in quartz vials using a calibrated programmable oven.

2.2.5. Gamma Irradiations

In this investigation, the required irradiation doses were obtained using a 60Co source with a dose rate of 0.883 centigray/s (cGy/s) and the activity of order 4.19 × 10¹³ Bq·g−1; exposed doses varied between 100 mGy and 1000 Gy.

2.2.6. Statistical Test

Using Glow Fit deconvolution and the TLanal programs, the presentation and analysis of the experimental data were conducted. In addition, these programs were also used for the deconvolution analysis of the glow curve.

3. Results and Discussion

3.1. TL Glow Curve

In the absence of any effect of external laboratory irradiation doses and at relatively elevated temperature, the TL signals of the as-received phyllite demonstrate doses accumulation behavior. For a second readout, the signals background for the sample and reader were measured. The TL glow curve of the as-received phyllite sample is almost constant with little intensity variation. When the phyllite sample was heated (with a linear rate of order 5 °C/s) from room temperature up to 400 °C, the glow curves approach only a single peak, observed at 250 °C (Figure 1). This behavior can be explained based on the trap centers that exist in the as-received sample. The natural sample (phyllite) contains trap centers that are empty at low and room temperatures. These centers are empty because fading behavior was observed during the transition from low temperature to room temperature. In addition, the TL signals measured from the as-received specimen are mainly ascribed to two parts—the first is due to self-irradiation, and the second is a result of irradiation acquired from the surrounding environment.

3.2. Sensitization

To empty the deep traps that exist in the investigated material (phyllite), the powder was maintained at a fixed temperature (900 °C) for approximately 8 h; subsequently, Fleming’s sensitization technique31 was applied. The basic of the sensitization process is summarized in the following steps:
Step 1: Pre-dose sensitization;
Step 2: Thermal sensitization.

3.3. Pre-Dose Sensitization

In the present investigation, the qualitative explanation suggested by Zimmerman was adopted in which a pre-dose heating treatment is given to the investigated sample. This treatment populates the reservoir centers with more holes. Consequently, these holes will relax to populate the centers responsible for emitting TL peaks. As the population of the recombination centers increases, the intensity of the TL glow peak is obviously enhanced. The physical mechanism underlying the per-dose sensitization can be qualitatively understood based on the effective regrouping of the occupancy level of various luminescent centers. Actually, regrouping of the luminescent centers enhances the charge relation responsible for producing the observed TL peak.
The following steps show the procedure adopted for the activation dose protocol:
(a) Aliquots were kept at 900 °C for 8 h; subsequently, the aliquots were given a test dose of 1 Gy (from this step, we aimed to find S0);
(b) The preceding series of aliquots were given a single pre-dose of γ-radiation varying between 0.1 kGy and 1.75 kGy;
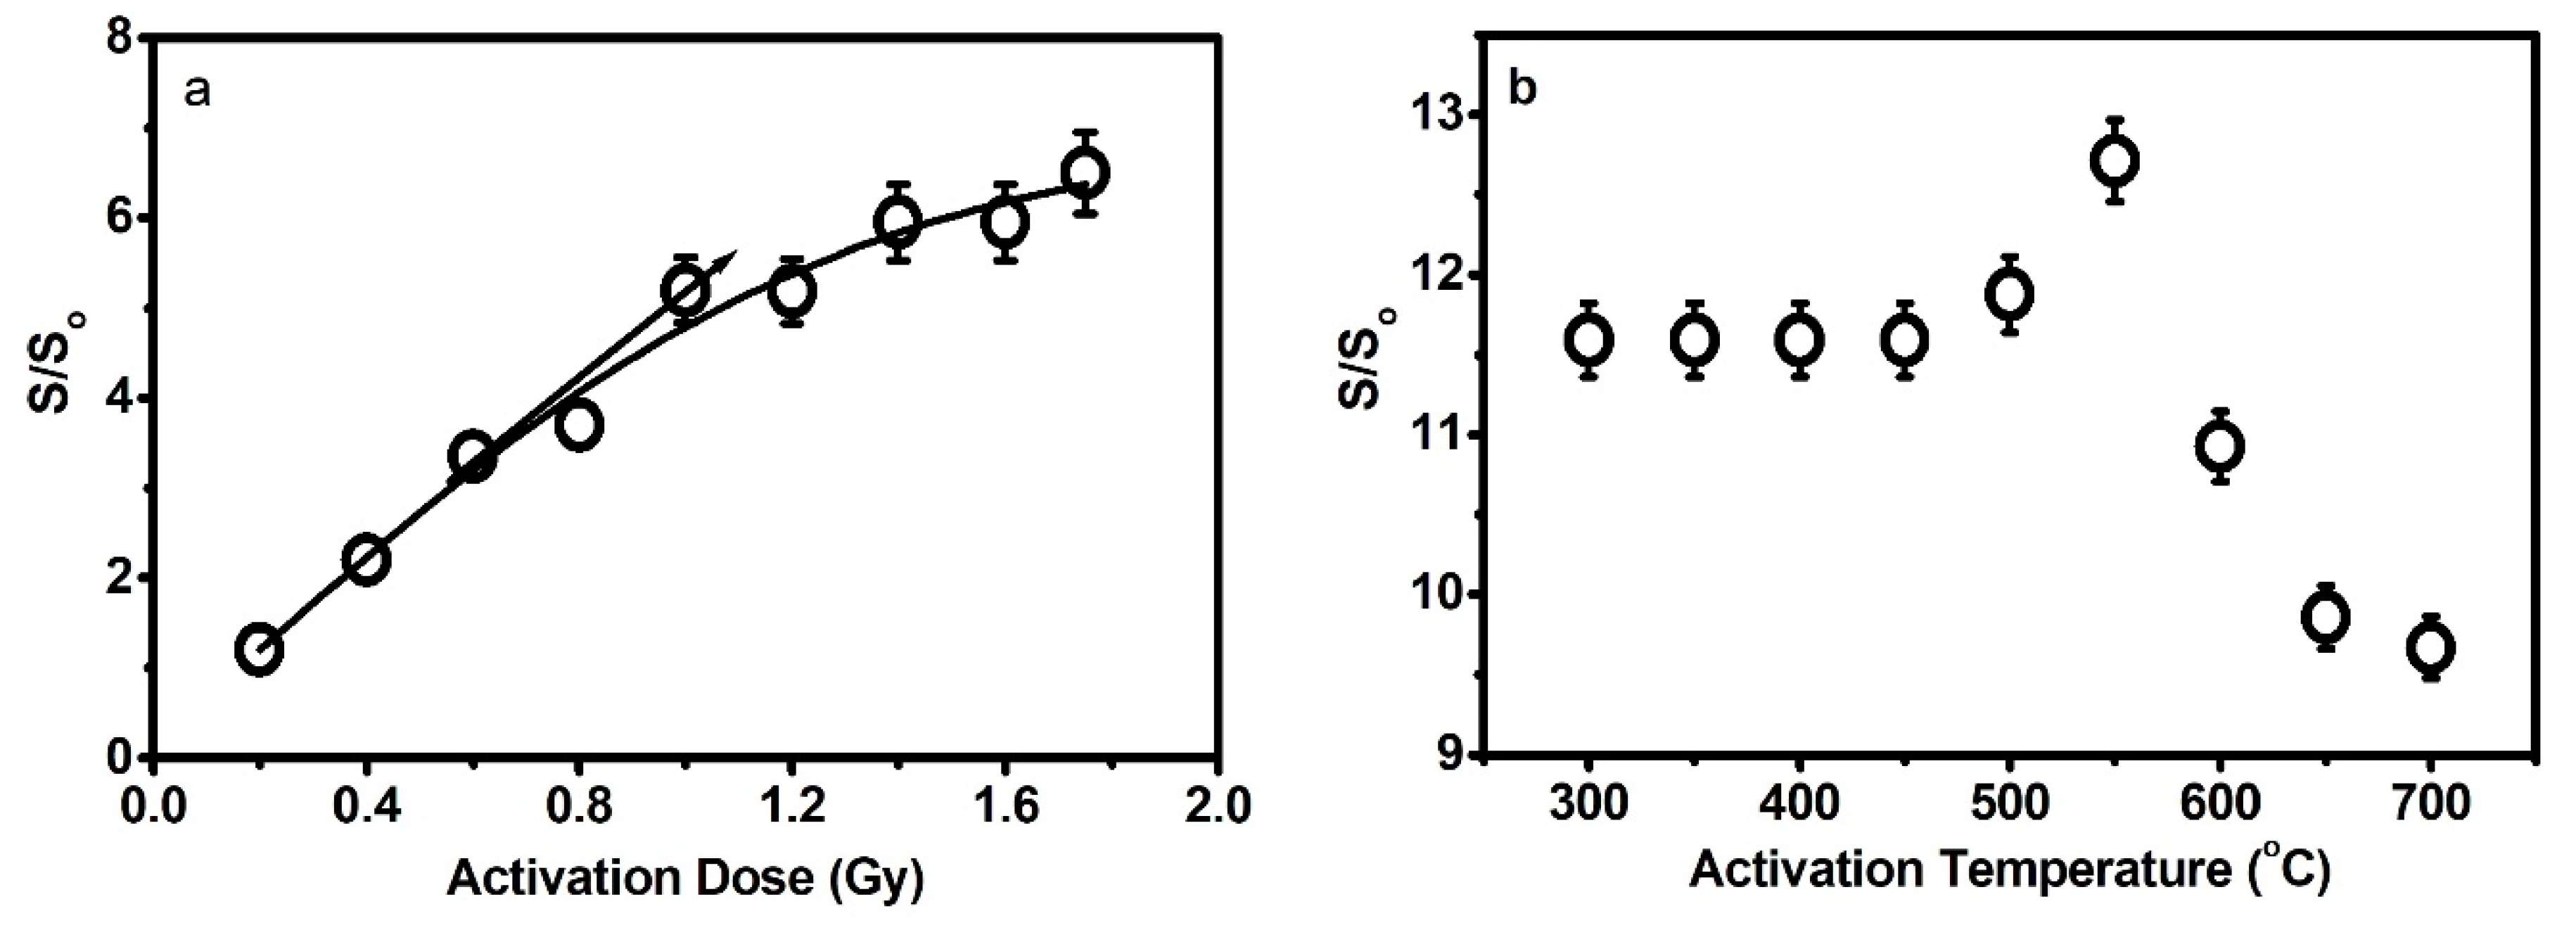
(c) After the first two steps, all the aliquots were heated to 500 °C, and (d) when cooled, a test dose (1 Gy) was given to the aforementioned heated aliquots that had sensitivity S. from these four steps we abled to report S/S0.
As shown in Figure 2a, in the beginning, the variation of the sensitivity is linear, but finally, near saturation of the pre-dose effect, a turnover is observed. This behavior occurs approximately at a dose with a value of 1.1 kGy of the applied pre-dose.
Thermal sensitization: The thermal activation characteristic (TAC) was measured according to the following steps:
Step 1. The aliquots (of the same weights) were kept at 900 °C for about 8 h, and then, an optimum pre-dose of 1 kGy were given such aliquots;
Step 2. After finishing the previous step, these aliquots were heated in the range starting at 300 °C and ending at 700 °C;
Step 3. After the aliquots were cooled, 1 Gy dose was applied to determine the parameter S. The S/S0 was then computed at several temperatures (between 300 °C and 700 °C) (Figure 2b). For the investigated material (phyllite), 550 °C was found to be the optimal activation temperature, meaning that the maximum charge carrier concentration was reached.
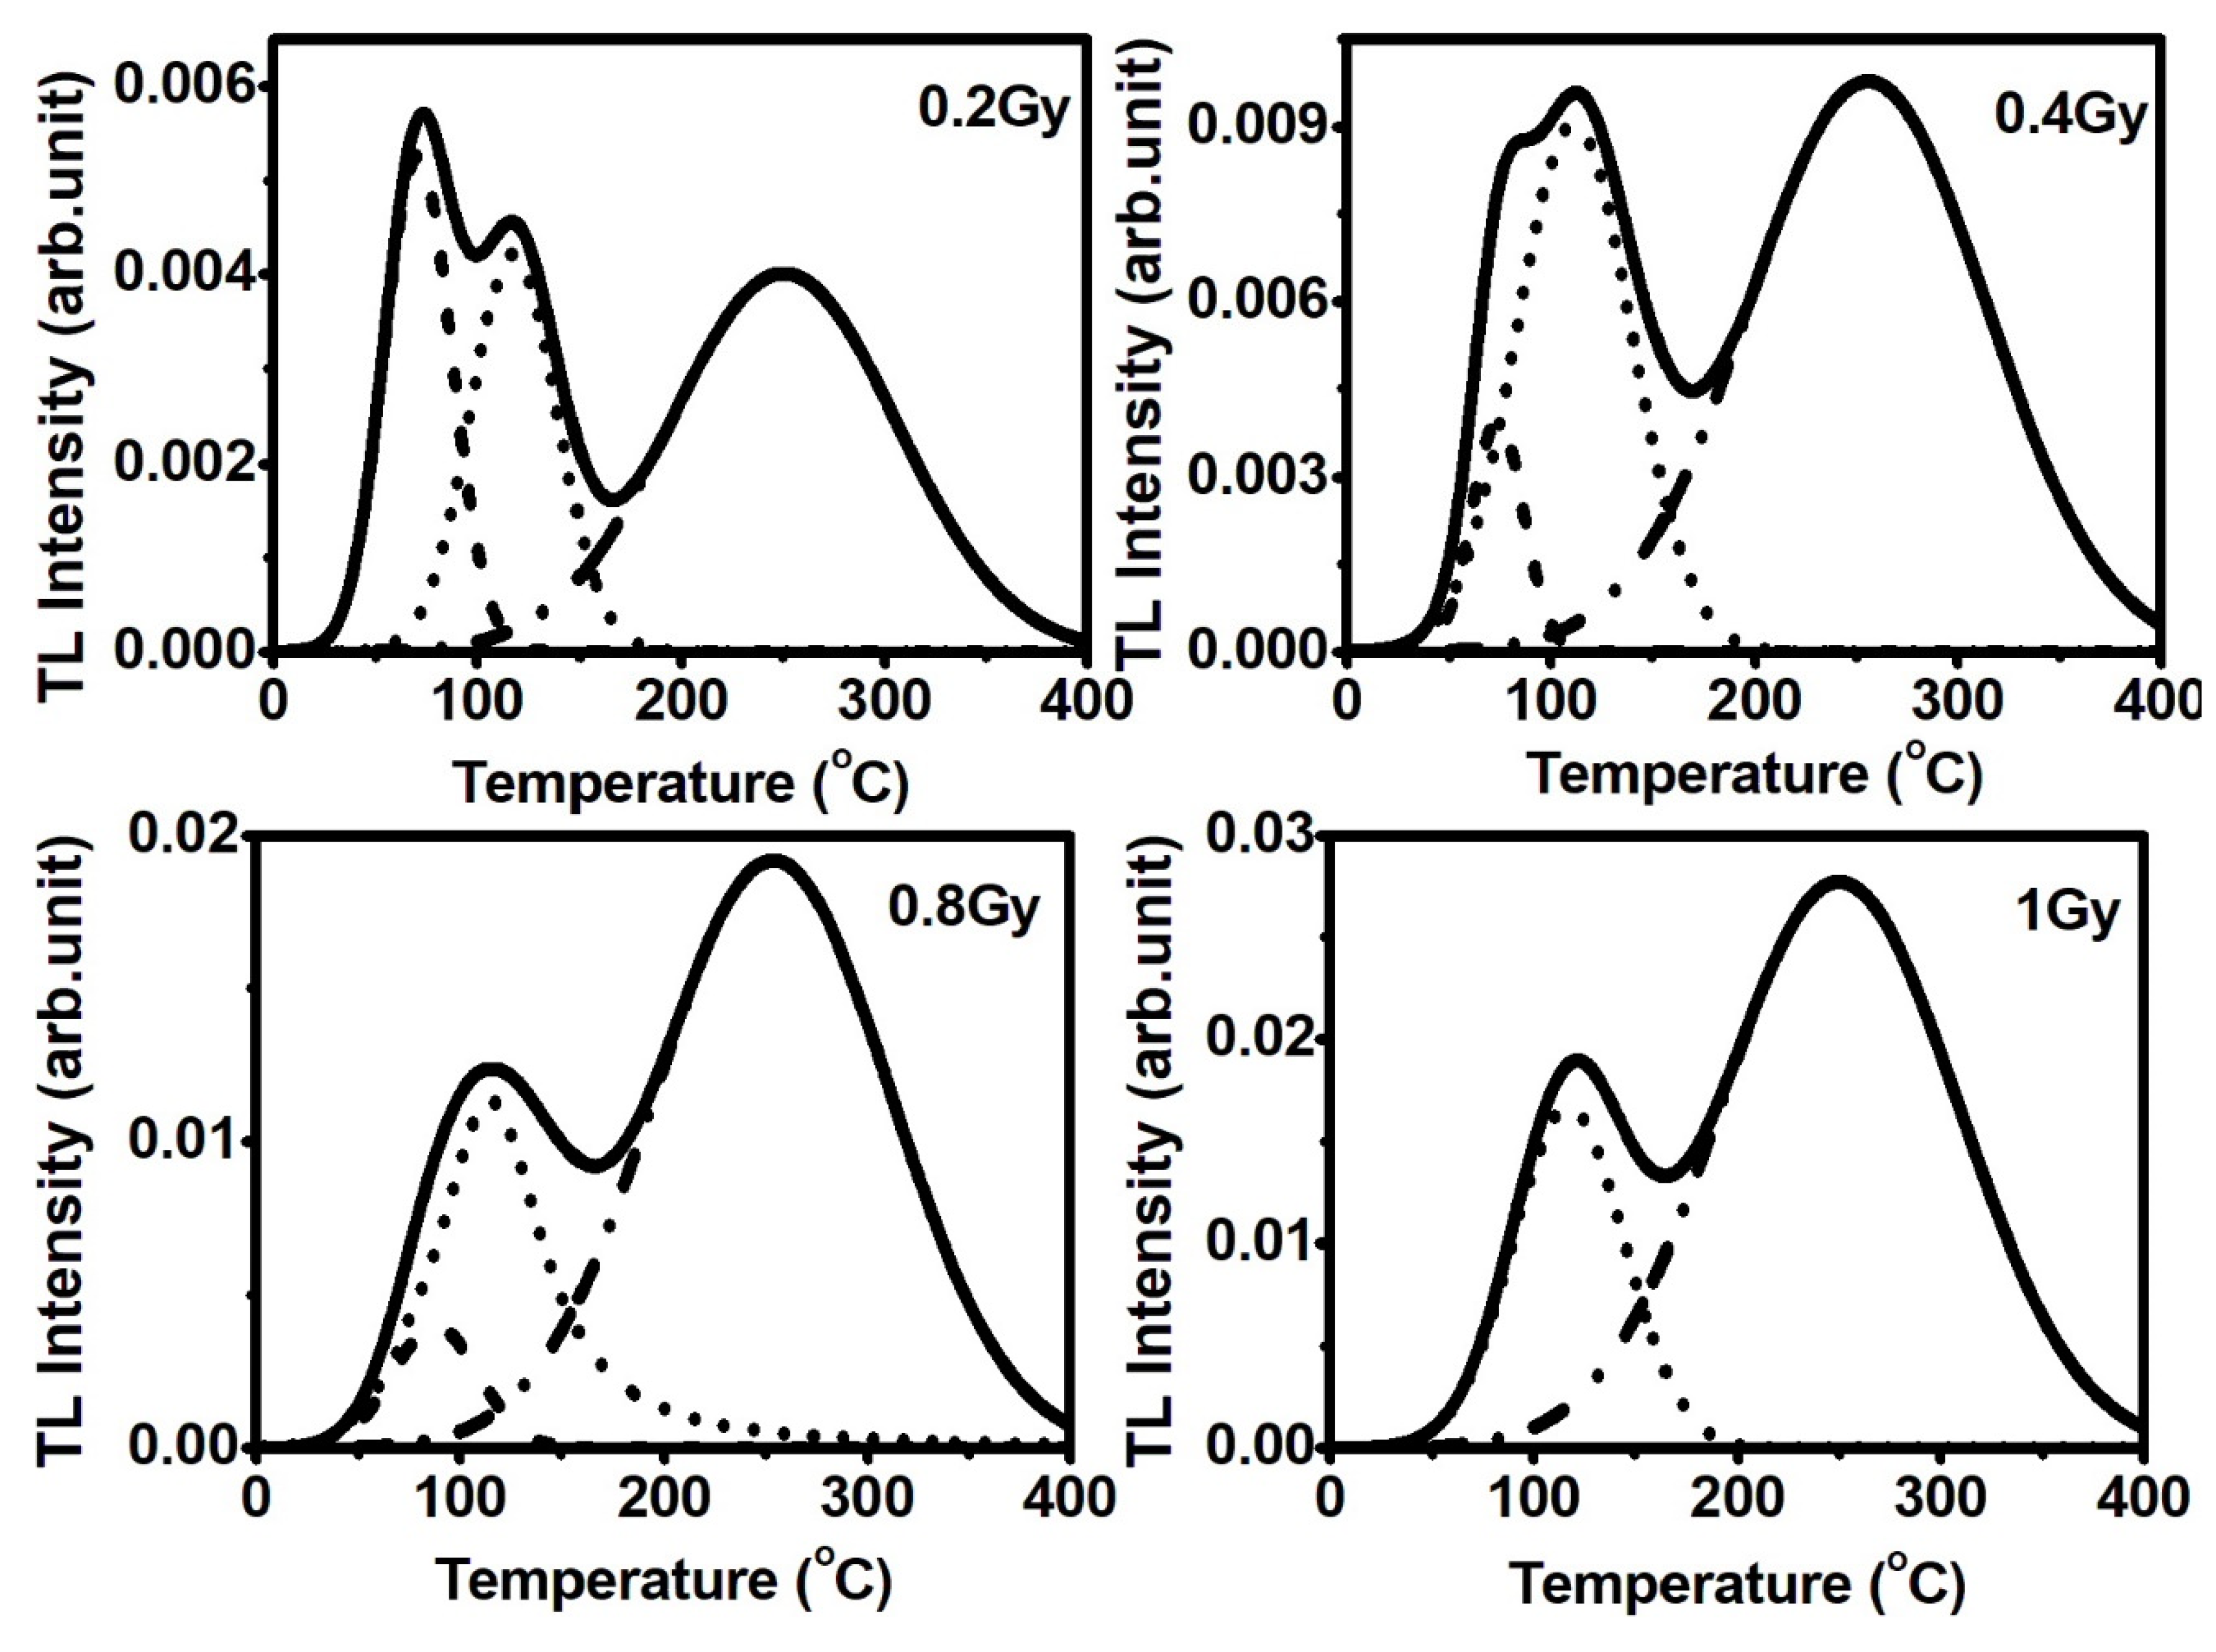
As is shown in Figure 2b, a clear increase in sensitivity is observed. At high temperatures, the thermal deactivation observed is explained using Goedicke’s model, in which the second electron trap (T2) is thermally connected. Accordingly, the electrons existing in T2 are thermally transferred into the conduction band, and the drop in sensitivity occurring above a certain temperature is attributed to the radiative recombination of the relaxed electrons moving away from T2 with trapped holes. As depicted in Figure 3, the pre-dosed glow curves have three distinct peaks, observed at 75 °C, 115 °C, and 250 °C, respectively. The low-temperature peaks shown at 75 °C and 115 °C are thermally unstable. With an increase in pre-dose, they disappear, and a new peak is observed at 120 °C. The new peak is explained by the phenomenon of destruction and filling of different traps during the irradiation process.
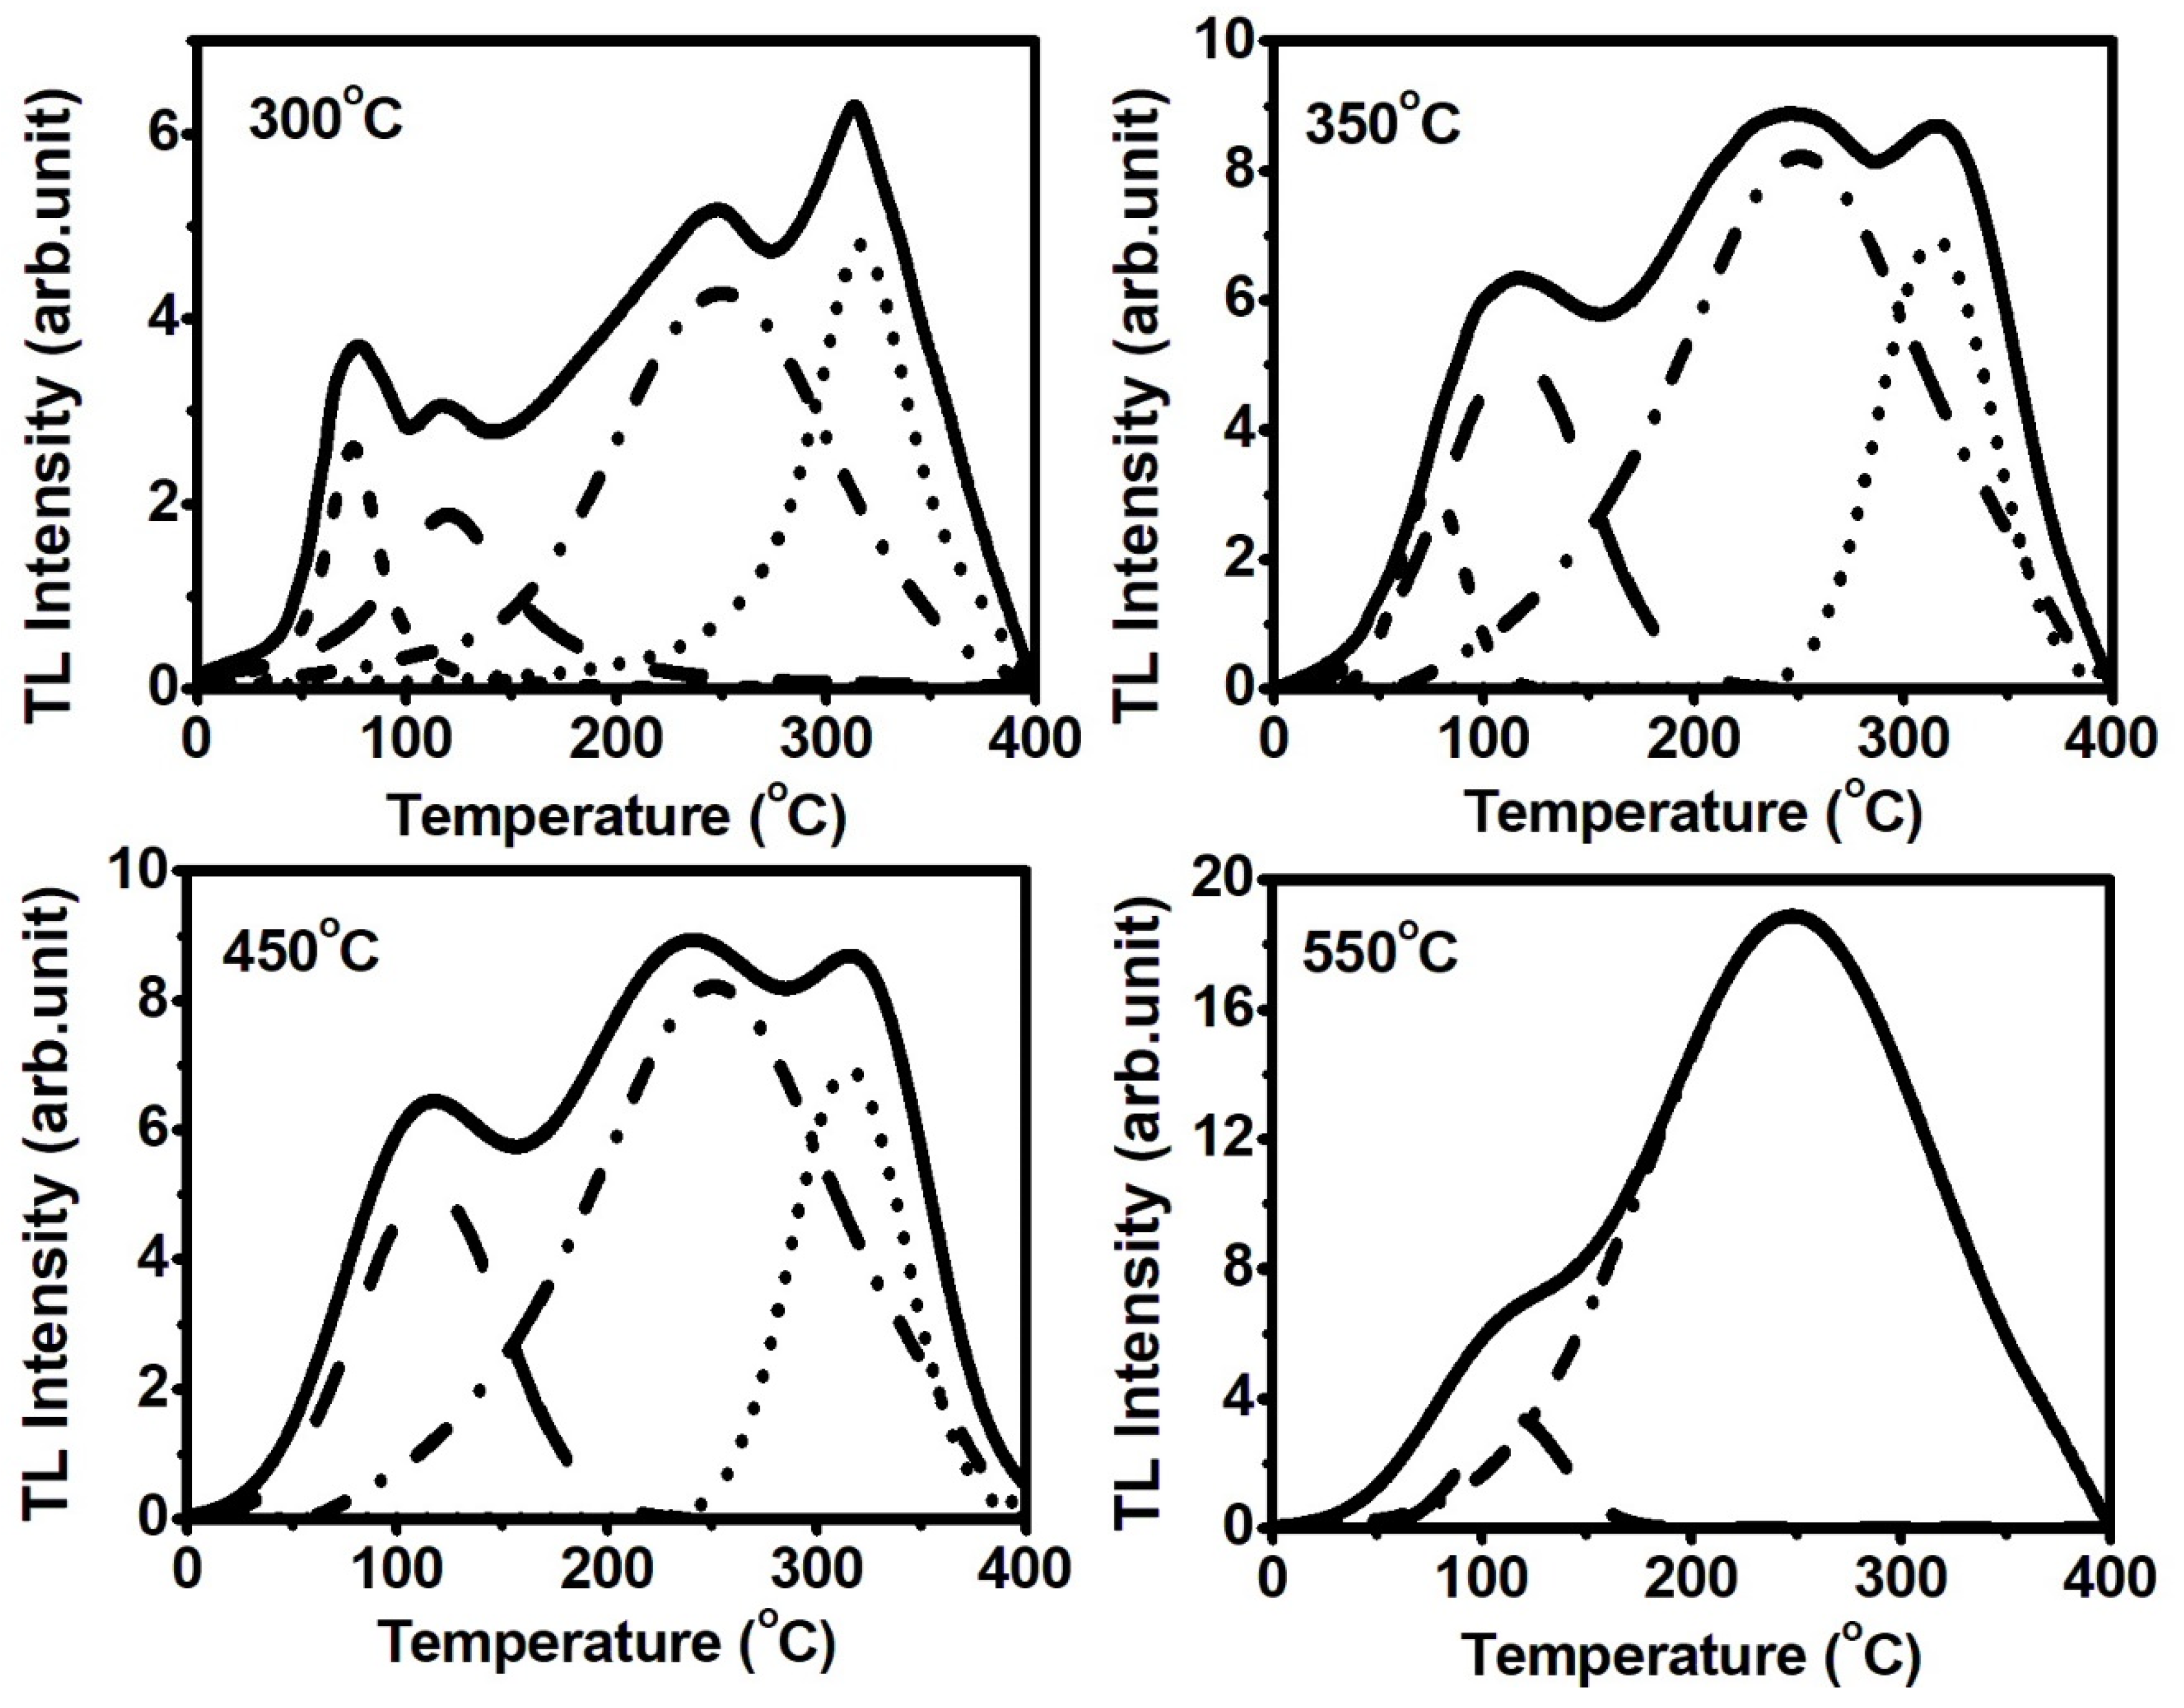
In addition, as depicted in the glow curves, those that annealed at low temperatures 300–500 °C (Figure 4) have a new high-temperature peak at 315 °C, which completely disappears at higher temperatures. According to the Goedicke model, this peak is a competitor, and it is thermally linked to high temperatures ranging from 550 °C to 700 °C. Qualitatively, the peak observed at 315 °C may be attributed to the thermally displaced electrons into the conduction band of phyllite. The creation of thermal electrons may cause a reduction in sensitivity at temperatures greater than 550 °C, and consequently, radiative recombination of the relaxed electrons with the trapped holes occurs. Mixing the pre-dose with thermal sensitization increases S/S0 by values that depend on the test dose, that is, for a test dose of 1 Gy, the ratio S/S0 is found to have a value about 13 ± 0.33. Following Zimmermans argument, the extra holes concentration existing at the luminescence center is the direct cause for the higher response to a subsequent test dose. However, Chen [5] highlighted the observation that the finally measured TL is proportional to the filling of L level, and there is a linear dependence on the value of the test dose. Sensitization effects are clearly observed when reservoir R shows saturation effects. Fleming and David et al. [24] argued that the initial use of a high test dose may mean that part of the effect is due to the combination of irradiation plus heating. Therefore, the present results could be explained on the basis of defect creation (vacancies) in the crystal structure of the investigated material.
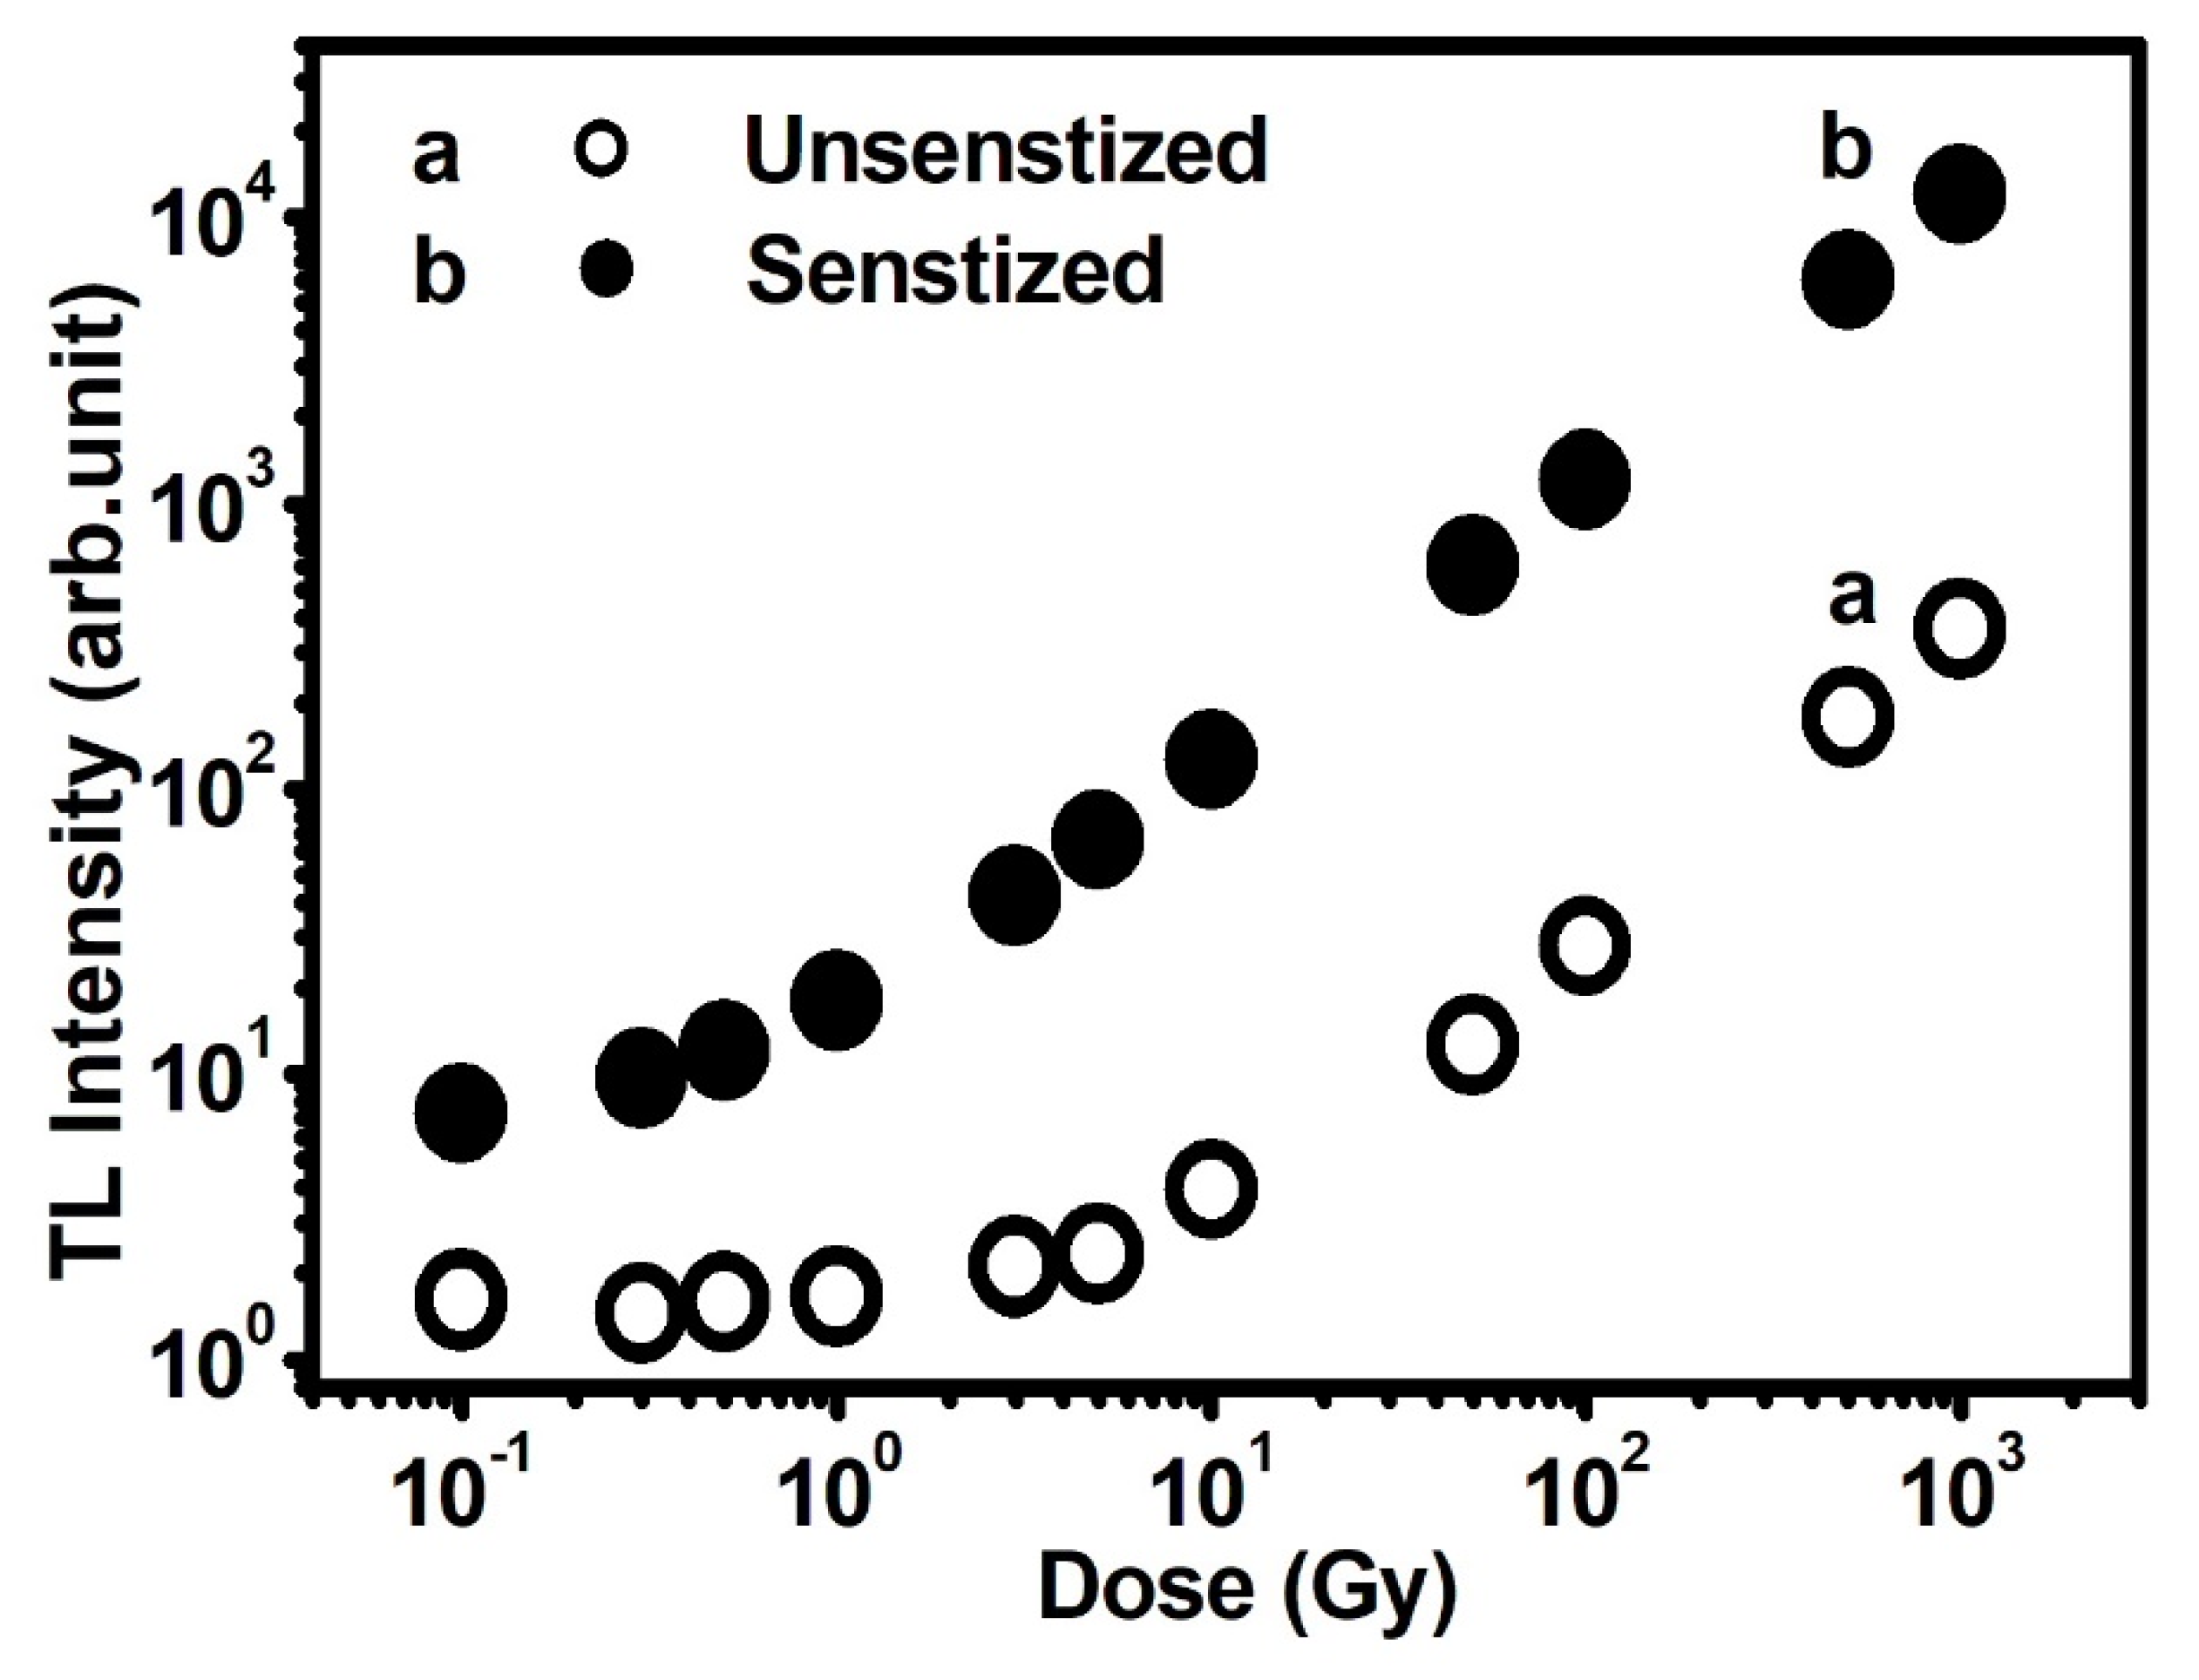
Growth curves: for an unsensitized phyllite sample, the dose–response of the TL (Figure 5a) had two ranges of variation with two different slopes:
(1)
Linear behavior (y = 301.88 + 35.103x) in which the linear change covers the dose range 0.1–5 Gy. The linearity index has an average value of 0.9539;
(2)
Superlinear behavior (y = 46.46x1.1) in which the superlinear change is in the dose range > 5–103 Gy.
In the previous equations (linear and superlinear), y represents the TL intensity per gm, and x is the given dose in Gy.
As shown in Figure 5b, the linear dependence of the sensitized phyllite (y = 275.89 + 22.029x) in the dose range of 1 up to 103 Gy with the linearity index in the range 0.98 to 1.01 is presented.
The model suggested by Suntharalingam and Cameron is used to explain the results depicted in Figure 5a as follows:
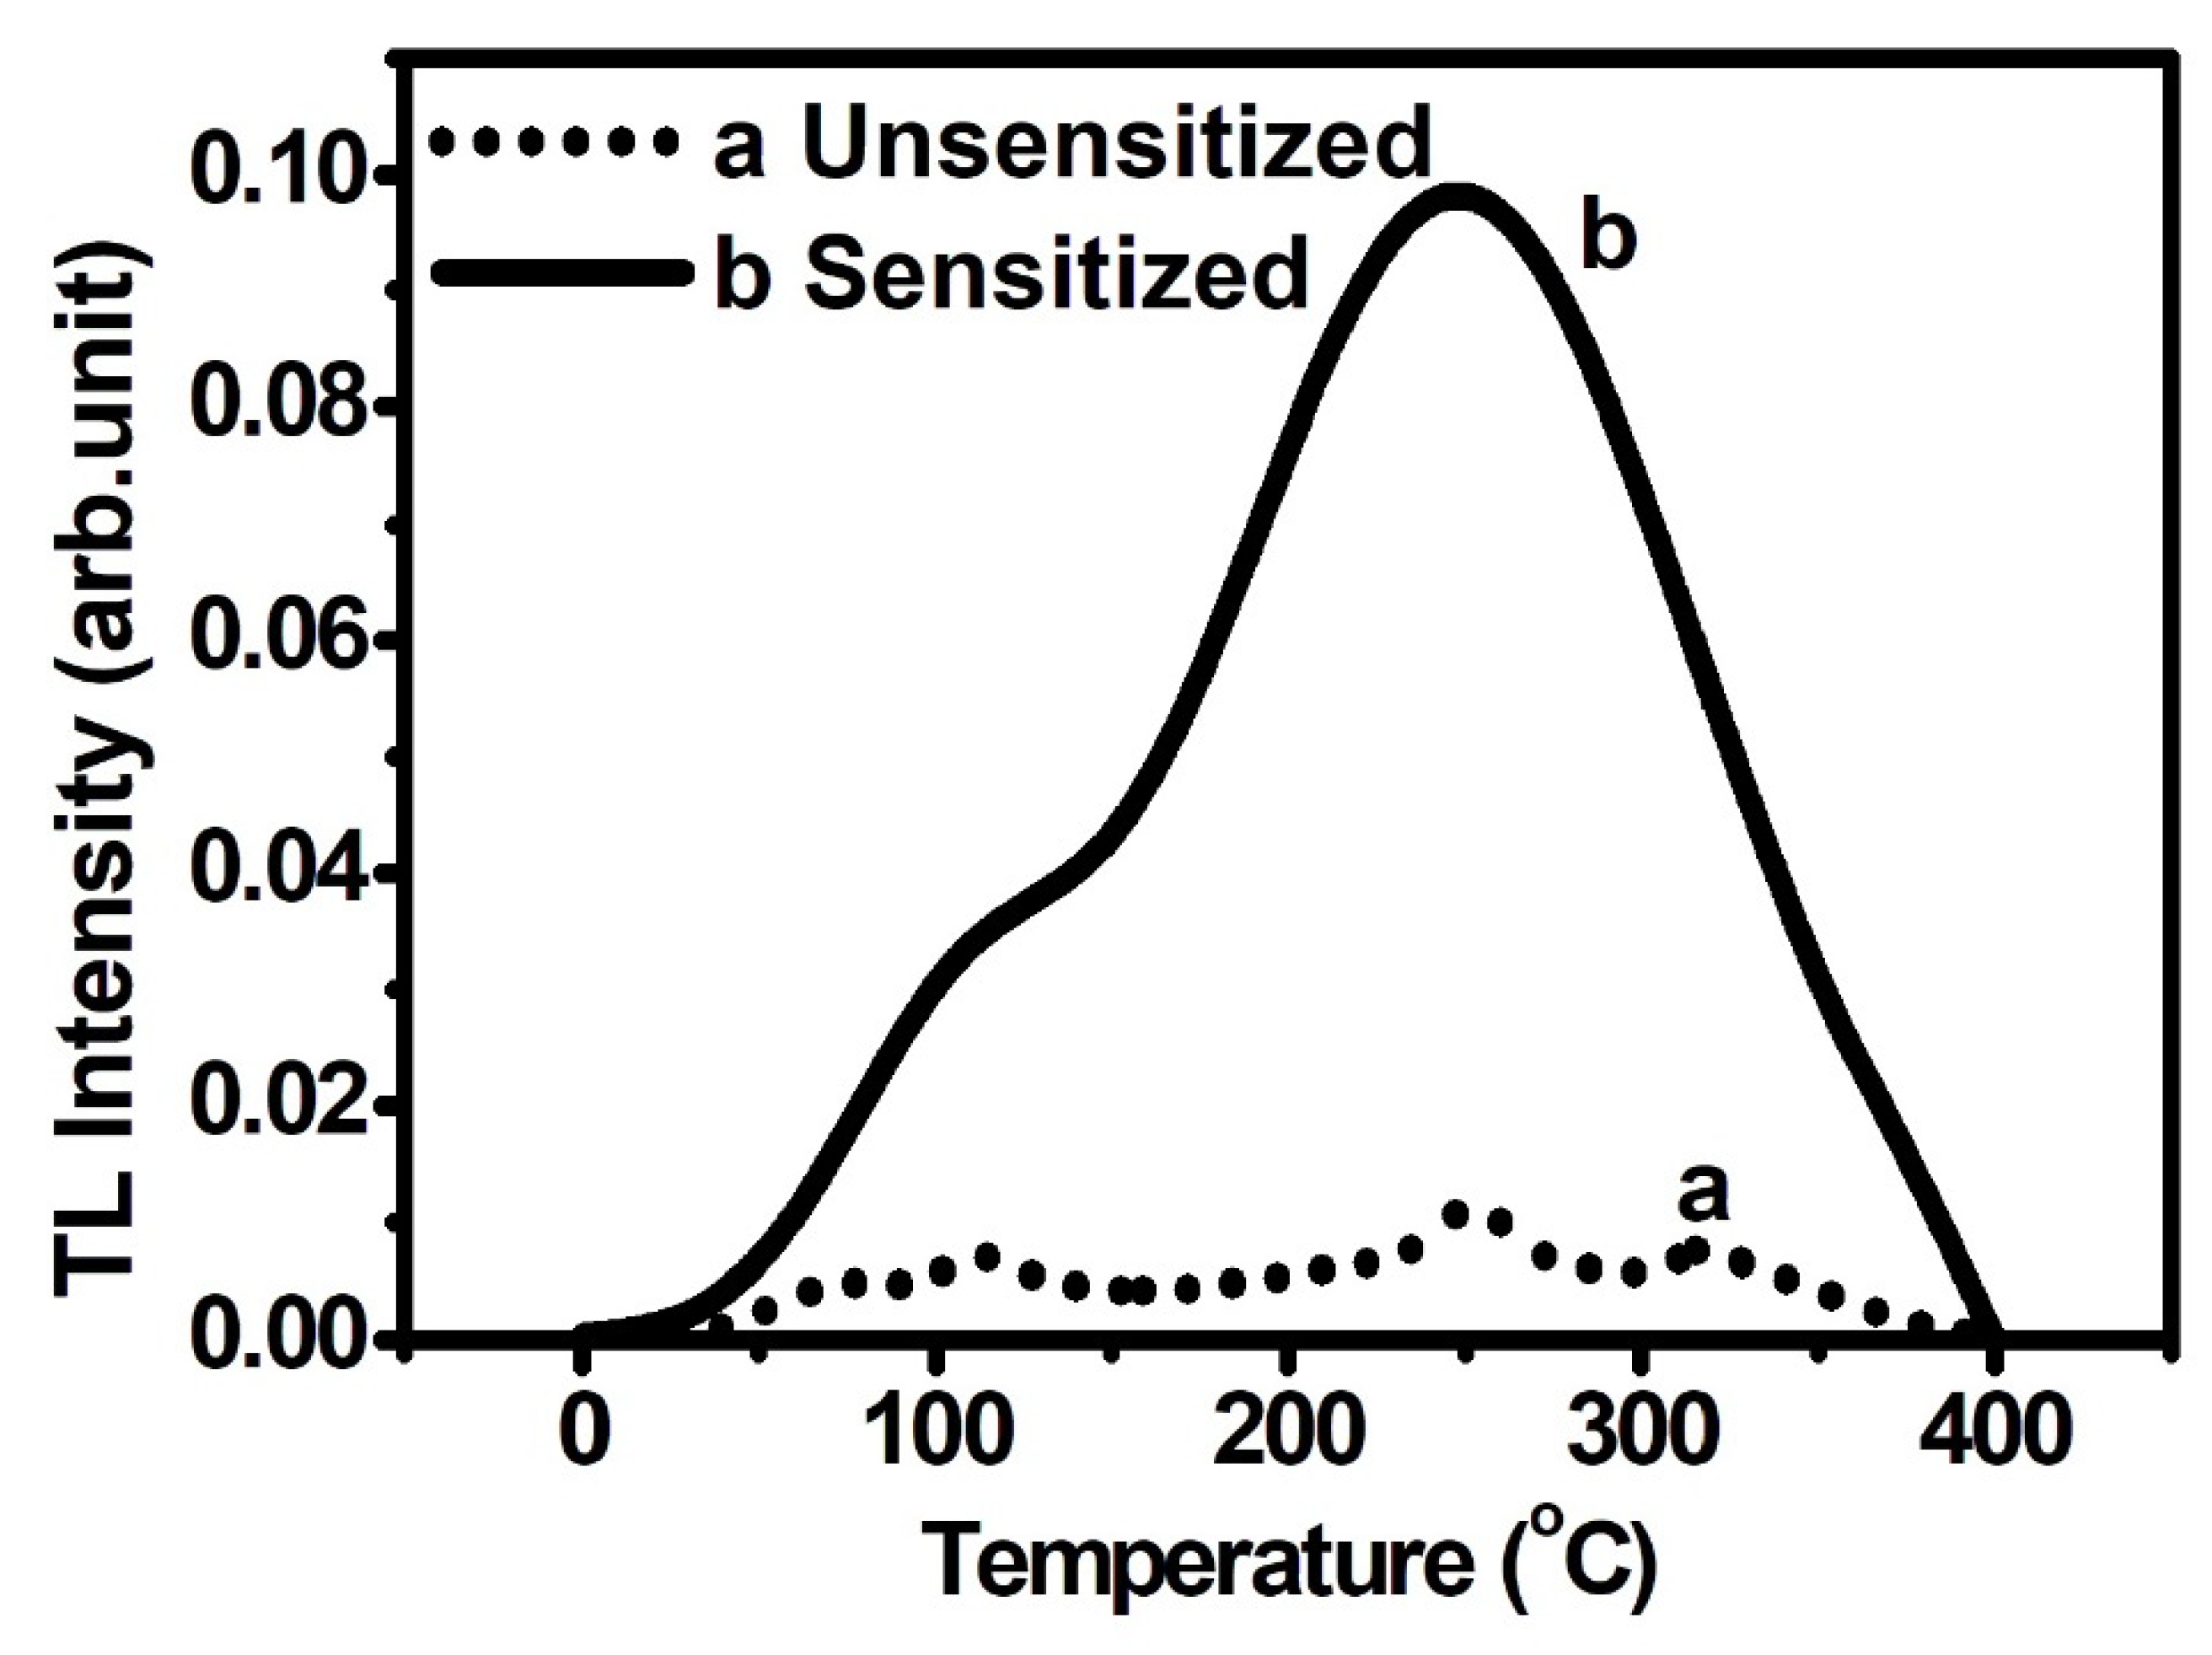
Figure 6 displays the glow curves of the unsensitized and sensitized phyllite. The unsensitized sample (Figure 6a) has 4 TL peaks observed at 75 °C, 115 °C, 250 °C, and 315 °C, respectively.
In the sensitized material, it was assumed that the peak that exists at 315 °C became thermally linked to the conduction band that exists at 550 °C, so its traps were emptied, as shown in Figure 6b.
The TL dose–response of the sensitized phyllite is linear, which is in agreement with previously published reports [21,22,23]. The pre-dose technique was quite suitable for heated samples such as phyllite; the same result was found and reported previously forquartz. In the literature, the effect of sensitization was studied for many purposes, such as to investigate the source of point defects, to measure the variation of responses between different aliquots of the same sample, and to infer the temperature at which the natural material was heated in the past. Leonardo et al. found that photo transfer thermoluminescence (PTTL) increased the sensitization effect, while prolonged blue light exposure decreased it.

4. Fading Study

The study of the fading behavior of an unusual collection of sensitized materials was performed. The studied aliquots were divided into two groups. The first group received a gamma dose irradiation, after which they were kept in dark throughout the measurement. The TL of several stored aliquots and several aliquots freshly irradiated with the same gamma dose was compared. In Figure 7, the fading data at different test-dose levels (0.5, 1, and 2 Gy) are depicted. For test doses covering the range 0.5 Gy to 2 Gy, the remnant TL is in the range of 0.98–0.94 after a storage period of 5 days. This enhancement in the fading rate with test dose is directly related to the increase in radiation damage.

5. Conclusions

The glow curve of natural phyllite was studied, which showed one TL peak observed at 250 °C. The sensitization procedure adopted induced three additional defect peaks found at 75 °C, 115 °C, and 315 °C, respectively. A pre-dose of 1 kGy, followed by heating to 550 °C of heated phyllite, caused a large increase in the TL sensitivity (S/S0). The pre-dose increased the S/S0 by a factor of five, while the combination of the pre-dose with thermal sensitization increased the S/S0 for a test dose of 1 Gy to 13 ± 0.33.
The sensitization effect increased sensitivity by 44 fold for the test dose of 1000 Gy and also removed the superlinear behavior observed in the dose–response curve. The enhancement in the fading rate with test dose is attributed to the increase in radiation damage.
Competition between irradiation and thermally linked trap models was used to discuss the TL results. Material science technology will benefit from applying radiation dosimetry techniques for this type of material. Further investigation of the dependence of phototransfer effects upon sensitization is required. In addition, the effects of different radiations and annealing temperature on the TL spectra of the investigated material are also necessary. For test doses covering the range 0.5 Gy to 2 Gy, the remnant TL is in the range of 0.98–0.94, after a storage period of 5 days. This enhancement in the fading rate with test dose is directly related to the increase in radiation damage.

Author Contributions

E.A. suggested areas of interest, planned the work, and wrote the manuscript. A.H.A. prepared the samples, measured the thermal activation, and performed the calculations. N.A. measured the pre-dose effects, assessed the dose–response, and performed the calculations. M.I.S. supervised and reviewed the draft. All authors have read and agreed to the published version of the manuscript.

Funding

This research was funded by Deanship of Scientific Research at Princess Nourah bint Abdulrahman University. (Grant No. 38/S/232).

Institutional Review Board Statement

Not applicable.

Informed Consent Statement

Not applicable.

Data Availability Statement

All of the relevant data are within this paper.

Conflicts of Interest

The authors have no competing interests.

References

  1. Mateus, F.D.C.; Asfora, V.K.; Guzzo, P.L.; Barros, V.S. Investigation of the spectrally resolved TL signals of natural quartz single crystals sensitized by high-dose of gamma-radiation and moderate heat-treatments. Nucl. Instrum. Methods Phys. Res. Sect. B 2021, 486, 37–47. [Google Scholar] [CrossRef]
  2. Wu, M.; Chen, W.; Liu, S.; Sun, Y.; Huang, L.; Chen, G.; Zheng, Z. Sensitizing effect of Nd3+ on Tb3+ activated ZrP2O7 long persistent phosphor materials. J. Rare Earths 2021, 39, 757–764. [Google Scholar] [CrossRef]
  3. Ye, K.; Yang, X.; Xiao, S. Improving red afterglow properties of CaZnGe2O6: Mn2+ by co-doping Bi3+. Optik 2021, 246, 167799. [Google Scholar] [CrossRef]
  4. Zimmerman, J. The radiation induced increase of thermoluminescence sensitivity of the dosimetry phosphor LiF (TLD-100). J. Phys. C Solid State Phys. 1971, 4, 3277–3291. [Google Scholar] [CrossRef]
  5. Chen, R. Saturation of sensitization of the 110 °C TL peak in quartz and its potential application in the pre-dose technique. Eur. PACT J. 1979, 3, 325–335. [Google Scholar]
  6. Bailiff, I.K. Per-dose technique. Radiat. Meas. 1994, 23, 471–479. [Google Scholar] [CrossRef]
  7. Khoury, H.J.; Guzzo, P.L.; Brito, S.B.; Hazin, C.A. Effect of high gamma doses on the sensitization of natural quartz used for thermoluminescencedosimetry. Radiat. Eff. Defects Solids 2007, 162, 101–107. [Google Scholar] [CrossRef]
  8. Ponnusamy, V.; Ramasamy, V.; Jose, M.T.; Anandalakshmi, K. Effect of annealing on natural calcitic crystals-A thermostimulated luminescence (TSL) study. J. Lumin. 2012, 132, 1063–1075. [Google Scholar] [CrossRef]
  9. Adamiec, G.; Bluszcz, A.; Bailey, R.; Garcia-Talavera, M. Finding model parameters genetic algorithms and the numerical modelling of quartz luminescence. Radiat. Meas. 2006, 41, 897–902. [Google Scholar] [CrossRef]
  10. Galli, A.; Martini, M.; Montanari, C.; Panzeri, L.; Sibila, E. TL of fine-grain samples from quartz-rich archaeological ceramics dosimetry using the 110 and 210 °C TL peaks. Radiat. Meas. 2006, 41, 1009–1013. [Google Scholar] [CrossRef]
  11. De Carvalho, Á.B., Jr.; Guzzo, P.L.; Sullasi, H.L.; Khoury, H.J. Effect of particle size in the TL response of natural quartz sensitized by high dose of gamma radiation and heat-treatments. Mater. Res. 2010, 13, 265–271. [Google Scholar] [CrossRef] [Green Version]
  12. Bøtter-Jensen, L.A.; Larsen, N.; Mejdahl, V.; Poolton, N.R.J.; Morris, M.F.; McKeever, S.W.S. Luminescence sensitivity changes in quartz as a result of annealing. Radiat. Meas. 1995, 24, 535–541. [Google Scholar] [CrossRef]
  13. McKeever, S.W.S.; Strain, J.A.; Townsend, P.D.; Udval, P. Effects of thermal cycling on the thermoluminescence and radioluminescence of quartz. PACT 1983, 9, 123–132. [Google Scholar]
  14. Hashimoto, T.; Sakaue, S.; Ichino, M. Dependence of TL-property changes of natural quartzes on aluminum contents accompanied by thermal annealing treatment. Radiat. Meas. 1994, 23, 293–299. [Google Scholar] [CrossRef]
  15. Oniya, E.O.; Polymeris, G.S.; Jibiri, N.N.; Tsirliganis, N.C.; Babalola, I.A.; Kitis, G. Contributions of pre-exposure dose and thermal activation in predosesensitizations of unfired and annealed quartz. Radiat. Phys. Chem. 2015, 110, 105–113. [Google Scholar] [CrossRef]
  16. Koul, D.K.; Polymeris, G.S.; Tsirliganis, N.C.; Kitis, G. Possibility of pure Thermal sensitisation in the pre-dose mechanism of the 110 °C TL peak of quartz. Nucl. Instrum. Methods Phys. Res. Sect. B 2010, 268, 493–498. [Google Scholar] [CrossRef]
  17. Maghrabi, M.; Arafah, D.E. Sensitization of the thermoluminescence response of CaF2 phosphors. Phys. Status Solidi (a) 2003, 195, 459–467. [Google Scholar] [CrossRef]
  18. Charitidis, C.; Kitis, G.; Furetta, C.; Charalambous, S. Superlinearity of synthetic quartz: Dependence on the firing temperature. Nucl. Instrum. Methods B 2000, 168, 404–410. [Google Scholar] [CrossRef]
  19. Roque, C.; Guibert, P.; Vartanian, E.; Vieillevigne, E.; Bechtel, F. Changes in luminescence properties induced by thermal treatments; a case-study at Sipan and Trujillo Moche sites (Peru). Radiat. Meas. 2004, 38, 119–126. [Google Scholar] [CrossRef]
  20. Farag, M.A.; Sadek, A.M.; Shousha, H.A.; El-Hagg, A.A.; Kitis, G. Radiation damage and sensitization effects on thermoluminescence of LiF: Mg, Ti (TLD-700). Nucl. Instrum. Methods Phys. Res. Sect. B 2017, 407, 180–190. [Google Scholar] [CrossRef]
  21. Soliman, C. Some luminescence properties of the blue emission band of muscovite. Radiat. Eff. Defects Solids 2003, 158, 667–673. [Google Scholar] [CrossRef]
  22. Soliman, C. The pre-dose effect in natural white mica (H2KAl3 (SiO4)3). Nucl. Instrum. Methods Phys. Res. Sect. B 2007, 263, 429–435. [Google Scholar] [CrossRef]
  23. Kaur, N.; Singh, L.; Singh, M.; Lochab, S.P. Pre-gamma dose thermoluminescence characteristics of muscovite mica. Nucl. Instrum. Methods Phys. Res. Sect. B 2017, 400, 1–10. [Google Scholar] [CrossRef]
  24. David, M.; Sunta, C.M.; Ganguly, A.K. Thermoluminescence of quartz: Part II—Sensitization by thermal treatment. Indian J. Pure Appl. Phys. 1977, 15, 277–280. [Google Scholar]
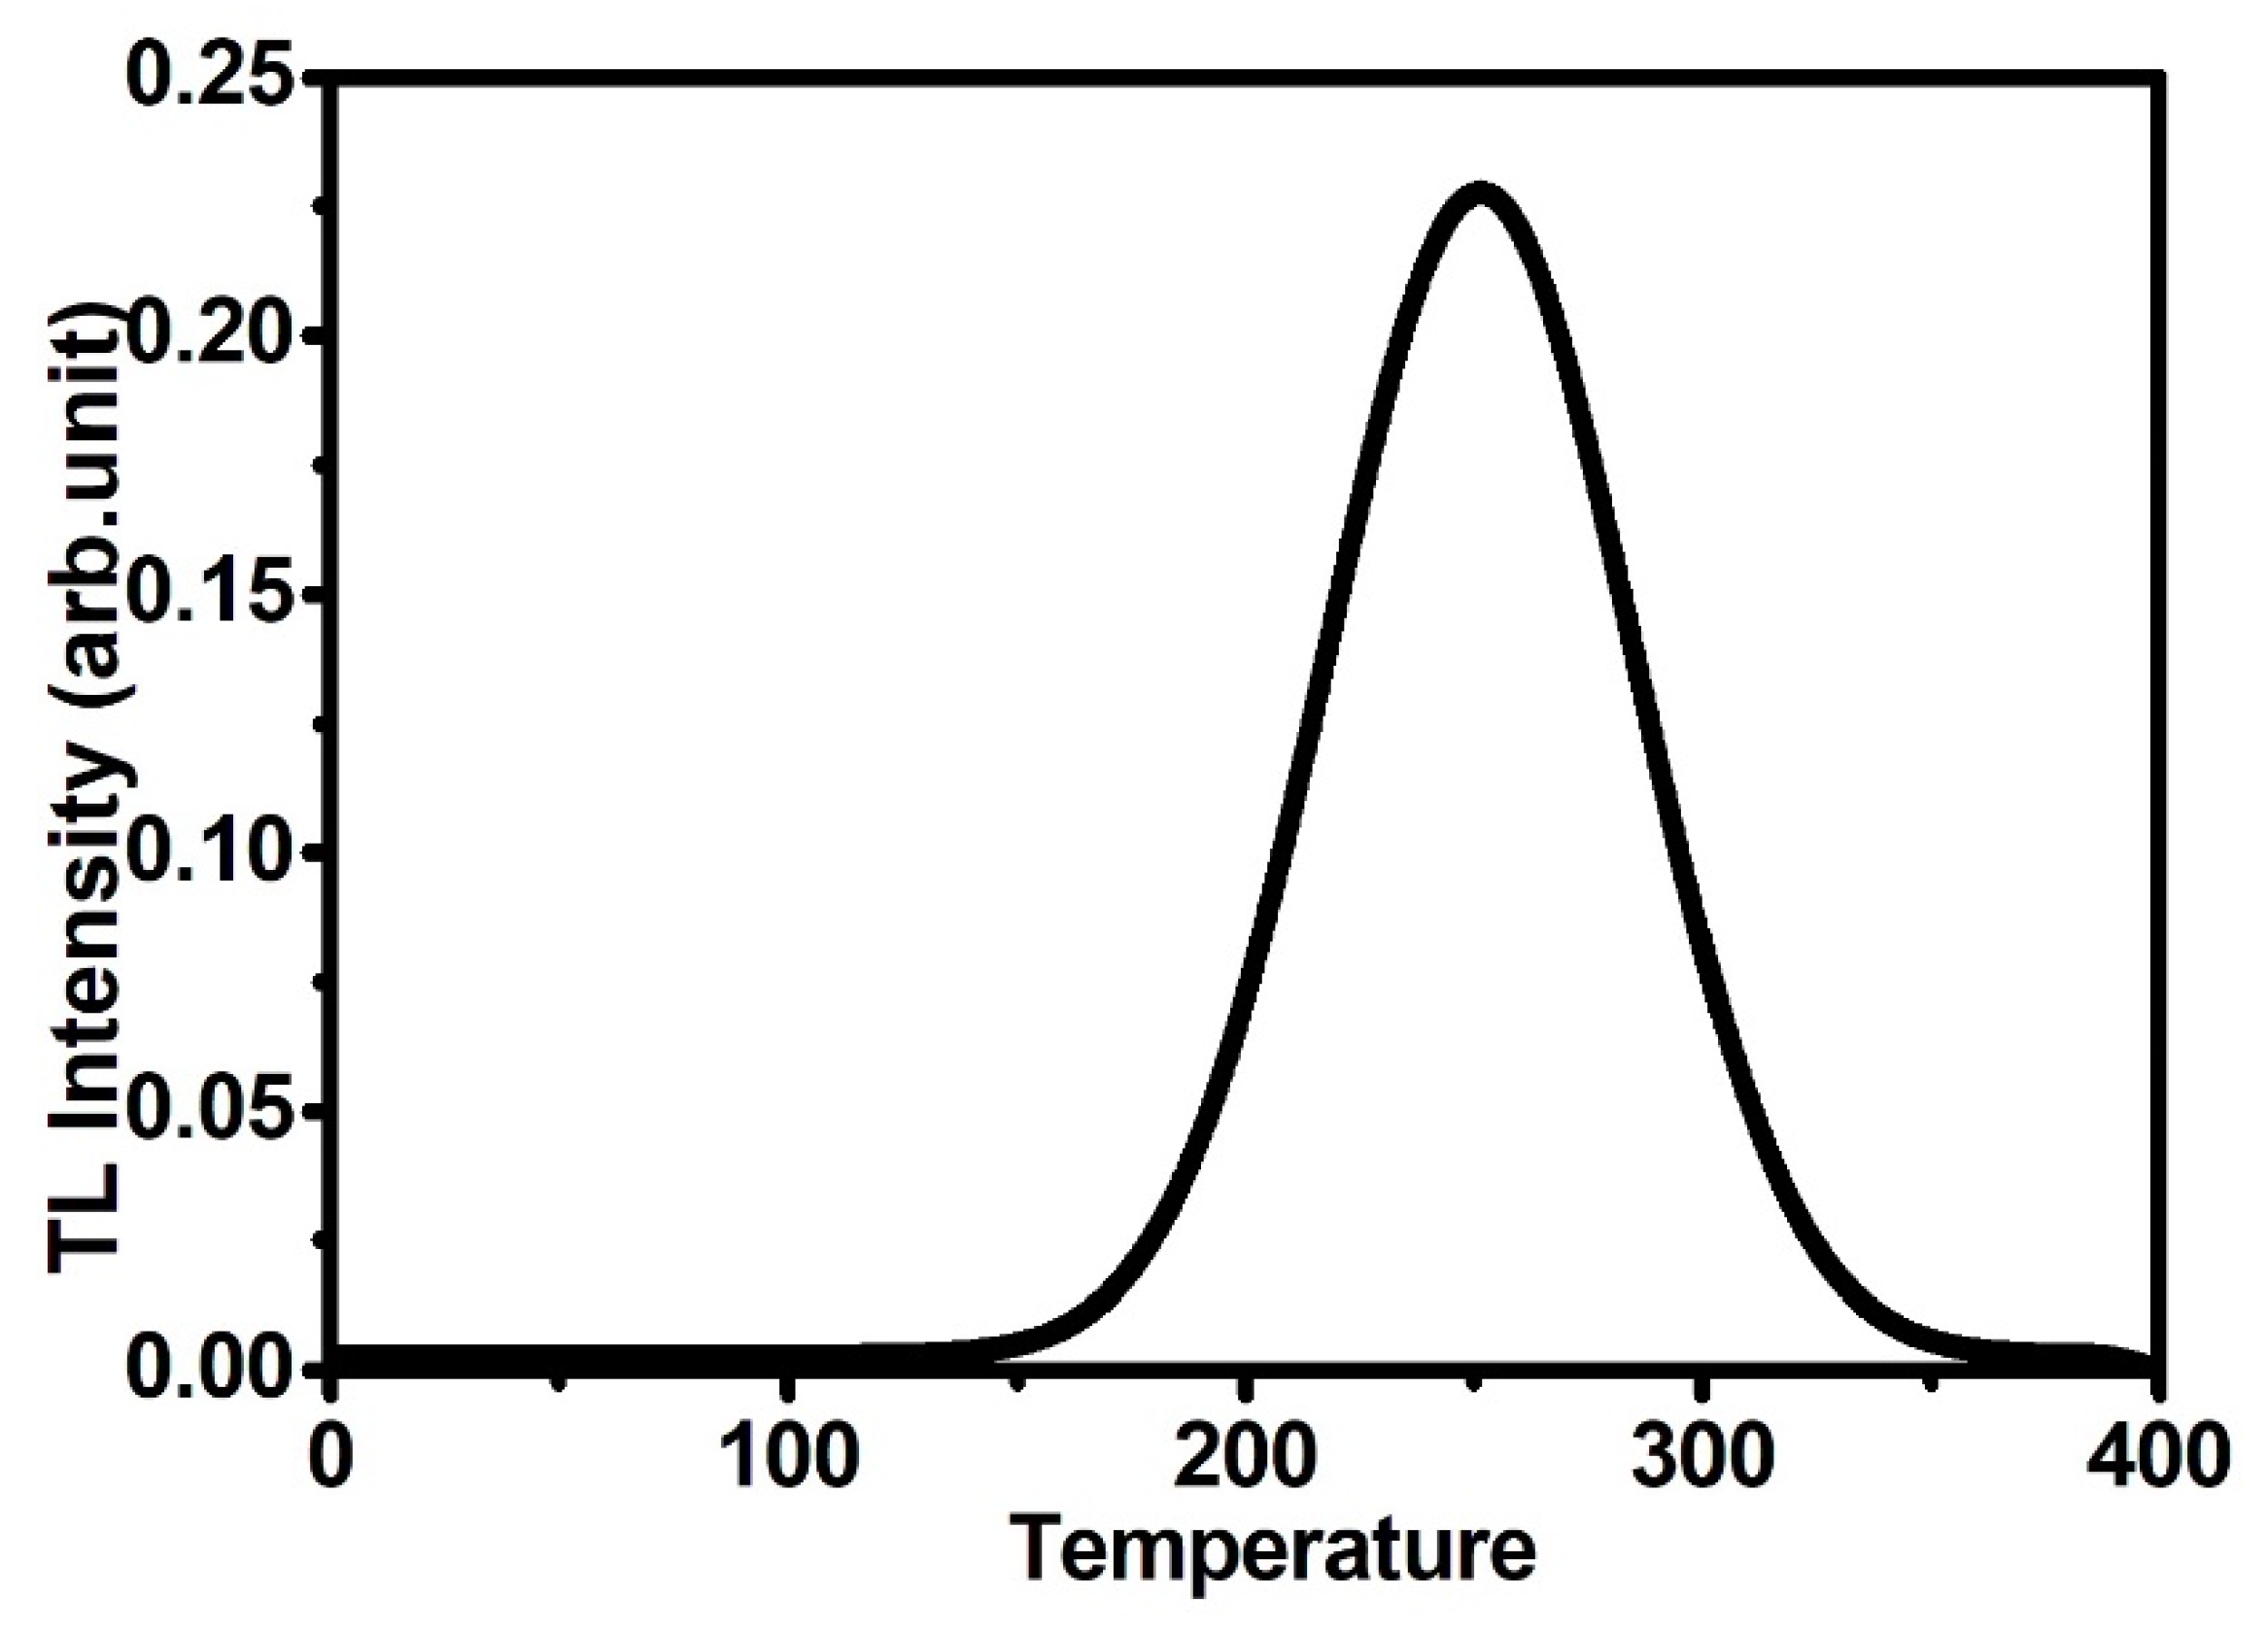
Figure 1. TL glow curve of the as-received sample.
Applsci 12 00637 g001
Figure 2. The sensitization factor of 250 °C TL peak of phyllite versus (a) pre-dose with γ-radiation and (b) post-irradiation temperature.
Applsci 12 00637 g002
Figure 3. Variation of glow curves with the pre-dose.
Applsci 12 00637 g003
Figure 4. Variation of glow curves with the activation temperature.
Applsci 12 00637 g004
Figure 5. Growth curves of phyllite as a function of gamma dose: (a) unsensitized sample and (b) sensitized sample. The calculated standard deviation is within 5%.
Applsci 12 00637 g005
Figure 6. Variation of TL glow curves of (a) unsensitized phyllite and (b) sensitized phyllite with test dose 1 Gy.
Applsci 12 00637 g006
Figure 7. TL fading of phyllite at room temperature against test dose.
Applsci 12 00637 g007
Table 1. The chemical composition of phyllite.
ElementWeight (%)
SiO257.8
AlO317.1
Fe2O35.51
MgO1.4
CaO10.5
Na2O0.25
K2O0.28
TiO20.62
MnO0.05
H2O3.53
Sum97.04
Trace elementsConcentration (ppm)
Rb34
Sr131
Rb/Sr0.26
Publisher’s Note: MDPI stays neutral with regard to jurisdictional claims in published maps and institutional affiliations.