Article

Frictional Behaviour of the Microstructural Surfaces Created by Cylindrical Grinding Processes

1
College of Mechanical Engineering, University of Shanghai for Science and Technology, Shanghai 200093, China
2
General Engineering Research Institute, Liverpool John Moores University, Liverpool L3 3AF, UK
3
Shanghai Astronomical Observatory (SHAO), Chinese Academy of Sciences, Shanghai 200030, China
*
Author to whom correspondence should be addressed.
Appl. Sci. 2022, 12(2), 618; https://doi.org/10.3390/app12020618
Submission received: 18 December 2021 / Revised: 6 January 2022 / Accepted: 7 January 2022 / Published: 10 January 2022
(This article belongs to the Special Issue New Frontiers in Grinding Processes)

Abstract

:

Featured Application

It is well known that micro geometrical topographic characteristics have a strong influence on the surface tribological performance. However, it has been a difficulty for a long time for engineers to identify a set of suitable grinding parameters that could create low friction surfaces. Based on the understanding the mechanism of grinding surface generation, the paper presents a new set of surface feature parameters that could form a function in related to the frictional performance of the ground surface. Such a function could guide engineers to create beneficial microstructural features for lower friction bearing surfaces to improve energy efficiency of the applications.

Abstract

Cylindrical surface grinding can create defined textural patterns on a component with high quantity. This paper presents an experimental investigation of the frictional behaviours of ground cylindrical microstructural surfaces under a well lubrication condition. It shows that the coefficient of friction (COF) of microstructural surface is influenced by different workload and rotation speed. The results reveal that conventional surface roughness parameters do not present the influence of surface microstructure on friction performance well. However, the paper presents an interesting discovery that the friction behaviour of microstructural surfaces created by grinding could be controlled by combining dressing and grinding conditions. Such a discovery provides a logic way to reduce surface friction for energy efficiency applications. A few functional relationships have been established to illustrate the influence of microstructural features on friction. It was found that the ground microstructural surface could improve friction performance up to 20% compared to the smoother surfaces without defined surface textural patterns.

1. Introduction

Friction behaviour is a part of surface functions, and it is also critical for the energy consumption and the applicable life of machined component surfaces. Surface texturing acts as an effective approach for the surface modification to improve the surface functional performance, particularly at a micro scale. Nowadays, surface texturing has been widely recognized as a potential to reduce the friction resistance, and applied to the cylinder liner, sliding and other surfaces.
Gachot et al. [1] presented a critical view at the fundamental effects of surface textures in different lubrication regimes. The studies in various operating conditions of experiments have also shown that the micro regularities (dimples, cavities, grooves) could successfully improve the friction behaviour under different lubrication regimes compared to untextured surfaces [2,3,4,5,6,7,8,9].
Pettersson and Jacobson [2] investigated the grooves and square textures in the various sizes on PVD (physical vapour deposition) surface under dry and boundary lubrication conditions. The coefficient of friction exhibited excellent performance around 0.05 for small square and grooves texture during 200,000 cycles. Hu et al. [3] studied the tribological performance of laser-textured 2024 aluminium alloy samples in unidirectional sliding tests under boundary lubrication conditions. The optimum area density was found at 8.5%, which agrees well with other research investigation [4] under boundary lubrication conditions.
The benefits of surface texturing were also reported with experimental results under mixed lubrication and hydrodynamic lubrication as well as the regime transitions between them. Ramesh et al. [5] depicted experimental and numerical investigations of the friction characteristics of micro textured surfaces in mixed lubrication. The experimental results showed the effect of microstructural surface for the applications under a constant load that lead to a lower friction, which was in accord with the simulation prediction. Similar friction reductions were also verified by Greiner et al. [6] and Daniel Braun et al. [7] in the experiments of mixed lubrication conditions. Wang et al. [8] further analysed the effect of texturing area of SiC samples under water lubrication, covering the transition from hydrodynamic lubrication to mixed lubrication. They defined a transition load as a workload on which the coefficient of friction increased sharply. The higher transition load indicated a better retention of lubrication. It was found when texture coverage area was 2.8%, the transition load could increase 20% comparing to a smooth surface. Galda [9] studied the geometrical characteristics of textured surfaces in a lubrication regime transitioning from mixed to hydrodynamic lubrications, where the tests were carried out under contact and unidirectional sliding conditions. When compared with untextured surfaces, a substantial reduction in friction coefficient was observed with textured steel surfaces. All these experiment results convinced the effects of microstructure on the friction reduction, but when the surface structure dimension reached a macro level, the structure texture became less consistence and unprofitable due to the increasing costs per part in mass production. Hence, the suggestion was to use micro manufacturing processes, which could control the surface texture and production efficiently and precisely.
Many manufacture techniques are available to create micro structural surface textures with high quality to improve the surface function, including the friction behaviour. These methods for the creation of defined surface microstructure with the feature size in the micrometre range include energy beam techniques [10,11], etching [12], mechanical formation [13,14] and others. Among these methods, laser surface texturing (LST) is considered as the most promising texturing technology. It provides high precision control of the size and shape, enabling the construction of optimized geometrical parameters and can be used for a wide range of materials including metals, ceramic and polymers [10,11]. Etching and photochemical etching is another alternative method for creating such microstructural surface topographies. It was concluded from the study that the etching process is more cost effective and allowed for more complex geometries on the surface [12]. Despite the popularity and advantages of LST and etching, there are some downsides of these techniques. Their resulting surface is usually quite rough and, due to the material pile up, will still need further processing, especially for the radii of corners. To produce a precise micro structural surface, laser processing needs to use a large amount of energy, while for the etching process, erosion materials used as well as the processing waste are highly polluted with negative impacts to the environment. The conventional mechanical processing to produce micro-structural surface shows their advantages. A mechanical method that has been widely used to produce microstructural texture surfaces is milling. By machining intersecting grooves in different directions and applying different tool geometries, a great variety of complex microstructures can be manufactured. The problems with this are a long processing time, material debris removal, the tedious effort on algorithm design and their machining G-code generation for required precision [13,14].
The abrasive technology, as an important manufacturing process, is usually applied as a final process procedure. The honing process can create the cross hatch or linear texture on the cylinder and sliding surface. Several experimental results [15,16] already showed that texture by honing influences significantly on friction performances. The valley of texture could act as an oil repository and plays a critical role in the fluid dynamic performance. Similar to the honing process, the microstructural cylindrical grinding is a precision process and can process different material with precision tolerance. By utilizing the specific dressing strategy and grinding conditions, different sizes of microstructure can be obtained and controlled by cylindrical plunge grinding [17]. The surface microstructure created by cylindrical grinding can be divided into the following two principal parts: plateaus and gouge valleys. These valleys may play a significant role in improving on the surface frictional performance. Initial tests [18] on ground cylindrical surface friction illustrated encourage results, thus a comprehensive investigation on the friction behaviour of a ground cylindrical microstructural surface is necessary.
In this paper, a set of microstructural surfaces were created on carbon steel samples by cylindrical grinding. The tribological tests of these microstructural surfaces were conducted under different normal workloads and rotational speeds in a fully lubricated situation to investigate the influence of microstructures on the surface friction behaviour.

2. Structural Surface Creation and Their Characteristics

2.1. Creation of Microstructural Suface by Sylindrical Grinding

Grinding is an effective mechanical machining process, which can process high precision and tight tolerance of micro structural surface. In the component preparation, the components were first polish-ground to get a smooth surface and then textured by cylindrical plunge grinding. The wheel surface pattern was generated by a specified dressing operation, in which the diamond dresser cut across the grinding wheel surface from right to left and from left to right at the same dressing depth. Thus, a cross helix gouge pattern is formed on the surface of the grinding wheel. During grinding, the grinding wheel will print its surface pattern on to the ground surface, forming designed dimple microstructural texture, as shown in Figure 1. The mechanism of surface microstructure formation has been presented in previous investigation [17].
According to previous study on microstructural surface generation in grinding [17], the geometrical characteristics of ground surface structure are mainly controlled by the wheel dressing and component grinding parameters. The depth of grooves is mainly controlled by grinding depth, while the geometry sizes of structural gouge length and width are also influenced by grinding depth. The structural axial interval is mainly decided by the dressing feed fd, while the structural circumference interval L is determined by the rotational speed ratio between workpiece and wheel nw/ns. According to the kinematic relation of grinding cutting actions, the proportion of structural gouge length in a grit cutting pitch length should be the same as the proportion of structural gouge width in a dressing feed. According to the mechanism of microstructure groove formation, the microstructure geometric feature sizes can be expressed by the following parameters of the dressing and grinding processes [17]:
l w = L × ( 1 2 x x f d ) = L × ( 1 2 r d 2 ( r d h s + a p ) 2 f d )
b w = f d × ( 1 2 x x f d ) = f d × ( 1 2 r d 2 ( r d h s + a p ) 2 f d )
where
L = 2 π R s q = v w / n s = 2 π R w × n w / n s
and
x x = r d 2 ( r d h s + a p ) 2 = ( h s a p ) ( 2 r d h s + a p )
h s = r d r d 2 ( f d / 2 ) 2
Equations (1)–(5) present the structural length lw, structural width bw, circumferential pitch length L and half minimum uncut plateau length on the workpiece in axis direction xx; here, fd is the dressing feed, rd is the dresser tip radius, ap is the grinding depth, hs is the section depth of helix grove on the grinding wheel surface, q is the ration of vw/vs, vs is the grinding speed, vw is the work-material speed, Rs is the radius of grinding wheel, Rw is the radius of workpiece, nw is the rotational speeds of workpiece, and ns is the rotational speeds of grinding wheel.
The structural surface components were produced on a Kellenberger cylindrical grinding machine. The micro structural gouge depth was controlled by the grinding depth of cut or infeed in plunge grinding. The geometry of micro structural length and width was determined by the dressing strategy, speed ratio, tip radius and grinding depth. The dressing and grinding operations were executed under same constant wheel spindle rotational speed (1344 rpm). All the components were manufactured under the same dressing strategy and other variables selected for the microstructural grinding were: wheel speed was 35 m/s, dresser tip radius was 0.25 mm, grinding depth changed from 1–4 μm, dressing feed was of 100 μm and 120 μm, and each plunge grinding was undertaken in 3 revolutions of workpiece rotation. The detailed experimental conditions are shown in Table 1. Based on the defined experiment conditions shown in Table 1, Table 2 listed the nominal values of geometrical parameters of structural gouge features on the ground surface, which were calculated using Equations (1)–(5). Without considering the deflection of grinding system, the nominal gouge depth should be the same as grinding depth of cut. An extra polish-ground sample without defined microstructure was prepared (test 0) with finer dressing lead and 25 s sparking out process, which presents much better surface finish.
The cylindrical components were made of carbon steel with dimensions of 25 mm × 52 mm (width × diameter). The tolerance of these component diameters is controlled within the range of 51.995~51.997 mm to reduce the influence of gap variation on the fiction. Components from No.1 to No.8 were ground with different dressing conditions to create different surface textures, while the component No.0 possesses a smooth surface finish without specified texture for comparison purposes.

2.2. Surface Measurement and Characterization

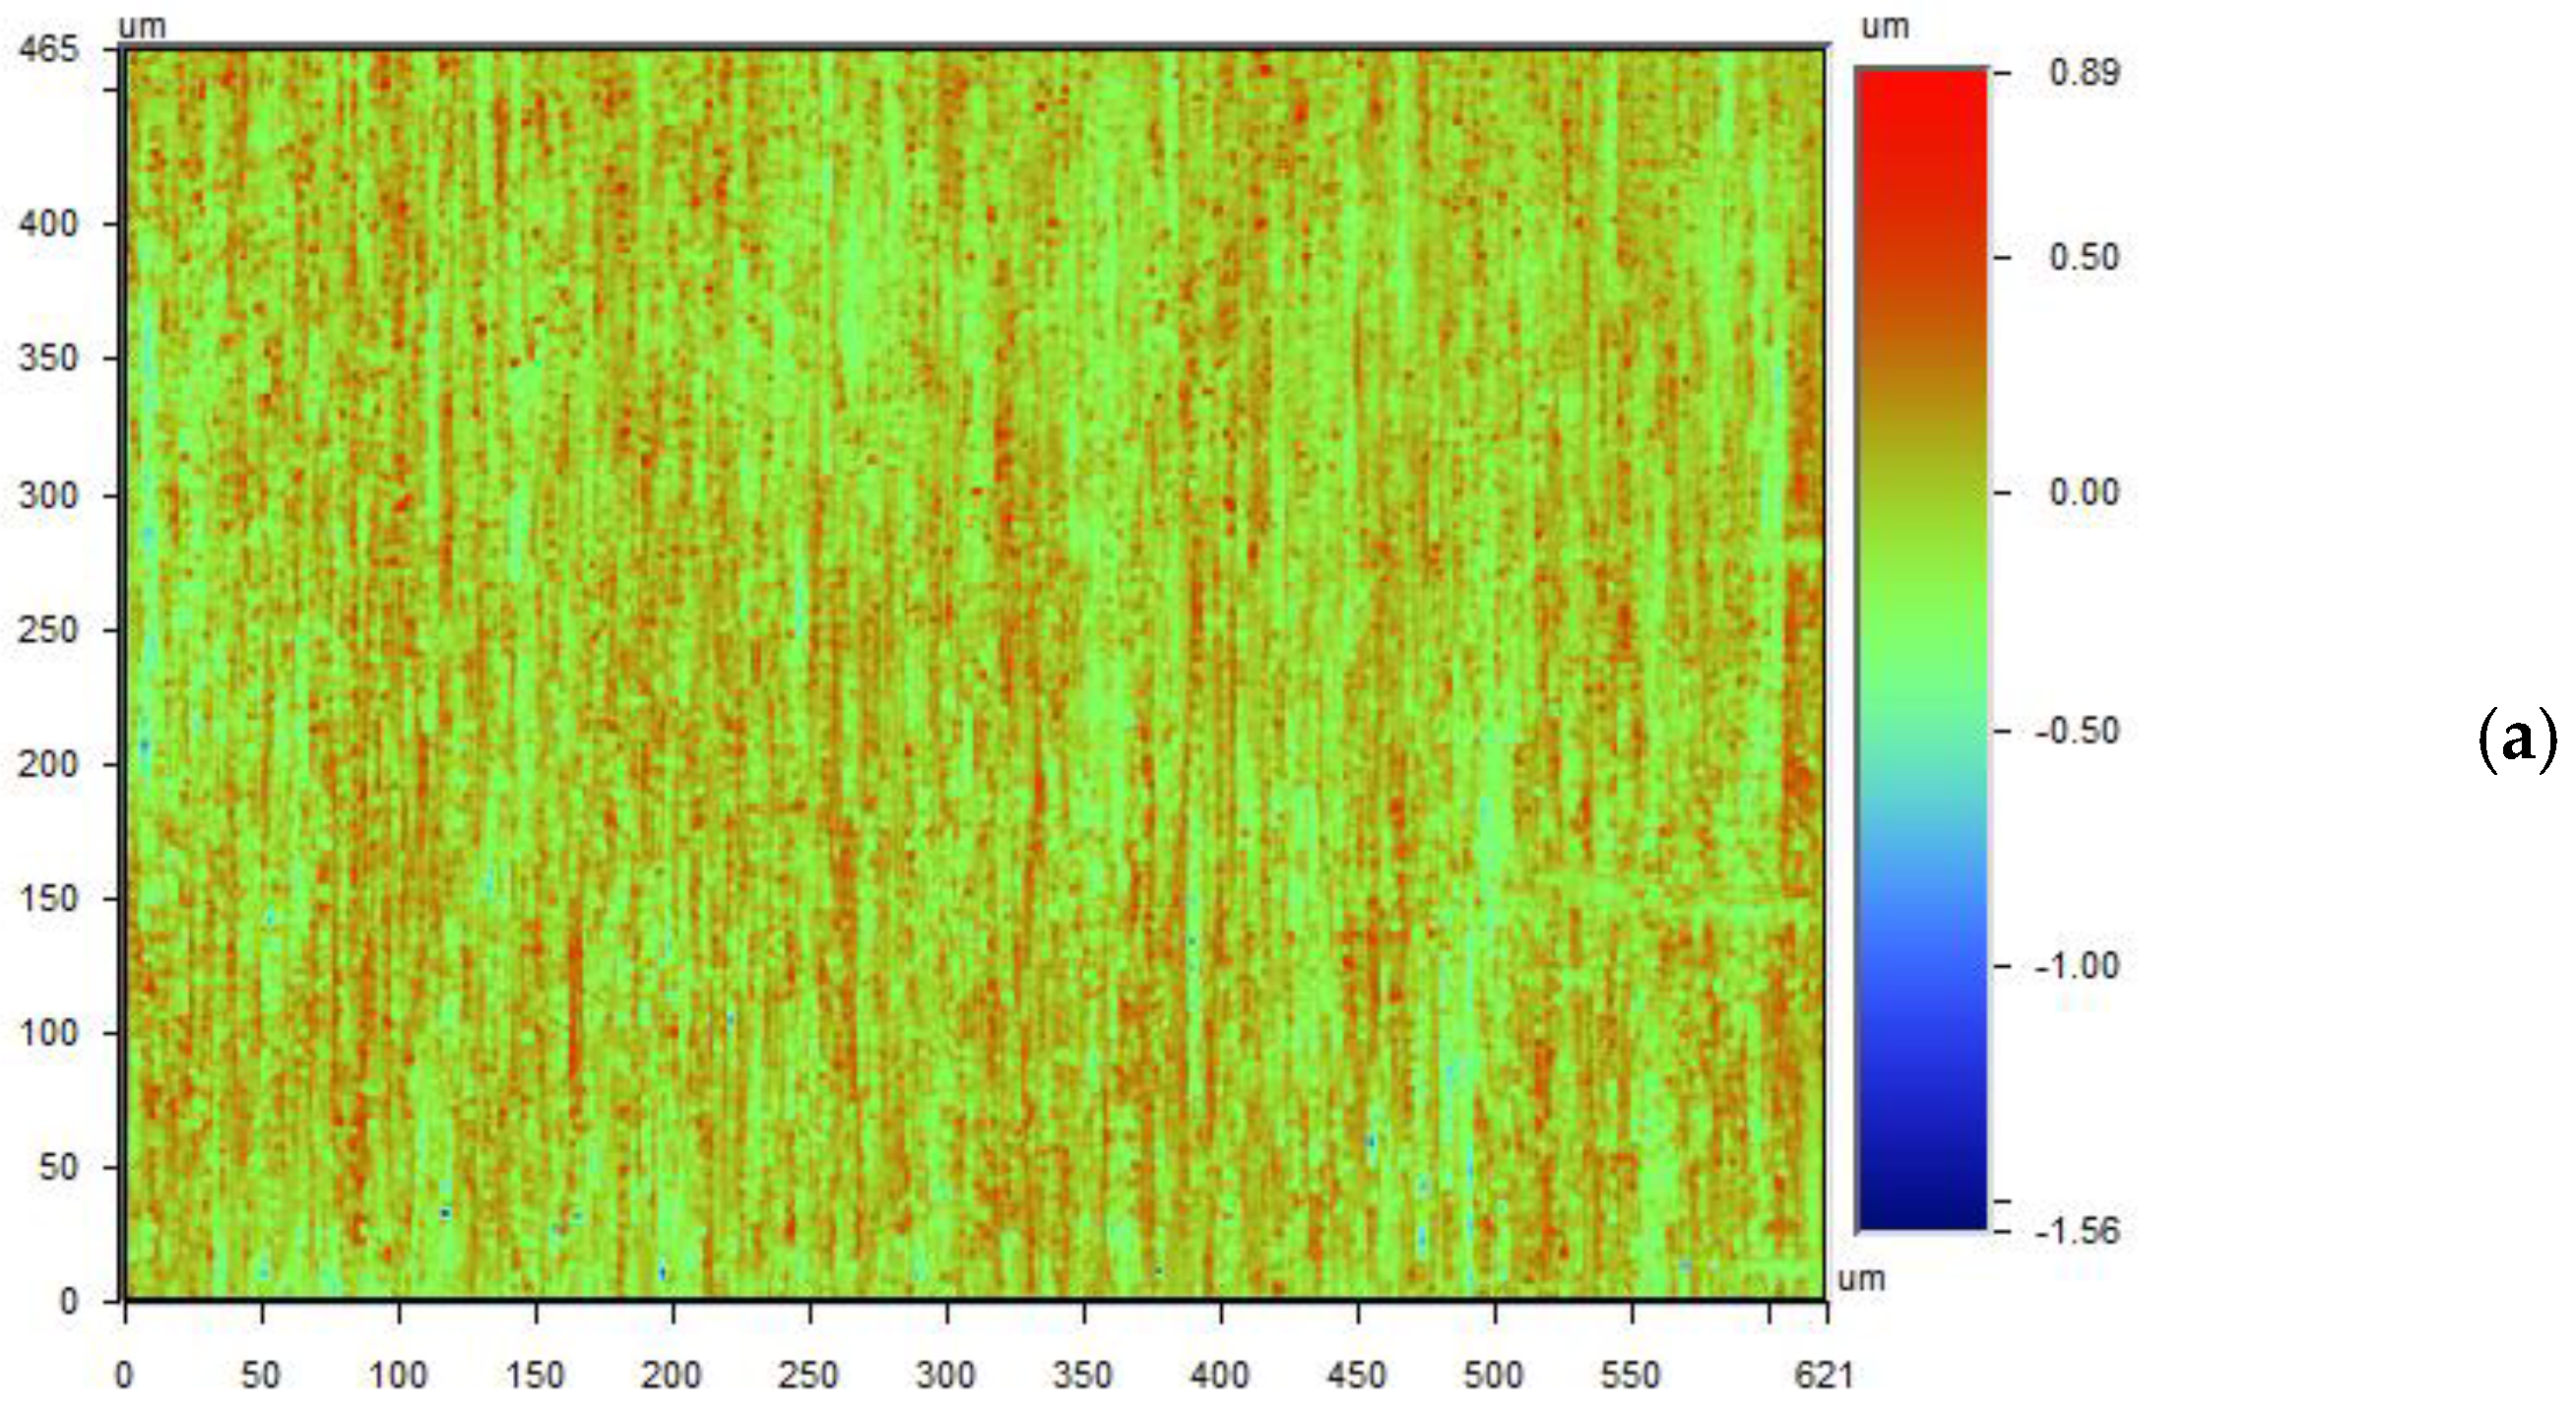
The 3D topography of ground micro structural surface was measured by a Wyko white light interferometer. The measuring area is 0.6 × 0.4 mm2 containing 368 × 240 points. The typical measurements of micro structural surface topography are shown in Figure 2. Comparing with polish-ground component (test sample 0), many deeper and larger gouges appeared on the ground textural surfaces on the workpieces.
From measured cylindrical surface topography, the surface roughness parameters were extracted for depicting the surface topography amplitude, spatial and other features. Following 3D roughness parameters are considered as microstructural surface features in analysis: Sa, Ssk and Sku from the amplitude parameters, Svk and Sk from the functional parameter, Str, Sal from the spatial parameters and the peak count number Rpc. These parameters are of statistical geometrical significance and often used for assessing surface quality and surface wear performance.
Sa is the most widely used amplitude parameter for surface characterization and is an important roughness parameter for the machining surface. Ssk (Skewness) and Sku (Kurtosis) of topography height distribution are chosen to evaluate the curvature features of the microstructural surface. The skewness of the texture height distribution is always combined with the kurtosis to describe the shape of the surface topography. By considering the skewness and kurtosis, the proportion of deep valleys and top flat in the microstructural surface can be identified.
The functional parameter Sk, which defined from Abbott-Firestone curve or bearing area curve, is commonly used to characterize honed surface texture, which might also suit for microstructural grinding surface. It contains the reduced peak height Spk describing the height at which peaks rise from the core profiles, the core roughness depth Sk and the reduced valley height Svk, which indicates the oil reservoir in the surface that may influence friction.
For spatial parameters, the surfaces texture ratio Str is used to identify the structural texture pattern and isotropy while the autocorrelation length Sal describes main wavelengths of micro structural surface [19]. Meanwhile the 2D parameter peak count number Rpc shows the peak number in the tested profile of micro structural surface.
To get a comprehensive description of the micro structural surface, three measurements were taken on the same component and the average value of these parameters was calculated and presented in Table 3.

3. Tribological Performance of Structural Surfaces

In this investigation, the influence of surface structure on friction is analysed experimentally. Friction tests were mimic to the crankshaft working scenario. The structural surface texture could have significant influence on the lubrication surface fluid dynamic behaviour, which is of great tribological significance.

3.1. Friction Test and Test Procedure

The experiments were carried out on a test rig equipped with a servo motor to drive the component (shaft) on a paired cylinder liner (bearing) as shown in Figure 3. The workload was applied to the bearing rod creating a normal force on the sample component. The test sample component was assembled on a shaft that linked to motor through a torque sensor. The outputs from the torque sensor and the load sensor were recorded in a computer for the calculation of the coefficient of friction (COF) that is equal to the ratio of friction force (deduced from the torque) to workload force.
The friction tests were conducted on every component under full lubrication conditions. The oil was pumped into the inlet side of the bearing component. Table 4 presents three test condition settings of normal load and spindle rotational speed. The tests under each condition were conducted at least two repetitions for the same component.
The experiment procedure of friction tests is described as follows to ensure the tests are stable, repeatable and comparable. First, the component was installed in the cylinder bearing pairs and fresh oil was pumped to the component surface. The test apparatus was controlled by a computer program, so that a series of multiple tests could be executed automatically. The friction tests were performed under the test conditions A, B and C as indicated in Table 4. In each test, the workload was fixed at a defined value, while the sample component was rotating at a selected rotational speed.
Meanwhile, the oil temperature between the cylinder bearing pair was monitored. With the initial increase in rotating speed, the oil temperature would gradually rise, which would break the thermal balance in the bearing test system leading to the fluctuation of the COF curve. When the rotating speed reached the working speed and continued running, the thermal balance would re-establish and became stable again. As a result, the variation of the COF decreased, and the COF curve became stable again. In the experiments, it was found that a 5 min test running was required to get fairly stable results as shown in Figure 4. Compared to the laboratory room temperature 22 °C, the oil temperature was rather consistent between 22 °C and 25 °C for the low speed (500 rpm) tests and between 36 °C and 40 °C for the high speed (1500 rpm) tests. The consistent oil temperature is important for the friction tests. Therefore, the duration of each test run was set as 5 min, and a 10 min stationary period was introduced between consecutive tests to minimize the oil temperature rises.
The variation of COF during initial transitional period of test running is owing to the status of surface contact, surface fluid dynamic performance, and the higher local pressure on the initial contact between microstructural surface and counter bearing body. When the tests starts and the normal load applies, only the highest peaks of the micro structural surface are in contact, thus the initial contact area is very small leading to an extremely high local pressure [20]. This causes initial high COF. With the increase in spindle speed, the contact lubrication status will change due to the fluid dynamic performance leading to the variation of COF. Many factors, such as lubricant inertial, contact surface topography, contact area and fluid viscosity, etc. have significant influence in this transitional stage from boundary lubrication to fully lubrication status. Once a lubricant film forms and becomes stable, the friction behaviour reaches a steady state. For the comparison of surface microstructure influences, the COF will be considered when the surface contact lubrication status becomes stable. In this investigation, the COF reading was taken at the end of 5 min running tests.

3.2. Friction Coefficient Measurement

To get meaningful results of the friction test, the COF should be extracted from the sample friction pair concerned. The friction influence from the system supports should be deducted from the tests when considering the applied load and measured torque. The torque measured by the torque sensor includes not only friction torque from sample bearing pair but also those torques created by the friction from supporting bearings in the test rig. In order to eliminate the influence of the friction from test rig support system, a no-load test should be conducted. The no-load torque tests were carried out without test sample present in the system to measure different torque generated due to the support bearing under different weight loads at three different rotational speeds (500, 1000 and 1500 rpm). Figure 5 shows the results of no-load tests. It can be seen from Figure 5 that the influence of spindle rotational speed is not significant. Therefore, the influence of no-load friction can be presented by a best fit power function of the loading force.
COFno-load = 14.94 F−1.02
where COFno-load is no-load friction coefficient, and F is normal load force. Equation (6) is used to calculate the no-load torque and then eliminate no-load torque effect on the sample COF calculation in the tests.

3.3. Friction Behaviour under Different Loads and Rotational Speeds

The COF is mainly determined by the factors such as the material of the contact surface, the surface topography and roughness, the loaded force on the contact surface and the speed of the relative movement between the surfaces [21]. Therefore, it is necessary to assess the influence of the different loads and rotational speeds condition on the friction performance.
The average COF at the stable stage of each test (i.e., at the end of 5 min test running) is used to represent the component friction result in corresponding to each load and speed condition. Average COF comparison of the components under each test condition is shown in Figure 6. The test results show that polish-ground surfaces do not give the lowest COFs compared with those microstructural surfaces.
As shown in Figure 6, the samples under the lower load 30 N (test A) presents higher coefficients of friction, when they run at a high speed of 1500 rpm. Comparing with polish-ground smooth surface, the textured ground surfaces could reduce COF by more than 20% in the best case in the test range. For the tests of 100N load (tests B and C), most exhibited lower friction at the higher rotational speed. Meanwhile, the COF values of the structural surfaces were smaller than the polished surface. The greatest decrease in COF values compared with polish-ground samples is 20% at the rotational speed of 1500 rpm. On the contrary, the best improvement of friction at the rotational speed of 500 rpm were small, only slightly better (8%) than the polish-ground components.
It is interesting to note that the COF values at low-load high-speed tests were much higher than that of other test conditions. The reason for such results may relate to the hydrodynamic effect in cylindrical bearing contact area during the shaft sample rotation. The workload in the bearing pair is balanced by hydrodynamic force, which is generated because of the wedge gap forming between the shaft and the hole. The hydrodynamic oil film wedge is characterized by the convergence ratio, which is a function of workload. When a bearing pair is under a higher load, the bearing contact gap will get closer to enable the hydrodynamic lift force increases to balance the increased load. As the gap decreases, the gap convergence ratio becomes larger and fluid flow rate would decrease and so did the resistance, resulting in the friction reduction. The higher the workload, the higher the convergence ratio. It has been demonstrated in engineering tribology that a higher convergence ratio will give a lower COF in a hydrodynamic bearing [21]. Therefore, a higher workload leads a lower COF.
Considering moving speed influence, the COF values in a high-load high-speed situation were only slightly higher than that of a high-load low-speed situation, which means the speed influence is much smaller than the influence of the workload. Such a small difference could be due to the higher moving speed causing higher shear stresses in the lubricant, which may play an insignificant role in the tribology.
In a word, the experiment results confirm that hydrodynamics play an important role in friction reduction. A particular microstructural surface created by suitably designed dressing and grinding conditions could reduce the friction coefficient significantly.

4. Discussion

4.1. Effect of the Dressing and Grinding Conditions on the Surface COF

The features of the micro structural surface generated by grinding are determined by the control parameters of the wheel dressing and grinding operations. Based on the models expressed by Equations (1)–(5), the key influential parameters are dressing lead, dresser tip radius, grinding depth and grinding speed ratio. Dressing lead and the grinding depth are the main factors to create and control the structural texture geometry. The structural gouge depth is directly decided by the grinding depth; in the meantime, the structural gouge length, width and distribution are controlled by dressing lead and grinding speed ratio. Therefore, the friction behaviour of micro structural surface should be assessed against these process control parameters. Figure 7 presents the influence of grinding depth and dressing lead on the COF of microstructural surface.
The structural gouge depth increases with the increase in the grinding depth and is smaller than the nominal grinding depth, due to the elastic deformation in grinding. The COF does not change linearly with the grinding depth. However, it can be seen when the grinding depth is around 1~2 μm, the COF values of a microstructural surface may achieve its minimum. Thus, it is convincing that a shallow dimple gouge could give positive hydrodynamic effect on surface tribological performance.
Dressing lead affects the shape and distribution of the structural gouges. However, its influence on the COF is not clear. When the workload is low, the smaller dressing lead may enhance the effect of the gouge depth to reduce friction.
Another important factor is the width of the structural texture, which is determined by the grinding depth and dressing feed. The structural gouge width increases with the increase in grinding depth, as shown in Table 2. It is interesting to see that the maximum gouge widths, shown in Figure 2, are similar to the theoretical value listed in Table 2. This is because the grinding deflection has less influence in lateral directions. Based on Table 2 and Figure 6, the lower COF may be achieved with the gouge width in the range of 10~21 μm. According to current observation, it is difficult to reveal the influence of micro texture shape on friction directly.

4.2. Effect of Surface Roughness on the Surface COF

To further study the friction behaviour of a micro structural surface, it will be convenient if surface friction could be related to common surface roughness parameters. Considering those surface roughness parameters discussed in Section 2.2, the correlation analysis was carried out to identify any significant relations that might exist. Table 5 lists the correlation between COF and various surface roughness parameters presented in Section 2.2. It can be seen that most surface roughness parameters have low correlation coefficients with COF. In test A, the maximum correlation coefficient was obtained between the COF and Sk. For tests B and C, the maximum correlation coefficient between the COF and the surface roughness parameter was obtained between Svk and Sal, respectively. This suggests that the effect of surface roughness on friction behaviour could change due to the different operation condition. In some cases, the correlation could change from positive to negative or vice versa. Therefore, conventional roughness parameters do not present the effects of microstructural surface feature on fluid dynamical and tribological behaviours, they only illustrate surface geometrical statistic features. Different microstructures may present similar geometrical statistic features but possess very different tribological attributes.
In Test C, Sal, Svk and Rpc have fairly high correlation coefficients (higher than 0.8), but they have different signs from other tests, which means some particular unexplained phenomena happen in the tests. In order to identify the microstructure influence on friction, it may be necessary to investigate the surface texture related features or characteristics that shows clear functional relation with friction.

4.3. Effect of Microstructural Features on the Surface COF

Considering the parameters listed in Table 2, they present those nominal values of microstructural feature parameters. By considering the relation between COF and these parameters, it is interesting to note that some good functional relationships were emerging as show in Figure 8. The relation between surface COF and microstructural features could be expressed with a third order polynomial function where the determination factor R2 is 0.88 for the ratio of dressing lead over grinding depth and 0.76 for the ratio of dressing lead over gouge width. Such functional relations between COF and dimensionless ratios provide a good guide to achieve lower friction on structural surface.
Further, if a geometrical feature ratio (fd lw)/(bw ap) is considered, the surface COF could be expressed as a polynomial function with determination factor 0.97, as shown in Figure 9. This is a good indication that a surface fiction coefficient can be presented with its microstructural feature parameters. The beauty of this discovery is that it established a clear function between the surface COF and those controllable feature creation parameters. Such a finding provides a good guide for grinding operations to create low friction surface that could improve energy efficiency in applications.
The observation presented in Figure 8 and Figure 9 are under the friction test condition A. For the friction test conditions B and C, the coefficients of determination drop. A higher order polynomial function should be used for presenting those texture feature influences on the COF. Such a phenomenon indicates the influence of textured surface microstructure on COF is mainly through its influence on the surface fluid dynamics behaviour, because the fluid film gap in test A is larger than others due to a lower load applied. This observation also convinced previous research findings on microstructural surface performance [18].

5. Conclusions

Surface microstructural topography is an important factor that directly affects the friction performance of functional surfaces. Due to the different surface creation conditions, the impact of microstructure on friction is different even under a full lubrication. By studying the friction behaviours of ground textural surfaces together with polish-ground surfaces under the different test conditions, some interesting conclusions can be drawn.
(1) Suitably defined microstructural cylindrical surface created by grinding can possess lower COF than the polish-ground smoother surface does. The best improvement in this study was 20%.
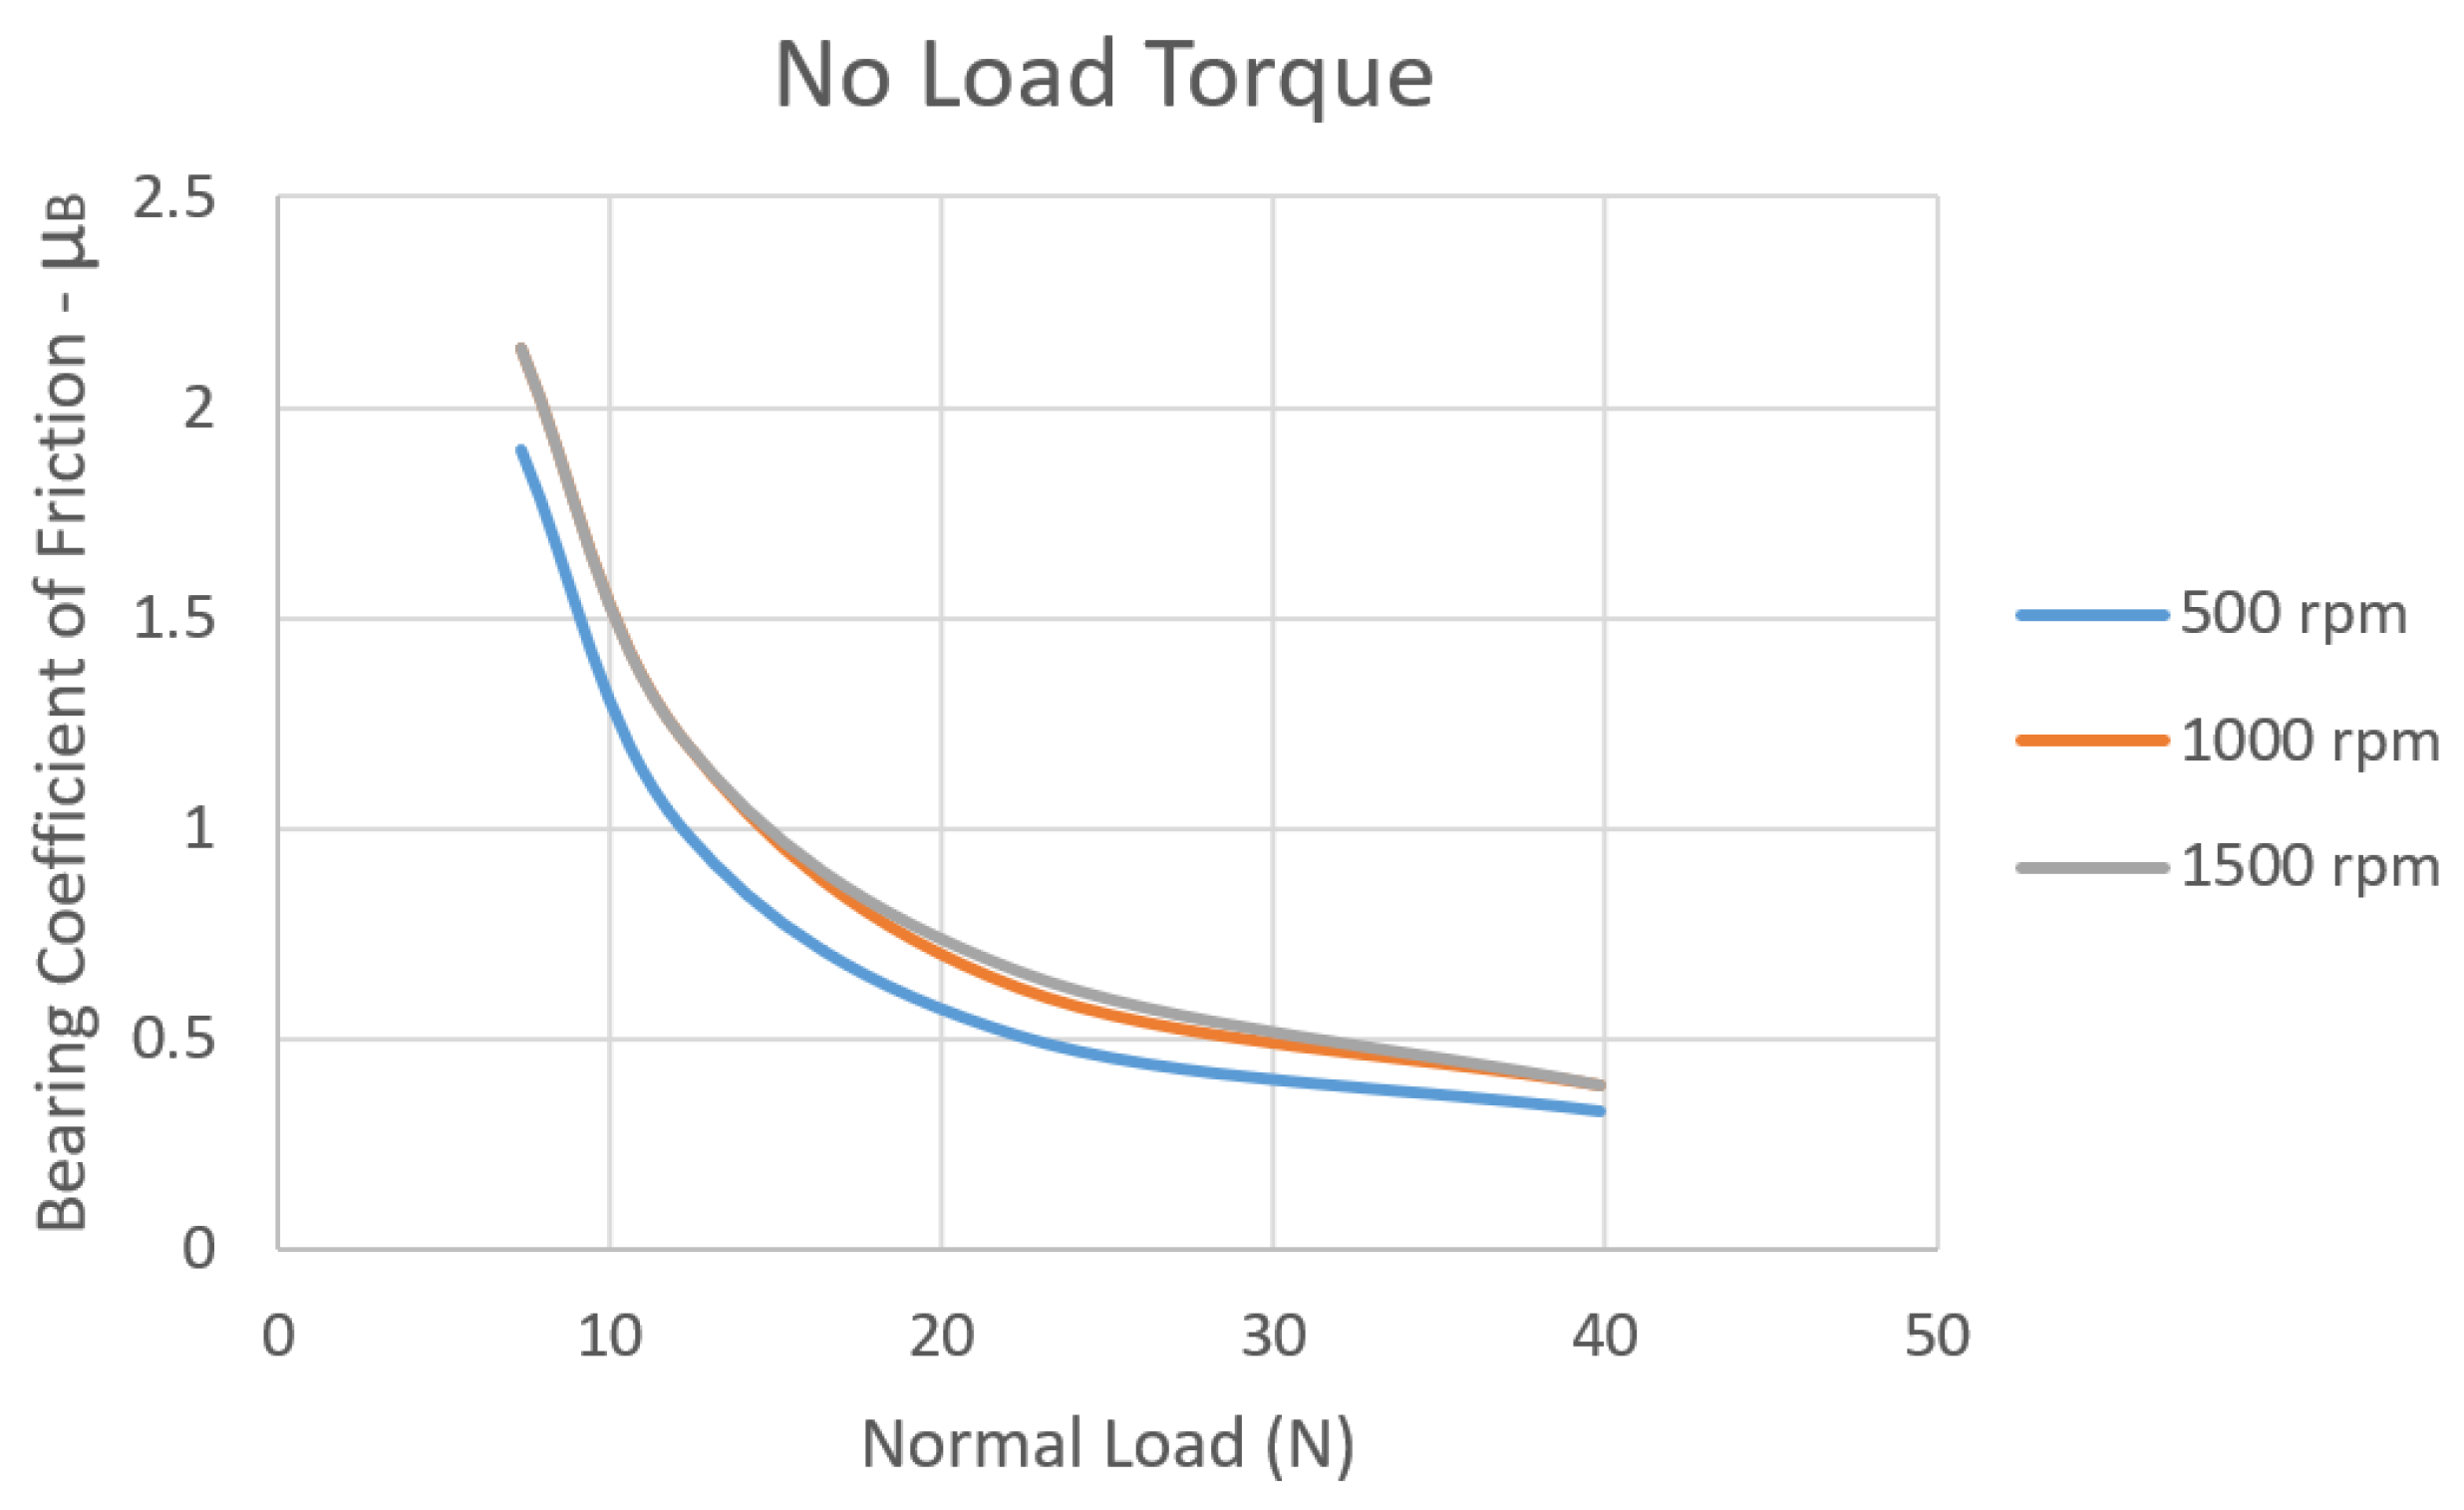
(2) The investigation shows that the COF decreased with the workload increases but varied insignificantly with the rotational speed changes.
(3) Textural features of microstructural surfaces have strong effects on the friction behaviour in addition to the normal load or rotational speed applied in the tests. In the range of investigation conditions, it is found that the COF does not vary monotonically with the textural features. Surface with small textural gouge depth of 1~2 micros showed better friction behaviour in the tests.
(4) Most conventional surface roughness is important to depict the surface geometrical features statistically, but they do not effectively reflect the influence of microstructure on friction behaviour. Most correlation coefficient values between the conventional surface roughness parameters and the COFs are low, only the correlation of the COFs with Sk and Svk show relative high values. The investigation failed to find suitable functions that can present the COF with conventional surface roughness parameters. This means that conventional surface roughness parameters may not present the COF effectively.
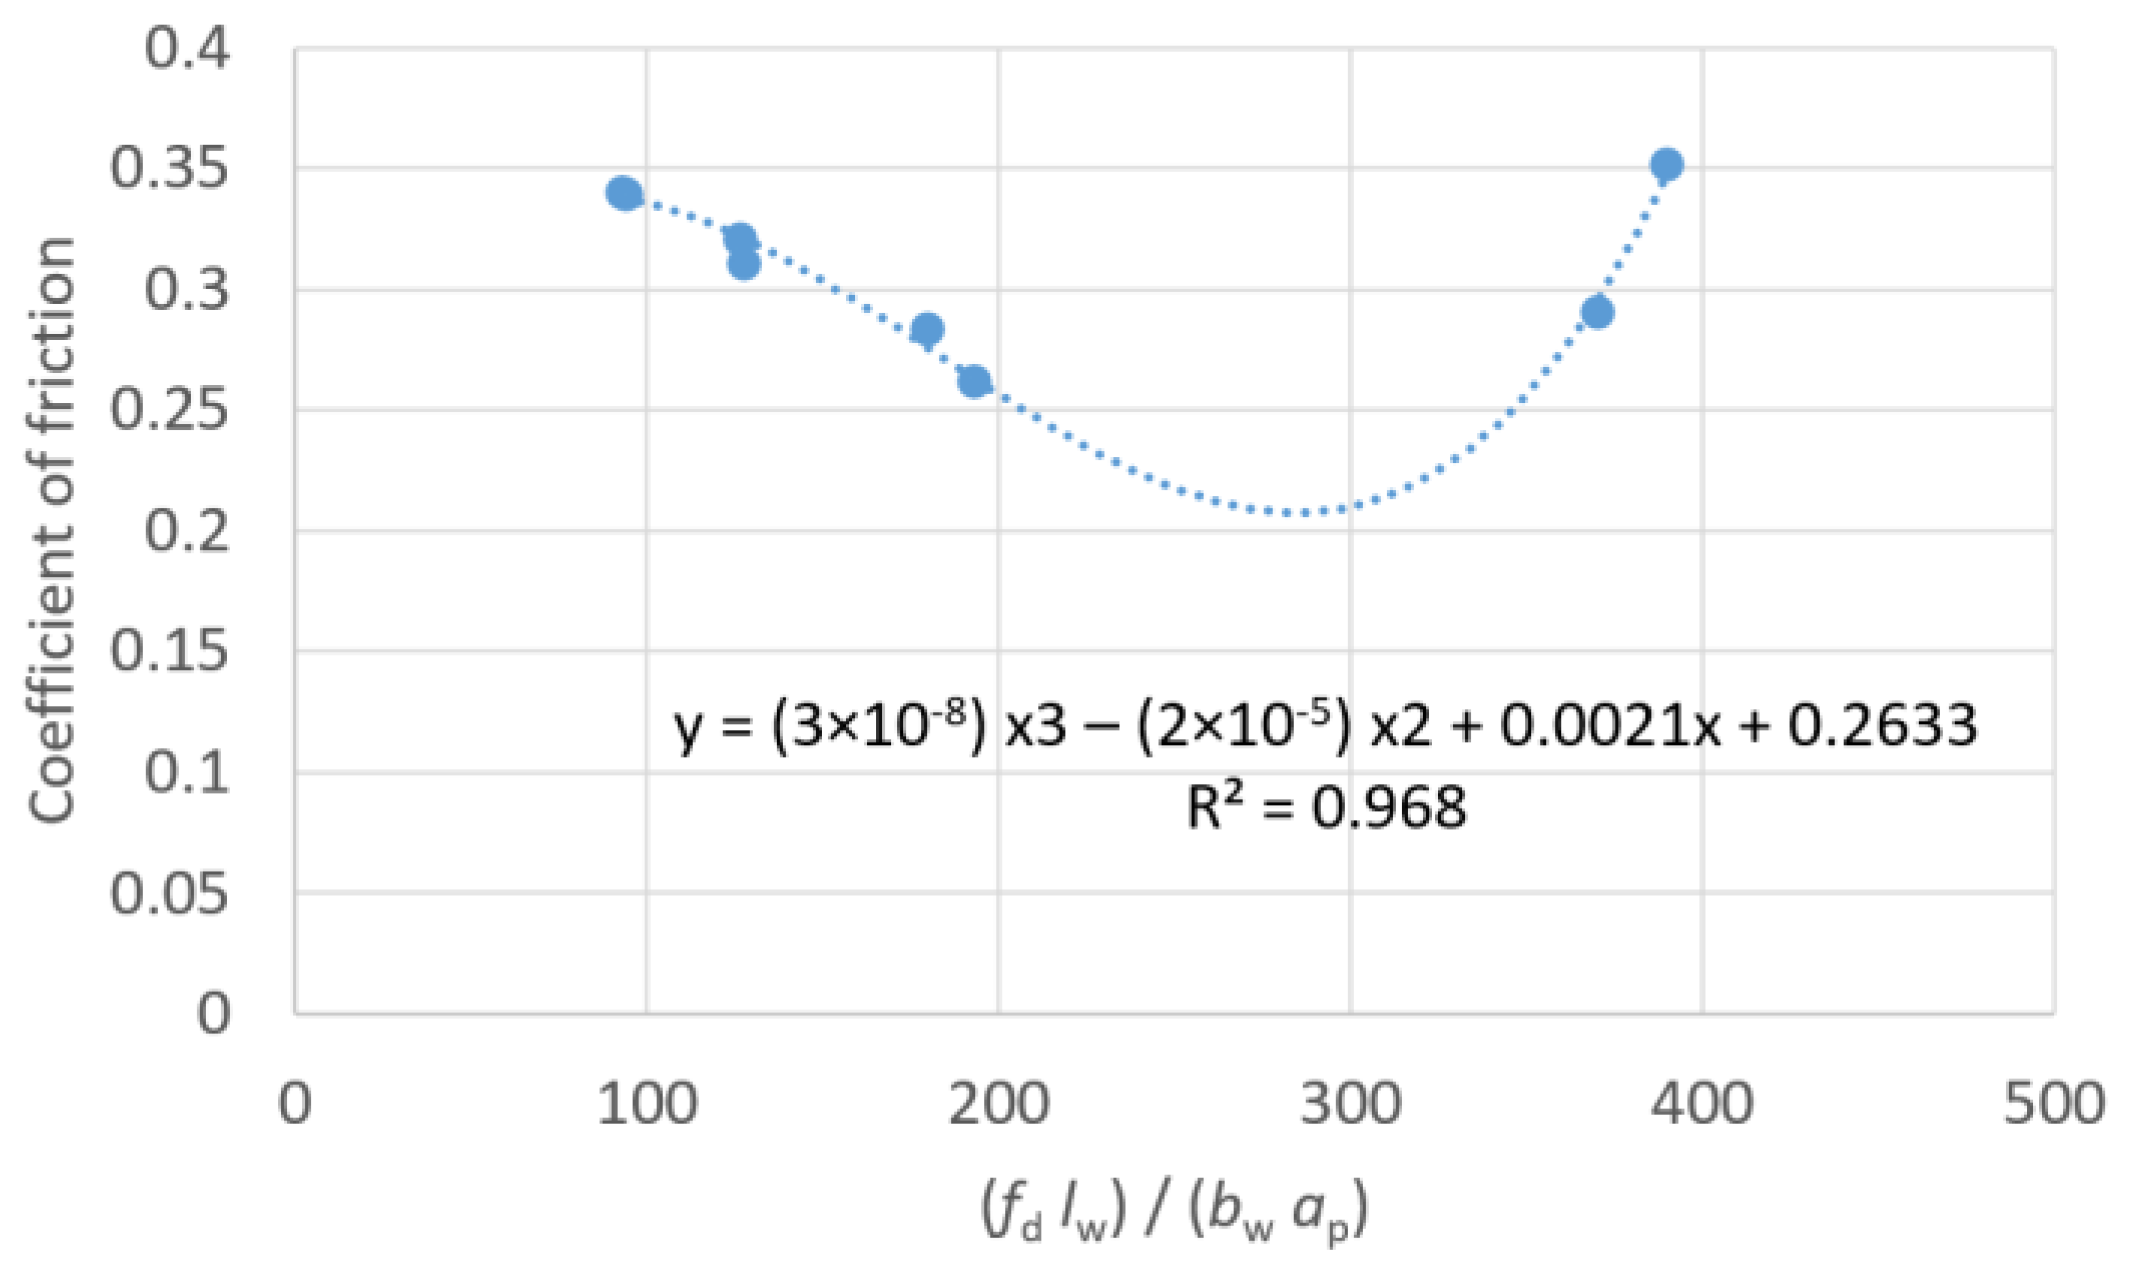
(5) It is an exciting discovery that the COF could be simply presented by a suitably selected function of dimensionless geometrical feature parameters with very high determination factor. The function with the highest determination factor of 0.97 covers the key microstructure feature parameters in this study. These key parameters are the length, width and depth of the textured gouges together with the dressing lead that determines the gouge structure distribution on the ground surface. This finding provides a good way to identify the best dressing and grinding conditions for creating a textured microstructural surface of a lower COF. It could bring some significant impacts on energy saving and improvements in bearing energy efficiency.

Author Contributions

Conceptualization, X.C. and H.C.; methodology, X.C.; validation, H.C., X.C., H.L. and C.S.; formal analysis, H.C. and X.C.; investigation, X.C. and H.C.; resources, X.C., H.L. and C.S.; data curation, X.C. and H.C.; writing—original draft preparation, H.C. and X.C.; writing—review and editing, X.C.; visualization, X.C. and H.C.; supervision, X.C. and H.L.; project administration, X.C. and H.L. All authors have read and agreed to the published version of the manuscript.

Funding

This research received no external funding.

Institutional Review Board Statement

Not applicable.

Informed Consent Statement

Not applicable.

Data Availability Statement

All relevant data are presented in the paper.

Conflicts of Interest

The authors declare no conflict of interest.

References

  1. Gachot, C.; Rosenkranz, A.; Hsu, S.M.; Costa, H.L. A critical assessment of surface texturing for friction and wear improvement. Wear 2017, 372–373, 21–41. [Google Scholar] [CrossRef]
  2. Pettersson, U.; Jacobson, S. Influence of surface texture on boundary lubricated sliding contacts. Tribol. Int. 2003, 36, 857–864. [Google Scholar] [CrossRef]
  3. Hu, T.; Hu, L. The study of tribological properties of laser-textured surface of 2024 aluminium alloy under boundary lubrication. Lubr. Sci. 2012, 24, 84–93. [Google Scholar] [CrossRef]
  4. Suh, M.-S.; Chae, Y.-H.; Kim, S.-S.; Hinoki, T.; Kohyama, A. Effect of geometrical parameters in micro-grooved cross hatch pattern under lubricated sliding friction. Tribol. Int. 2010, 43, 1508–1517. [Google Scholar] [CrossRef] [Green Version]
  5. Ramesh, A.; Akram, W.; Mishra, S.P.; Cannon, A.H.; Polycarpou, A.A.; King, W.P. Friction characteristics of micro textured surfaces under mixed and hydrodynamic lubrication. Tribol. Int. 2013, 57, 170–176. [Google Scholar] [CrossRef]
  6. Greiner, C.; Tobias, M.; Daniel, B.; Andrea, C.; Franco, M. Optimum dimple diameter for friction reduction with laser surface texturing: The effect of velocity gradient. Surf. Topogr. Metrol. Prop. 2015, 3, 044001. [Google Scholar] [CrossRef]
  7. Braun, D.; Greiner, C.; Schneider, J.; Gumbsch, P. Efficiency of laser surface texturing in the reduction of friction under mixed lubrication. Tribol. Int. 2014, 77, 142–147. [Google Scholar] [CrossRef]
  8. Wang, X.; Kato, K.; Adachi, K.; Aizawa, K. The effect of laser texturing of SiC surface onthecritical load for the transition of water lubrication mode from hydrodynamic to mixed. Tribol. Int. 2001, 34, 703–711. [Google Scholar] [CrossRef]
  9. Galda, L.; Pawlus, P.; Sep, J. Dimples shape and distribution effect on characteristics of Stribeck curve. Tribol. Int. 2009, 42, 1505–1512. [Google Scholar] [CrossRef]
  10. Vilhena, L.M.; Sedlacek, M.; Podgornik, B.; Vizintin, J.; Babnik, A.; Mozin, J. Surface texturing by pulsed Nd: YAG laser. Tribol. Int. 2009, 42, 1496–1504. [Google Scholar] [CrossRef]
  11. Etsion, I. State of the Art in Laser Surface Texturing. J. Tribol. 2005, 127, 248–253. [Google Scholar] [CrossRef]
  12. Brecher, C.; Weinzierl, M. Parallel precision alignment of multiple micro components. Microsyst. Technol. 2008, 14, 1847–1853. [Google Scholar] [CrossRef]
  13. Dean, B.; Bhushan, B. The Effect of Riblets in Rectangular Duct Flow. Appl. Surf. Sci. 2012, 258, 3936–3947. [Google Scholar] [CrossRef]
  14. Brandner, J.J.; Anurjew, E.; Bohn, L.; Hansjosten, E.; Henning, T.; Schygulla, U.; Wenka, A.; Schubert, K. Concepts and Realization of Microstructure Heat Exchangers for Enhanced Heat Transfer. Exp. Therm. Fluid Sci. 2006, 30, 801–809. [Google Scholar] [CrossRef]
  15. Tomanik, E. Friction and wear bench tests of different engine liner surface finishes. Tribol. Int. 2008, 41, 1032–1038. [Google Scholar] [CrossRef]
  16. Srivastava, D.K.; Agarwal, A.K.; Kumar, J. Effect of liner surface properties on wear and friction in a non-firing engine simulator. Mater. Des. 2007, 28, 1632–1640. [Google Scholar] [CrossRef]
  17. Cao, H.; Chen, X.; Li, H. Dressing strategy and grinding control for cylindrical microstructural surface. Int. J. Adv. Manuf. Technol. 2018, 9, 707–727. [Google Scholar] [CrossRef] [Green Version]
  18. Wharton, J.T. Structural Functional Surface Design and Manufacture. Ph.D. Thesis, Liverpool John Moores University, Liverpool, UK, 2017. [Google Scholar]
  19. Waikar, R.A.; Guo, Y.B. A comprehensive characterization of 3D surface topography induced by hard turning versus grinding. J. Mater. Processing Technol. 2008, 197, 189–199. [Google Scholar] [CrossRef]
  20. Saeidi, F.; Meylan, B.; Hoffmann, P.; Wasmer, K. Effect of surface texturing on cast iron reciprocating against steel under starved lubrication conditions: A parametric study. Wear 2016, 348–349, 17–26. [Google Scholar] [CrossRef] [Green Version]
  21. Stachowiak, G.W.; Batchelor, A.W. Engineering Tribology, 4th ed.; Elsevier: Oxford, UK, 2014; ISBN 978-0-12-397047-3. [Google Scholar]
Figure 1. Microstructural surface creation by grinding.
Applsci 12 00618 g001
Figure 2. Surface topography of microstructural surface. (a) Topography of component 0 (polished surface Sa = 0.082 mm). (b) Topography of component 2 (textured surface Sa = 0.263 mm). (c) Topography of component 3 (textured surface Sa = 0.255 mm).
Applsci 12 00618 g002aApplsci 12 00618 g002b
Figure 3. The friction test rig setup.
Applsci 12 00618 g003
Figure 4. Variation of COF during friction tests.
Applsci 12 00618 g004
Figure 5. Results of no-load torque tests at 500, 1000 and 1500 rpm.
Applsci 12 00618 g005
Figure 6. Average COF values obtained under different test conditions.
Applsci 12 00618 g006
Figure 7. Effect of grinding parameter on COF for different test conditions. (a) Test A. (b) Test B. (c) Test C.
Applsci 12 00618 g007
Figure 8. Relation between surface COF and microstructural features. (a) Influence of fd/ap. (b) Influence of fd/bw.
Applsci 12 00618 g008
Figure 9. Surface COF expressed as a function of microstructural geometrical features (fd lw)/(bw ap).
Applsci 12 00618 g009
Table 1. Grinding experimental conditions.
Test No.ad
µm
fd
µm/rev
vs
m/s
ns
rpm
nw
rpm
ap
µm
11010035134431
21010035134432
31010035134433
41010035134434
51012035134431
61012035134432
71012035134433
81012035134434
01090351344301→0
Table 2. Nominal geometrical parameters of structural surface.
No.Structural Axial Interval (μm)Structural Circumference Interval (μm)Structural Width
(μm)
Structural Length (μm)Structural Depth (μm)
110037710371
210037721812
3100377351333
4100377532004
51203778261
612037718542
712037727863
8120377391214
0Polished by dwell sparking outn/an/a→0
Table 3. Surface roughness parameters of microstructural surfaces measured before tribo-tests.
No.Sa (μm)Ssk (μm)Sku (μm)Sk (μm)Svk (μm)StrSal (μm)Rpc (1/mm)
10.283 ± 0.020.016 ± 0.154.856 ± 0.350.841 ± 0.080.463 ± 0.050.051 ± 0.019.091 ± 3.638.819 ± 1.1
20.263 ± 0.030.982 ± 2.765.937 ± 0.350.754 ± 0.030.538 ± 0.120.070 ± 0.058.001 ± 3.646.314 ± 1.3
30.255 ± 0.010.661 ± 0.555.046 ± 3.170.755 ± 0.080.521 ± 0.320.062 ± 0.018.324 ± 3.345.053 ± 10
40.269 ± 0.060.546 ± 0.534.792 ± 0.890.815 ± 0.050.471 ± 0.050.055 ± 0.019.391 ± 2.643.828 ± 6.2
50.401 ± 0.430.579 ± 0.435.677 ± 0.981.138 ± 0.130.897 ± 0.290.043 ± 0.0113.281 ± 3.342.575 ± 4
60.208 ± 0.010.198 ± 0.19.355 ± 1.580.579 ± 0.020.409 ± 0.010.119 ± 0.012.419 ± 0.553.846 ± 1.2
70.254 ± 0.010.033 ± 0.075.181 ± 1.380.773 ± 0.010.428 ± 0.040.064 ± 0.015.451 ± 0.650.089 ± 2.5
80.263 ± 0.160.204 ± 0.045.313 ± 0.570.793 ± 0.140.485 ± 0.130.061 ± 0.017.448 ± 3.247.584 ± 0.1
00.082 ± 0.010.164 ± 0.094.655 ± 0.050.379 ± 0.010.19 ± 0.020.048 ± 0.0033.886 ± 0.0143.825 ± 0.1
Table 4. Friction test conditions.
Test ConditionABC
Load (N)30 (low-load)100 (high-load)100 (high-load)
Rotational speed (Rpm)1500 (high-speed)1500 (high-speed)500 (low-speed)
Table 5. Correlation coefficient between test frictions and the selected surface characteristics parameters.
Test ConditionsSaSskSkuSkSvkStrSalRpc
Test A0.54−0.05−0.420.600.47−0.540.54−0.44
Test B 0.64−0.57−0.040.610.69−0.300.25−0.47
Test C −0.570.63−0.46−0.54−0.87−0.53−0.880.81
Publisher’s Note: MDPI stays neutral with regard to jurisdictional claims in published maps and institutional affiliations.

