Abstract
The use of drop-in capable alternative fuels in aircraft can support the European aviation sector to achieve its goals for sustainable development. They can be a transitional solution in the short and medium term, as their use does not require any structural changes to the aircraft powertrain. However, the production of alternative fuels is often energy-intensive, and some feedstocks are associated with harmful effects on the environment. In addition, alternative fuels are often more expensive to produce than fossil kerosene, which can make their use unattractive. Therefore, this paper analyzes the environmental and economic impacts of four types of alternative fuels compared to fossil kerosene in a well-to-wake perspective. The fuels investigated are sustainable aviation fuels produced by power-to-liquid and biomass-to-liquid pathways. Life cycle assessment and life cycle costing are used as environmental and economic assessment methods. The results of this well-to-wake analysis reveal that the use of sustainable aviation fuels can reduce the environmental impacts of aircraft operations. However, an electricity mix based on renewable energies is needed to achieve significant reductions. In addition, from an economic perspective, the use of fossil kerosene ranks best among the alternatives. A scenario analysis confirms this result and shows that the production of sustainable aviation fuels using an electricity mix based solely on renewable energy can lead to significant reductions in environmental impact, but economic competitiveness remains problematic.
1. Introduction
The demand for passenger and cargo flights has grown considerably over the past few decades. Due to continuing globalization and almost unlimited travel possibilities, global air travel is expected to expand even further [1]. Pre-COVID studies of the two leading aircraft manufacturers, Airbus and Boeing, predicted that the demand for flights will increase by up to 4.5% annually, which would lead to a doubling of air traffic every 16 years [2,3]. Although the COVID-19 pandemic led to a decrease in air travel by 75% in 2020 and therefore slowed this growth in the short term, the demand for flights has fully recovered, and a strongly positive trend is expected in the long term [4].
While this development is desired from an economic perspective, it is associated with extensive negative environmental impacts. Especially the emission of greenhouse gases (GHGs), such as carbon dioxide (CO2), is associated with undesirable and long-lasting effects on the climate due to increased global warming [5]. In 2019, the aviation sector was responsible for 2.6% of global CO2 emissions and 5.9% of global anthropogenic GHG emissions. Even if fuel efficiency improvements of approximately 25% can be achieved with each new aircraft generation, the predicted growth in flights would cause the aviation-induced GHG emissions to triple until 2050 [6]. This is particularly critical, as the impacts of emissions at high altitudes are more severe than those from ground-level emissions [7,8].
These negative impacts are mainly due to the combustion of fossil kerosene during flight operation [9], in which about 2.5 kg of CO2 is emitted per liter of kerosene [10]. An average medium-haul aircraft, such as the Airbus A320, consumes around 2700 L of kerosene per flight hour, causing 6750 kg of CO2 emissions during this period [10].
Due to the negative impacts on the environment as well as increasing societal pressure, political regulations have been established to reduce these emissions. Various strategies have been devised in the aviation sector, such as the introduction of the “Carbon Offsetting and Reduction Scheme for International Aviation” (CORSIA) [11]. Notably, the European aviation industry imposed ambitious goals on themselves until 2050 based on the Flightpath 2050 strategy: reduction of CO2 emissions by 75% per passenger kilometer traveled (pkm), reduction of nitrogen oxides (NOx) emissions by 90% per pkm, and subjective noise reduction by 65% relative to a new aircraft from the base year 2000 [12,13]. A first step toward the achievement of these reduction goals is the mandatory participation of airlines in the European Union Emission Trading System (EU ETS) for intra-European flights [14]. However, CORSIA and the EU ETS predominantly aim to provide financial compensation for the environmental impacts of air travel. Further far-reaching strategic concepts in the aviation sector are of the utmost importance to enhance sustainable aviation independent of fossil fuels.
Although a continuous improvement of aviation technologies is assumed, the efficiency increase of existing technologies will not suffice to reduce harmful environmental impacts substantially [13]. Consequently, disruptive technologies or radical changes to the powertrain system are inevitable [15,16]. To this end, the aviation industry is increasingly focusing on the use of alternative powertrain technologies in the aircraft fleet, such as fuel cell-based and battery-based concepts. Extensive structural modifications of the aircraft accompany these technological transitions. In the short term, however, they are not technologically feasible due to pending research and approval [17,18]. Considering the long use phases as well as the long research and development cycles of aircraft and powertrain concepts of 20–30 years in total, short-to-medium-term solutions need to complement the long-term transition [16,18].
One such solution can be the use of drop-in capable alternative fuels, which are burned instead of fossil kerosene and do not require any structural changes to the aircraft. Although their combustion produces almost identical CO2 emissions, significant reductions can be achieved from the well-to-wake perspective through savings during production [19,20]. In addition, alternative fuels contain no sulfur or aromatic compounds, which results in less particulate matter and NOx being released during combustion. However, their production is often energy-intensive, and some feedstocks lead to environmental pollution themselves. In addition, alternative fuels are often more expensive to produce than fossil kerosene, which is why airlines consider their use critically [21]. Therefore, the extent to which these alternative fuels can contribute to achieving Europe’s ambitious emission reduction goals must be analyzed and evaluated carefully.
This article seeks to analyze and assess different types of alternative fuels for aviation regarding their potential to be a suitable transition solution toward sustainable transformation of the European aviation sector. To this end, the production pathways of four different alternative fuels (i.e., three fuels based on the power-to-liquid pathway and one fuel based on the biomass-to-liquid pathway) and their use in aircraft engines are modeled and analyzed. A well-to-wake sustainability assessment is conducted based on the life cycle assessment and life cycle costing methods. Subsequently, the alternative fuels are compared to fossil kerosene regarding environmental and economic impacts.
The remainder of this article is structured as follows. In Section 2, promising aviation fuels are identified, their characteristics are described, the assessment methods are presented, and the system under investigation is defined. In Section 3, the impact assessment results of the well-to-wake analysis are presented and discussed. To this end, alternative compositions of the electricity mix are considered to account for the use of renewable energies (REs) in the production of alternative fuels. In Section 4, the implications of the results are discussed. In Section 5, the paper concludes with a summary of the benefits and limitations of the conducted study and prospects for future research.
2. Materials and Methods
2.1. Aviation Fuels and Previous Sustainability Studies
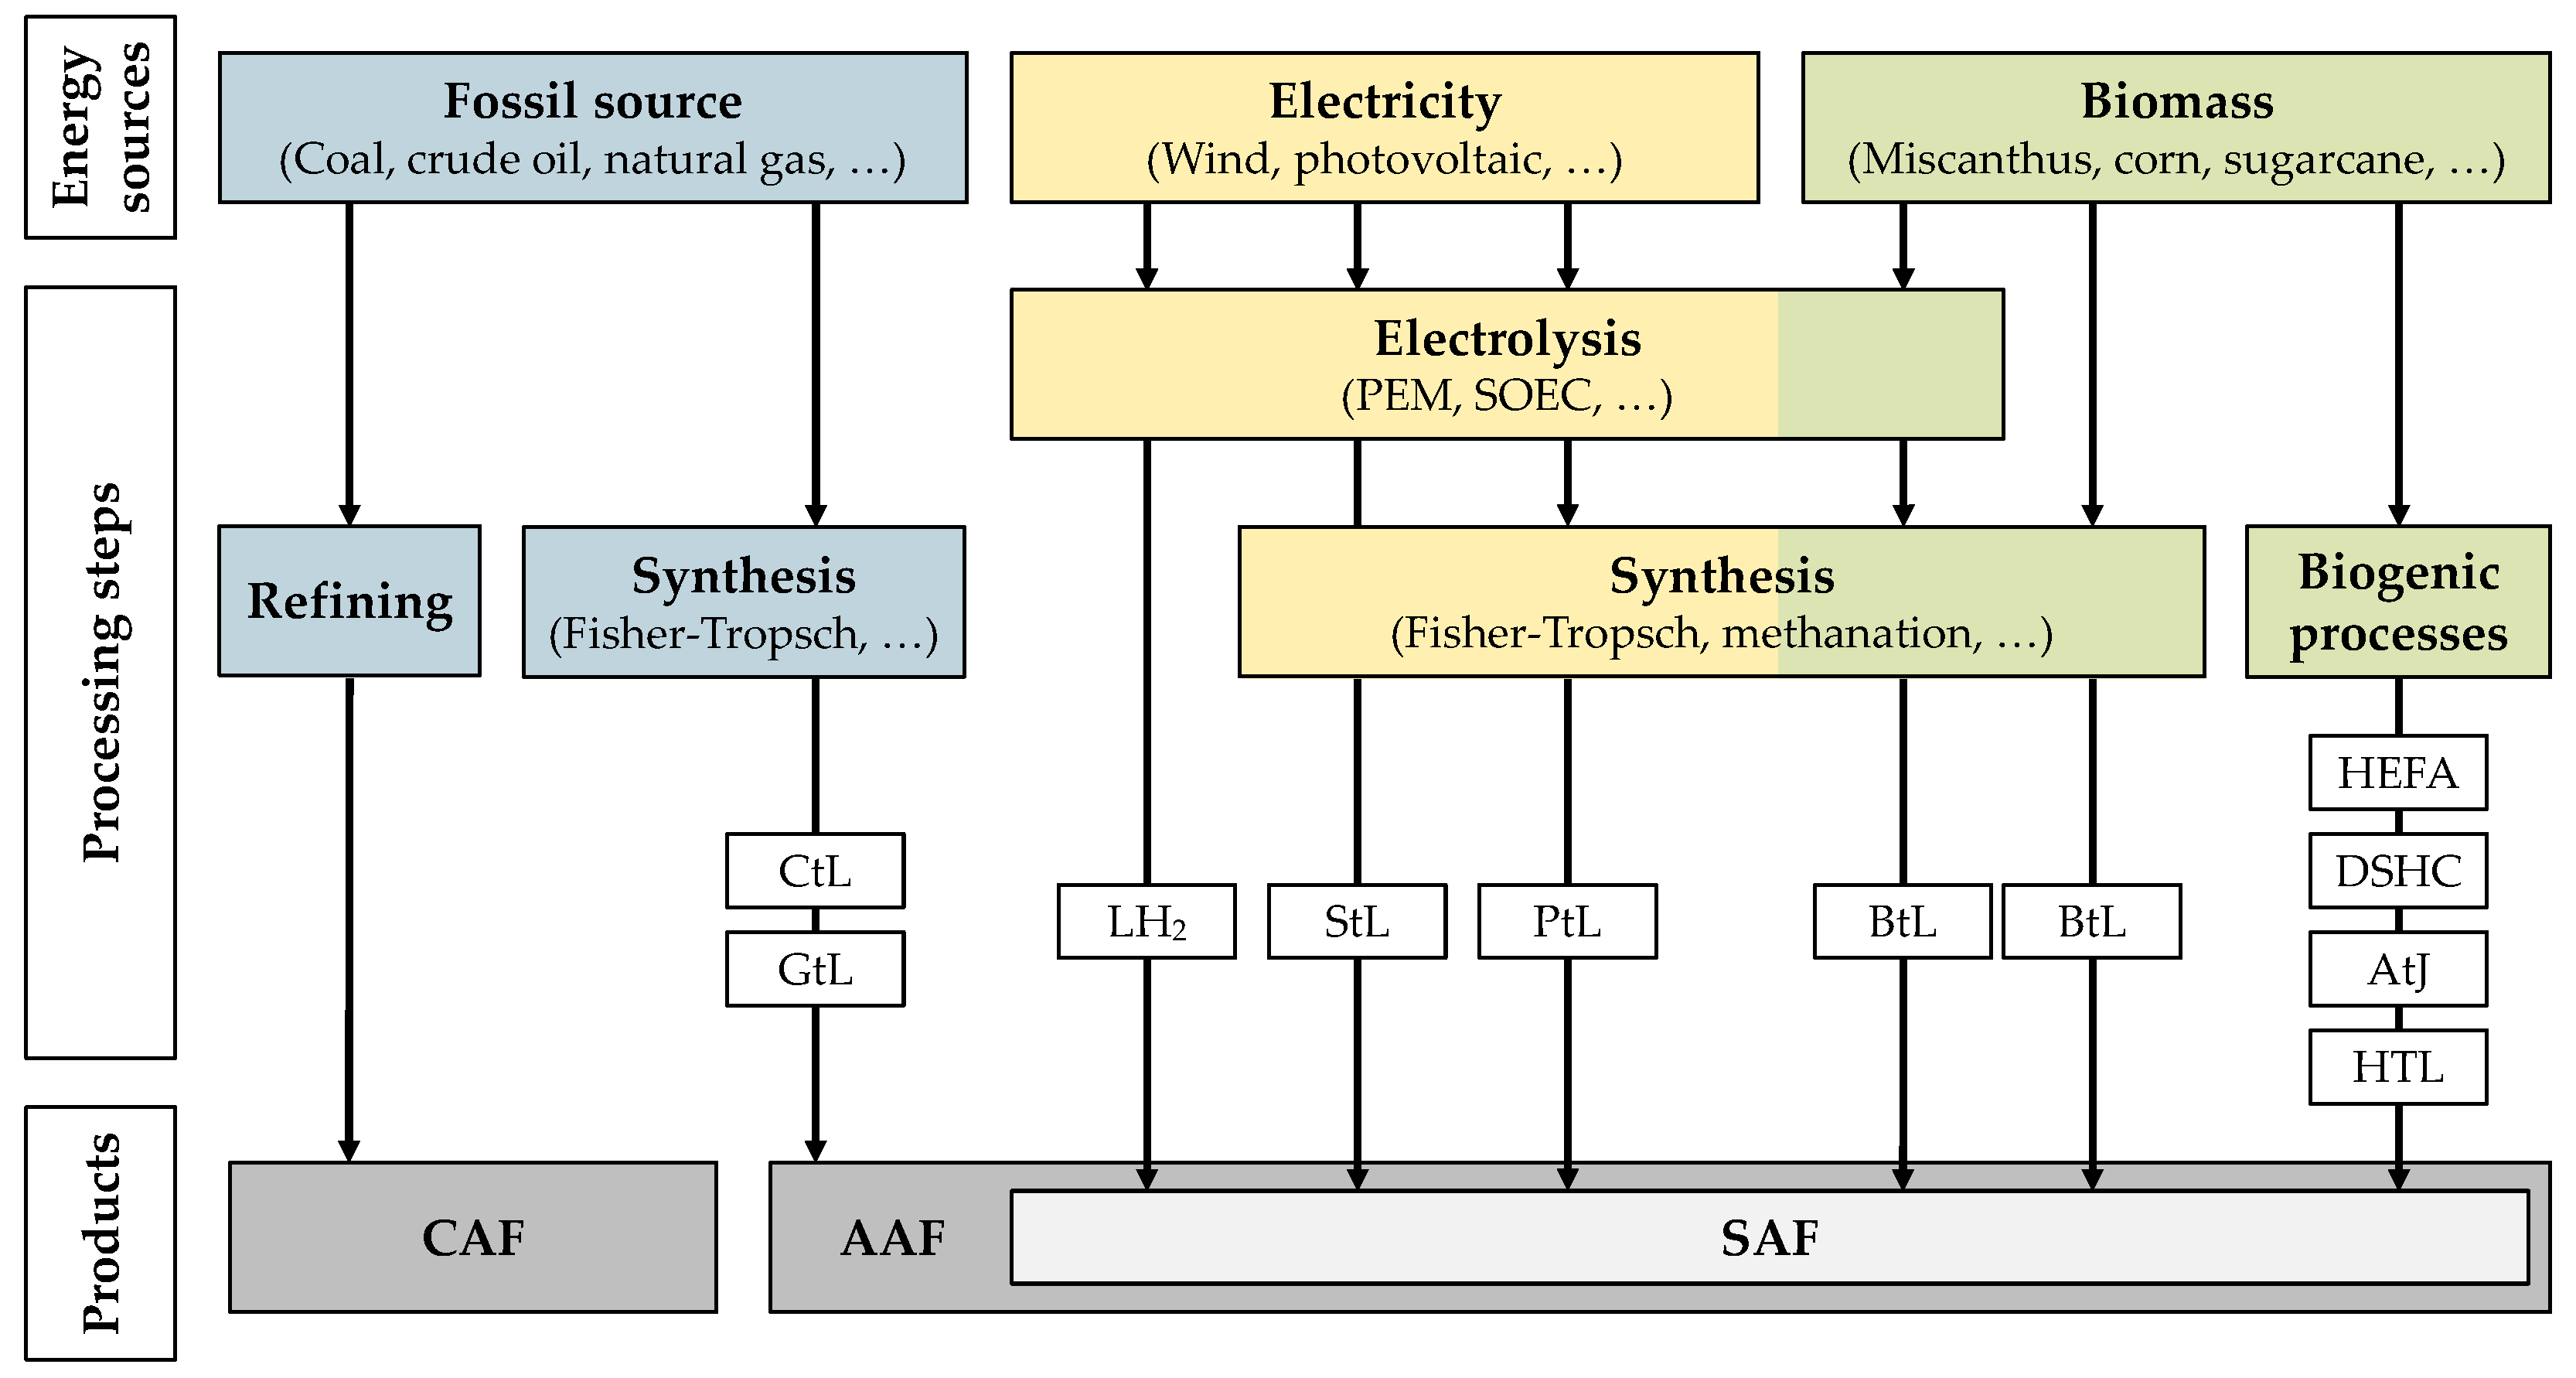
At the 2017 Conference on Aviation and Alternative Fuels, definitions in the area of turbine fuels and their production pathways were proposed. Fuels are classified as conventional aviation fuel (CAF), aviation alternative fuel (AAF), and sustainable aviation fuel (SAF) [22,23,24]. A schematic overview of the different types of aviation fuels is shown in Figure 1.
CAFs are aviation fuels derived entirely from petroleum sources (e.g., crude oil, liquid natural gas condensates, heavy oil, or oil sands) produced by refinery processes. A typical CAF is the conventional Jet-A1 fuel. In contrast to CAFs, AAFs are derived from sources other than petroleum. These sources can be renewable or non-renewable (e.g., biomass, natural gas, electricity, or hydrogen). Fuels based on renewable sources within AAFs are referred to as SAFs [22,23]. AAFs initially included all alternatives to fossil kerosene. At this point, however, a distinction can be made between drop-in fuels and non-drop-in fuels [25]. While drop-in fuels can be blended with fossil kerosene or replace it completely without changing the current powertrain structure, non-drop-in fuels (e.g., liquid hydrogen (LH2)) require extensive modifications to the powertrain. These structural changes to the powertrain require longer development phases and are cost-intensive. Therefore, drop-in capable fuels in particular are considered promising AAFs to contribute to sustainable aviation in the short term.
Drop-in AAFs are mostly produced by X-to-liquid pathways [25,26,27], where the X stands for the underlying energy source. Potential energy sources can be gas, coal, biomass, and hydrogen. Gas-to-liquid (GtL) and coal-to-liquid (CtL) are used as pathways for producing AAFs from non-renewable sources. In contrast, biomass-to-liquid (BtL), power-to-liquid (PtL), and sun-to-liquid (StL) are potential pathways to produce alternative fuels from renewable sources, which are SAFs [22,23,25]. Different approved synthesis processes for the aforementioned pathways exist, such as Fisher–Tropsch synthesis (FTS), methanol synthesis, or methanation. FTS is the most widely used industrial process and the most commercially mature, resulting in low process costs. The first process step is the reverse water gas shift reaction, in which synthesis gas is produced using hydrogen, electricity, and CO2. This synthesis gas is converted into syncrude during the FTS, which is further processed into alternative fuel with the help of hydrocracking and the addition of hydrogen [25,28,29,30,31]. The synthesis processes are often preceded by electrolysis to generate the hydrogen required to conduct the synthesis. In addition, with regard to biomass, there are other production processes for SAFs aside from the BtL pathway. These are hydrothermal liquefaction (HTL), hydroprocessed esters and fatty acids (HEFA), alcohol-to-jet (AtJ), and direct sugar to hydrocarbons (DSHC). However, the production capacities of fuels using these processes are still small and are not considered in this study.
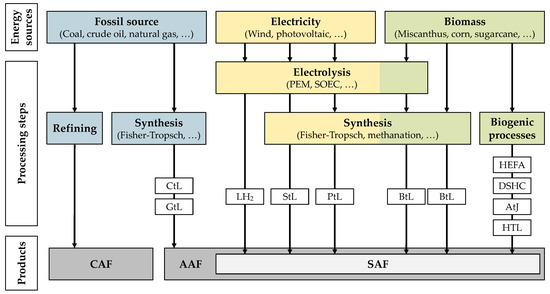
Figure 1.
Classification and production pathways of aviation fuels (adapted from [32]).
Figure 1.
Classification and production pathways of aviation fuels (adapted from [32]).
Numerous studies exist in which the negative environmental impacts of the aviation sector are analyzed (e.g., [18,24,33,34]). These studies primarily highlight that a large part of the negative environmental impacts of the aviation sector results from flight operations, or more precisely, the combustion of fossil kerosene. It is responsible for about 77–91% (depending on the type of aircraft and the mission profile) of air travel-related GHG emissions [25,33,34]. The remaining GHG emissions are generated in other phases and can be attributed to aircraft production, kerosene production, transport, and airport infrastructure. In this context, studies on alternative fuels, which replace fossil kerosene and are expected to reduce GHG emissions due to savings in production, have been increasingly conducted in recent years. Melo et al. [18], Gutiérrez-Antonio et al. [35], and Doliente et al. [36] provided comprehensive overviews of this field. Accordingly, drop-in SAFs based on biomass, also referred to as biokerosene, receive particular attention in the current literature (e.g., [19,20,24,37,38,39,40]). In the aforementioned studies, the general impact of biokerosene instead of kerosene and its production based on different feedstocks are analyzed. The existing studies show that lignocellulosic biomass (e.g., miscanthus), starch and sugar, as well as vegetable oils and fats are potential feedstocks [19]. They can be further processed using various production routes (e.g., FTS, HEFA, HTL, AtJ, or DSHC) [19,20].
Using these BtL pathways, reductions in GHG emissions of 63–89% in a well-to-wake perspective are achievable compared with fossil kerosene [20,37]. These reductions depend highly on the underlying electricity mix in the production. If the biokerosene is produced based on the current electricity mix, the GHG emissions are approximately 2.4 times higher than for fossil kerosene along the life cycle. Therefore, the use of electricity based on RE is an important lever to reduce climate-damaging GHG emissions [41]. In addition to GHG emissions, scientific discourse explores land use for cultivating first- and second-generation feedstocks. In this context, it has become clear that feedstocks of the second generation especially are considered promising due to low competition for the cultivation of food crops. However, the focus should be on feedstocks of the third generation in the long term [39,40]. Studies with an economic focus mainly evaluate the competitiveness of biokerosene compared to fossil kerosene, and its market penetration potential is analyzed. The analyses indicate that biokerosene has significantly higher production costs, mainly due to the higher energy demand and the resulting higher energy costs. Further improvements in the production processes are required to reduce energy consumption and improve production efficiency [24,38].
Aside from biokerosene, synthetic kerosene based on the PtL pathway is seen as a potential solution to reduce the environmental impact and for transitioning the aviation sector from fossil to renewable fuel, thereby leveraging existing aircraft systems and airport infrastructure. Synthetic kerosene based on PtL pathways produces less GHG emissions along the life cycle than fossil kerosene and consumes less land and water during production than biokerosene. However, its production is still problematic, as it is very energy-intensive. A high share of RE in the electricity mix is again required to decrease its environmental impacts. Analogous to biokerosene, the high energy demand results in higher production costs [19].
In addition to drop-in fuels, several studies exist on the sustainability aspects of non-drop-in fuels (e.g., [41,42,43,44]). Liquid hydrogen especially is of particular interest due to its advantages in terms of GHG emissions, acidification, summer smog, and eutrophication compared with fossil kerosene. However, these advantages can only be exploited if the electricity for hydrogen production comes from renewable sources, resulting again in high production costs. Since hydrogen is a non-drop-in fuel, it requires structural changes and extensive modifications of the aircraft powertrain.
The previous studies in the scientific literature mainly focus on the analysis of environmental aspects associated with the production and use of biokerosene. These are compared with fossil kerosene to analyze their potentials. However, economic aspects are only considered to a limited extent. Furthermore, there are only a few studies on synthetic kerosene, and a comprehensive comparative analysis of fossil kerosene, biokerosene, and synthetic kerosene in the well-to-wake perspective is missing in the scientific literature so far. Such a study is required to evaluate the potentials of alternative fuels compared to fossil kerosene from an environmental and economic perspective, identify hotspots along the entire supply chain, and derive recommendations for future research.
2.2. Assessment Method
Various methods for sustainability assessment were developed to assess the environmental, economic, and social impacts associated with products, processes, and supply chains. Common methods for quantification of the environmental impacts related to an object of investigation include life cycle assessment (LCA), carbon footprinting, cumulative energy demand, material flow analysis, and environmental impact assessment [45,46]. Next to the environmental assessment methods, several economic assessment methods, such as life cycle costing (LCC), techno-economic assessment, or the net present value method, are available [46,47]. Recently, the assessment of social impacts has also become increasingly important. In this context, methods such as social life cycle assessment, social sustainability evaluation, or human development analysis are used to quantify the social impacts of an object of investigation [18,46,48].
In addition to this wide range of methods for assessing specific sustainability dimensions, some approaches enable a holistic sustainability assessment of environmental, economic, and social impacts. A widely established quantitative assessment method is the life cycle sustainability assessment approach. It scrutinizes the three pillars of sustainability by merging the environmentally-oriented LCA with the economically-oriented LCC and the socially-oriented social life cycle assessment [45,49,50,51,52].
This study focuses on analyzing the environmental and economic impacts of fossil kerosene and four SAFs in the well-to-wake perspective. Social analysis is omitted due to the focus on a European supply chain configuration, in which the typically considered social risks in global supply chains, such as child labor, forced labor, or corruption, are negligible, and a meaningful analysis would not be possible.
LCA and LCC are commonly used in science and industry for the quantitative sustainability assessment of products and processes. Therefore, they are also applied for the assessment within this article.
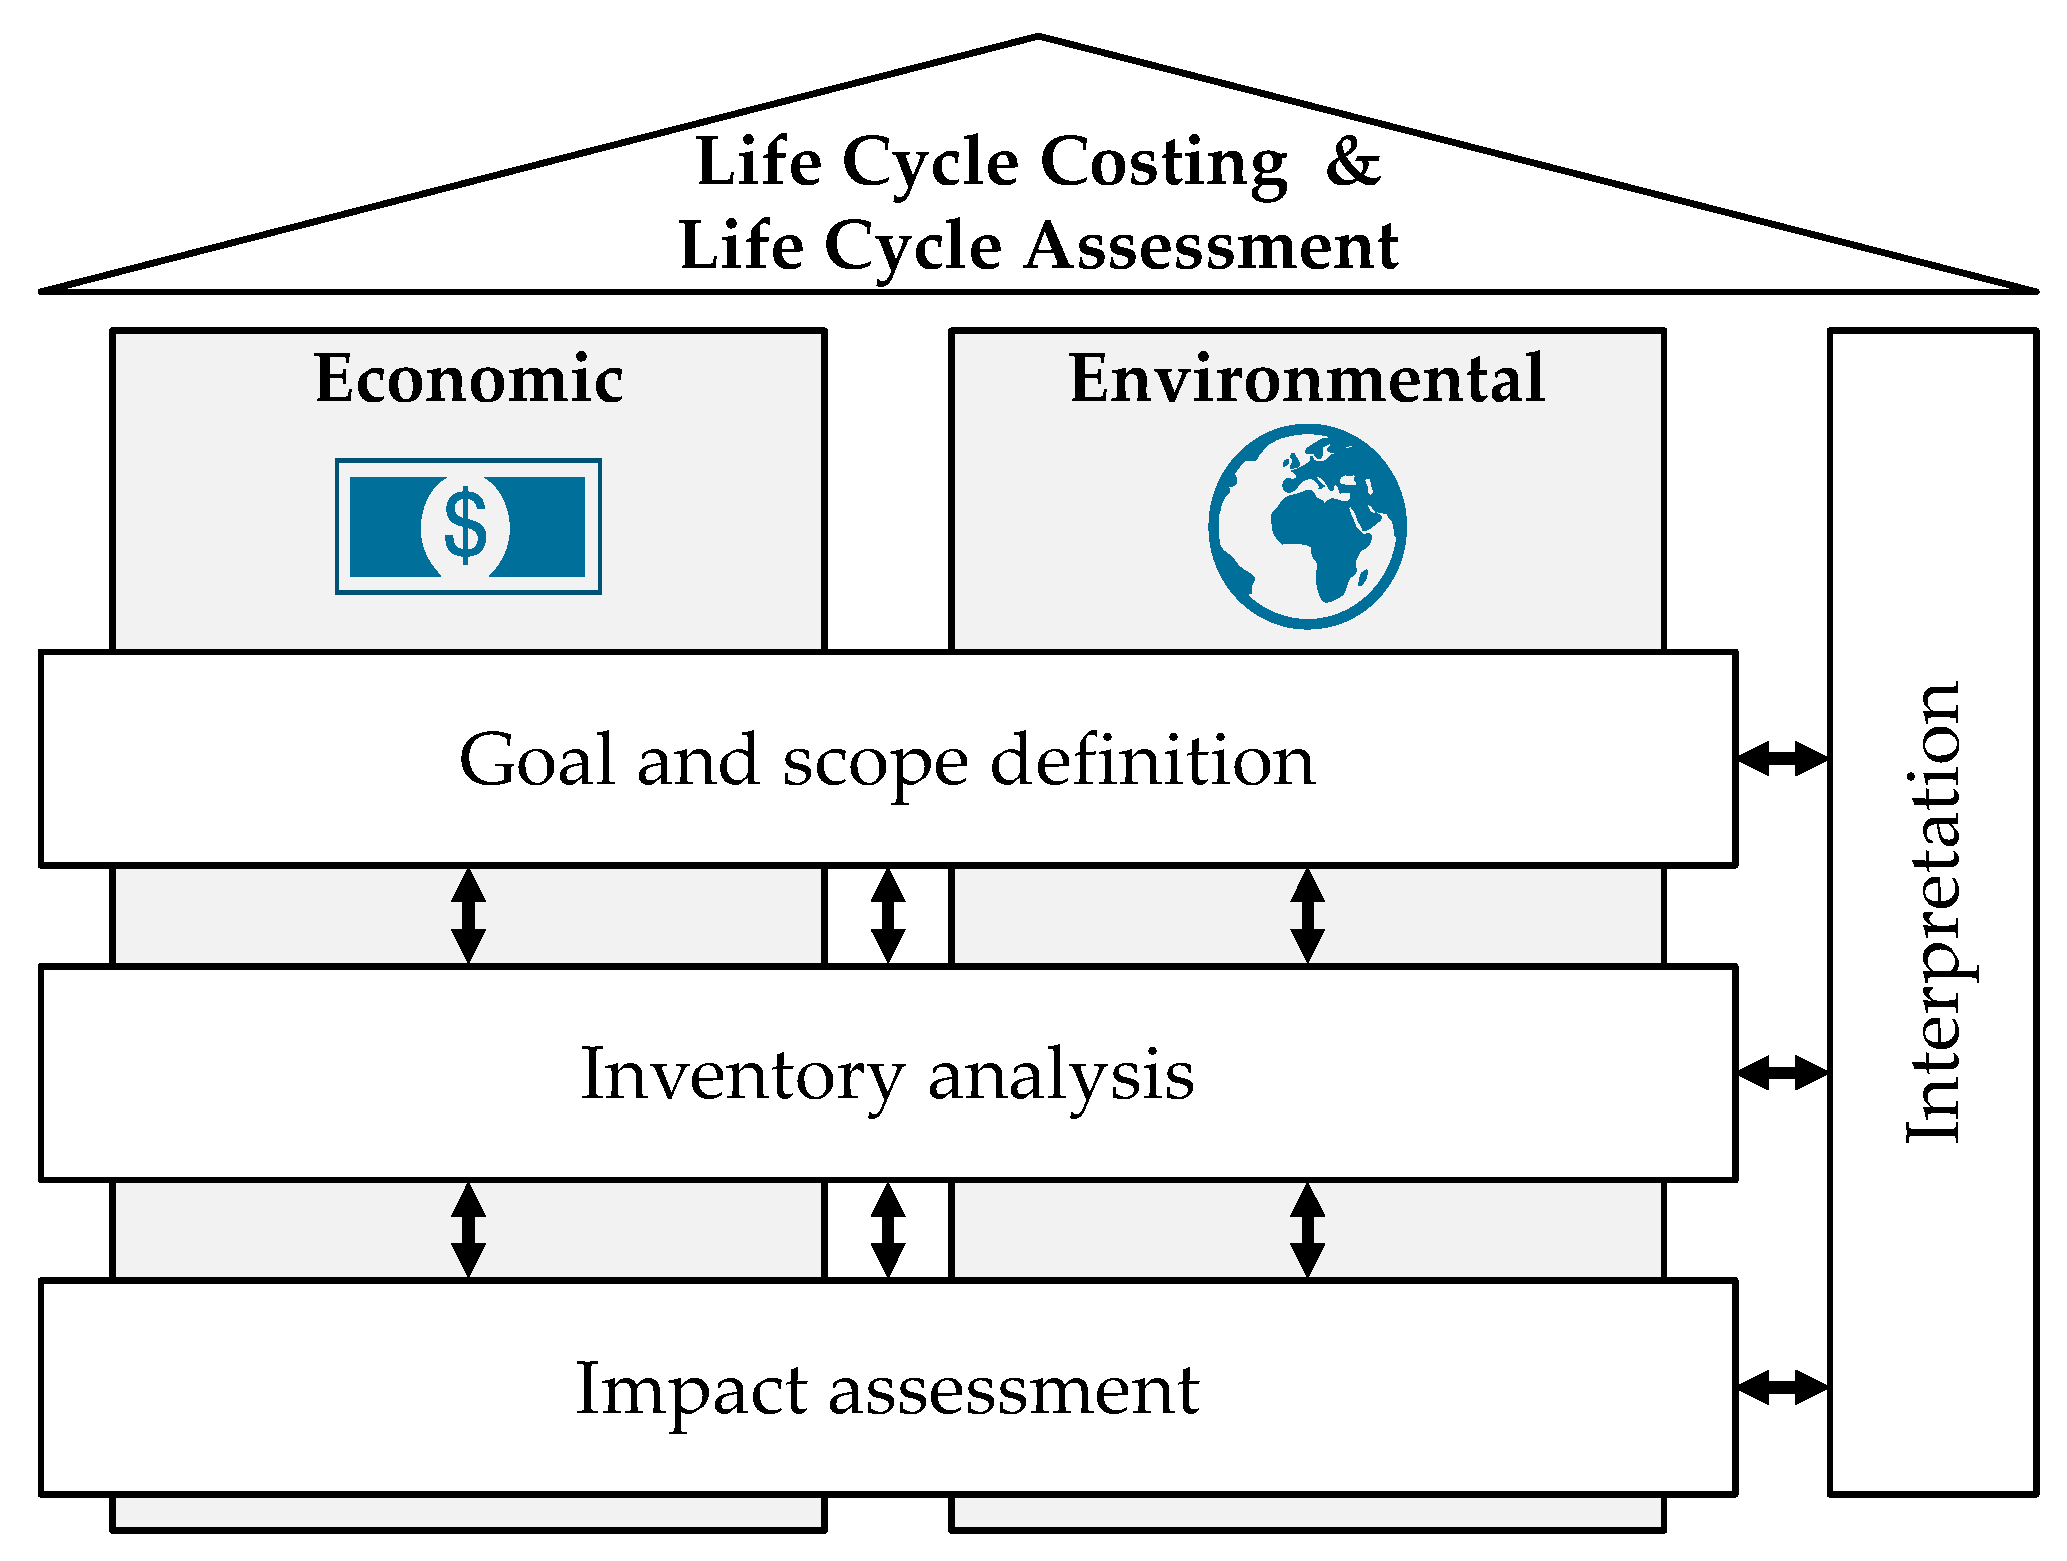
The basic procedure of the LCA and LCC is derived from the ISO 14040/14044 standards and is divided into four phases: (1) goal and scope definition, (2) inventory analysis, (3) impact assessment, and (4) interpretation [51,53,54]. The schematic procedure is presented in Figure 2.

Figure 2.
Methodology of life cycle assessment and life cycle costing.
Typical LCA and LCC start with the definition of the study’s goal and the scope, including the definition of the subject of study within the system boundaries. In addition, the functional unit is defined, establishing the reference to which all energy and resource flows are normalized. Next, inventory data describing the exchanges between the unit processes within the system under study and the external environment are collected along the life cycle. The inventory data are assigned to impact categories in the subsequent impact assessment, and the so-called impact scores are calculated. Finally, an interpretation of the assessment results is conducted, taking into account the decision makers’ preferences and enabling support for decision making. This step also accompanies the other steps and may be carried out in an iterative procedure, as new insights, data limitations, or stakeholder views can lead to a redefinition of the study’s focus, goal, and methods [51,53,54,55].
LCA addresses the environmental impacts of the system under study. The environmental interventions of all processes within the systems’ life cycle, such as extraction of natural resources, the release of emissions, or land use, are compiled in the inventory analysis phase. In the subsequent impact assessment, the results of the inventory analysis are linked to different areas of protection (human health, ecosystems, and resources). These so-called endpoint indicators are determined based on midpoint indicators, such as climate change, mineral resource depletion, or photochemical oxidant formation. The midpoint indicators are calculated via characterization factors used to quantify the impact of the environmental interventions [56,57].
LCC is used to assess the economic aspects of the system under study. It is a cost-oriented method that aims to estimate the costs associated with the existence of a product or system, taking into account externalities that are likely to be internalized in the future [58]. One common method is environmental LCC, which accounts for the costs associated with a product or system within the system boundaries. The functional unit corresponds to that of the LCA [59,60,61].
2.3. System Definition
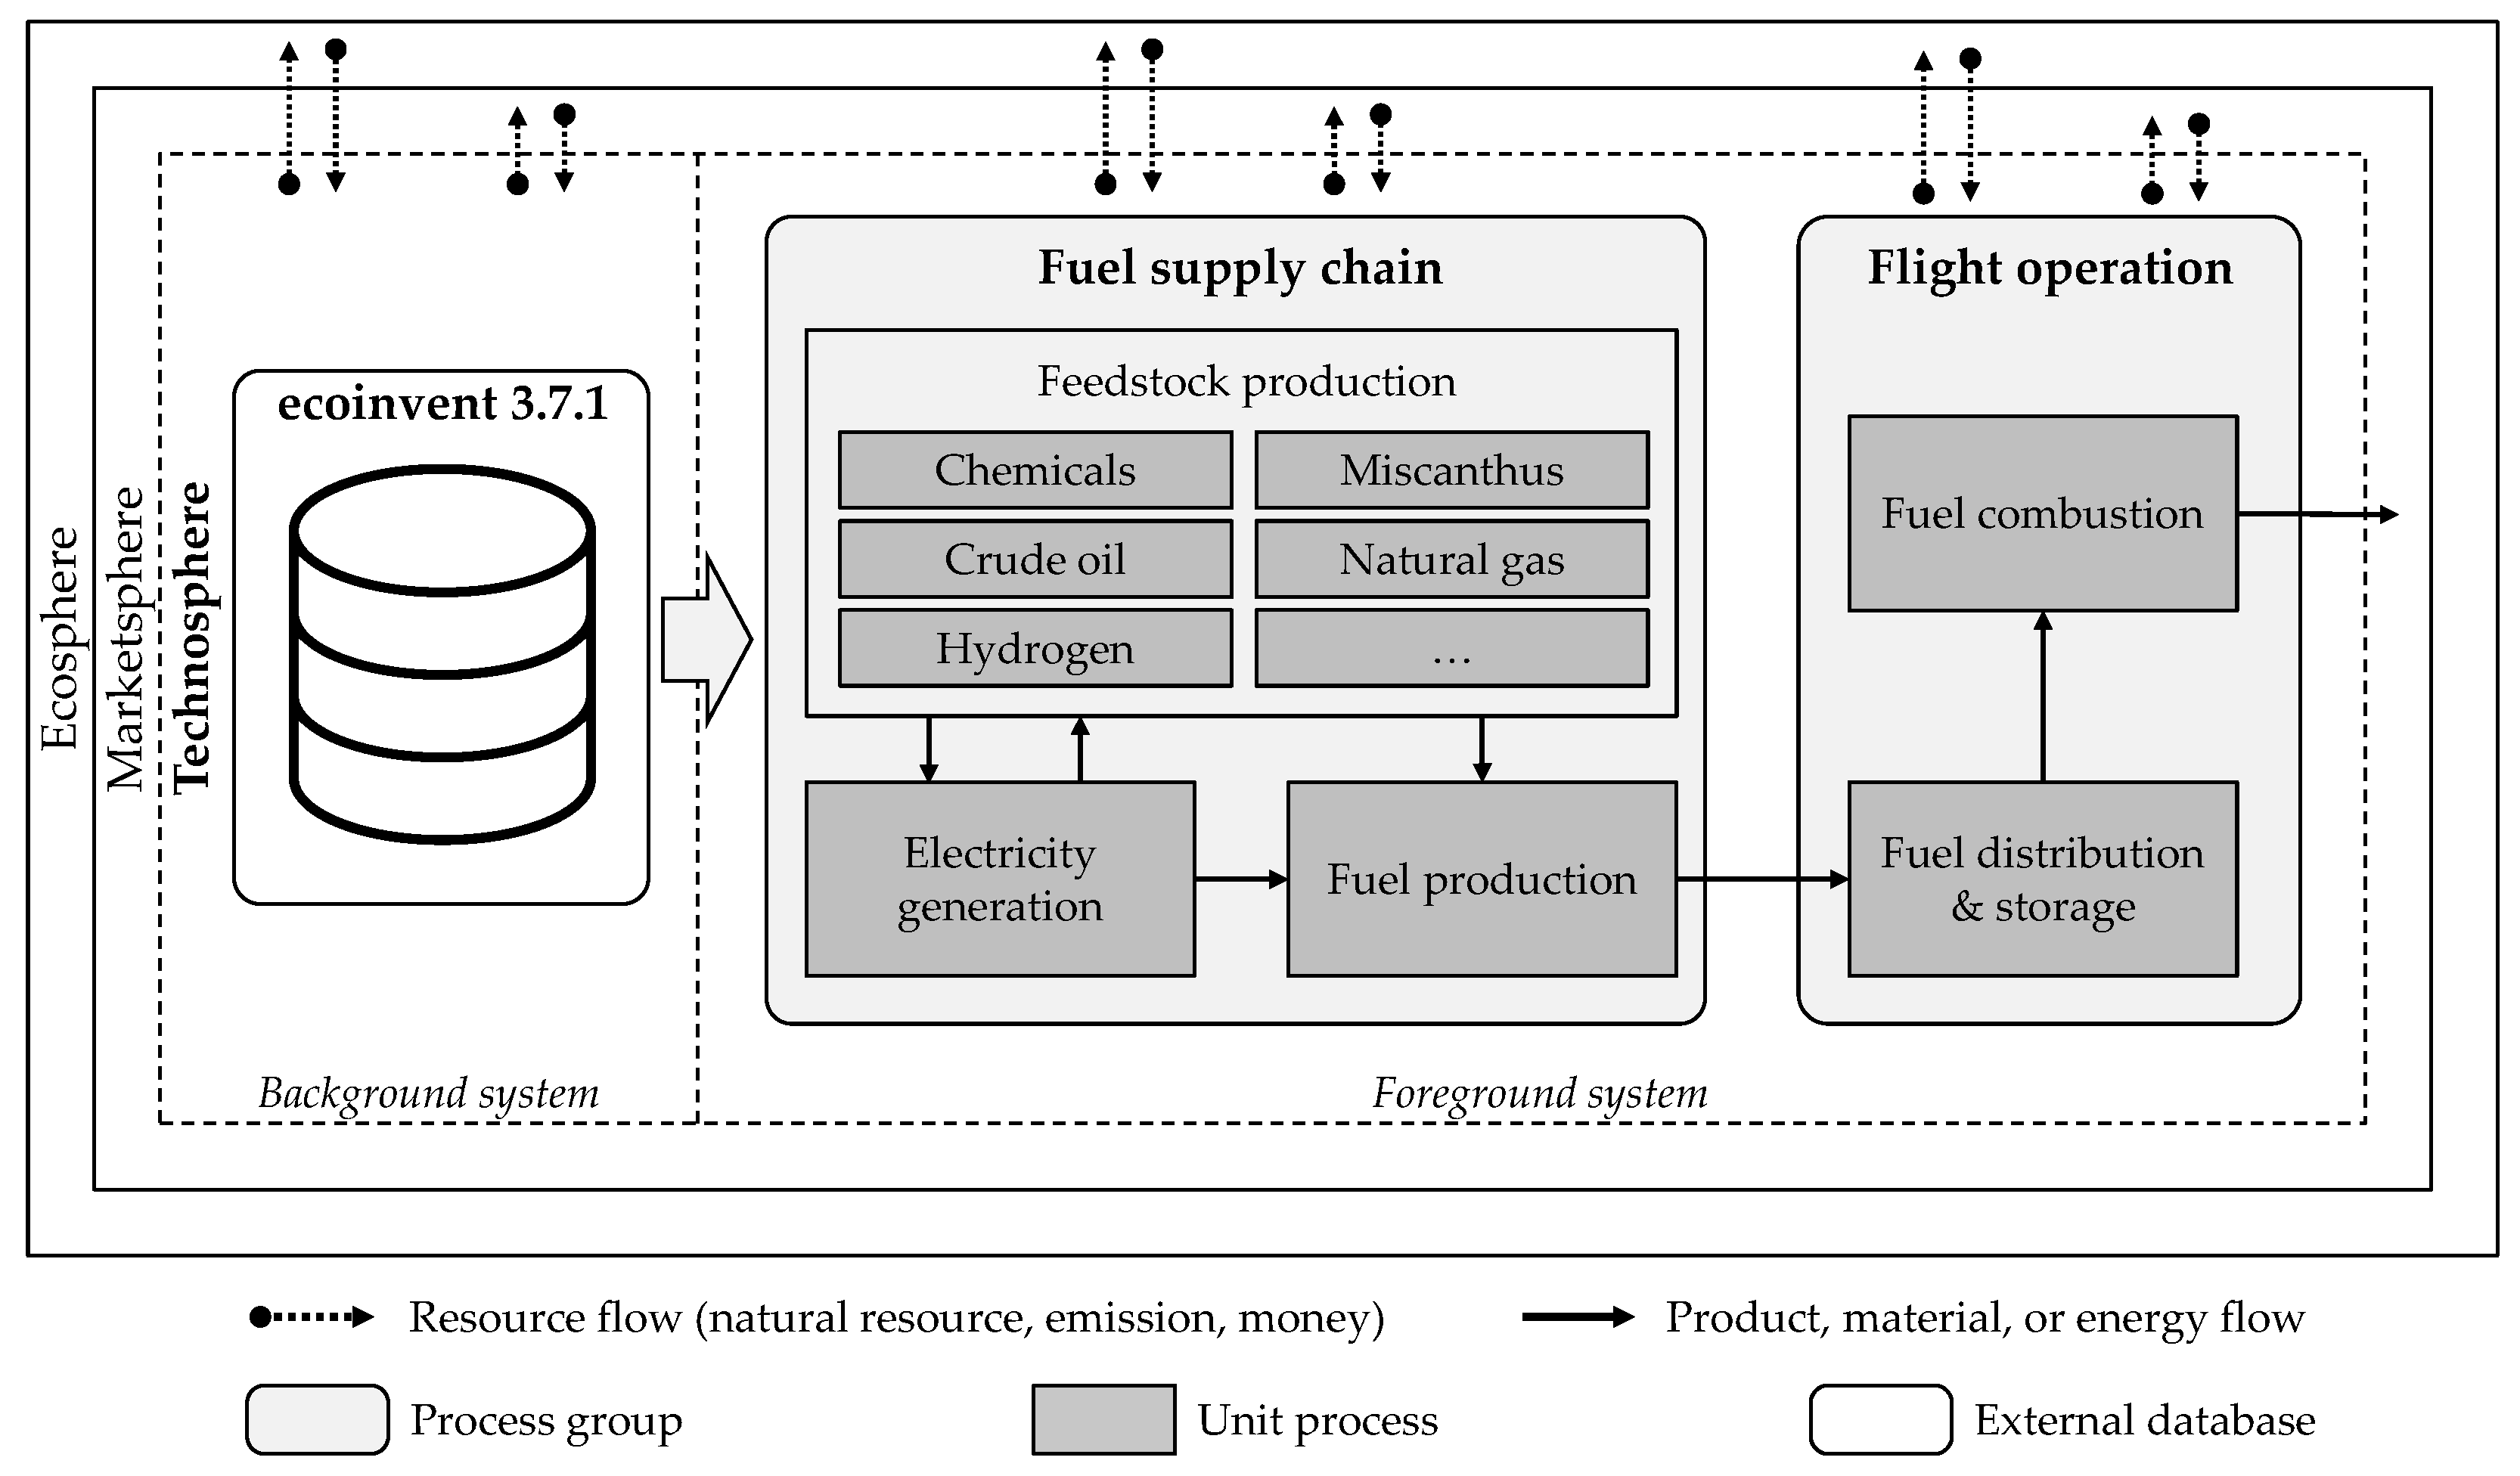
This study aims to analyze the environmental and economic impacts of medium-haul flight operations by using different SAFs compared with fossil kerosene. The analysis was conducted from a well-to-wake perspective (i.e., the underlying foreground system comprises the fuel supply chain as well as the flight operation (Figure 3)). The fuel supply chain consists of different unit processes that are related to feedstock production, electricity generation, and fuel production. The flight operation includes the unit processes related to fuel distribution and storage as well as fuel combustion in the aircraft. The foreground system is linked to version 3.7.1 of the ecoinvent database in the background system [62]. The life cycle inventories (LCIs) of the respective systems under study can be found in the Supplementary Material.

Figure 3.
Foreground and background system within the system boundaries, including exchanges between the technosphere, ecosphere, and marketsphere.
Five different types of fuel were considered in this study. These included conventional fossil kerosene as well as four types of SAFs (see Table 1). The supply chain of fossil kerosene begins with the extraction of crude oil [44]. The crude oil is further processed in a refinery by distillation processes and blending in various additives [42,43]. The crude oil is assumed to be extracted in Tyumen, Russia and further processed in a refinery in Hamburg, Germany [63]. The fossil kerosene was compared to four promising SAFs. They were produced via X-to-liquid pathways, more precisely via BtL and PtL, as their production on an industrial scale is the most researched [25,27,43]. The synthesis processes were based on FTS (Section 2.1), as this is also the most widely used method in the industry and the best researched.

Table 1.
Considered aviation fuels.
The BtL pathway focuses on biokerosene of the second generation. The feedstock is miscanthus, being cultivated in Saxony, Germany [64] and further processed in Hamburg, Germany [63]. The individual production processes include biogas production, which is refined to biomethane by adding various additives, and then processing to hydrogen via steam methane reforming (SMR). In the subsequent production step, the biokerosene is produced using FTS [36].
Concerning the PtL pathway, three types of synthetic kerosene based on hydrogen were investigated [65]. They differ in terms of hydrogen production. Regarding the first synthetic kerosene, hydrogen is produced via the SMR process but by using natural gas, electricity, and water instead of biomethane [66]. The other two production pathways are based on hydrogen production via electrolysis. For this purpose, polymer electrolyte membrane electrolysis (PEM) and solid oxide electrolysis (SOEC) were used. In the PEM process, hydrogen is produced in an energy-intensive production step exclusively from water (55 kWh electricity input per 1 kg of hydrogen) [67]. The SOEC process works similarly, but in addition to water and electricity (36.8 kWh electricity input per 1 kg of hydrogen), a small amount of natural gas is required [68]. The hydrogen is processed to kerosene using FTS. The whole synthetic kerosene production process takes place in Hamburg, Germany [63].
The transports were included for all feedstock materials and further processed fuels. The transport distances to the refinery are covered by pipelines based on the European pipeline network [69]. Final transport to the airport is conducted by trucks. The distances for road transport were determined via the Searates website (www.searates.com (accessed on 1 October 2021)). At the airport, storage takes place in tanks. The energy demand for producing the fossil kerosene and the four types of SAFs were obtained from the scientific literature and industry data [36,66,67,68]. The production costs were calculated based on the energy demand during production, the country-specific electricity price, and the scientific literature concerning the cost of SAF production [19,38,66,67,68].
For analysis of flight operation, a reference flight over a distance of 2000 km with a load of 160 passengers, including luggage, was considered. This corresponded to a flight from Frankfurt am Main, Germany to Moscow, Russia. The flight lasted 185 min, with a take-off and climb time of 45 min and a cruise and landing time of 140 min. The functional unit for the analysis was 100 pkm traveled on a 2000 km medium-haul flight with a load of 160 passengers, including luggage.
According to the Lufthansa Group, such a flight consumes 4.12 L of kerosene (specific energy of 39.2 kWh) per 100 pkm [70], representing the fuel consumption within this study. The combustion behavior of the fuels and the resulting emissions were derived from the scientific literature [71,72].
The impact assessment within this study was based on two life cycle impact assessment methods: one for each considered sustainability dimension. As a common method of environmental assessment, the ReCiPe Midpoint method is used [57], and a life cycle cost-based approach is used for the economic assessment [59].
Seven impact categories were analyzed for the environmental assessment (see Table 2). Based on the objectives of the Flightpath 2050 strategy, these were climate change (CC) and photochemical oxidant formation (POF) as well as, due to health-related impacts, particulate matter formation (PMF) and human toxicity (HT). In addition, fossil resource depletion (FRD) was analyzed, since raw materials such as crude oil and natural gas are of fossil origins and fossil energy carriers are often used to generate electricity. Agricultural land occupation (ALO) and mineral resource depletion (MRD) were analyzed regarding the use of agricultural land to cultivate bio feedstocks and the need for mineral resources to build refinery and synthesis plants. For the economic assessment, the costs associated with the fuel supply chain and flight operation were assessed. These costs are referred to as life cycle costs (LC). Revenues were not considered as they were mainly determined by the airline’s pricing strategy and were not directly related to the fuel used.
Table 2.
Environmental and economic impact categories.
The calculation model for the inventory analysis and impact assessment was implemented in Python using the Brightway2 framework [73].
3. Results
3.1. Overview of Impact Assessment Results
An overview of the environmental and economic assessment results is provided in Table 3. The lowest scores in each impact category are highlighted in bold. As described in Section 2.3, the use of the four SAFs compared to fossil kerosene was investigated on a medium-haul flight of 2000 km. The assessment results are presented concerning the functional unit of 100 pkm.
Table 3.
Environmental and economic assessment results of the aviation fuels used for flight operation regarding the functional unit of 100 pkm traveled.
The aggregated results show that deployment of the investigated SAFs instead of fossil kerosene could reduce some of the environmental impact scores (CC, FRD, and HT) but was also associated with higher environmental impacts in other categories (PMF, ALO, POF, and MRD) as well as substantially higher LC.
Overall, the analysis of the environmental impact categories shows that the use of SAFs would be advantageous, especially regarding the reduction of climate-damaging and health-damaging emissions, but fossil kerosene could also be advantageous over SAFs due to their higher impact scores in other impact categories. For example, the high impact scores regarding ALO can be explained by the demand for land to cultivate the feedstock for biokerosene and the extraction, processing, and final conversion of lignite, hard coal, and wood chips to electricity, of which a high amount is required to produce synthetic kerosene (PEM and SOEC).
Concerning the economic impact of LC, it is evident that SAFs cannot yet achieve market penetration. The use of synthetic kerosene (PEM and SOEC) results in particularly high LC which exceed those of fossil kerosene by 786% and 588%, respectively. Economically semi-competitive is the use of biokerosene (SMR) and synthetic kerosene (SMR) which, however, lead to 196% and 149% higher LC, respectively. The key drivers of environmental and economic impacts are analyzed in more detail in Section 3.2 and Section 3.3.
3.2. Detailed Analysis of the Environmental Impacts
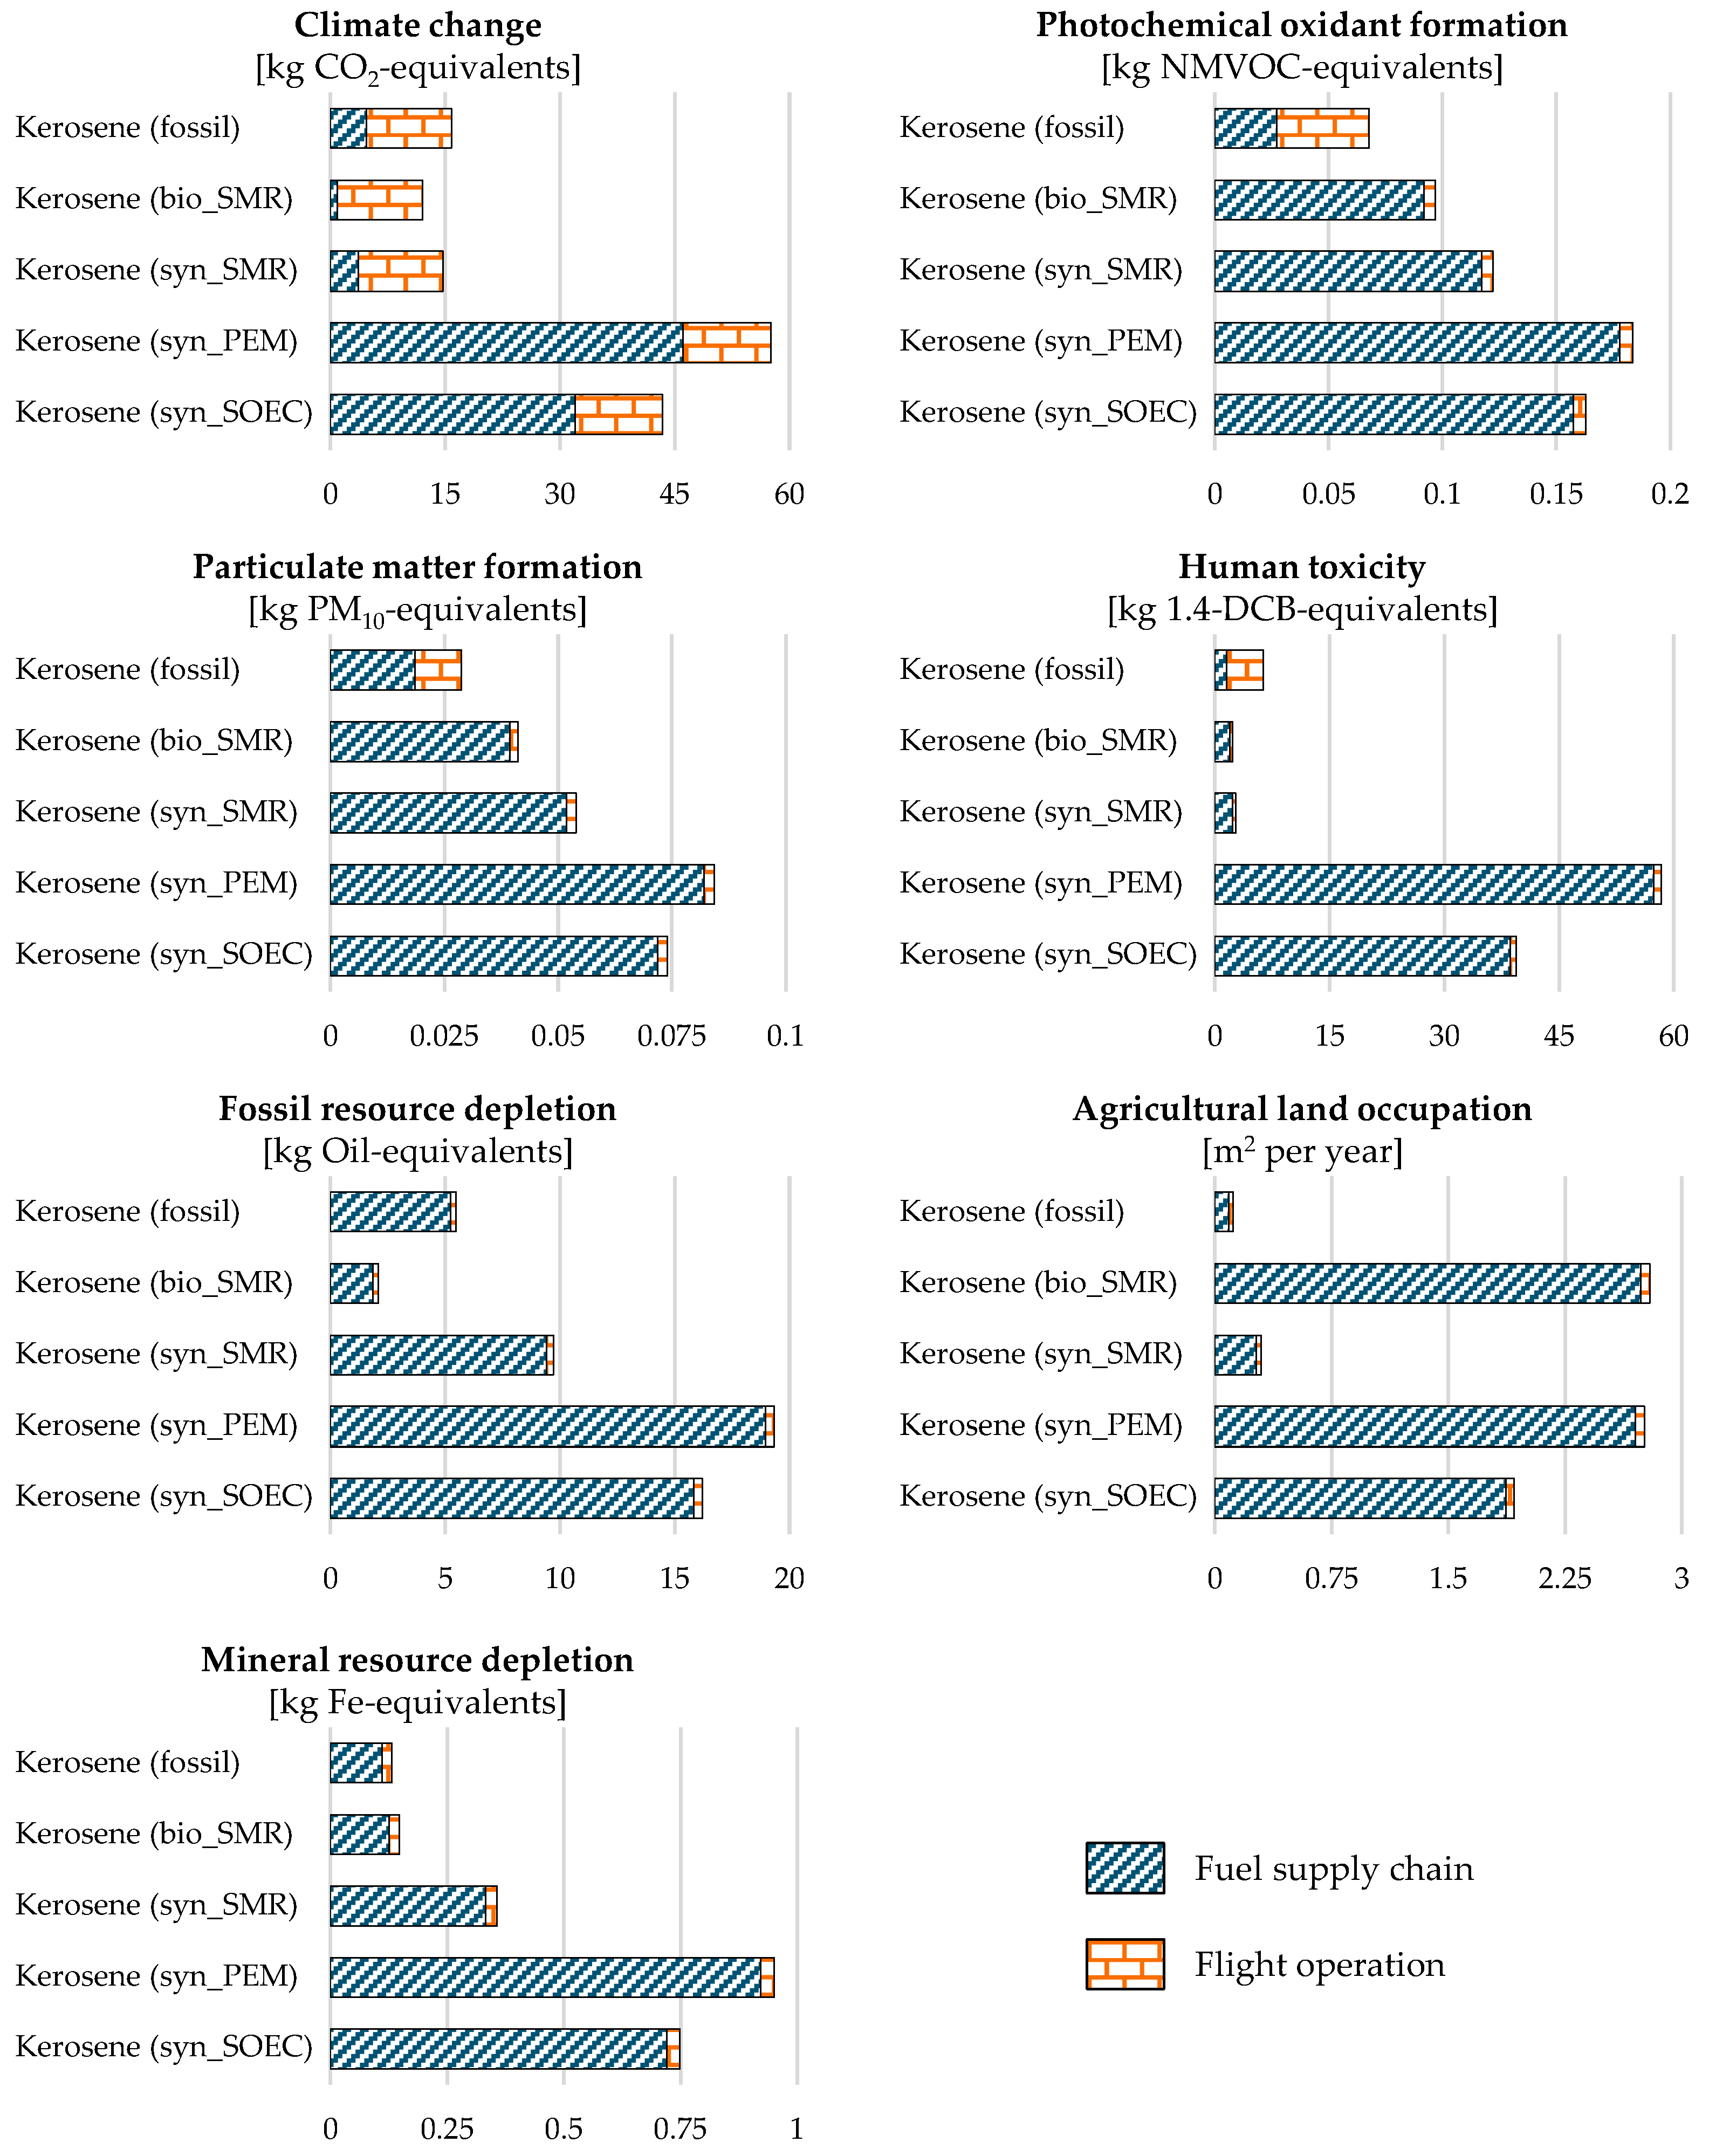
In the following, the environmental impact scores of fossil kerosene and the SAFs are investigated further. For this purpose, the total impacts are split into the shares associated with the fuel supply chain and flight operation, and the key drivers of the impacts are analyzed. Figure 4 indicates that the fuel supply chain was mainly responsible for a majority of the environmental impacts. In terms of SAFs, these were the main driver of environmental impacts for six of the impact categories analyzed (POF, PMF, HT, FRD, ALO, and MRD), accounting for 83–98% of the total impacts; however, the causes varied.

Figure 4.
Comparison of environmental impacts per 100 pkm for SAFs and fossil kerosene and a breakdown of the impact scores regarding the fuel supply chain and flight operation.
Regarding biokerosene, between 83% (HT) and 98% (ALO) of the environmental impacts resulted directly from the fuel supply chain, while for ALO, this was mainly due to the cultivation of miscanthus (responsible for 94%), and the large environmental impact for PMF, POF, and FRD was mainly due to FTS. During the FTS process, a large amount of emissions, including sulfur dioxide, volatile organic compounds, and particulate matter smaller than 10 µm, was released, accounting for 92% (PMF) and 90% (POF) of the impacts. Regarding FRD, FTS was responsible for 46% of the total impact. In addition, 43% of the results were from the upstream chain of the required hydrogen, which included the production of biogas as well as the refining to biomethane. This also applied to HT and MRD, where the upstream chain of hydrogen was responsible for 80% and 55% of the impacts, respectively. The main reason for this was the energy demand during these production steps.
For synthetic kerosene (SMR), the fuel production using FTS was predominantly responsible for 86% (HT) up to 97% (PMF and POF) of the environmental impacts. For ALO, HT, and MRD, this was mainly due to the chemicals required for gas purification and their upstream chains, which accounted for 56–76% of the total impacts. In addition, production of the required hydrogen was generally responsible for 7–26% of the environmental impacts of ALO, HT, and MRD. The situation was different when it came to FRD, where 76% of the environmental impact could be attributed to the required natural gas for hydrogen production. Its extraction and processing were responsible for 71% of the total impact. Concerning the impact categories of PMF and POF, the process of FTS itself was responsible for 81–88% of the total impacts. This was due to the emissions resulting from the FTS, such as sulfur dioxide, volatile organic compounds, and particulate matter smaller than 10 µm.
Regarding synthetic kerosene (PEM and SOEC), which performed the worst in all impact categories except ALO, the high energy demand during production was always responsible for the negative environmental impacts. Thus, between 36% (POF) and 96% (HT) of the total impacts could be attributed to the energy demand in hydrogen production. This was mainly due to the composition of the electricity mix, which at the current time still consists of almost 50% fossil and non-renewable sources [74]. Thus, the extraction, processing, and final conversion of lignite, hard coal, and wood chips into electricity is a significant driver of the environmental impacts.
An exception to this was the impact category CC where, in addition to the fuel supply chain, flight operation had a significant impact. For biokerosene and synthetic kerosene (SMR), it was responsible for 93% and 76% of the total impact, respectively. This was due to the GHGs resulting from combustion, such as CO2, of which about 2.5 kg were emitted per liter of fuel burned. In the case of synthetic kerosene (PEM and SOEC), the absolute amount of GHGs emitted during the combustion of the fuels was almost identical. Yet, only 20–26% was attributable to flight operation. As discussed previously for other impact categories, this was due to the high energy demand in hydrogen production and the composition of the electricity mix. Large amounts of GHGs were released during the extraction, processing, and conversion of fossil, non-renewable feedstocks to electricity. Although CO2 is also consumed in FTS, fuel production using FTS was responsible for 74–80% of the CC impacts.
In the case of fossil kerosene, the fuel supply chain was mainly responsible for the impacts in four of the seven environmental impact categories analyzed. Concerning FRD, ALO, and MRD, it was responsible for 74–96% of the total impacts. Crude oil extraction was the primary driver of the impacts in all cases, accounting for 46–83% of the impacts. In the case of PMF, fuel production (64%) and especially crude oil extraction were the main drivers of the impacts, but 36% of the impact was also attributable to flight operation and the particulate matter emitted during this process. Flight operation had an even higher share in the impact categories POF (60%), CC (70%), and HT (77%). The GHGs, particulate matter, and NOx emitted during the combustion of fossil kerosene drove the impacts.
Overall, the analysis shows that the fuel supply chain was the primary driver of the environmental impacts of SAFs. In addition, energy-intensive production processes and the demand for fossil sources in electricity generation were often responsible for making them disadvantageous to fossil kerosene in some cases.
3.3. Detailed Analysis of the Economic Impact
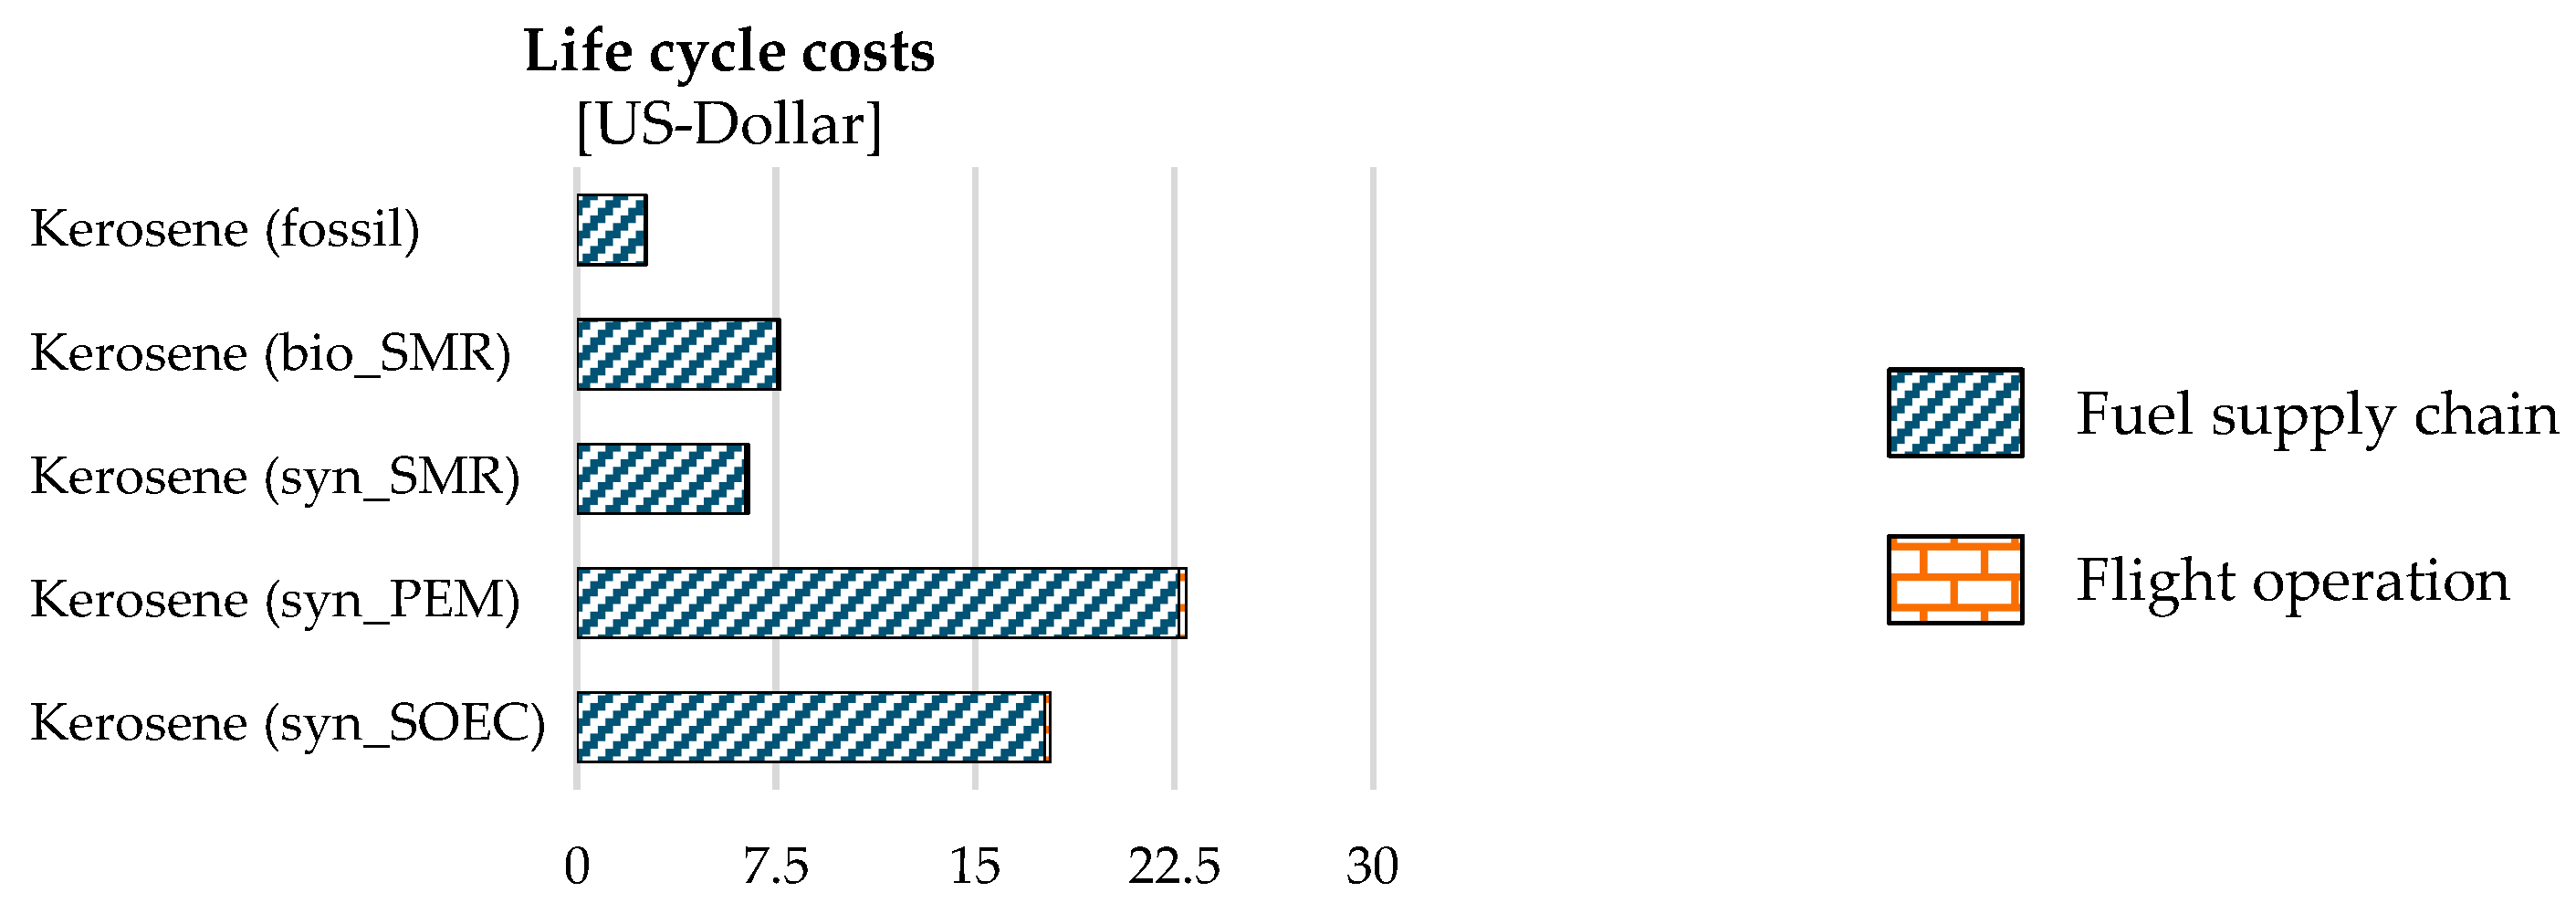
The following section investigates the economic impacts of fossil kerosene and SAFs in more detail. Analogous to the previous section, the total impacts are split into the shares associated with the fuel supply chain and flight operation (Figure 5), and the key drivers of the impacts are analyzed.
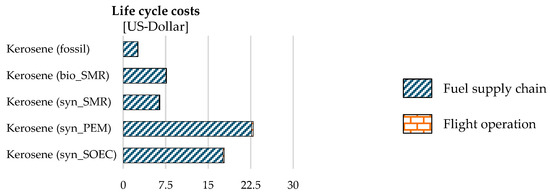
Figure 5.
Comparison of the life cycle costs per 100 pkm for SAFs and fossil kerosene and breakdown of the impact scores regarding the fuel supply chain and flight operation.
With LC of around USD 2.59 per 100 pkm, fossil kerosene ranked best among the alternatives. The LC of all SAFs considered in this study were between 149% and 786% higher than the fossil variant. In general, the main contributor in the case of all fuels was the fuel supply chain. This was responsible for around 98–99% of the total impact, while flight operation was responsible for 1–2%. Due to the more mature and industrially implemented production processes, the LC of fossil kerosene were significantly lower than for SAFs. Although the fuel supply chain was mainly responsible for the LC with about 98% of the total impact, this corresponded to costs of just USD 2.53 per 100 pkm, significantly lower than the SAFs. The main driver of LC for fossil kerosene was the processing of crude oil into kerosene, which accounted for about 66% of LC. Only 2% of the total LC resulted from the distribution of fossil kerosene and its storage at the airport.
The most promising SAFs concerning economic impacts were biokerosene and synthetic kerosene (SMR), with LC of USD 7.66 per 100 pkm and USD 6.34 per 100 pkm, respectively. This was due to the significantly higher costs of USD 7.56 for biokerosene and USD 6.34 for synthetic kerosene in the fuel supply chain. In the case of biokerosene, these resulted primarily from miscanthus cultivation, gasification to biogas, and the subsequent production of biomethane, which was used as feedstock for the SMR. In total, about 62% of the LC could be attributed to this. In the case of synthetic kerosene (SMR), a large part of the LC could be attributed to the upstream chain of natural gas, which was required as feedstock for the SMR and was responsible for 54% of the LC.
From an economic perspective, SAFs based entirely on renewable sources performed the worst. Synthetic kerosene (PEM and SOEC) had the highest LC at USD 22.94 and USD 17.82 per 100 pkm, respectively. Here, hydrogen production was the main driver, accounting for 87% and 83% of the total LC, respectively. More precisely, most of the costs were related to energy demands, which were particularly high at 55 kWh and 38 kWh per kg hydrogen, respectively, and an electricity price in Germany of USD 0.21 per kWh. At the current market maturity of industrial hydrogen production based entirely on renewable sources, synthetic kerosene (PEM and SOEC) is not competitive from an economic perspective.
Overall, the economic analysis shows that SAFs are not yet competitive with fossil kerosene. Without political measures (e.g., substitution, subsidy programs, or tax measures for non-SAFs), airlines will maintain their preference toward the less expensive fossil fuels.
3.4. Influence of Using Electricity Based on Renewable Energy in Production
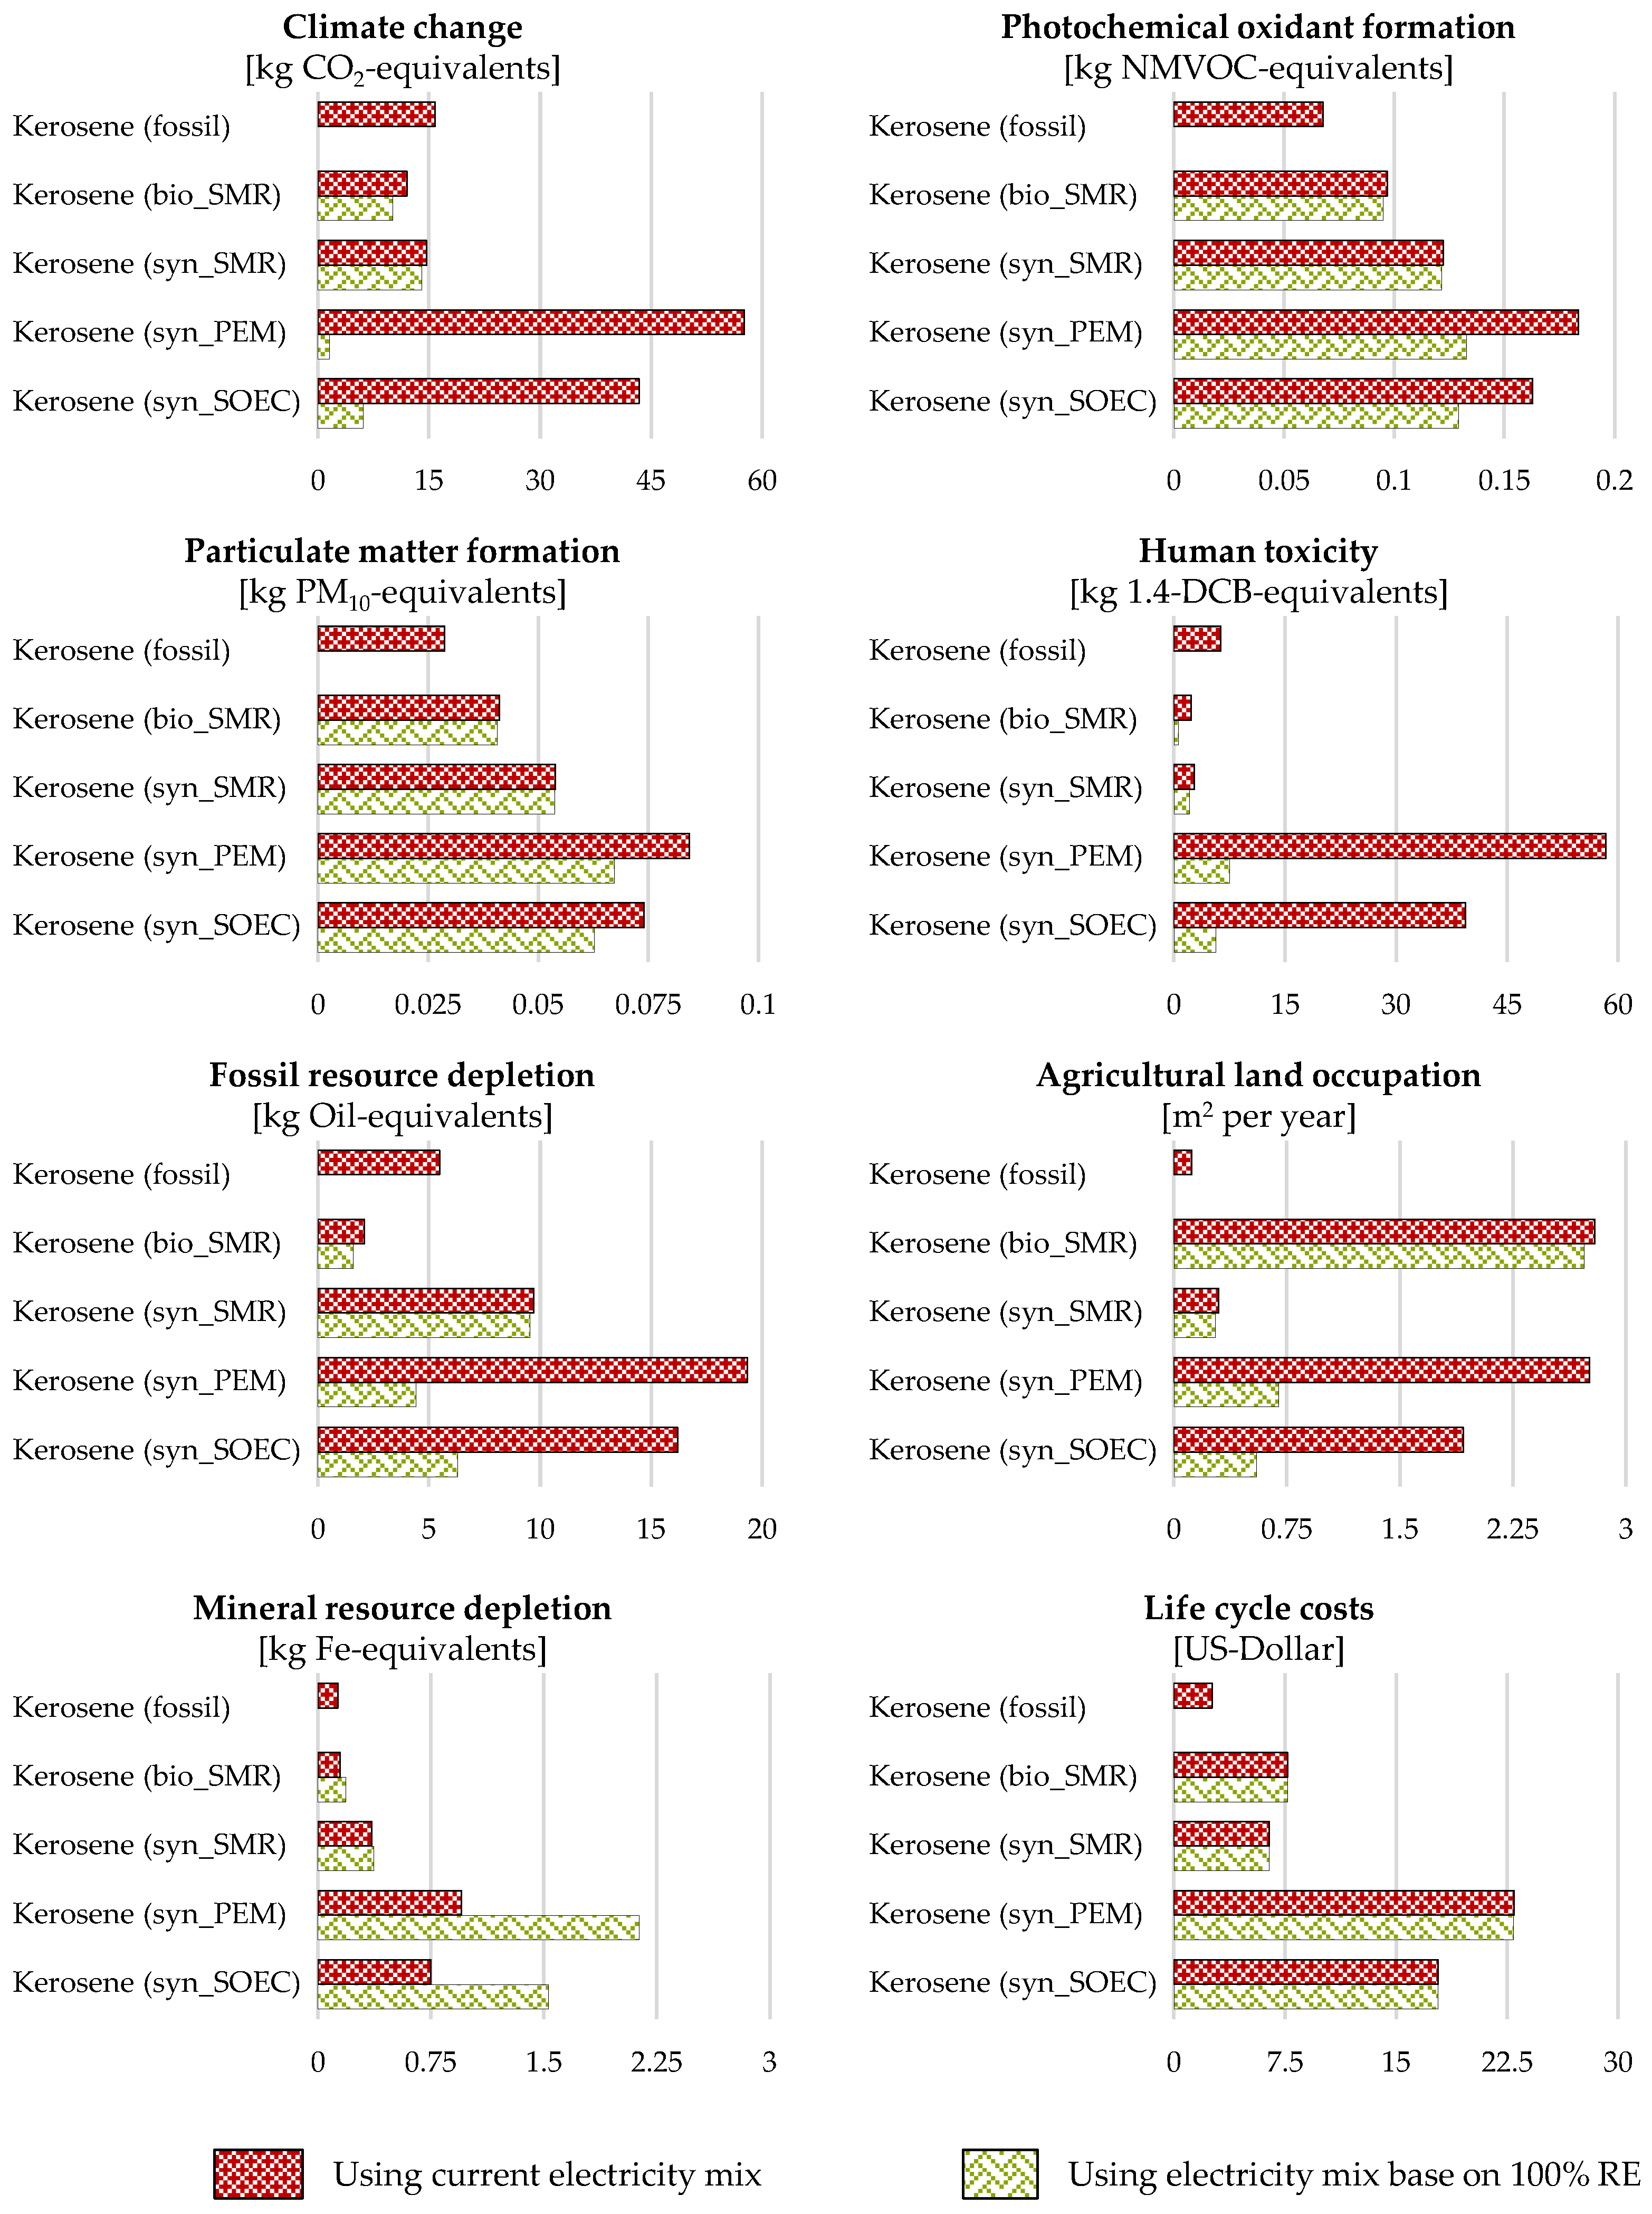
The previous analyses show that fossil kerosene was advantageous over SAFs concerning economic impacts and, to some extent, also concerning environmental impacts. The economic competitiveness of SAFs can be improved primarily through improved large-scale industrial production processes, which need to emerge over time. However, SAFs are already partially advantageous in terms of environmental impacts. The analyses show that the energy demand and the fossil source-based electricity mix were often mainly responsible for negative impacts. The use of an electricity mix based on 100% RE could lead to a further reduction in the environmental impacts of SAFs. This is investigated in the following. For this purpose, the electricity required in the fuel supply chain was replaced by an electricity mix based on 100% RE. This electricity mix was modeled based on Jacobson et al. [75], who forecasted the electricity mix for the year 2050. The additional LCIs of the scenarios can be found in the Supplementary Material. A comparison of the environmental and economic impacts of the two scenarios is presented in Figure 6. In the following, the addition of “-RE” indicates energy carriers produced with renewable energy.
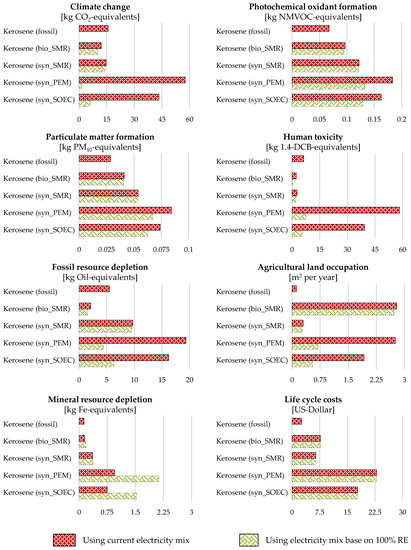
Figure 6.
Comparison of the environmental and economic impacts per 100 pkm using the current electricity mix and an electricity mix based on 100% RE in the fuel supply chain of SAFs.
In terms of environmental impacts, the use of an electricity mix based on 100% RE can reduce the impacts of the SAFs in six of the seven impact categories. This is exclusively due to reduced impacts in the fuel supply chain.
For biokerosene from renewable energy (SMR-RE), there were only slight improvements of 1–2% in the impact categories PMF, ALO, and POF compared with biokerosene (SMR). In contrast, 16% and 24% improvements could be achieved in the impact categories CC and FRD, respectively, and even 73% in the impact category HT. Therefore, the advantageousness of the use of this fuel variant increased.
Concerning synthetic kerosene, it was necessary to differentiate between hydrogen production by electrolysis and SMR. Accordingly, for synthetic kerosene (SMR-RE), in the impact categories CC, FRD, PMF, ALO, and POF, only minor improvements of 0.5–8% could be achieved compared with synthetic kerosene (SMR), but this was different for HT. Here, an improvement of 22% occurred. These improvements were much more significant regarding synthetic kerosene (PEM-RE and SOEC-RE). Thus, for PMF and POF, improvements of 15–28% could be achieved, and for CC, FRD, ALO, and HT, improvements of 71–97% could be achieved. This was due to the avoidance of fossil energy sources in electricity generation. The negative environmental impacts could be significantly reduced by eliminating the extraction and processing of lignite, hard coal, and wood chips. This is particularly evident for the improvement in CC, where the energy-intensively produced synthetic kerosene is now advantageous. Here, two aspects added up: on the one hand, the low-emission hydrogen production and, on the other hand, the demand for CO2 in the FTS. This led to synthetic kerosene (PEM-RE and SOEC-RE) having a 90% and 61% lower CC impact than fossil kerosene, respectively. Additionally, the use of synthetic kerosene (PEM-RE) could reduce the impact of FRD, which was 20% lower than for fossil kerosene.
Only with regard to MRD, the use of an electricity mix based on 100% RE led to deterioration due to the need for raw materials to build the RE plants. These were primarily raw materials that were costly to extract and produce, such as copper and aluminum, which were key drivers of the impact category MRD. Overall, there was a deterioration reflected in the impact scores that were 4–124% higher, resulting in the disadvantageousness of SAFs for this category.
The switch to an RE-based electricity mix did not affect the economic impact. This was because it was assumed that the electricity price did not change due to the switch and was accordingly identical in both scenarios.
4. Discussion
The overall results of this study confirm that the use of SAFs can be a promising solution for reducing the environmental impacts of the aviation sector. Although the GHG emissions associated with flight operations were almost identical due to fuel combustion, NOx and particulate matter emissions were reduced significantly in this phase. Additionally, large amounts of CO2 were sequestered in the upstream chains of fuel production, reducing GHG emissions compared with fossil kerosene in a life cycle perspective.
Based on current production conditions and the currently available electricity mix, biokerosene especially is a promising alternative to fossil kerosene in terms of its environmental impacts. However, the cultivation of the feedstock poses potential challenges in terms of agricultural land use if it competes with the food industry. In addition, synthetic kerosene based on hydrogen produced by SMR or electrolysis is largely disadvantageous compared with fossil kerosene. With regard to synthetic kerosene (SMR), this is due to the use of natural gas, which is required as feedstock for SMR. In terms of synthetic kerosene (PEM and SOEC), the high energy demand in hydrogen production in combination with the current composition of the electricity mix are responsible.
However, concerning the electricity mix, it can be assumed that renewable sources will be increasingly used for electricity generation in the future. This will have a positive influence on the production of SAFs as well. This assumption is supported by a scenario analysis carried out. An energy mix for the year 2050 was modeled based on the work of Jacobson et al. [75], which was based 100% on RE. In particular, the environmental impacts from energy-intensive hydrogen production could be significantly reduced, which results in synthetic kerosene (PEM-RE and SOEC-RE) being associated with the lowest overall impacts in terms of climate change.
While the results also show that there was still improvement potential from an economic perspective, currently, the use of SAFs is not yet competitive with fossil kerosene, mainly due to the significantly higher production costs. These are up to six times higher than for fossil kerosene, thus lacking incentives for their use in flight operations. This applies to both scenarios with the current electricity mix and an electricity mix completely based on RE. At this point, political measures are necessary (e.g., substitution, subsidy programs, or tax measures for non-SAFs) to allow for the economical production of SAFs on a large industrial scale and increase their competitiveness.
At the same time, the question remains whether an expansion of the production capacities of SAFs is possible with the current capacities of electricity generation. In particular, the high energy demand in hydrogen production using electrolysis could lead to overloads in the electricity grid, resulting in production restrictions. On the other hand, the energy-intensive production of SAFs can positively contribute to balancing the fluctuating supply of electricity from renewable resources.
Further uncertainties exist concerning the fuels analyzed and their production. For the study carried out, the focus was on second-generation biokerosene and hydrogen-based synthetic kerosene. For hydrogen production, SMR, as well as PEM and SOEC, were considered. However, there is research that has been conducted addressing third-generation biokerosene [76] as well as other hydrogen production pathways (e.g., methane pyrolysis) [77]. In this article, FTS was assumed to be the synthesis process due to its market maturity. Still, other synthesis processes (e.g., methanol synthesis and methanation) can be considered in future analyses. Against this background, the analysis of the synthesis of ammonia-based fuels using Haber–Bosch processes would be interesting. Since they are carbon-free, no CO2 is emitted during combustion. Moreover, in the case of biokerosene, the HEFA, HTL, AtJ, and DSHC processes can be analyzed.
A major aspect of uncertainty in this study results from the limited spatial differentiation. With regard to SAFs, the assumption was made that production was carried out entirely in Germany and that the input materials also originated from there. Different supply chain configurations can be investigated in the context of a more robust spatial differentiation, whereby recommendations for action regarding supply chain configurations can be derived.
Furthermore, this study focused on drop-in capable fuels. There are also non-drop-in fuels such as alcohols (e.g., ethanol and methanol) and liquid hydrogen, which require structural changes to the powertrain and the fueling infrastructure. This study did not investigate the extent to which these would be advantageous over drop-in fuels and fossil kerosene.
The aspects mentioned above can be considered in future research and extend the conducted study. This way, a comprehensive comparison of potential fuels in the aviation sector will be possible.
5. Conclusions and Outlook
This study scrutinized the potential of substituting fossil kerosene with different types of SAFs on medium-haul flights. By doing so, the environmental and economic impacts related to the use of the SAFs compared with fossil kerosene were analyzed by conducting an environmental and economic assessment, and the advantages as well as disadvantages were identified. The study focused on the fuel supply chain and flight operation in the use stage.
The results of the study reveal that SAFs can be partially advantageous in environmental aspects. However, at the current state of development and considering the prevailing production conditions of the fuels, fossil kerosene is to be preferred. Concerning the economic impacts, SAFs are not yet competitive, and political measures must promote their use (e.g., substitutions, subsidies, or tax measures). The drivers of the negative environmental and economic impacts are mostly the high energy demand in fuel production as well as the current composition of the electricity mix based on fossil sources. However, it can be assumed that this composition will shift toward a higher share of RE in the long term. Subsequent scenario analyses showed that using an electricity mix of 100% based on RE could further reduce the environmental impacts in six of the seven impact categories investigated. It is particularly noticeable that the SAFs, which are energy-intensive to produce, thus became competitive with fossil kerosene from an environmental point of view. Only the impact category MRD deteriorated due to the RE plants to be built. Therefore, SAFs produced by RE can be a solution for reducing the environmental impacts of the aviation sector and contribute to the achievement of the Flightpath 2050 goals.
This study can be a starting point for future research. The results give an overview of the environmental and economic impacts of different types of aviation fuels and thus enable a detailed comparison. In future research, further fuels need to be added, such as third-generation biokerosene or SAFs produced by HEFA, HTL, AtJ, DSHC, or StL. In this context, different synthesis processes have to be considered, and alternative process routes for production of the fuels or required feedstocks (e.g., hydrogen) can be integrated. In this way, the most promising SAFs can be identified at an early stage and become a focus of further research.
In addition, spatial differentiation must be examined, especially in the fuel supply chain. On the one hand, countries with a higher share of RE in the electricity mix can be advantageous for the production of SAFs (and vice versa). At the same time, countries with low energy costs exist, which can offer economic advantages. If these aspects are taken into account through more advanced spatial differentiation in the fuel supply chain, supply chain configurations associated with less environmental and economic impacts can be designed. However, critical working conditions prevail in less developed countries, and a conflict of objectives of the three pillars of sustainability may occur. Therefore, a social analysis should be integrated.
While SAFs can contribute to a sustainable aviation sector in the short term, novel propulsion technologies for aircraft have to be integrated in the long term, as proposed by Barke et al. [15,78]. These include non-drop-in fuels (e.g., liquid hydrogen) that require modification of the powertrain as well as the use of novel propulsion technologies (e.g., battery-based or fuel cell-based concepts). Both approaches will be necessary to achieve the long-term emission reduction goals of the aviation sector. Considering different market entry times will allow the development of transition pathways to a sustainable aviation sector, considering short-term and long-term sustainability objectives.
Overall, this article expands the scientific literature by creating novel LCI datasets for a well-to-wake analysis of fossil kerosene and four types of SAFs. In addition, the comparative environmental and economic analysis has revealed specific hotspots in the production and use of SAFs that can be specifically handled in fuel development. Ultimately, this enables the development of both environmentally advantageous and economically competitive aviation fuels. Hence, this study provides a basis for further analyses of SAFs and can be extended by the previously mentioned aspects in future research.
Supplementary Materials
The following supporting information can be downloaded at: www.mdpi.com/article/10.3390/app12020597/s1, LCI datasets S1: LCI datasets for medium-haul flight operations using the investigated fuels (with current electricity mix and with 100% renewable energies).
Author Contributions
Conceptualization: A.B., T.B., C.T. and C.W.; methodology: A.B., T.B. and C.T.; software: A.B.; validation: A.B.; formal analysis: A.B. and T.B.; investigation: A.B., T.B. and C.T.; data curation: A.B., writing—original draft preparation: A.B., T.B., C.T. and C.W.; writing—review and editing: A.B., T.B., C.T., C.W. and T.S.S.; visualization: A.B. and T.B.; supervision: C.T. and T.S.S.; project administration: C.T. and T.S.S.; funding acquisition: T.S.S. All authors have read and agreed to the published version of the manuscript.
Funding
We would like to acknowledge the funding by the Deutsche Forschungsgemeinschaft (DFG, German Research Foundation) under Germany’s Excellence Strategy—EXC 2163/1-Sustainable and Energy Efficient Aviation—Project-ID 390881007. Furthermore, we acknowledge the support from the Open Access Publication Funds of the Technische Universität Braunschweig.
Institutional Review Board Statement
Not applicable.
Informed Consent Statement
Not applicable.
Data Availability Statement
The data presented in this study are available in the Supplementary Materials. Additional data supporting the findings of this study are available from the corresponding author upon request.
Conflicts of Interest
The authors declare no conflict of interest.
Nomenclature
| AAF | Aviation alternative fuel |
| ALO | Agricultural land occupation |
| AtJ | Alcohol-to-jet |
| BtL | Biomass-to-liquid |
| CAF | Conventional aviation fuel |
| CC | Climate change |
| CO2 | Carbon dioxide |
| CORSIA | Carbon Offsetting and Reduction Scheme for International Aviation |
| CtL | Coal-to-liquid |
| DSHC | Direct sugar to hydrocarbons |
| EU ETS | European Union Emission Trading System |
| FRD | Fossil resource depletion |
| FTS | Fisher–Tropsch synthesis |
| GHG | Greenhouse gas |
| GtL | Gas-to-liquid |
| HEFA | Hydroprocessed esters and fatty acids |
| HT | Human toxicity |
| HTL | Hydrothermal liquefaction |
| LC | Life cycle costs |
| LCA | Life cycle assessment |
| LCC | Life cycle costing |
| LCI | Life cycle inventory |
| LH2 | Liquid hydrogen |
| MRD | Mineral resource depletion |
| NOx | Nitrogen oxides |
| PEM | Polymer electrolyte membrane electrolysis |
| pkm | Passenger kilometer traveled |
| PMF | Particulate matter formation |
| POF | Photochemical oxidant formation |
| PtL | Power-to-liquid |
| RE | Renewable energy |
| SAF | Sustainable aviation fuel |
| SMR | Steam methane reforming |
| SOEC | Solid oxide electrolysis |
| StL | Sun-to-liquid |
References
- International Transport Forum. ITF Transport Outlook 2019; OECD Publishing: Paris, France, 2019. [Google Scholar]
- Airbus, S.A.S. Cities, Airports & Aircraft; Airbus: Blagnac Cedex, France, 2019. [Google Scholar]
- Boeing. Commercial Market Outlook: 2019–2038; Boeing: Seattle, WA, USA, 2019. [Google Scholar]
- Gössling, S.; Humpe, A.; Fichert, F.; Creutzig, F. COVID-19 and pathways to low-carbon air transport until 2050. Environ. Res. Lett. 2021, 16, 034063. [Google Scholar] [CrossRef]
- European Union Aviation Safety Agency (EASA); European Environmental Agency (EEA); EUROCONTROL. European Aviation Environmental Report 2019; EASA, EEA, EUROCONTROL: Luxembourg, 2019. [CrossRef]
- Gnadt, A.R.; Speth, R.L.; Sabnis, J.S.; Barrett, S.R.H. Technical and environmental assessment of all-electric 180-passenger commercial aircraft. Prog. Aerosp. Sci. 2019, 105, 1–30. [Google Scholar] [CrossRef] [Green Version]
- Jungbluth, N.; Meili, C. Recommendations for calculation of the global warming potential of aviation including the radiative forcing index. Int. J. Life Cycle Assess. 2019, 24, 404–411. [Google Scholar] [CrossRef]
- Lee, D.S.; Fahey, D.W.; Skowron, A.; Allen, M.R.; Burkhardt, U.; Chen, Q.; Doherty, S.J.; Freeman, S.; Forster, P.M.; Fuglestvedt, J.; et al. The contribution of global aviation to anthropogenic climate forcing for 2000 to 2018. Atmos. Environ. 2021, 244, 117834. [Google Scholar] [CrossRef]
- Andruleit, H.; Meßner, J.; Pein, M.; Rebscher, D.; Schauer, M.; Schmidt, S.; von Goerne, G. Status, Daten und Entwicklungen der globalen Energieversorgung. Z. Für Energ. 2018, 42, 179–191. [Google Scholar] [CrossRef]
- Mensen, H. Handbuch der Luftfahrt, 2nd ed.; Springer Vieweg: Berlin/Heidelberg, Germany, 2013; ISBN 978-3-642-34401-5. [Google Scholar]
- ICAO. Annex 16 CORSIA; ICAO: Montréal, QC, Canada, 2018; Volume IV, ISBN 9789292586119. [Google Scholar]
- European Commission. Flightpath 2050: Europe’s Vision for Aviation; European Comission: Brussels, Belgium, 2014. [Google Scholar] [CrossRef]
- Kumar, N.; Möller, U.; Tang, S.; Chiarini, P. Flightpath 2050 Goals; ACARE: Brussels, Belgium, 2020. Available online: https://www.acare4europe.org/sria/flightpath-2050-goals (accessed on 15 September 2021).
- Advisory Council for Aviation Research and Innovation in Europe (ACARE). Strategic Research & Innovation Agenda; ACARE: Brussels, Belgium, 2012; Volume 1, pp. 79–100. [Google Scholar]
- Barke, A.; Thies, C.; Popien, J.L.; Melo, S.P.; Cerdas, F.; Herrmann, C.; Spengler, T.S. Life cycle sustainability assessment of potential battery systems for electric aircraft. Procedia CIRP 2021, 98, 660–665. [Google Scholar] [CrossRef]
- ICAO. Electric, Hybrid, and Hydrogen Aircraft—State of Play; ICAO: Montréal, QC, Canada, 2019; pp. 124–130. [Google Scholar]
- Fend, T.; Roeb, M. Solare Thermochemische Wasserspaltung. 2020. Available online: https://www.dlr.de/sf/desktopdefault.aspx/tabid-9315/22259_read-51105/ (accessed on 15 September 2021).
- Melo, S.P.; Barke, A.; Cerdas, F.; Thies, C.; Mennenga, M.; Spengler, T.S.; Herrmann, C. Sustainability Assessment and Engineering of Emerging Aircraft Technologies—Challenges, Methods and Tools. Sustainability 2020, 12, 5663. [Google Scholar] [CrossRef]
- Schmidt, P.; Batteiger, V.; Roth, A.; Weindorf, W.; Raksha, T. Power-to-Liquids as Renewable Fuel Option for Aviation: A Review. Chem. Ing. Tech. 2018, 90, 127–140. [Google Scholar] [CrossRef]
- Han, J.; Elgowainy, A.; Cai, H.; Wang, M.Q. Life-cycle analysis of bio-based aviation fuels. Bioresour. Technol. 2013, 150, 447–456. [Google Scholar] [CrossRef]
- Gomez Jimenez, I. Feasibility Study on the Use of Sustainable Aviation Fuels. 2017, p. 38. Available online: https://www.icao.int/environmental-protection/Documents/FeasabilityStudy_BurkinaFaso_Report-Web.pdf (accessed on 15 September 2021).
- ICAO. Agenda Item 1: Developments in Research and Certification of Aviation Alternative Fuels; ICAO: Montréal, QC, Canada, 2017. [Google Scholar]
- ICAO. Agenda Item 1: Developments in Research and Certification of Aviation Alternative Fuels STATUS; ICAO: Montréal, QC, Canada, 2017. [Google Scholar]
- Bley, T. Analyse und Vergleich Ökologischer und Sozioökonomischer Umweltwirkungen Verschiedener Kraftstoffvarianten für die Verwendung im Luftverkehr. Master’s Thesis, Technische Universität Braunschweig, Braunschweig, Germany, 2021. [Google Scholar] [CrossRef]
- Farokhi, S. Future Propulsion Systems and Energy Sources in Sustainable Aviation, 1st ed.; Wiley & Sons: Hoboken, NJ, USA, 2020; ISBN 978-1-119-41499-5. [Google Scholar]
- Berger, A.; Hirschl, B.; Bluhm, H.; Ehrenstein, U.; Heinbach, K.; Dunkelberg, E. Systematik im Power-to-X-Ansatz—Identifikation, Charakterisierung und Clusterung der Power-to-X-Technologien. Z. Energ. 2020, 44, 177–193. [Google Scholar] [CrossRef]
- Roth, A.; Sizmann, A.; Jeßberger, C. Report on Compilation, Mapping and Evaluation of R&D Activities in the Field of Conversion Technologies of Biogenic Feedstock and Biomass-Independent Pathways; Bauhaus Luftfahrt e.V.: Munich, Germany, 2016. [Google Scholar]
- Kolosz, B.W.; Luo, Y.; Xu, B.; Maroto-Valer, M.M.; Andresen, J.M. Life cycle environmental analysis of “drop in” alternative aviation fuels: A review. Sustain. Energy Fuels 2020, 4, 3229–3263. [Google Scholar] [CrossRef]
- Fasihi, M.; Bogdanov, D.; Breyer, C. Techno-Economic Assessment of Power-to-Liquids (PtL) Fuels Production and Global Trading Based on Hybrid PV-Wind Power Plants. Energy Procedia 2016, 99, 243–268. [Google Scholar] [CrossRef] [Green Version]
- Fischer, F.; Tropsch, H. The Synthesis of Petroleum at Atmospheric Pressures from Gasification Products of Coal. Brennstoff-Chemie 1926, 7, 97–104. [Google Scholar]
- Horschig, T.; Penke, C.; Habersetzer, A.; Batteiger, V. Regional Feedstock Potentials and Preference Regions for HTL Projects. 2020. Available online: www.hyflexfuel.eu (accessed on 15 September 2021).
- Nationale Organisation Wasserstoff-und Brennstoffzellentechnologie. Factsheet: Übersicht und Einordnung Alternativer Kraftstoffe Kraftstoffe im Fokus der NOW; NOW GmbH: Berlin, Germany, 2021. [Google Scholar]
- Chester, M.V.; Horvath, A. Environmental assessment of passenger transportation should include infrastructure and supply chains. Environ. Res. Lett. 2009, 4, 024008. [Google Scholar] [CrossRef]
- Cox, B.; Jemiolo, W.; Mutel, C. Life cycle assessment of air transportation and the Swiss commercial air transport fleet. Transp. Res. Part D Transp. Environ. 2018, 58, 1–13. [Google Scholar] [CrossRef]
- Gutiérrez-Antonio, C.; Gómez-Castro, F.I.; de Lira-Flores, J.A.; Hernández, S. A review on the production processes of renewable jet fuel. Renew. Sustain. Energy Rev. 2017, 79, 709–729. [Google Scholar] [CrossRef]
- Doliente, S.S.; Narayan, A.; Tapia, J.F.D.; Samsatli, N.J.; Zhao, Y.; Samsatli, S. Bio-aviation Fuel: A Comprehensive Review and Analysis of the Supply Chain Components. Front. Energy Res. 2020, 8, 110. [Google Scholar] [CrossRef]
- Staples, M.D.; Malina, R.; Suresh, P.; Hileman, J.I.; Barrett, S.R.H. Aviation CO2 emissions reductions from the use of alternative jet fuels. Energy Policy 2018, 114, 342–354. [Google Scholar] [CrossRef]
- Rye, L.; Batten, D. Alternative aviation fuel feedstock: The microalgae solution. In Proceedings of the ICAS 2012, Brisbane, Australia, 23–28 September 2011; pp. 1–7. [Google Scholar]
- Hileman, J.I.; Stratton, R.W. Alternative jet fuel feasibility. Transp. Policy 2014, 34, 52–62. [Google Scholar] [CrossRef]
- Neuling, U.; Kaltschmitt, M. Techno-economic and environmental analysis of aviation biofuels. Fuel Process. Technol. 2018, 171, 54–69. [Google Scholar] [CrossRef]
- Johanning, A.; Scholz, D. Comparison of the potential environmental impact improvements of future aircraft concepts using life cycle assessment. In Proceedings of the 5th CEAS Air & Space Conference, Delft, The Netherlands, 7–11 September 2015; pp. 1–16. [Google Scholar]
- Koroneos, C.; Dompros, A.; Roumbas, G.; Moussiopoulos, N. Advantages of the use of hydrogen fuel as compared to kerosene. Resour. Conserv. Recycl. 2005, 44, 99–113. [Google Scholar] [CrossRef]
- Bicer, Y.; Dincer, I. Life cycle evaluation of hydrogen and other potential fuels for aircrafts. Int. J. Prod. Res. 2017, 42, 10722–10738. [Google Scholar] [CrossRef]
- Sürer, M.G.; Arat, H.T. State of art of hydrogen usage as a fuel on aviation. Eur. Mech. Sci. 2018, 2, 20–30. [Google Scholar] [CrossRef]
- Finkbeiner, M.; Schau, E.M.; Lehmann, A.; Traverso, M. Towards Life Cycle Sustainability Assessment. Sustainability 2010, 2, 3309–3322. [Google Scholar] [CrossRef] [Green Version]
- Ness, B.; Urbel-Piirsalu, E.; Anderberg, S.; Olsson, L. Categorising tools for sustainability assessment. Ecol. Econ. 2007, 60, 498–508. [Google Scholar] [CrossRef]
- Zimmermann, A.W.; Wunderlich, J.; Müller, L.; Buchner, G.A.; Marxen, A.; Michailos, S.; Armstrong, K.; Naims, H.; McCord, S.; Styring, P.; et al. Techno-Economic Assessment Guidelines for CO2 Utilization. Front. Energy Res. 2020, 8, 31. [Google Scholar] [CrossRef] [Green Version]
- Reddy, K.R.; Sadasivam, B.Y.; Adams, J.A. Social Sustainability Evaluation Matrix (SSEM) to Quantify Social Aspects of Sustainable Remediation. In Proceedings of the 2014 International Conference on Sustainable Infrastructure, Long Beach, CA, USA, 6–8 November 2014; pp. 831–841. [Google Scholar]
- Guinée, J.B.; Heijungs, R.; Huppes, G.; Zamagni, A.; Masoni, P.; Buonamici, R.; Ekvall, T.; Rydberg, T. Life cycle assessment: Past, present, and future. Environ. Sci. Technol. 2011, 45, 90–96. [Google Scholar] [CrossRef]
- Klöpffer, W. Life cycle sustainability assessment of products. Int. J. Life Cycle Assess. 2008, 13, 89–95. [Google Scholar] [CrossRef]
- UNEP/SETAC. Towards a Life Cycle Sustainability Assessment: Making Informed Choices on Products; UNEP/SETAC Life Cycle Initiative: Paris, France, 2011. [Google Scholar]
- Singh, R.K.; Murty, H.R.; Gupta, S.K.; Dikshit, A.K. An overview of sustainability assessment methodologies. Ecol. Indic. 2012, 15, 281–299. [Google Scholar] [CrossRef]
- Keller, H.; Rettenmaier, N.; Reinhardt, G.A. Integrated life cycle sustainability assessment—A practical approach applied to biorefineries. Appl. Energy 2015, 154, 1072–1081. [Google Scholar] [CrossRef]
- Thies, C.; Kieckhäfer, K.; Spengler, T.S. Activity analysis based modeling of global supply chains for sustainability assessment. J. Bus. Econ. 2021, 91, 215–252. [Google Scholar] [CrossRef]
- Grubert, E. The Need for a Preference-Based Multicriteria Prioritization Framework in Life Cycle Sustainability Assessment. J. Ind. Ecol. 2017, 21, 1522–1535. [Google Scholar] [CrossRef] [Green Version]
- Finnveden, G.; Hauschild, M.Z.; Ekvall, T.; Guinée, J.; Heijungs, R.; Hellweg, S.; Koehler, A.; Pennington, D.; Suh, S. Recent developments in Life Cycle Assessment. J. Environ. Manag. 2009, 91, 1–21. [Google Scholar] [CrossRef]
- Goedkoop, M.; Heijungs, R.; Huijbregts, M.; De Schryver, A.; Struijs, J.; van Zelm, R. ReCiPe 2008: A life Cycle Impact Assessment Method Which Comprises Harmonised Category Indicators at the Midpoint and the Endpoint Level; Ministerie van VROM: Den Haag, The Newtherland, 2013. [Google Scholar]
- Rebitzer, G.; Hunkeler, D. Life cycle costing in LCM: Ambitions, opportunities, and limitations. Int. J. Life Cycle Assess. 2003, 8, 253–256. [Google Scholar] [CrossRef]
- Hunkeler, D.; Lichtenvort, K.; Rebitzer, G. Environmental Life Cycle Costing; CRC Press: Boca Raton, FL, USA, 2008. [Google Scholar]
- Moreau, V.; Weidema, B.P. The computational structure of environmental life cycle costing. Int. J. Life Cycle Assess. 2015, 20, 1359–1363. [Google Scholar] [CrossRef]
- Heijungs, R.; Settanni, E.; Guinée, J. Toward a computational structure for life cycle sustainability analysis: Unifying LCA and LCC. Int. J. Life Cycle Assess. 2013, 18, 1722–1733. [Google Scholar] [CrossRef] [Green Version]
- Wernet, G.; Bauer, C.; Steubing, B.; Reinhard, J.; Moreno-Ruiz, E.; Weidema, B. The ecoinvent database version 3 (part I): Overview and methodology. Int. J. Life Cycle Assess. 2016, 21, 1218–1230. [Google Scholar] [CrossRef]
- Raffinerie Heide. Energising the North; Raffinerie Heide GmbH: Hemmingstedt, Germany, 2017. [Google Scholar]
- 3N Centre of Experts for Renewable Resources Lower Saxony. Biogas in Lower Saxony; 3N Centre of Experts: Werlte, Germany, 2014. [Google Scholar]
- Van Der Giesen, C.; Kleijn, R.; Kramer, G.J. Energy and climate impacts of producing synthetic hydrocarbon fuels from CO2. Environ. Sci. Technol. 2014, 48, 7111–7121. [Google Scholar] [CrossRef]
- Rutkowski, M.; Penev, M.; Saur, G.; Steward, D. Current Central Hydrogen from Natural Gas with CO2 Capture and Sequestration: NREL. 2018. Available online: https://www.nrel.gov/hydrogen/assets/docs/current-central-natural-gas-with-co2-sequestration-v3-2018.20210104.xlsm (accessed on 30 September 2021).
- DeSantis, D.; James, B.; Saur, G. Hydrogen Production from Central PEM Electrolysis: NREL. 2019. Available online: https://www.nrel.gov/hydrogen/assets/docs/current-central-pem-electrolysis-2019-v3-2018.xlsm (accessed on 30 September 2021).
- James, B.; DeSantis, D.; Moton, J.; Saur, G. Current Central Hydrogen Production from Solid Oxide Electrolysis: NREL. 2018. Available online: https://www.nrel.gov/hydrogen/assets/docs/current-central-solid-oxide-electrolysis-v3-2018.xlsm (accessed on 30 September 2021).
- ECSPP. An Overview of the Pipeline Networks of Europe. 2006. Available online: https://chemicalparks.eu/europe/pipeline-networks (accessed on 15 September 2021).
- Lufthansa Group. LH-Factsheet-Sustainability-2020. 2020, pp. 1–22. Available online: https://www.lufthansagroup.com/media/downloads/en/responsibility/LH-Factsheet-Sustainability-2020.pdf (accessed on 15 September 2021).
- Braun-Unkhoff, M.; Riedel, U.; Wahl, C. About the emissions of alternative jet fuels. CEAS Aeronaut. J. 2017, 8, 167–180. [Google Scholar] [CrossRef] [Green Version]
- Turner, D.; Xu, H.; Cracknell, R.F.; Natarajan, V.; Chen, X. Combustion performance of bio-ethanol at various blend ratios in a gasoline direct injection engine. Fuel 2011, 90, 1999–2006. [Google Scholar] [CrossRef]
- Mutel, C. Brightway: An open source framework for Life Cycle Assessment. J. Open Source Softw. 2017, 2, 236. [Google Scholar] [CrossRef]
- Fraunhofer ISE. German Net Electricity Generation in First Half of 2021: Decline in Renewables Due to Weak Winds; Fraunhofer ISE: Freiburg im Breisgau, Germany, 2021. [Google Scholar]
- Jacobson, M.Z.; Delucchi, M.A.; Bauer, Z.A.F.; Goodman, S.C.; Chapman, W.E.; Cameron, M.A.; Bozonnat, C.; Chobadi, L.; Clonts, H.A.; Enevoldsen, P.; et al. 100% Clean and Renewable Wind, Water, and Sunlight All-Sector Energy Roadmaps for 139 Countries of the World. Joule 2017, 1, 108–121. [Google Scholar] [CrossRef] [Green Version]
- Klein, B.C.; Chagas, M.F.; Junqueira, T.L.; Rezende, M.C.A.F.; Cardoso, T.d.F.; Cavalett, O.; Bonomi, A. Techno-economic and environmental assessment of renewable jet fuel production in integrated Brazilian sugarcane biorefineries. Appl. Energy 2018, 209, 290–305. [Google Scholar] [CrossRef]
- Schneider, S.; Bajohr, S.; Graf, F.; Kolb, T. State of the Art of Hydrogen Production via Pyrolysis of Natural Gas. ChemBioEng Rev. 2020, 7, 150–158. [Google Scholar] [CrossRef]
- Barke, A.; Thies, C.; Melo, S.P.; Cerdas, F.; Herrmann, C.; Spengler, T.S. Socio-economic life cycle assessment of future aircraft systems. Procedia CIRP 2020, 90, 262. [Google Scholar] [CrossRef]
Publisher’s Note: MDPI stays neutral with regard to jurisdictional claims in published maps and institutional affiliations. |
© 2022 by the authors. Licensee MDPI, Basel, Switzerland. This article is an open access article distributed under the terms and conditions of the Creative Commons Attribution (CC BY) license (https://creativecommons.org/licenses/by/4.0/).