Article

Influence of Heart Rate on Left and Right Ventricular Longitudinal Strain in Patients with Chronic Heart Failure

by
Vito Di Terlizzi
1,2,
Roberta Barone
1,2,
Vincenzo Manuppelli
1,2,
Michele Correale
1,2,
Grazia Casavecchia
1,2,
Giovanni Goffredo
1,2,
Pierluigi Pellegrino
1,2,
Alessandra Puteo
1,2,
Riccardo Ieva
1,2,
Matteo Di Biase
1,2,
Natale Daniele Brunetti
1,2 and
Massimo Iacoviello
1,2,*
1
Cardiology Unit, University Polyclinic Hospital of Foggia, 71100 Foggia, Italy
2
Department of Medical and Surgical Sciences, University of Foggia, 71100 Foggia, Italy
*
Author to whom correspondence should be addressed.
Appl. Sci. 2022, 12(2), 556; https://doi.org/10.3390/app12020556
Submission received: 6 December 2021 / Revised: 30 December 2021 / Accepted: 4 January 2022 / Published: 6 January 2022

Abstract

:
Over the past years, a number of studies have demonstrated the relevance of strain assessed by two-dimensional speckle tracking echocardiography (STE) in evaluating ventricular function. The aim of this study was to analyze changes in left (LV) and right ventricular (RV) longitudinal strain associated with variations of heart rate (HR) in participants with and without chronic heart failure (CHF). We enrolled 45 patients, 38 of these diagnosed with CHF and carrying an implantable cardioverter defibrillator, and seven patients with pacemakers and without CHF. The frequency of atrial stimulation was increased to 90 beats/min and an echocardiogram was performed at each increase of 10 beats/min. Global LV and RV longitudinal strain (LVGLS and RVGLS, respectively) and RV free wall longitudinal strain (RVfwLS) were calculated at each HR. When analyzed as continuous variables, significant reductions in LVGLS were detected at higher HRs, whereas improvements in both RVGLS and RVfwLS were observed. Patients with a worsening of LVGLS (76% overall) were more likely to present lower baseline LV function. Only a few patients (18% for RVGLS and 16% for RVfwLS) exhibited HR-related deteriorations of RV strain measures, which was associated with lower levels of baseline RV function and higher pulmonary systolic pressures. Finally, 21 (47%) and 25 (56%) participants responded with improvements in RVGLS and RVfwLS, respectively. Our findings revealed heterogeneous RV and LV responses to increases in HR. These findings might ultimately be used to optimize cardiac functionality in patients diagnosed with CHF.

1. Introduction

Novel methods for the non-invasive assessment of the heart chamber function have been developed during the last decades. The analysis of myocardial deformation, or “strain”, has emerged as an important index of both global and regional cardiac function [1]. In chronic heart failure (CHF), left (LV) and right (RV) ventricular strain measured by two-dimensional speckle tracking echocardiography (STE) have been identified as powerful predictors of clinical outcome [2,3,4]. Moreover, these measures are correlated with cardiac contractile responses to exertional or pharmacologic stimuli [5,6] and functional capacity [7], but there are few data about the relationship between heart rate (HR) increase independent from sympathetic activation and ventricular longitudinal strain. This issue is even more relevant for the clinical management of CHF patients.
In these patients, the HR-dependent increased contractility (i.e., the Bowditch Treppe phenomenon) is depressed [8,9] and a low sinus heart rate is a therapeutic target when a reduced left ventricular ejection fraction (LVEF) is present [10]. On the other hand, an increased heart rate during exercise could favor a rise in cardiac output. Moreover, the HR response to LV and RV could be different. Finally, the method for programming optimal paced heart rate responsiveness in patients carrying implantable devices is not well defined.
Thus, this study was aimed to evaluate the changes in LV and RV strain in response to increases in HR in participants who have been either diagnosed or not with CHF.

2. Materials and Methods

We enrolled patients who were referred to the Cardiology Unit of Polyclinic University Hospital Riuniti of Foggia, Italy, between May 2020 and October 2020. Criteria for inclusion were as follows: patients with an implanted cardioverter defibrillator (ICD) or pacemaker who were managed with conventional medical therapy and in clinically stable condition for at least 30 days (i.e., no significant changes in hemodynamic status or medical therapy). The study participants were assigned to one of three groups, including patients diagnosed with CHF and managed with an ICD without or with cardiac resynchronization therapy (CRT), and patients with sinus node dysfunction without CHF who were managed with an implanted pacemaker device (PM). All patients carrying an ICD or CRT had a history of CHF with reduced LVEF (HFrEF), whereas all patients carrying a PM had a preserved LVEF [10]. We excluded patients diagnosed with atrial fibrillation and acute decompensated heart failure (HF) as well as those requiring RV stimulation at baseline and during the pacing protocol. The study protocol was approved by the local Ethics Committee of University Polyclinic Hospital of Foggia, Italy, and the patients provided written informed consent.

2.1. Study Protocol

Each participant underwent a medical evaluation, including an electrocardiogram (ECG) and two-dimensional echocardiography at the time of enrollment.
Medical examination and electrocardiogram. A full medical history was collected from each participant. A physical examination and a 12-lead ECG were performed. Any evidence of ischemic cardiomyopathy, arterial hypertension, atrial fibrillation, diabetes mellitus, and/or dyslipidemia was documented together with any history of chronic kidney disease and dialysis. New York Heart Association (NYHA) classes, anthropometric data, systolic and diastolic arterial pressures, and heart rhythms were also recorded. If available, the most recent routine blood chemistries were also documented.
Echocardiographic evaluation. Two-dimensional echocardiographic imaging and Doppler acquisition were performed using an EPIQ CVx system (Philips, Amsterdam, The Netherlands) with an S5-1 transducer. At baseline, five cycles of ECG-guided standard parasternal long and short-axis, apical two-, three-, and four-chamber and subcostal views were acquired. LV end-diastolic diameter and the thicknesses of the interventricular septum and LV posterior wall were measured; the LV mass indexed for body surface area was calculated based on current recommendations [6]. A RV-focused four-chamber view was also obtained in order to analyze the tricuspid annular plane systolic excursion (TAPSE). LV end-diastolic volume (LVEDV), LV end-systolic volume (LVESV), and LVEF were calculated using Simpson’s rule. Left atrial volume was also calculated using Simpson’s rule and indexed for body surface area. Mitral (MR) and tricuspid regurgitation (TR) were evaluated semi-quantitatively using color Doppler and assigned arbitrary units ranging from 0 to 4. The maximum trans-tricuspid valve pressure gradient was assessed by continuous-wave Doppler. Pulmonary systolic arterial pressure (PASP) was estimated based on the diameter of the vena cava. We performed pulsed-wave Doppler and measured the diameter of the LV outflow tract according to recent guidelines [6]. Stroke volume, cardiac output, and cardiac index were also obtained from these measurements [6]. Peaks of early wave velocity at the mitral valve (E) were measured by pulsed Doppler. The early diastolic velocity peaks (e’) at the level of the septal (e’ s) and lateral (e’ l) mitral annulus were also measured by pulsed and tissue Doppler imaging (TDI) to obtain the E/e’ ratio [6]. The Tei index was calculated as the ratio between the sum of isovolumic relaxation and contraction times divided by the mitral valve closure time as measured by TDI at the level of the septal mitral annulus.
The AutoStrain application of the Philips EPIQ CVx ultrasound systems was used for “off-cart” analysis of strain from stored examinations. Values for LVGLS were obtained from the analysis of two-, three-, and four-chamber views. The software automatically generated curves representing longitudinal strain; LVGLS was calculated by averaging values obtained in all segments. The operator can also modify the region of interest generated from the software which will then automatically recalculate this value. The RVGLS and RVfwLS were also calculated automatically from values obtained in an RV-focused four-chamber view. In this manuscript, reduced systolic strain is indicated by values that are less negative than those determined at baseline. Right ventricular arterial coupling was determined as the ratio of RVGLS/PASP and RVfwLS/PASP.
Pacing protocol. HR was increased from each baseline value by programming the implantable devices with higher atrial stimulation frequencies to a maximum of 90 beats/min. The stability of RA pacing capture was established within the first minute of each newly established HR. Echocardiography was performed at each increase of 10 beats/min as previously described. Intermediate resting frequencies were estimated to the nearest integer for the calculation of the first paced 10 beat/min rate increase.

2.2. Statistical Analysis

Continuous variables are presented as means ± standard deviation (SD). The reproducibility of strain measures determined at various HRs was evaluated by an interclass coefficient (ICC). The linear mixed model for repeated measures was used to assess the relationship between changes in HR and the responses of the variables under study. The worsening or improvement of longitudinal strain measures was defined as a percentage change of >10%. For continuous variables, analysis of variance (ANOVA) was performed to evaluate the differences between the groups. Pearson Chi-Square was used to evaluate intergroup differences of categorical variables. Pearson’s linear correlations were used to analyze the relationship between relative changes in strain measures with echocardiographic parameters. Statistical analyses were performed using STATA, version 12 (StataCorp, College Station, TX, USA) or Statistica 6.1 (StatSoft Inc., Tulsa, OK, USA). p-values < 0.05 were considered to be statistically significant.

3. Results

3.1. Study Participants

We enrolled 45 patients in our study. The clinical and echocardiographic characteristics of all enrolled participants are shown in Table 1. Of the 38 patients diagnosed with CHF, 21 were carrying an ICD, 17 a CRT, and 7 a PM. The clinical characteristics of all participants are documented in Tables S1 and S2. Patients carrying a PM were significantly older and less likely to be treated with beta-blockers and diuretics. Moreover, PM study participants had overall smaller left atrial volumes and LV dimensions, greater LVEF, and NYHA class designations, and relatively better measures of both LVGLS and RVGLS. No additional differences were identified.

3.2. Reproducibility of the Measures of RV and LV Strain

The reproducibility of strain measurements was assessed in all the images obtained at the different HRs for 19 of the study participants. The results included sixty-seven strain calculations. A high degree of reproducibility was observed for LVGLS (intraclass correlation coefficient [ICC] = 0.96; 95% confidence interval [CI], 0.93–0.97) as well as for RVGLS (ICC = 0.91; 95% CI, 0.86–0.94) and RVfwLS (ICC = 0.91; 95% CI, 0.85–0.94).

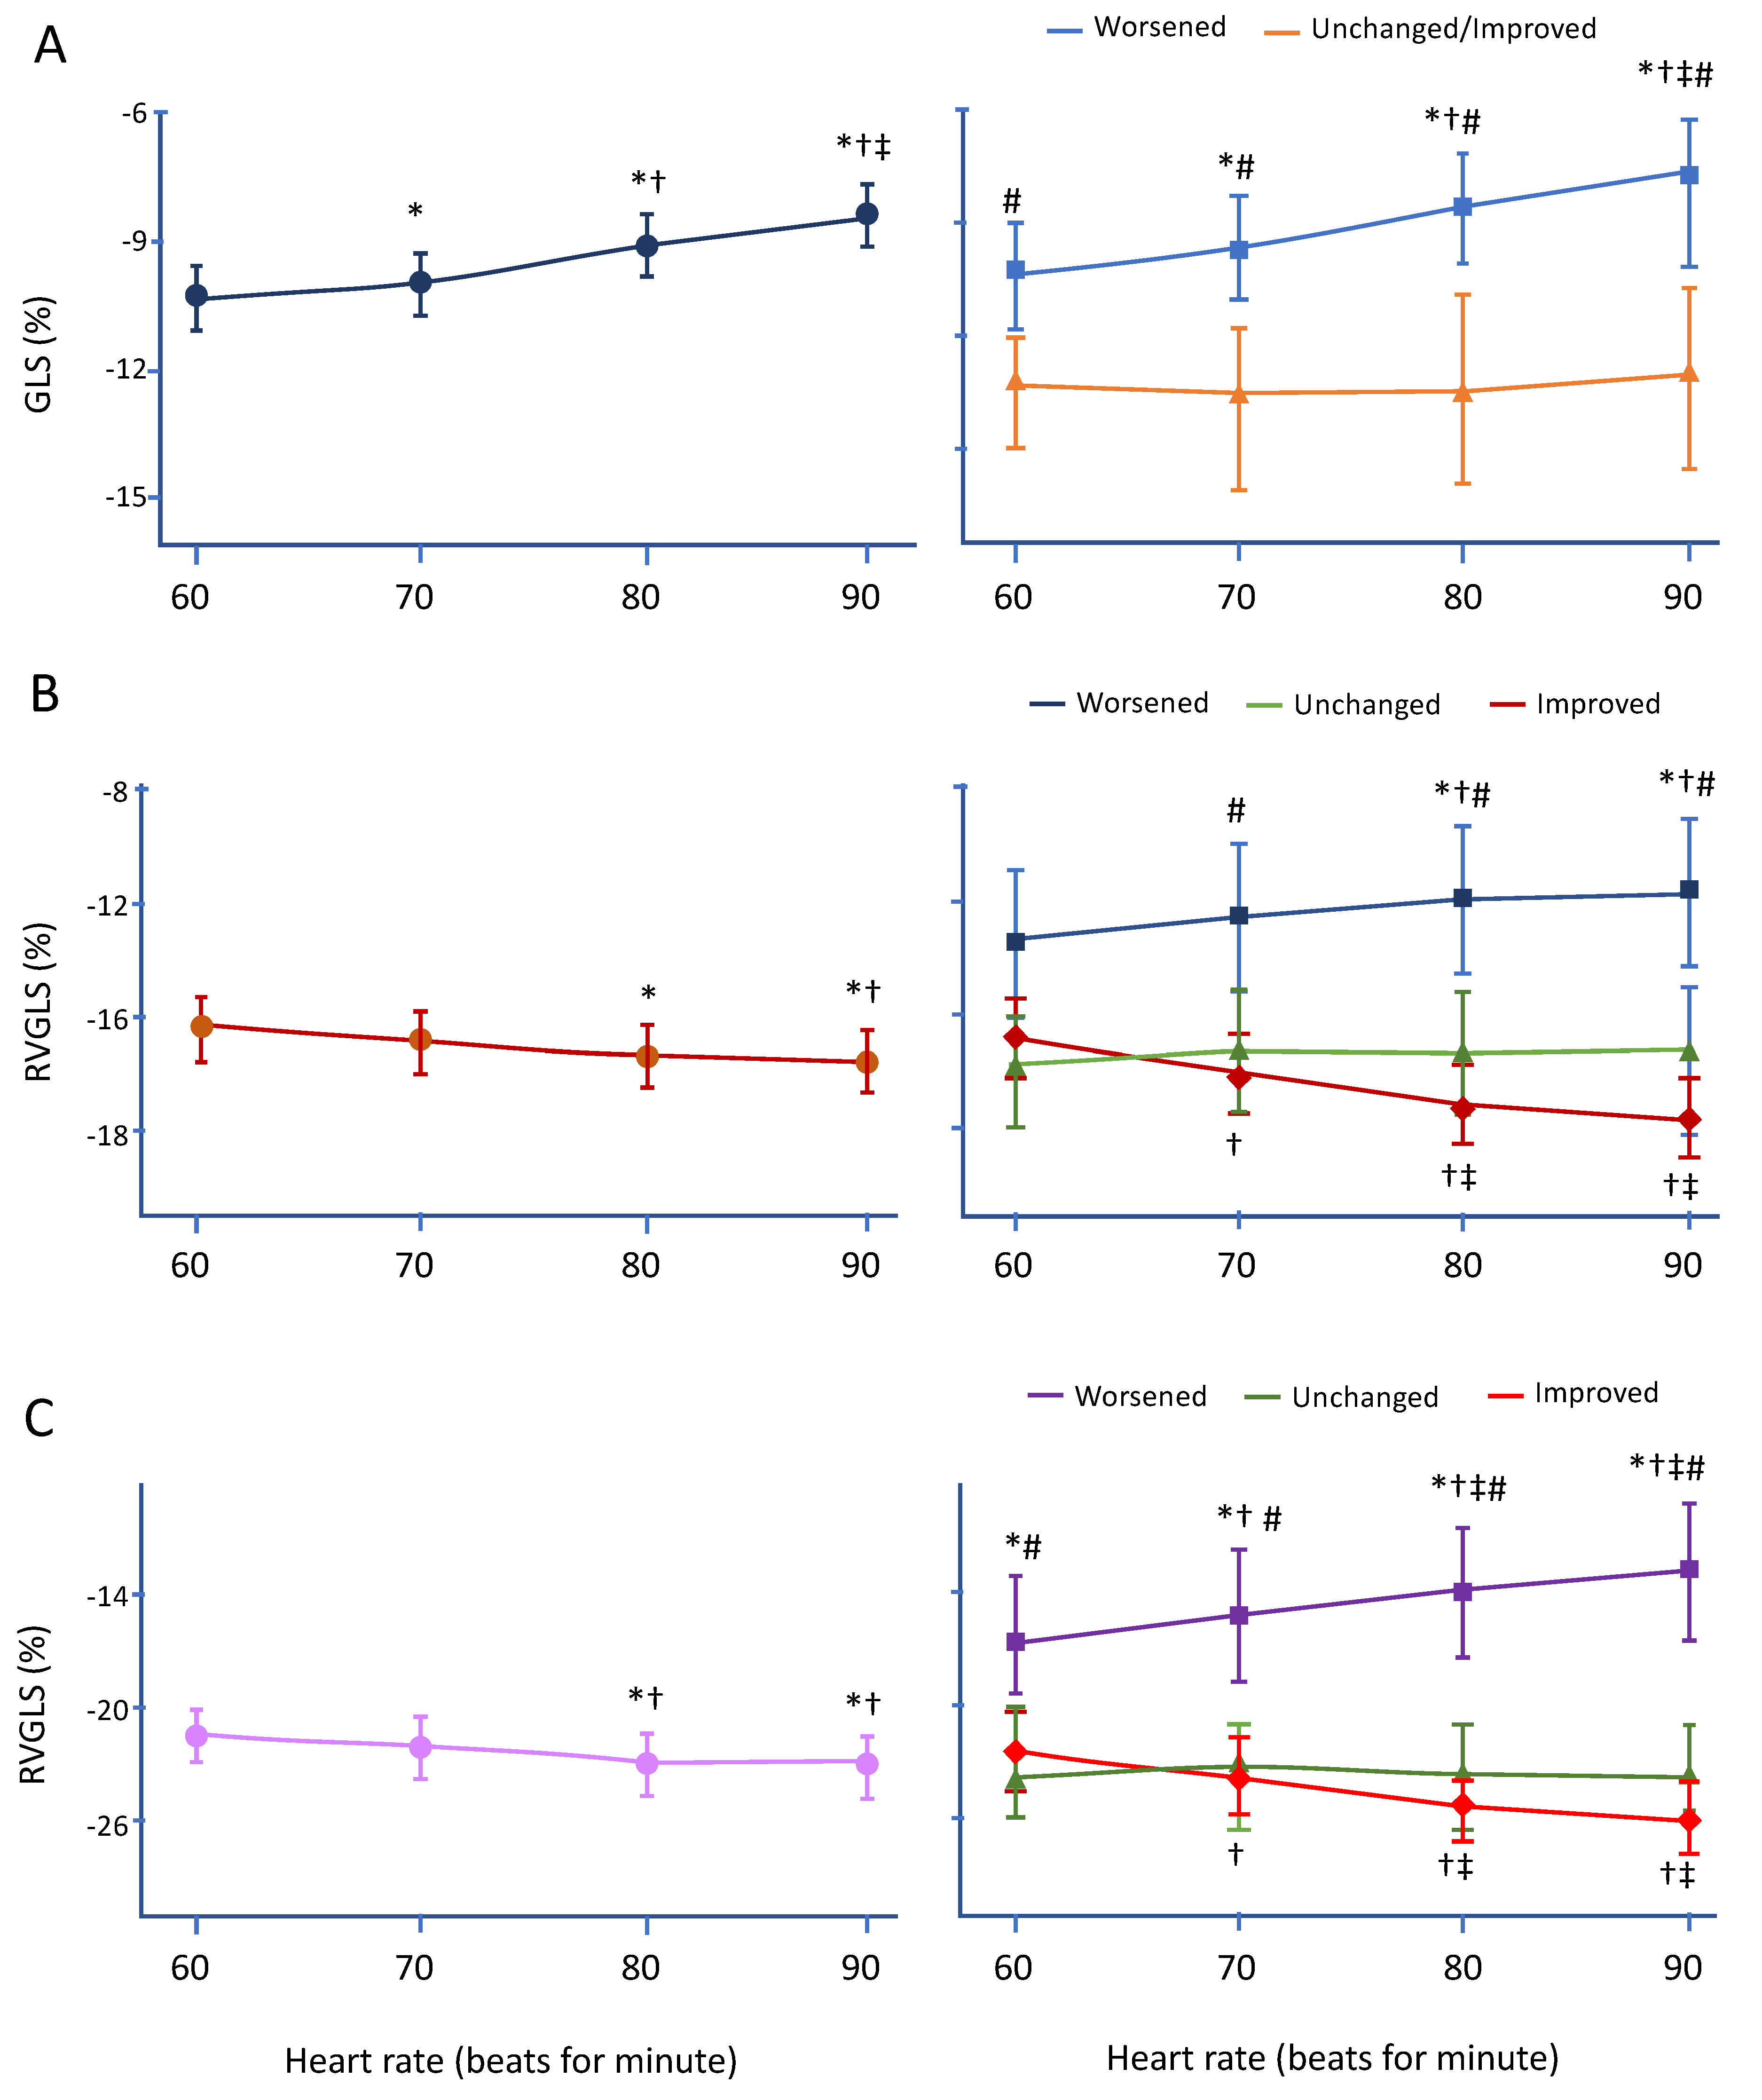
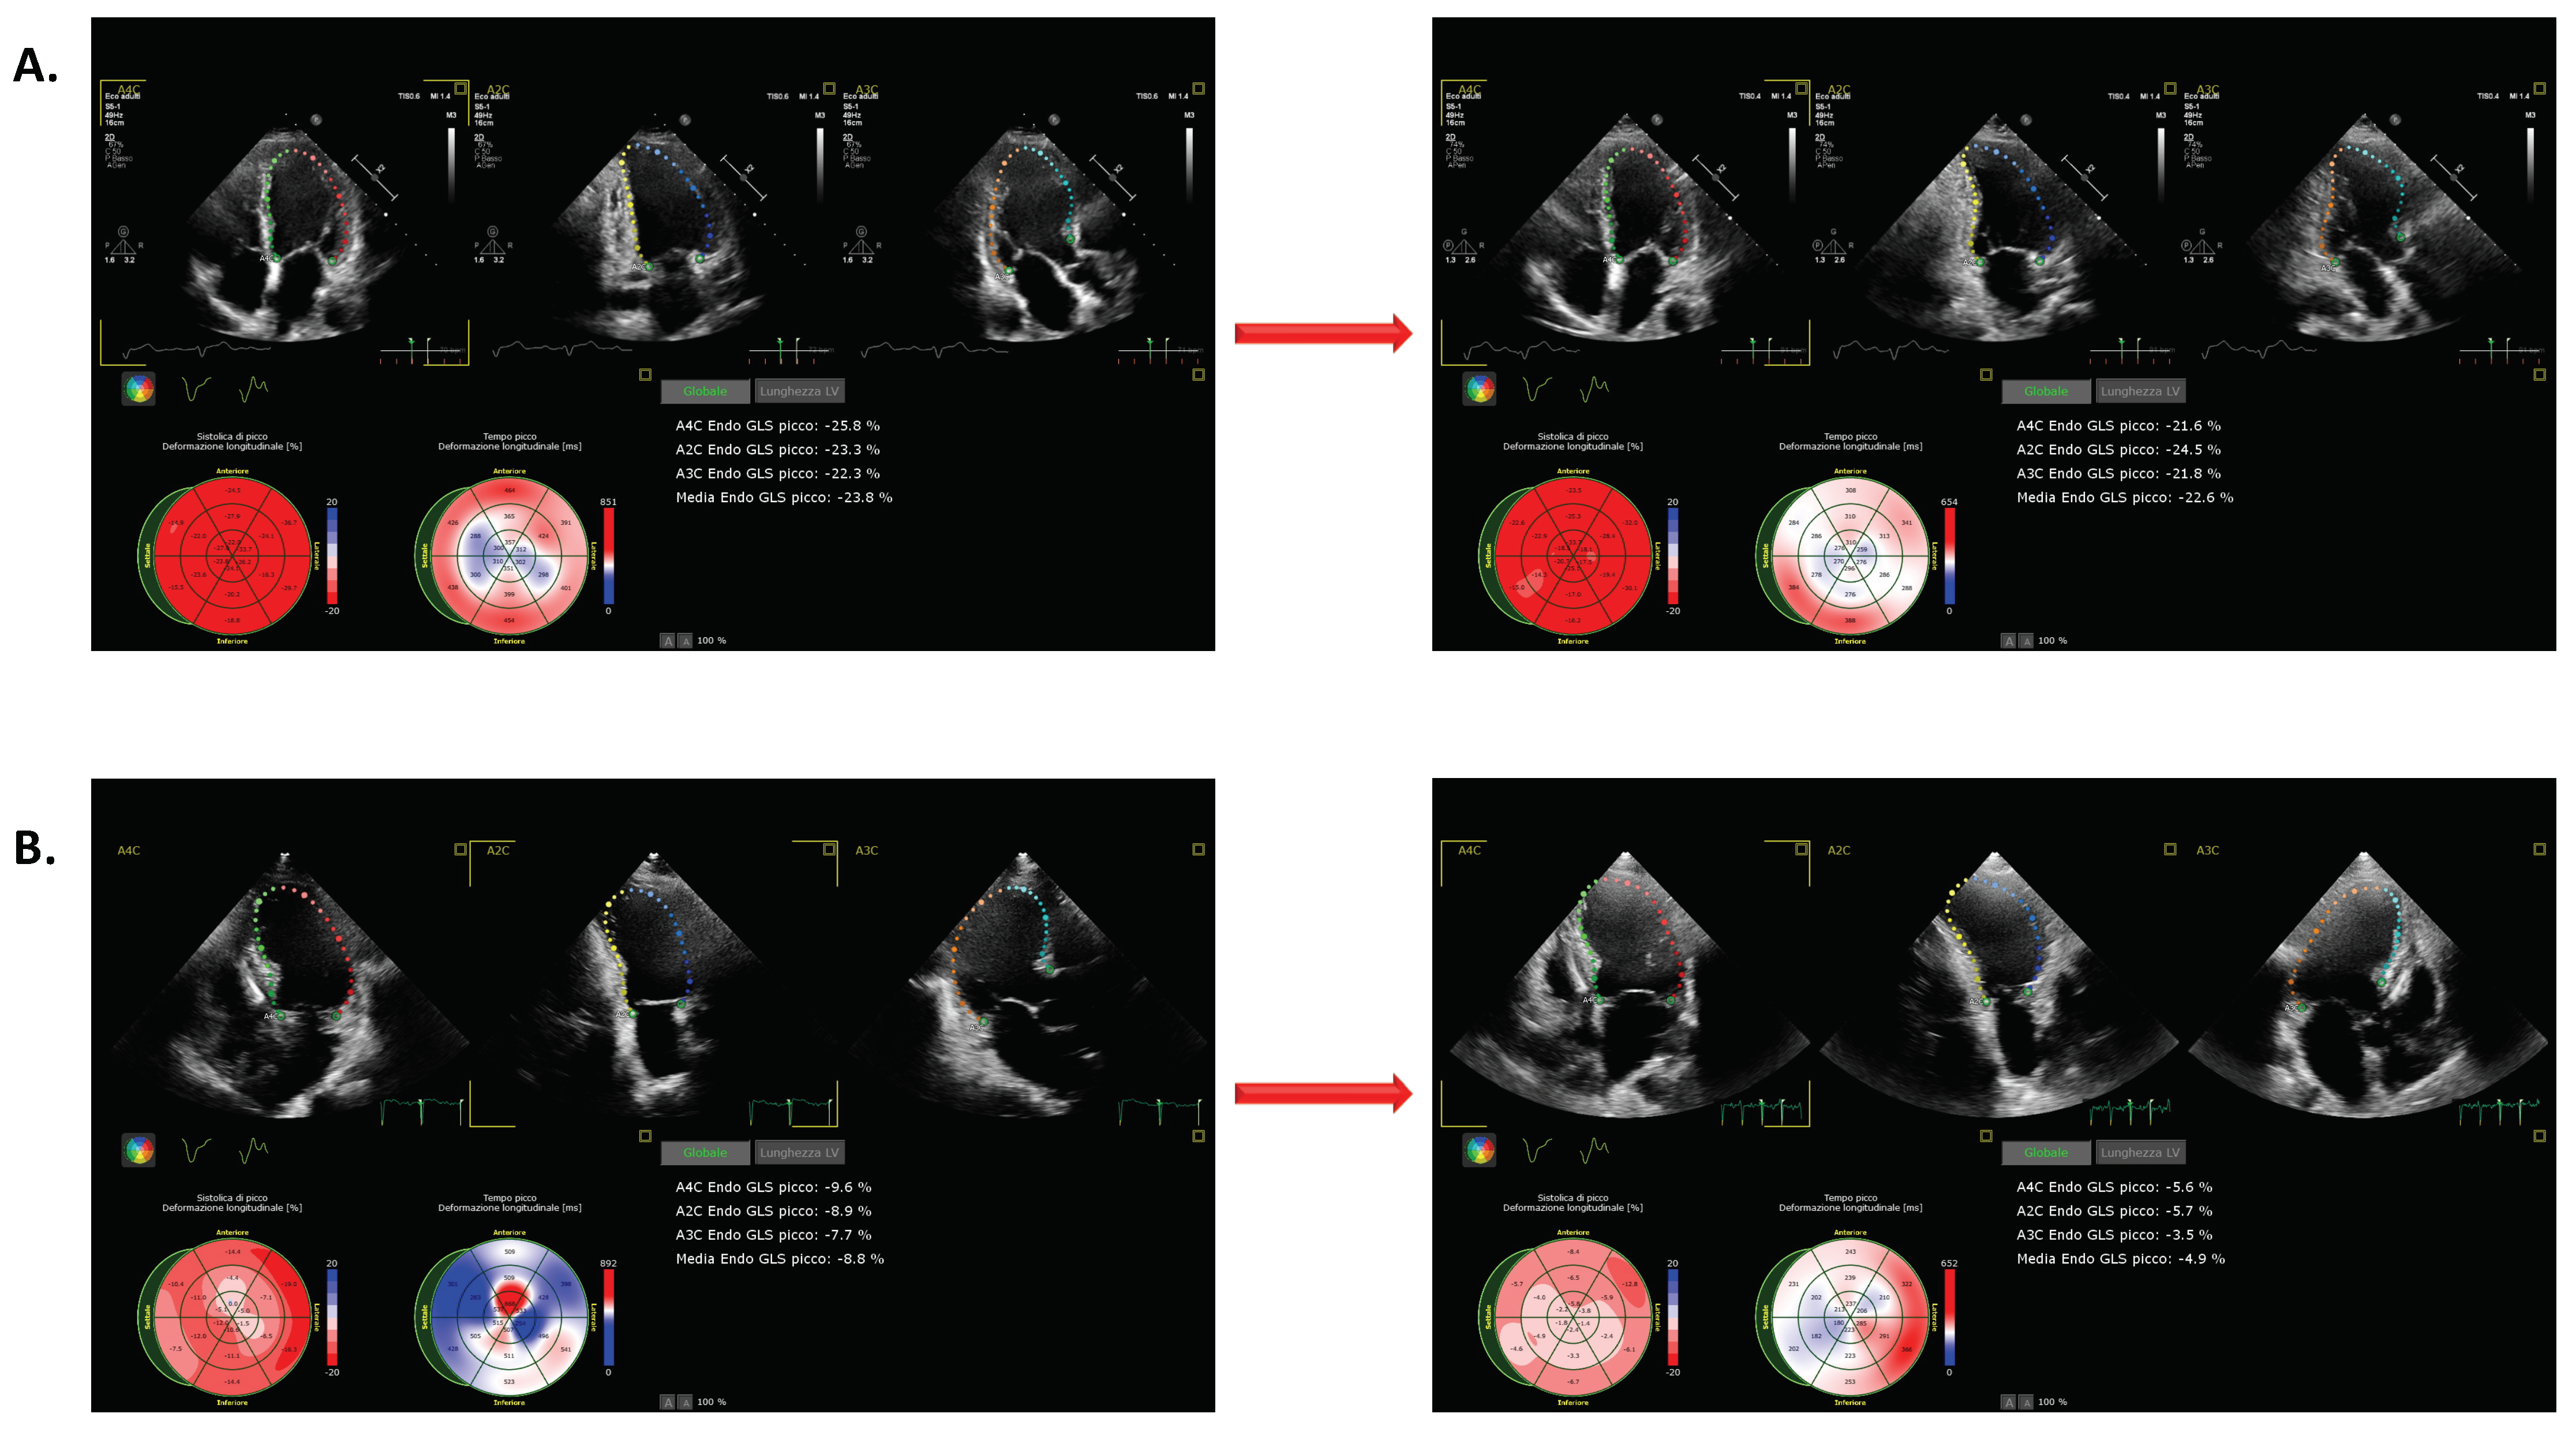
3.3. Changes in LVGLS during Pacing

Significant changes in LVGLS were observed overall in response to higher-paced HRs (Figure 1). Thirty-four (76%) patients exhibited deteriorations in LVGLS equal to or greater than 10%; only one patient exhibited some degree of improvement (Figure S1). Figure 1 also documents changes in LVGLS in participants who did and who did not exhibit deterioration in response to an increasing HR. An example of patient with and without worsening of LVGLS is reported in Figure 2. The percentage of participants exhibiting LVGLS deterioration was higher among those managed with an ICD either with or without CRT, at 71% and 86%, respectively, than in participants with PM (57.1%). However, this difference did not achieve statistical significance (p = 0.28). As shown in Table 2, participants with deteriorating LVGLS were those with reduced LV function, as determined by baseline LVEF, LVGLS, and Tei index values.
Maximum relative changes of LVGLS correlated significantly with the E/e’ ratios (r = −0.56; p < 0.001) (Figure S2). No significant correlations were identified when comparing LVGLS to LV end-diastolic volumes, LV end-systolic volumes, LV Tei index, stroke volume, cardiac output, TAPSE, RVGLS, or RVfwLS.

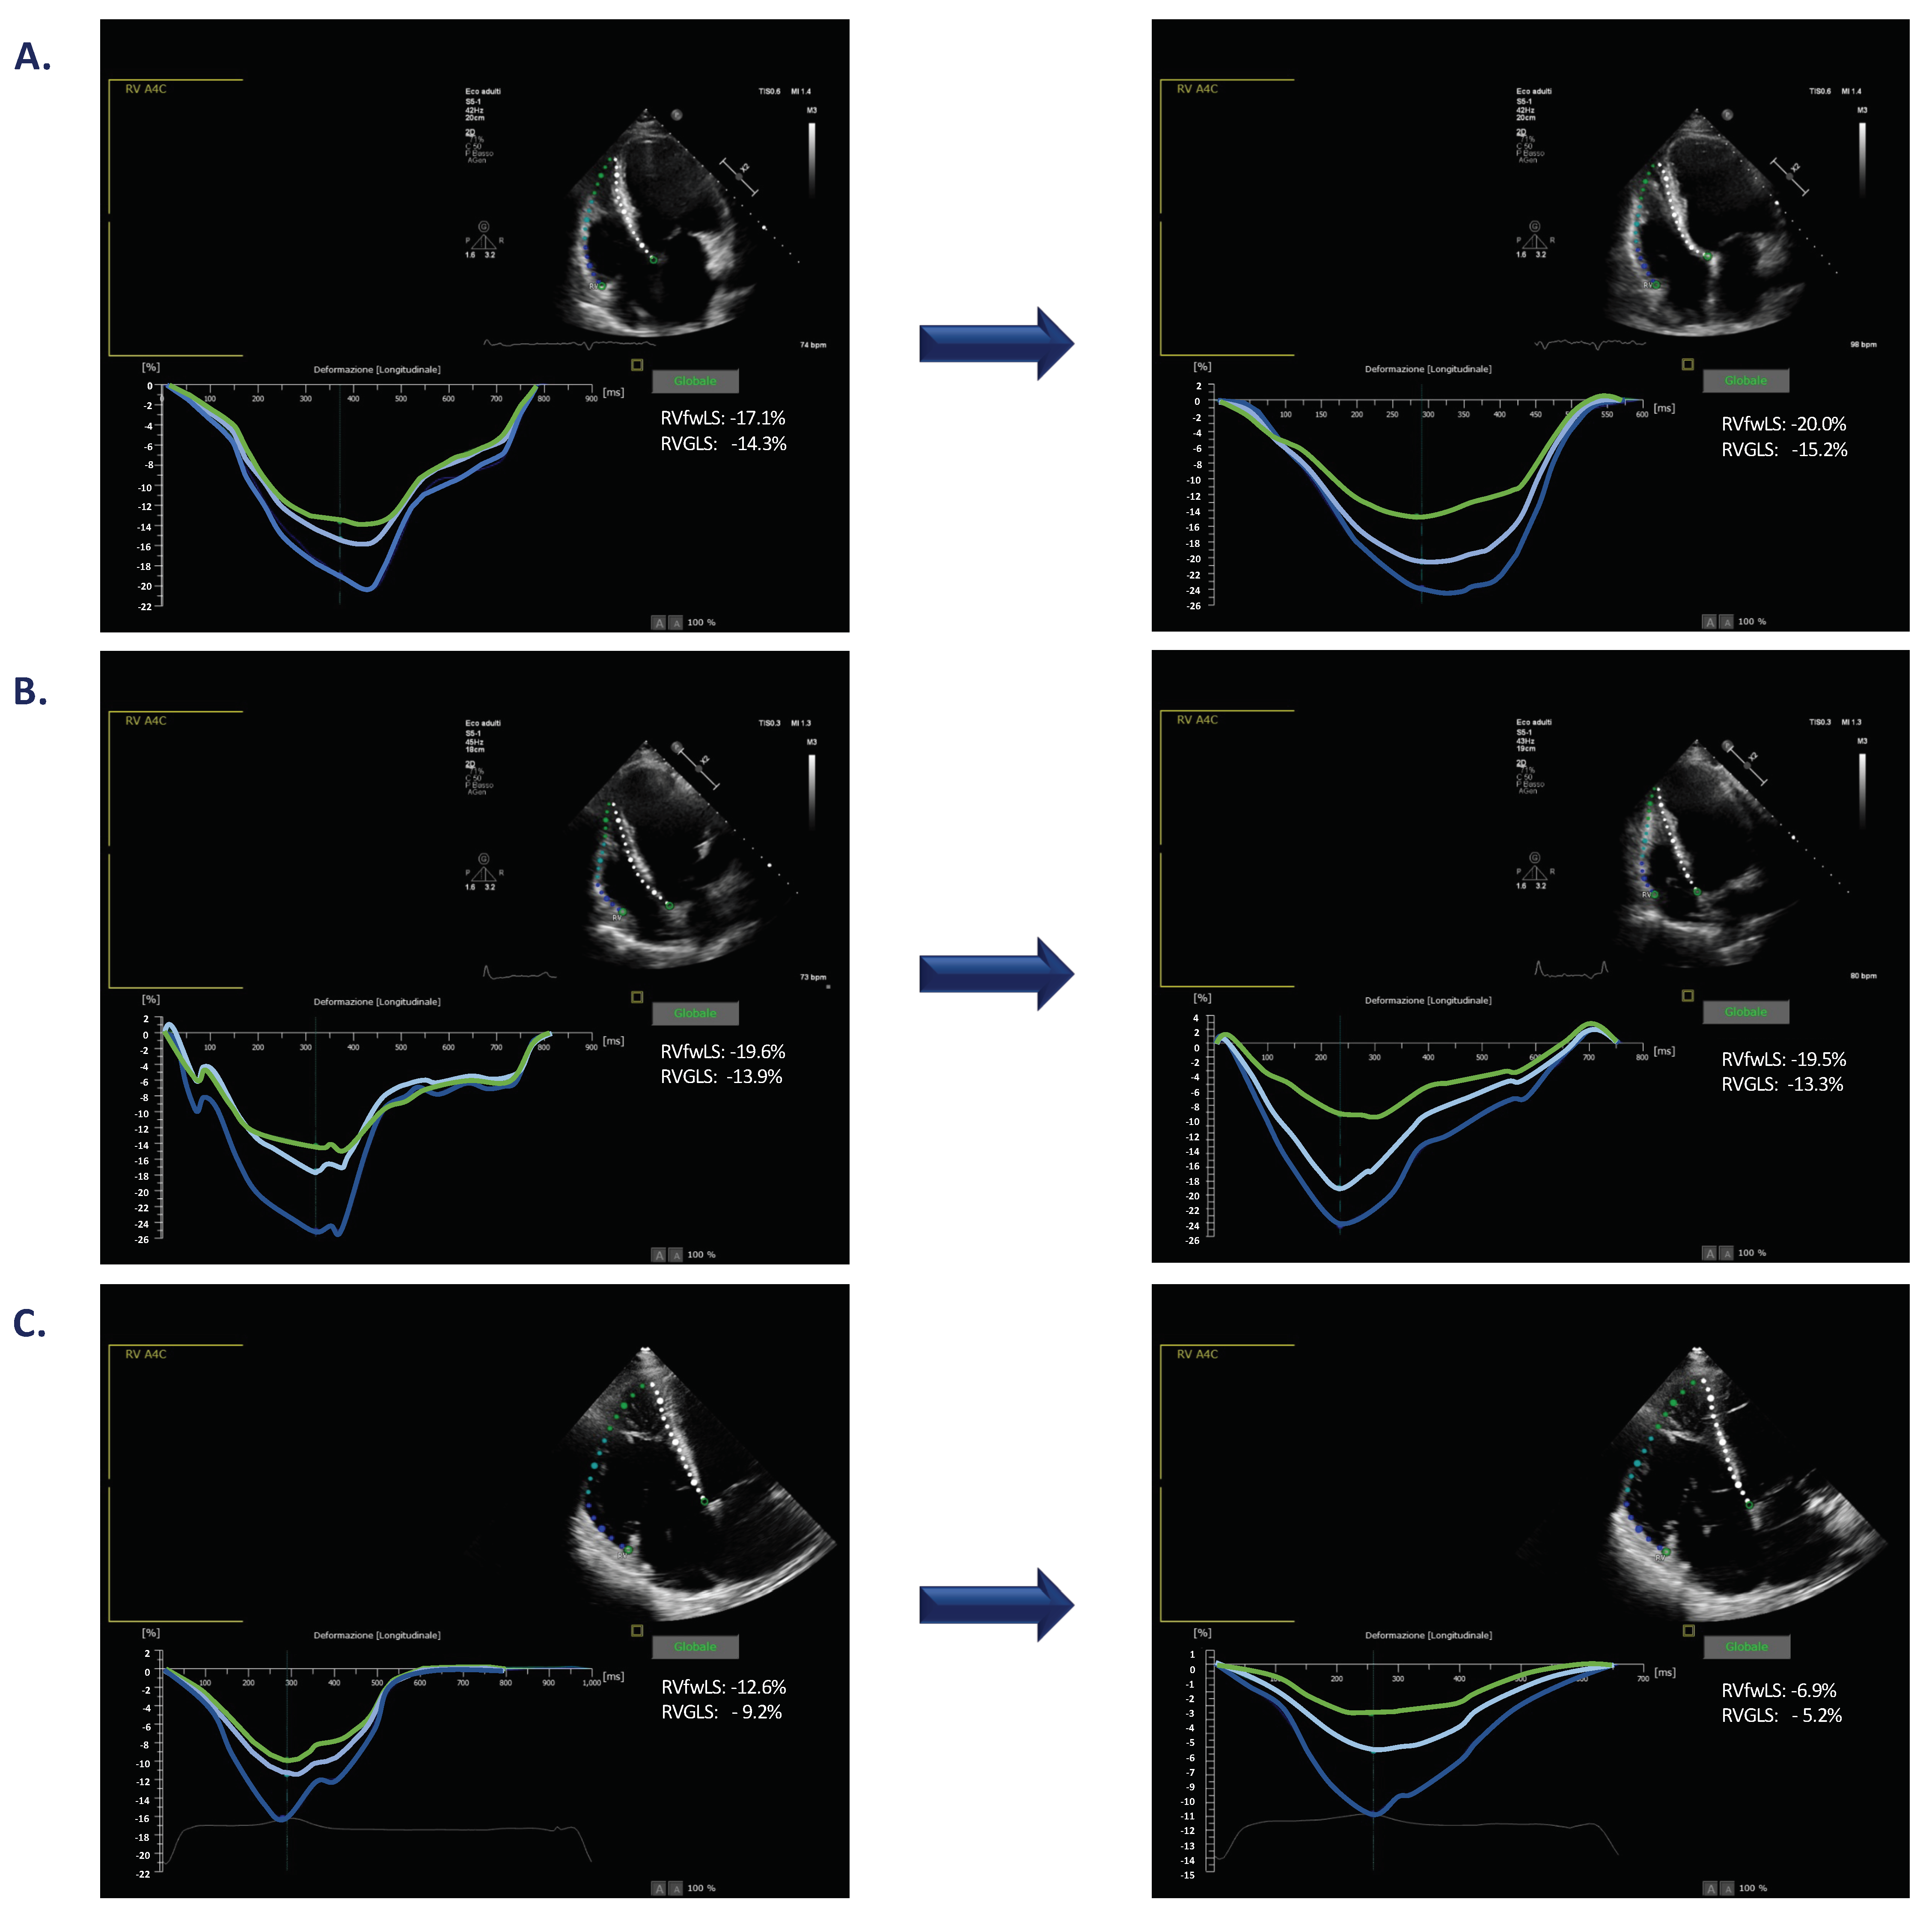
3.4. Changes in RVGLS during Pacing

Significant overall improvements in RVGLS were observed in response to higher-paced HR (Figure 1). Only eight participants (18%) exhibited worsening in RVGLS that were ≥10%. Twenty-one participants (47%) exhibited improvements and 17 (38%) maintained stable values at higher HRs (Figure S1). The findings shown in Figure 1 document changes of LVGLS in participants who experienced HR-related changes (i.e., improvement or worsening) in RVGLS as well as in those in whom this parameter remained unchanged. The percentage of patients who exhibited deterioration of RVGLS in response to changes in HR was similar in patients with ICD and with CRT at 19% and 24%, respectively. None of the participants carrying PM exhibited a deterioration of RVGLS. Interestingly, PM patients were more likely to experience HR-related improvements in RVGLS when compared to the responses of participants in Groups 1 and 2 (71% versus 59% and 51%, respectively). Figure 3 reports three different cases of RVGLS HR-related changes.
As shown in Table 3, participants who exhibited worsening of RVGLS were those who presented initially with depressed RV function as determined by baseline RVGLS and TAPSE. These participants also presented with higher PASP and diminished levels of RV arterial coupling. Maximum relative changes of RVGLS did not correlate significantly with LVGLS, E/e’, LV end-diastolic and end-systolic volumes, LV Tei index, stroke volume, cardiac output, or TAPSE.

3.5. Changes in RVfwLS during Pacing

Significant overall improvements in RVfwLS were observed in response to higher-paced HRs (Figure 1). Only seven patients (16%) experienced a worsening of RVfwLS that were greater or equal to 10%. Twenty-five participants (56%) exhibited improvements and 13 (29%) maintained stable values at higher HRs (Supplementary Figure S1). We identified a high concordance (78%) between measures of RV strain and HR (Figure S1).
The results shown in Figure 1 document HR-related changes in RVfwLS in participants in whom this parameter remained unchanged. Figure 3 reports, as well, three different cases of RVfwLS HR-related changes.
The percentages of participants that exhibited a worsening of RVfwLS were similar in patients with ICD and CRT (19% and 18%, respectively). By contrast, none of the patients with PM exhibited deteriorations in RVfwLS. Interestingly, participants with PM were more likely to experience improvements in RVfwLS compared to participants with ICD and CRT (86% versus 57% and 41%, respectively).
As shown in Table 4, participants exhibiting deteriorations in RVfwLS were those who presented initially with depressed LV and RV functions, as determined by baseline measurements of LVGLS, RVGLS, and RVfwLS. These participants also presented with higher PASPs and diminished levels of RV arterial coupling.
Maximum relative changes of RVfwLS correlated significantly with those of RVGLS (r = −0.75; p < 0.001). By contrast, no significant correlations were identified between maximum relative changes in RVfwLS and HR-associated maximum relative changes of LVGLS, left atrial volume, E/e’, LV end-diastolic, and end-systolic volumes, LV Tei index, stroke volume, cardiac output, or TAPSE.

4. Discussion

The main findings of this study address the heterogeneity of RVGLS and LVGLS responses to increases in HR. Most of the participants in this study exhibited significant reductions in LVGLS in response to increases in HR, together with improvements in both RVGLS and RVfwLS. The relevance of these findings can be considered from methodological, pathophysiologic, and clinical perspectives.
From a methodological perspective, our study focused on the analysis of LV and RV strain as assessed by STE. This methodology was validated using synthetic data sets and in vitro and in vivo studies, as well as in clinical settings [11,12,13,14,15,16]. Several studies performed over the last years demonstrated the advantages of evaluating both LV and RV longitudinal strain. Specifically, these studies revealed that this method provides reproducible results, is highly sensitive for detecting mild ventricular dysfunction, and provides relevant prognostic information [2,7,17,18]. For these reasons, we chose these measures to evaluate the response of ventricular function to changes in HR in our study. It is also important to recognize that we were able to evaluate strain in response to HR without any modifying of adrenergic stimuli. Left ventricular longitudinal strain correlates with exercise capacity and predicts exercise tolerance in patients affected by CHF as well as in healthy subjects [19,20]. However, there are few data about the heart rate response of LV and RV longitudinal strain in CHF patients. For this reason, we evaluated HR response by excluding the possible influence of adrenergic stimuli in terms of vasoconstriction, inotropic effect, and other modifications induced on the cardiovascular system. All of the participants enrolled in our study were managed with a pre-existing implantable device, which facilitated progressive increases in HR through atrial pacing. To achieve a more accurate estimate of HR-dependent ventricular function, we enrolled patients diagnosed with CHF managed with ICD or CRT-D devices, as well as those with preserved left and right ventricular function who were clinically managed with a pacemaker. We used the AutoStrain application (TOMTEC), which is a validated semi-automatic system that can reduce interobserver variability when analyzing variations in strain measurements. However, and despite the reliability of these new software applications, other factors may contribute to both inter- and intra-operator variability [16], including imaging-modality and software-related variations. To address this concern, we tested the inter-observer reproducibility of both RV and LV longitudinal strain measures in 19 participants and confirmed the very high reproducibility and the accuracy of the software employed in this study.
Apart from the methodological aspects, the results of our study have highly relevant pathophysiological implications. Previous studies that aimed to evaluate HR-related changes in LV function generated largely conflicting results. Mak et al. [21] examined the impact of HR on deformation indices and the force-frequency relationship based on data obtained by LV catheterization. Among their results, they observed a systematic HR-related decline in longitudinal strain values with no significant variations of strain rate and a modest increase in LV dP/dtmax. By contrast, Fredholm et al. [22] evaluated the responses of a group of twenty-one patients early after cardiac surgery and reported that systolic and early diastolic strain rates were dependent on both preload and HR. They found that a pacing-induced increase in HR resulted in an elevated rate of LV systolic strain, although it did not have any impact on longitudinal strain. These findings were consistent with those of Esfandiari et al. [23], who demonstrated that atrial pacing resulted in improvements in early diastolic relaxation in patients with both normal and depressed LV systolic function. The differences observed between these studies might be explained by different preload conditions; we note that, in contrast to the methodology of Mak et al. [21], Fredholm et al. [22] maintained constant cardiac filling pressures by fluid infusion. In the latter study, the fact that LVGLS was not impaired during atrial pacing thus confirms the hypothesis that LVGLS is a preload-dependent parameter. These findings are consistent with our results. Likewise, and consistent with the findings reported by Mak et al. [22], most of our study participants exhibited deteriorations in LVGLS at higher stimulation frequencies, notably those carrying a diagnosis of CHF. We also identified deteriorations in LVGLS at higher HR; this response is most apparent among the participants who presented with diminished LV function at baseline, as determined by measures of longitudinal strain, Tei index, and LVEF.
The pathophysiological relevance of HR-related worsening in LVGLS is also demonstrated by the relationship of this response with increased E/e’, which is considered to be a parameter that reflects LV filling pressures [6]. This relationship suggests that patients who exhibit HR-related reductions of LV systolic function as assessed by LVGLS might benefit from strategies that maintain lower HR, consistent with currently recommended therapeutic strategies [10,24]. These findings might be considered when designing ICD atrial paced rhythm programs. Our findings could represent the first step toward a rational programming of implanted devices to improve cardiac performance and functional capacity. Moreover, our findings might also be considered from the perspective of the RV. HR-dependent RV function may also be a fundamental parameter for defining the optimal stimulation frequency.
To the best of our knowledge, there are no previous studies that have explored HR-dependent changes in RV strain. Both RVGLS and RVfwLS have been identified as accurate measures of RV systolic function and prognosis [3,4]. In this study, we found that HR-dependent RVGLS and RVfwLS responses differ from those of LVGLS, as they can both worsen but also improve at higher stimulation frequencies. These results permit us to speculate on the interventricular interdependence of RV function and the different mechanics associated with ventricular contraction. Earlier studies have revealed that RV function is coupled with low hydraulic impedance of the pulmonary circulation and that right-sided pressures are significantly lower than those on the left side of the heart [24]. Compared with the LV, RV function is more frequently influenced by increased preload and even more so by afterload. Slight variations in pulmonary pressure can impair RV function and global cardiac performance, even in the setting of normal preload [25]. The ability of the RV to increase strain at higher HR may suggest a role for this compartment as a reservoir. Higher HRs would favor RV emptying in support of pulmonary and systemic circulation as well as LV filling. This phenomenon may be facilitated by differential arterial pressures experienced by the RV and the LV. LV dysfunction coupled with the higher systemic afterloads might explain the relatively limited LV responses to increases in HR compared to those of the RV and its comparatively lower arterial pulmonary pressures. RV dysfunction and higher right pulmonary artery pressures may compromise these compensation mechanisms [18], as demonstrated by the worsening of both RVGLS and RVfwLS in participants who presented with depressed RV function and higher PASPs at baseline (i.e., with diminished right ventriculo-arterial coupling at baseline).
Finally, our findings could be relevant for a better management of paced HR in CHF patients. In HFrEF patients, it is recommended to keep sinus HR low [10], and for this reason, ICD and CRT are programmed with lower paced HR. However, in order to preserve the exercise-induced increase of HR, the devices are also programmed to increase paced HR during exercise using algorithm for HR responsiveness. However, both baseline and maximum HR programming are not based on the study of the HR-related changes of LV and RV function. The use of strain measure responses to HR could be investigated as a tool for an optimal paced HR device programming.
Limitations and perspective. Although our results are interesting and highlight the potential relevance of the observed complex responses to changes in HR, our study was limited by the small cohort of participants enrolled. While our study focused on a population of patients with a high prevalence of CHF, this may be a bias with respect to a larger understanding of the hemodynamic implications of HR modulation. Of particular note, the differences in LV and RV responses suggest the need for further evaluation in a larger patient sample. Furthermore, we observed a relationship between LV and RV systolic function and HR response, which should be confirmed by the current gold standard for the evaluation of both LV and RV ejection fraction, i.e., cardiac magnetic resonance [26]. Moreover, it is not yet clear whether these findings might have an impact on clinical practice and the management of the patients diagnosed with left and/or right HF. However, if ultimately confirmed, our findings suggest that a tailored optimal HR responsiveness could be identified for each patient.

5. Conclusions

Our findings demonstrate that increases in HR have distinct and heterogeneous effects on both RV and LV function in patients diagnosed with CHF, as estimated by measurements of two-dimensional longitudinal strain. While LVGLS tended to worsen at higher HR/stimulation frequencies, RV strain (both RVGLS and RVfwLS) improved in a significant cohort of CHF patients. A worsening of LV function occurs more frequently in patients who present with reduced LV function at baseline and is associated with an increase in E/e’, a value that reflects LV filling pressures. Reduced RV function and impaired ventriculo-arterial coupling are both associated with an HR-dependent deterioration of RV strain measures. These findings may ultimately be used for tailoring the programmed heart rate responsiveness of implantable devices in order to optimize cardiac performance, considering that CHF patients present a heterogeneous response to HR. However, additional studies will be needed to confirm these results and to demonstrate the clinical usefulness of a tailored optimal heart response in order to improve functional capacity.

Supplementary Materials

The following are available online at https://www.mdpi.com/article/10.3390/app12020556/s1, Figure S1: Overall changes in LVGLS (panel A) and RVGLS and RVfwLS (panel B) in response to increasing HR. Figure S2: Linear correlation between the maximum E/e’ ratios and maximum LVGLS in response to changes in HR. Table S1: Clinical characteristics of participants in the groups carrying implantable cardioverter defibrillator, implantable cardioverter defibrillator and cardiac resynchronization therapy and a pacemaker. Table S2: Echocardiographic characteristics of participants in the groups carrying implantable cardioverter defibrillator, implantable cardioverter defibrillator and cardiac resynchronization therapy and a pacemaker.

Author Contributions

V.D.T. contributed to the design of the study, enrolled patients, collected data, executed and analyzed echocardiograms, contributed to statistical analysis, to the writing of the paper and to its final approval; R.B. contributed to the enrollment of the patients, collected data, executed and analyzed echocardiograms for reproducibility, contributed to the writing of the paper and to the approval of its final version; V.M. contributed to the design of the study, supervised the study protocol, critically revised the draft of the paper and approved its final version; M.C., G.C. and G.G. contributed to the enrollment of the patients, collected data, contributed to the writing of the paper and to the approval of its final version; P.P. contributed to the study by managing implantable devices for the study protocol, critically revised the draft of the paper and approved its final version; A.P. contributed to the data management, to the statistical analysis and to the writing of the results and approved the final version of the paper; R.I. and M.D.B. critically revised the draft of the paper and approved its final version; N.D.B. supervised the study protocol, critically revised the draft of the paper and approved its final version; M.I. conceived the design of the study, enrolled patients, collected data, executed and analyzed echocardiograms, performed statistical analysis, critically revised the draft of the paper and approved its final version. All authors have read and agreed to the published version of the manuscript.

Funding

This research received no external funding.

Institutional Review Board Statement

The study was conducted according to the guidelines of the Declaration of Helsinki and approved by the Institutional Ethics Committee of the Polyclinic University Hospital of Foggia, Foggia, Italy (protocol code 68/CE/20, date of approval 26 May 2020).

Informed Consent Statement

Informed consent was obtained from all subjects involved in the study.

Data Availability Statement

The datasets used and/or analyzed during the current study are available from the corresponding author upon request.

Conflicts of Interest

The authors declare no conflict of interest.

References

  1. Dandel, M.; Lehmkuhl, H.; Knosalla, C.; Suramelashvili, N.; Hetzer, R. Strain and strain rate imaging by echocardiography—Basic concepts and clinical applicability. Curr. Cardiol. Rev. 2009, 5, 133–148. [Google Scholar] [CrossRef] [PubMed] [Green Version]
  2. Iacoviello, M.; Puzzovivo, A.; Guida, P.; Forleo, C.; Monitillo, F.; Catanzaro, R.; Lattarulo, M.S.; Antoncecchi, V.; Favale, S. Independent role of left ventricular global longitudinal strain in predicting prognosis of chronic heart failure patients. Echocardiography 2013, 30, 803–811. [Google Scholar] [CrossRef]
  3. Iacoviello, M.; Citarelli, G.; Antoncecchi, V.; Romito, R.; Monitillo, F.; Leone, M.; Puzzovivo, A.; Lattarulo, M.S.; Rizzo, C.; Caldarola, P.; et al. Right ventricular longitudinal strain measures independently predict chronic heart failure mortality. Echocardiography 2016, 33, 992–1000. [Google Scholar] [CrossRef]
  4. Monitillo, F.; Di Terlizzi, V.; Gioia, M.I.; Barone, R.; Grande, D.; Parisi, G.; Brunetti, N.D.; Iacoviello, M. Right Ventricular Function in Chronic Heart Failure: From the Diagnosis to the Therapeutic Approach. J. Cardiovasc. Dev. Dis. 2020, 7, 12. [Google Scholar] [CrossRef]
  5. Moonen, M.; Lancellotti, P.; Zacharakis, D.; Pierard, L. The value of 2D strain imaging during stress testing. Echocardiography 2009, 26, 307–314. [Google Scholar] [CrossRef] [PubMed]
  6. Lang, R.M.; Badano, L.P.; Mor-Avi, V.; Afilalo, J.; Armstrong, A.; Ernande, L.; Flachskampf, F.A.; Foster, E.; Goldstein, S.A.; Kuznetsova, T.; et al. Recommendations for cardiac chamber quantification by echocardiography in adults: An update from the American Society of Echocardiography and the European Association of Cardiovascular Imaging. J. Am. Soc. Echocardiogr. 2015, 28, 1–39. [Google Scholar] [CrossRef] [PubMed] [Green Version]
  7. Hasselberg, N.E.; Haugaa, K.H.; Sarvari, S.I.; Gullestad, G.; Andreassen, A.K.; Smiseth, O.A.; Edvardsen, T. Left ventricular global longitudinal strain is associated with exercise capacity in failing hearts with preserved and reduced ejection fraction. Eur. Heart J. Cardiovasc. Imaging 2015, 16, 217–224. [Google Scholar] [CrossRef] [Green Version]
  8. Mulieri, L.A.; Hasenfuss, G.; Leavitt, B.; Allen, P.D.; Alpert, N.R. Altered Myocardial Force-Frequency Relation in Human Heart Failure. Circulation 1992, 85, 1743–1750. [Google Scholar] [CrossRef] [Green Version]
  9. Phillips, P.J.; Gwathmey, J.K.; Feldman, M.D.; Schoen, F.; Grossman, W.; Morgan, J.P. Post-extrasystolic potentiation and the force-frequency relationship: Differential augmentation of myocardial contractility in working myocardium from patients with end-stage heart failure. J. Mol. Cell Cardiol. 1990, 22, 99–110. [Google Scholar] [CrossRef]
  10. McDonagh, T.A.; Metra, M.; Adamo, M.; Gardner, R.S.; Baumbach, A.; Böhm, M.; Burri, H.; Butler, J.; Čelutkienė, J.; Chioncel, O.; et al. ESC Guidelines for the diagnosis and treatment of acute and chronic heart failure: Developed by the Task Force for the diagnosis and treatment of acute and chronic heart failure of the European Society of Cardiology (ESC) With the special contribution of the Heart Failure Association (HFA) of the ESC. Eur. Heart J. 2021, 42, 3599–3726. [Google Scholar]
  11. Alessandrini, M.; Chakraborty, B.; Heyde, B.; Bernard, O.; De Craene, M.; Sermesant, M.; D’Hooge, J. Realistic vendor-specific synthetic ultrasound data for quality assurance of 2-D speckle tracking echocardiography: Simulation pipeline and open access database. IEEE Trans. Ultrason. Ferroelectr. Freq. Control. 2018, 65, 411–422. [Google Scholar] [CrossRef]
  12. Zhou, Y.; Giffard-Roisin, S.; De Craene, M.; Camarasu-Pop, S.; D’Hooge, J.; Alessandrini, M.; Friboulet, D.; Sermesant, M.; Bernard, O. A framework for the generation of realistic synthetic cardiac ultrasound and magnetic resonance imaging sequences from the same virtual patients. IEEE Trans. Med. Imaging 2018, 37, 741–754. [Google Scholar] [CrossRef] [Green Version]
  13. Korinek, J.; Wang, J.; Sengupta, P.P.; Miyazaki, C.; Kjaergaard, J.; McMahon, E.; Abraham, T.P.; Belohlavek, M. Two-dimensional strain—A Doppler-independent ultrasound method for quantitation of regional deformation: Validation in vitro and in vivo. J. Am. Soc. Echocardiogr. 2005, 18, 1247–1253. [Google Scholar] [CrossRef] [PubMed]
  14. Amzulescu, M.S.; Langet, H.; Saloux, E.; Manrique, A.; Boileau, L.; Slimani, A.; Allain, P.; Roy, C.; de Meester, C.; Pasquet, A.; et al. Head-to-head comparison of global and regional two-dimensional speckle tracking strain versus cardiac magnetic resonance tagging in a multicenter validation study. Circ. Cardiovasc. Imaging 2017, 10, e006530. [Google Scholar] [CrossRef] [Green Version]
  15. Bansal, M.; Cho, G.Y.; Chan, J.; Leano, R.; Haluska, B.A.; Marwick, T.H. Feasibility and accuracy of different techniques of two-dimensional speckle-based strain and validation with harmonic phase magnetic resonance imaging. J. Am. Soc. Echocardiogr. 2008, 21, 1318–1325. [Google Scholar] [CrossRef]
  16. Mirea, O.; Pagourelias, E.D.; Duchenne, J.; Bogaert, J.; Thomas, J.D.; Badano, L.P.; Voigt, J.U. Variability and Reproducibility of Segmental Longitudinal Strain Measurement. A Report from the EACVI-ASE Strain Standardization Task Force. JACC Cardiovasc. Imaging 2018, 11, 15–24. [Google Scholar] [CrossRef] [PubMed]
  17. Iacoviello, M.; Forleo, C.; Puzzovivo, A.; Nalin, I.; Guida, P.; Anaclerio, M.; Marangelli, V.; Sorrentino, S.; Monitillo, F.; Ciccone, M.M.; et al. Altered two-dimensional strain measures of the right ventricle in patients with Brugada syndrome and arrhythmogenic right ventricular dysplasia/cardiomyopathy. Eur. J. Echocardiogr. 2011, 12, 773–781. [Google Scholar] [CrossRef] [Green Version]
  18. Iacoviello, M.; Monitillo, F.; Citarelli, G.; Leone, M.; Grande, D.; Antoncecchi, V.; Rizzo, C.; Terlizzese, P.; Romito, R.; Caldarola, P.; et al. Right ventriculo-arterial coupling assessed by two-dimensional strain: A new parameter of right ventricular function independently associated with prognosis in chronic heart failure patients. Int. J. Cardiol. 2017, 15, 318–321. [Google Scholar] [CrossRef] [PubMed]
  19. Tsougos, E.; Angelidis, G.; Gialafos, E.; Tzavara, C.; Tzifos, C.; Tsougos, I.; Georgoulias, P. Myocardial strain may predict exercise tolerance in patients with reduced and mid-range ejection fraction. Hell. J. Cardiol. 2018, 59, 331–335. [Google Scholar] [CrossRef] [PubMed]
  20. Von Scheidt, F.; Kiesler, V.; Kaestner, M.; Bride, P.; Krämer, J.; Apitz, C. Left ventricular strain and strain rate during submaximal semisupine bicycle exercise stress echocardiography in healthy adolescents and young adults: Systematic protocol and reference values. J. Am. Soc. Echocardiogr. 2020, 33, 848–857. [Google Scholar] [CrossRef]
  21. Mak, S.; Van Spall, H.G.C.; Wainstein, R.V.; Sasson, Z. Strain, strain rate, and the force frequency relationship in patients with and without heart failure. J. Am. Soc. Echocardiogr. 2012, 25, 341–348. [Google Scholar] [CrossRef]
  22. Fredholm, M.; Jörgensen, K.; Houltz, E.; Ricksten, S.E. Load-dependence of myocardial deformation variables—A clinical strain-echocardiographic study. Acta Anaesthesiol. Scand. 2017, 61, 1155–1165. [Google Scholar] [CrossRef] [PubMed]
  23. Esfandiari, S.; Fuchs, F.; Wainstein, R.V.; Chelvanathan, A.; Mitoff, P.; Sasson, Z.; Mak, S. Heart rate-dependent left ventricular diastolic function in patients with and without heart failure. J. Card. Fail. 2015, 21, 68–75. [Google Scholar] [CrossRef] [PubMed]
  24. Bohm, M.; Swedberg, K.; Komajda, M.; Borer, J.S.; Ford, I.; Dubost-Brama, A.; Lerebours, G.; Tavazzi, L. Heart rate as a risk factor in chronic heart failure (SHIFT): The association between heart rate and outcomes in a randomised placebo-controlled trial. Lancet 2010, 376, 886–894. [Google Scholar] [CrossRef]
  25. Friedberg, M.K.; Redington, A.N. Right versus left ventricular failure: Differences, similarities, and interactions. Circulation 2014, 129, 1033–1044. [Google Scholar] [CrossRef] [Green Version]
  26. Bellenger, N.G.; Burgess, M.I.; Ray, S.G.; Lahiri, A.; Coats, A.J.S.; Cleland, J.G.F.; Pennell, D.J. Comparison of left ventricular ejection fraction and volumes in heart failure by echocardiography, radionuclide ventriculography and cardiovascular magnetic resonance. Are they interchangeable? Eur. Heart J. 2000, 21, 1387–1396. [Google Scholar] [CrossRef] [PubMed] [Green Version]
Figure 1. LVGLS (A), RVGLS (B), RVfwGLS (C) determined for all study participants (left) and in participants who demonstrated improvement, deterioration, or whose conditions remained unchanged (right); * p < 0.05 vs. HR of 60 beats/min; † p < 0.05 vs. HR of 70 beats/min; ‡ p < 0.05 vs. HR of 80 beats/min; # p < 0.05 vs. all other patients (as shown in the right panel (A) or panel (C), respectively).
Applsci 12 00556 g001
Figure 2. Two examples of changes in LVGLS. The example in (A) documents improved LVGLS with increasing HR. The example in (B) documents a deterioration in LVGLS in response to increasing HR.
Applsci 12 00556 g002
Figure 3. Three examples of changes in RVGLS. The example in (A) documents improved RVGLS with increasing HR. The examples in (B,C) document no changes and deterioration in RVGLS, respectively, in response to increasing HR. Note that the scale of left and right panels automatically changes according to the strain values recorded.
Applsci 12 00556 g003
Table 1. Clincal and echocardiographic characteristics of the study population.
Clinical CharacteristicsEchocardiographic
Characteristics
Age (years)66 ± 13LVEDV (mL)176 ± 87
Male, n (%)36 (80%)LVESV (mL)121 ± 76
BMI (kg/m2)24 ± 4LVEF (%)36 ± 13
Ischemic cardiomyopathy, n (%)19 (42%)LVGLS (%)−10.2 ± 4.0
Arterial hypertension, n (%)29 (64%)LV Tei index0.64 ± 0.23
Diabetes mellitus, n (%)13 (29%)SV (mL)65 ± 16
Dyslipidemia, n (%)32 (71%)CO (L/min)4.2 ± 1.1
CHF, n (%)39 (87%)CI (L/min/m2)2.2 ± 0.6
SAP (mmHg)116 ± 21LVMI (g/m2)156 ± 40
Heart rate (bpm)66 ± 7LAVi (mL)40 ± 19
LVEF ≤ 40%, n (%)31 (69%)e’ s (cm/s)5.0 ± 1.4
NYHA class, n (%) I7 (16%)e’ l (cm/s)6.9 ± 2.8
NYHA class, n (%) II21 (46%)e’ m (cm/s)5.9 ± 1.9
NYHA class, n (%) III17 (38%)E/e’ ratio13.1 ± 5.9
GFR-EPI (mL/min/1.73 m2)80 ± 17MR (a.u.)2.0 ± 0.9
NT-proBNP (pg/mL)2879 ± 2841TAPSE (mm)18.9 ± 3.5
ACEi/ARBs, n (%)22 (49%)RVGLS (%)−15.5 ± 3.8
ARNI, n (%)12 (27%)RVfwLS−20.9 ± 5.2
Beta-blockers, n (%)42 (93%)CVP (mmHg)6.2 ± 3.2
MRA, n (%)22 (49%)PASP (mmHg)36 ± 13
Loop diuretics, n (%)32 (71%)TR (a.u.)1.8 ± 1.1
ACEi, inhibitors of angiotensinogen converting enzyme; ARB, angiotensin II receptor blockers; BMI, body mass index; CI, cardiac index; CO, cardiac output; CVP, central venous pressure; e’ s, early septal mitral diastolic velocity at tissue Doppler imaging; e’ l, early lateral mitral diastolic velocity at tissue Doppler imaging; E/e’, ratio between early pulsed Doppler diastolic mitral velocity and the mean value of e’s and e’ l; GFR-EPI, estimated glomerular filtration rate by EPI formula; LAVi, indexed left atrial volume; LVED, left ventricular end-diastolic volume; LVESV, left ventricular end-systolic volume; LVEF, left ventricular ejection fraction; LVGLS, left ventricular global longitudinal strain; LV Tei index, left ventricular Tei index; MR, mitral regurgitation; MRA, mineralcorticoid receptor antagonists; SV, stroke volume; LVMI, indexed left ventricular mass; PASP, peak pulmonary systolic pressure; RVfwLS, right ventricular free wall longitudinal strain; RVGLS, right ventricular global longitudinal strain; SAP: systolic arterial pressure; TAPSE, peak of systolic excursion of the tricuspid annulus; TR, tricuspid regurgitation.
Table 2. Comparison between patients with and without HR relate worsening of LVGLS.
Changes in LVGLS in Response to Increasing HR
Worsened
(n = 34)
Unchanged/Improved
(n = 11)
p
Age (years)67 ± 1465 ± 130.714
BMI (kg/m2)24 ± 525 ± 40.559
SAP (mm Hg)114 ± 21123 ± 220.212
NYHA2.4 ± 0.62.0 ± 0.80.141
Baseline HR (bpm)66 ± 768 ± 50.392
ICD/CRTD/PM (%)53/35/1227/45/430.261
LVEDV (mL)178 ± 83170 ± 1040.794
LVEF (%)33 ± 1144 ± 160.019
LVEF ≤ 40% (%)81190.237
LVGLS (%)−9.5 ± 3.4−12.0 ± 5.150.049
LV Tei index0.69 ± 0.210.47 ± 0.190.003
CI (L/min/m2)2.1 ± 0.52.5 ± 0.60.057
LVMI (g/m2)153 ± 39164 ± 440.457
LAVi (mL)40 ± 2038 ± 170.712
E/e’ ratio13.2 ± 6.112.9 ± 5.80.884
MR (a.u.)1.9 ± 0.92.2 ± 0.90.440
TAPSE (mm)18.6 ± 3.520.2 ± 3.40.189
PASP (mmHg)34 ± 1132 ± 100.680
TR (a.u.)1.7 ± 1.02.2 ± 1.70.193
RVGLS (%)−15.2 ± 3.9−16.4 ± 3.70.355
RVfwLS (%)−20.8 ± 5.2−21.3 ± 5.40.787
RVGLS/PASP−0.55 ± 0.19−0.50 ± 0.180.425
RVfwLS/PASP−0.68 ± 0.26−0.70 ± 0.260.868
CRTD: implanted cardioverter defibrillator with cardiac resynchronization therapy; ICD: implanted cardioverted defibrillator. For the other abbreviations see Table 1. The text shown in bold are findings with p-values < 0.05. p refers to ANOVA analysis for continuous variables and to Pearson Chi-square for categorical variables.
Table 3. HR-dependent changes in RVGLS.
HR RVGLS Changes
Worsened
(n = 8)
Unchanged
(n = 11)
Improved
(n = 26)
ANOVA
p
Age (years)64 ± 1463 ± 1367 ± 130.630
BMI (kg/m2)23 ± 325 ± 524 ± 50.518
SAP (mm Hg)111 ± 17115 ± 21119 ± 230.624
NYHA class2.4 ± 0.52.2 ± 0.82.3 ± 0.70.839
Baseline HR (bpm)66 ± 867 ± 766 ± 70.917
ICD/CRTD/PM (%)50/50/055/27/1842/38/190.657
LVEDV (mL)179 ± 69199 ± 113166 ± 800.586
LVEF (%)29 ± 937 ± 1438 ± 140.235
LVEF ≤ 40% (%)2326520.364
LVGLS (%)−7.6 ± 3.3−10.2 ± 4.0−10.9 ± 4.00.122
LV Tei index0.73 ± 0.600.60 ± 0.250.64 ± 0.230.551
CI (L/min/m2)2.3 ± 0.62.2 ± 0.62.1 ± 0.60.764
LVMI (g/m2)158 ± 31169 ± 43149 ± 420.367
LAVi (mL)47 ± 2541 ± 2337 ± 150.404
E/e’ ratio17.4 ± 6.313.2 ± 8.312.0 ± 4.30.136
MR (a.u.)1.9 ± 1.21.8 ± 0.82.1 ± 0.80.596
TAPSE (mm)15.3 ± 4.020.2 ± 3.1 *19.4 ± 2.9 *0.006
PASP (mmHg)42 ± 1431 ± 1132 ± 80.029
TR (a.u.)2.5 ± 1.12.0 ± 1.31.5 ± 0.90.057
RVGLS (%)−12.2 ± 1.1−16.6 ± 1.1 *−16.0 ± 3.2 *0.020
RVfwLS (%)−17.0 ± 6.7−21.5 ± 4.8−21.9 ± 4.40.058
RVGLS/PASP −0.35 ± 0.21−0.58 ± 0.17 *−0.54 ± 0.16 *0.013
RVfwLS/PASP−0.48 ± 0.28−0.73 ± 0.22 *−0.74 ± 0.23 *0.033
For abbreviations see Table 1 and Table 2. * post-hoc test < 0.05 vs. the group that exhibited worsening of RVGLS with increasing HR. p refers to ANOVA analysis for continuous variables and to Pearson Chi-square for categorical variables.
Table 4. HR-dependent changes in RVfwLS.
HR RVfwLS Changes
Worsened
(n = 7)
Unchanged
(n = 13)
Improved
(n = 25)
ANOVA
p
Age (years)61 ± 1366 ± 1366 ± 130.699
BMI (kg/m2)23 ± 326 ± 424 ± 50.192
SAP (mm Hg)105 ± 12119 ± 24118 ± 210.315
NYHA class2.4 ± 0.52.2 ± 0.82.2 ± 0.70.448
Baseline HR (bpm)66 ± 867 ± 766 ± 70.259
ICD/CRTD/PM (%)57/43/038/54/848/28/240.321
LVEDV (mL)219 ± 131181 ± 76161 ± 770.291
LVEF (%)27 ± 936 ± 1038 ± 150.116
LVEF ≤ 40% (%)1932480.326
LVGLS (%)−7.1 ± 3.5−9.9 ± 3.5−11.2 ± 4.0 *0.048
LV Tei index0.70 ± 0.210.59 ± 0.230.65 ± 0.230.603
CI (L/min/m2)2.5 ± 0.52.1 ± 0.52.5 ± 0.60.457
LVMI (g/m2)170 ± 49166 ± 39146 ± 370.191
LAVi (mL)56 ± 2639 ± 1736 ± 160.051
E/e’ ratio16.7 ± 7.013.1 ± 6.612.3 ± 5.30.395
MR (a.u.)2.0 ± 1.31.8 ± 0.92.1 ± 0.80.749
TAPSE (mm)16.8 ± 5.118.9 ± 3.519.5 ± 3.00.246
PASP (mmHg)49 ± 1330 ± 9 *31 ± 6 *<0.001
TR (a.u.)2.6 ± 1.11.8 ± 1.21.6 ± 0.90.841
RVGLS (%)−11.3 ± 5.1−16.0 ± 2.3 *−16.4 ± 3.3 *0.005
RVfwLS (%)−15.3 ± 6.4−22.7 ± 3.7 *−21.6 ± 4.6 *0.004
RVGLS/PASP −0.27 ± 0.19−0.57 ± 0.18 *−0.55 ± 0.13 *<0.001
RVfwLS/PASP−0.37 ± 0.24−0.81 ± 0.26 *−0.72 ± 0.17 *<0.001
For abbreviations see Table 1 and Table 2. * post-hoc test < 0.05 vs. the group that exhibited a worsening of RVfwLS with increasing HR. p refers to ANOVA analysis for continuous variables and to Pearson Chi-square for categorical variables.
Publisher’s Note: MDPI stays neutral with regard to jurisdictional claims in published maps and institutional affiliations.

