Article

Deep Learning Based Inversion of Locally Anisotropic Weld Properties from Ultrasonic Array Data

1
Department of Electronic and Electrical Engineering, University of Strathclyde, Glasgow G1 1XQ, UK
2
Department of Mathematics and Statistics, University of Strathclyde, Glasgow G1 1XQ, UK
3
Department of Engineering Mathematics, University of Bristol, Bristol BS8 1TH, UK
*
Author to whom correspondence should be addressed.
Appl. Sci. 2022, 12(2), 532; https://doi.org/10.3390/app12020532
Submission received: 19 November 2021 / Revised: 24 December 2021 / Accepted: 1 January 2022 / Published: 6 January 2022

Abstract

:
The ability to reliably detect and characterise defects embedded in austenitic steel welds depends on prior knowledge of microstructural descriptors, such as the orientations of the weld’s locally anisotropic grain structure. These orientations are usually unknown but it has been shown recently that they can be estimated from ultrasonic scattered wave data. However, conventional algorithms used for solving this inverse problem incur a significant computational cost. In this paper, we propose a framework which uses deep neural networks (DNNs) to reconstruct crystallographic orientations in a welded material from ultrasonic travel time data, in real-time. Acquiring the large amount of training data required for DNNs experimentally is practically infeasible for this problem, therefore a model based training approach is investigated instead, where a simple and efficient analytical method for modelling ultrasonic wave travel times through given weld geometries is implemented. The proposed method is validated by testing the trained networks on data arising from sophisticated finite element simulations of wave propagation through weld microstructures. The trained deep neural network predicts grain orientations to within 3° and in near real-time (0.04 s), presenting a significant step towards realising real-time, accurate characterisation of weld microstructures from ultrasonic non-destructive measurements. The subsequent improvement in defect imaging is then demonstrated via use of the DNN predicted crystallographic orientations to correct the delay laws on which the total focusing method imaging algorithm is based. An improvement of up to 5.3 dB in the signal-to-noise ratio is achieved.

1. Introduction

Ultrasound is a popular method for carrying out non-destructive evaluation (NDE) of safety critical infrastructure, and it is frequently utilised across a variety of industries, including aerospace, automotive and energy. It entails the use of ultrasonic transducers to generate, transmit, and receive high-frequency mechanical waves, which propagate throughout the component to be inspected. The resulting scattered wave fields can then be post-processed to create images of the component’s interior, highlighting the presence of any embedded defects [1]. In traditional ultrasonic NDE, it is common to assume that the object under inspection is constructed from isotropic and homogeneous materials. However, in many components of interest, this is not the case and the presence of heterogeneous and locally anisotropic microstructures can distort the transmitted ultrasonic signals. This can cause a significant degree of uncertainty when it comes to detecting and characterising flaws within the structure [2,3,4,5].
Reliably imaging defects embedded in austenitic steel welds using ultrasound is an outstanding industrial challenge [6,7,8]. These welds are commonly found in heavy industry because of their strength and resistance to corrosion. However, due to repeated thermal cycling throughout their build process, the polycrystalline structures of the welds undergo epitaxial growth, where their major crystal axes align with the direction of heat flow. This results in the creation of a locally anisotropic microstructure consisting of large grains which exhibit length scales commensurate with that of the ultrasonic wave. The coupling of these length scales results in significant scattering and refraction of the ultrasonic wave by the weld microstructure, and so when traditional NDE imaging techniques (which typically assume a constant, isotropic velocity across the medium) are applied, the resulting images suffer from significant defocusing and can fail to reliably highlight any embedded defects.
However, in the case that a priori knowledge of a weld’s spatially varying microstructural descriptors is available, it has been shown that the distortion of the wave paths can be compensated for to create more accurate and reliable defect reconstructions [2,3,4]. Although the microstructural maps required for this correction can be acquired experimentally, such procedures for characterising in the bulk are not strictly non-destructive and hence cannot be used in situ [6,9]. However, these approaches, coupled with models of the welding process and subsequent wave propagation problems [10,11,12,13,14] provide essential insight into the structure and crystallography of these materials and their effects on the probing waves.
An alternative approach to characterising a weld’s microstructure is to pose the question as an inverse problem; given the scattered ultrasonic wave data, can we exploit tomographic methods to map the spatially varying material properties of the component? There already exists a rich literature on this type of tomographic inverse problem within the seismology and medical imaging fields [15,16,17,18,19,20,21,22], and more recently it has come to the forefront of ultrasonic NDE research [3,4]. However, due to the high dimensional, non-linear nature of the problem, many of these approaches incur significant computational expense and are not suitable for real-time implementation. This is problematic not only for inspection in the field, where online computing resources may be scarce, but also for the increasingly common requirement for in-process inspection, which is particularly important for dynamic monitoring of modern, additive manufacturing processes.
One solution to the real-time tomography problem is to examine the potential of deep neural networks (DNNs). Given a sufficiently large training set consisting of pairs of independent and dependent data (in our case that would be the microstructural maps and their corresponding ultrasonic travel time data), DNNs can approximate the non-linear relationship between the two parameter spaces [23]. Although this training process can be computationally expensive and time consuming, once the network has been satisfactorily trained, inversions of unseen data can be conducted in real-time. Unfortunately, the uptake of these methods has been limited to date due to the scarcity of experimental data where the ground truth is known. However, more recently, the use of physics based models to generate training data pairs has become more prevalent in the machine learning literature and offers a convenient way to bypass the extensive data requirements for these methods. This approach has already been used to solve travel time tomography problems in heterogeneous and locally isotropic media with applications in the seismology and medical imaging communities [24,25,26,27,28]. These methods have exhibited reconstruction accuracy comparable to that achieved using the much more expensive iterative and stochastic sampling methods.
In this paper, we present the first ever DNN framework for fast, non linear travel-time tomography of two dimensional, locally anisotropic weld structures. Due to the lack of experimental ultrasonic travel time data arising from scenarios where the weld structure is well characterised, a model based approach to training the network is taken, where the Anisotropic multi-stencils fast marching method (AMSFMM) [4] is used to approximate wave travel times between pairs of ultrasonic transducers (arranged in linear array configurations) through synthetic weld geometries constructed using perturbations of the Ogilvy weld model [29]. The AMSFMM is a simplified physical model of wave propagation, in which only travel times are calculated, and it therefore does not include the underlying physics of multiple scattering, reflection or attenuation. We demonstrate accurate (within 3°) and rapid inversion (0.04 s) of grain orientations within welds using the DNN framework, even in the case where the modelling approach used to generate the test data is different to that which is used to generate training data; an important proof of concept for model based training of DNNs and a step towards future transition to testing on experimentally obtained data. Three different data acquisition geometries are explored and in the final pulse-echo case, we show how predicted grain orientations can improve the ability to detect and characterise defects using an extension to the total focusing method [30], improving the signal to noise ratio by up to 5.3 dB.

2. Methods

2.1. Weld Models

In this paper, a 90° V-groove austenitic stainless steel weld constructed from 21 weld passes and joining two 15 mm thick steel plates, is considered (see Figure 1a). The parent steel plates are taken to be isotropic with longitudinal wave velocity V L = 5790 m/s. Since austenitic stainless steel is anisotropic (that is the wave speed of probing ultrasonic waves is dependent on the incident wave direction), reconstruction of velocity fields through the structure (as is commonly the objective in seismic tomography [15,16]) does not sufficiently capture the complexity of the underlying weld microstructure. Instead, a map of the orientations of the large grains which form during the welding process is required. To this end, knowledge of the longitudinal group velocity curve of the medium is required (note we are examining travel-time tomography and so consider only the longitudinal (fastest) wave modes). The group velocity curves for a transversely isotropic, cubic, austenitic weld are obtained by solving the Christoffel Equation [31] using a cubic stiffness tensor where c 11 = 203.6 GPa, c 12 = 133.5 GPa and c 44 = 129.8 GPa, and the density is ρ = 7874 kg/m 3 (these values are taken from the weld properties used in [12,32]). The resulting relationship between the incident wave direction and longitudinal group velocity is plotted in Figure 1b. Note that in this paper we assume a priori knowledge of the elastic stiffness constants, however in practice these would need to be approximated experimentally and the uncertainty associated with these approximations considered [33,34].
There are several models that describe how microstructural properties vary throughout a weld depending on various welding parameters [13,29,33,35]. When estimating the spatially varying microstructural descriptors such as grain orientation using ultrasound data, such models can be used to constrain the inverse problem. Here the Ogilvy model [29] for a V-shaped weld is employed. With this approach, the anisotropic grain orientations θ ( x , y ) at each point ( x , y ) in the domain are calculated by:
θ ( x , y ) = tan 1 W 1 / 2 + ( y Z ) tan α x + 90 ° ,
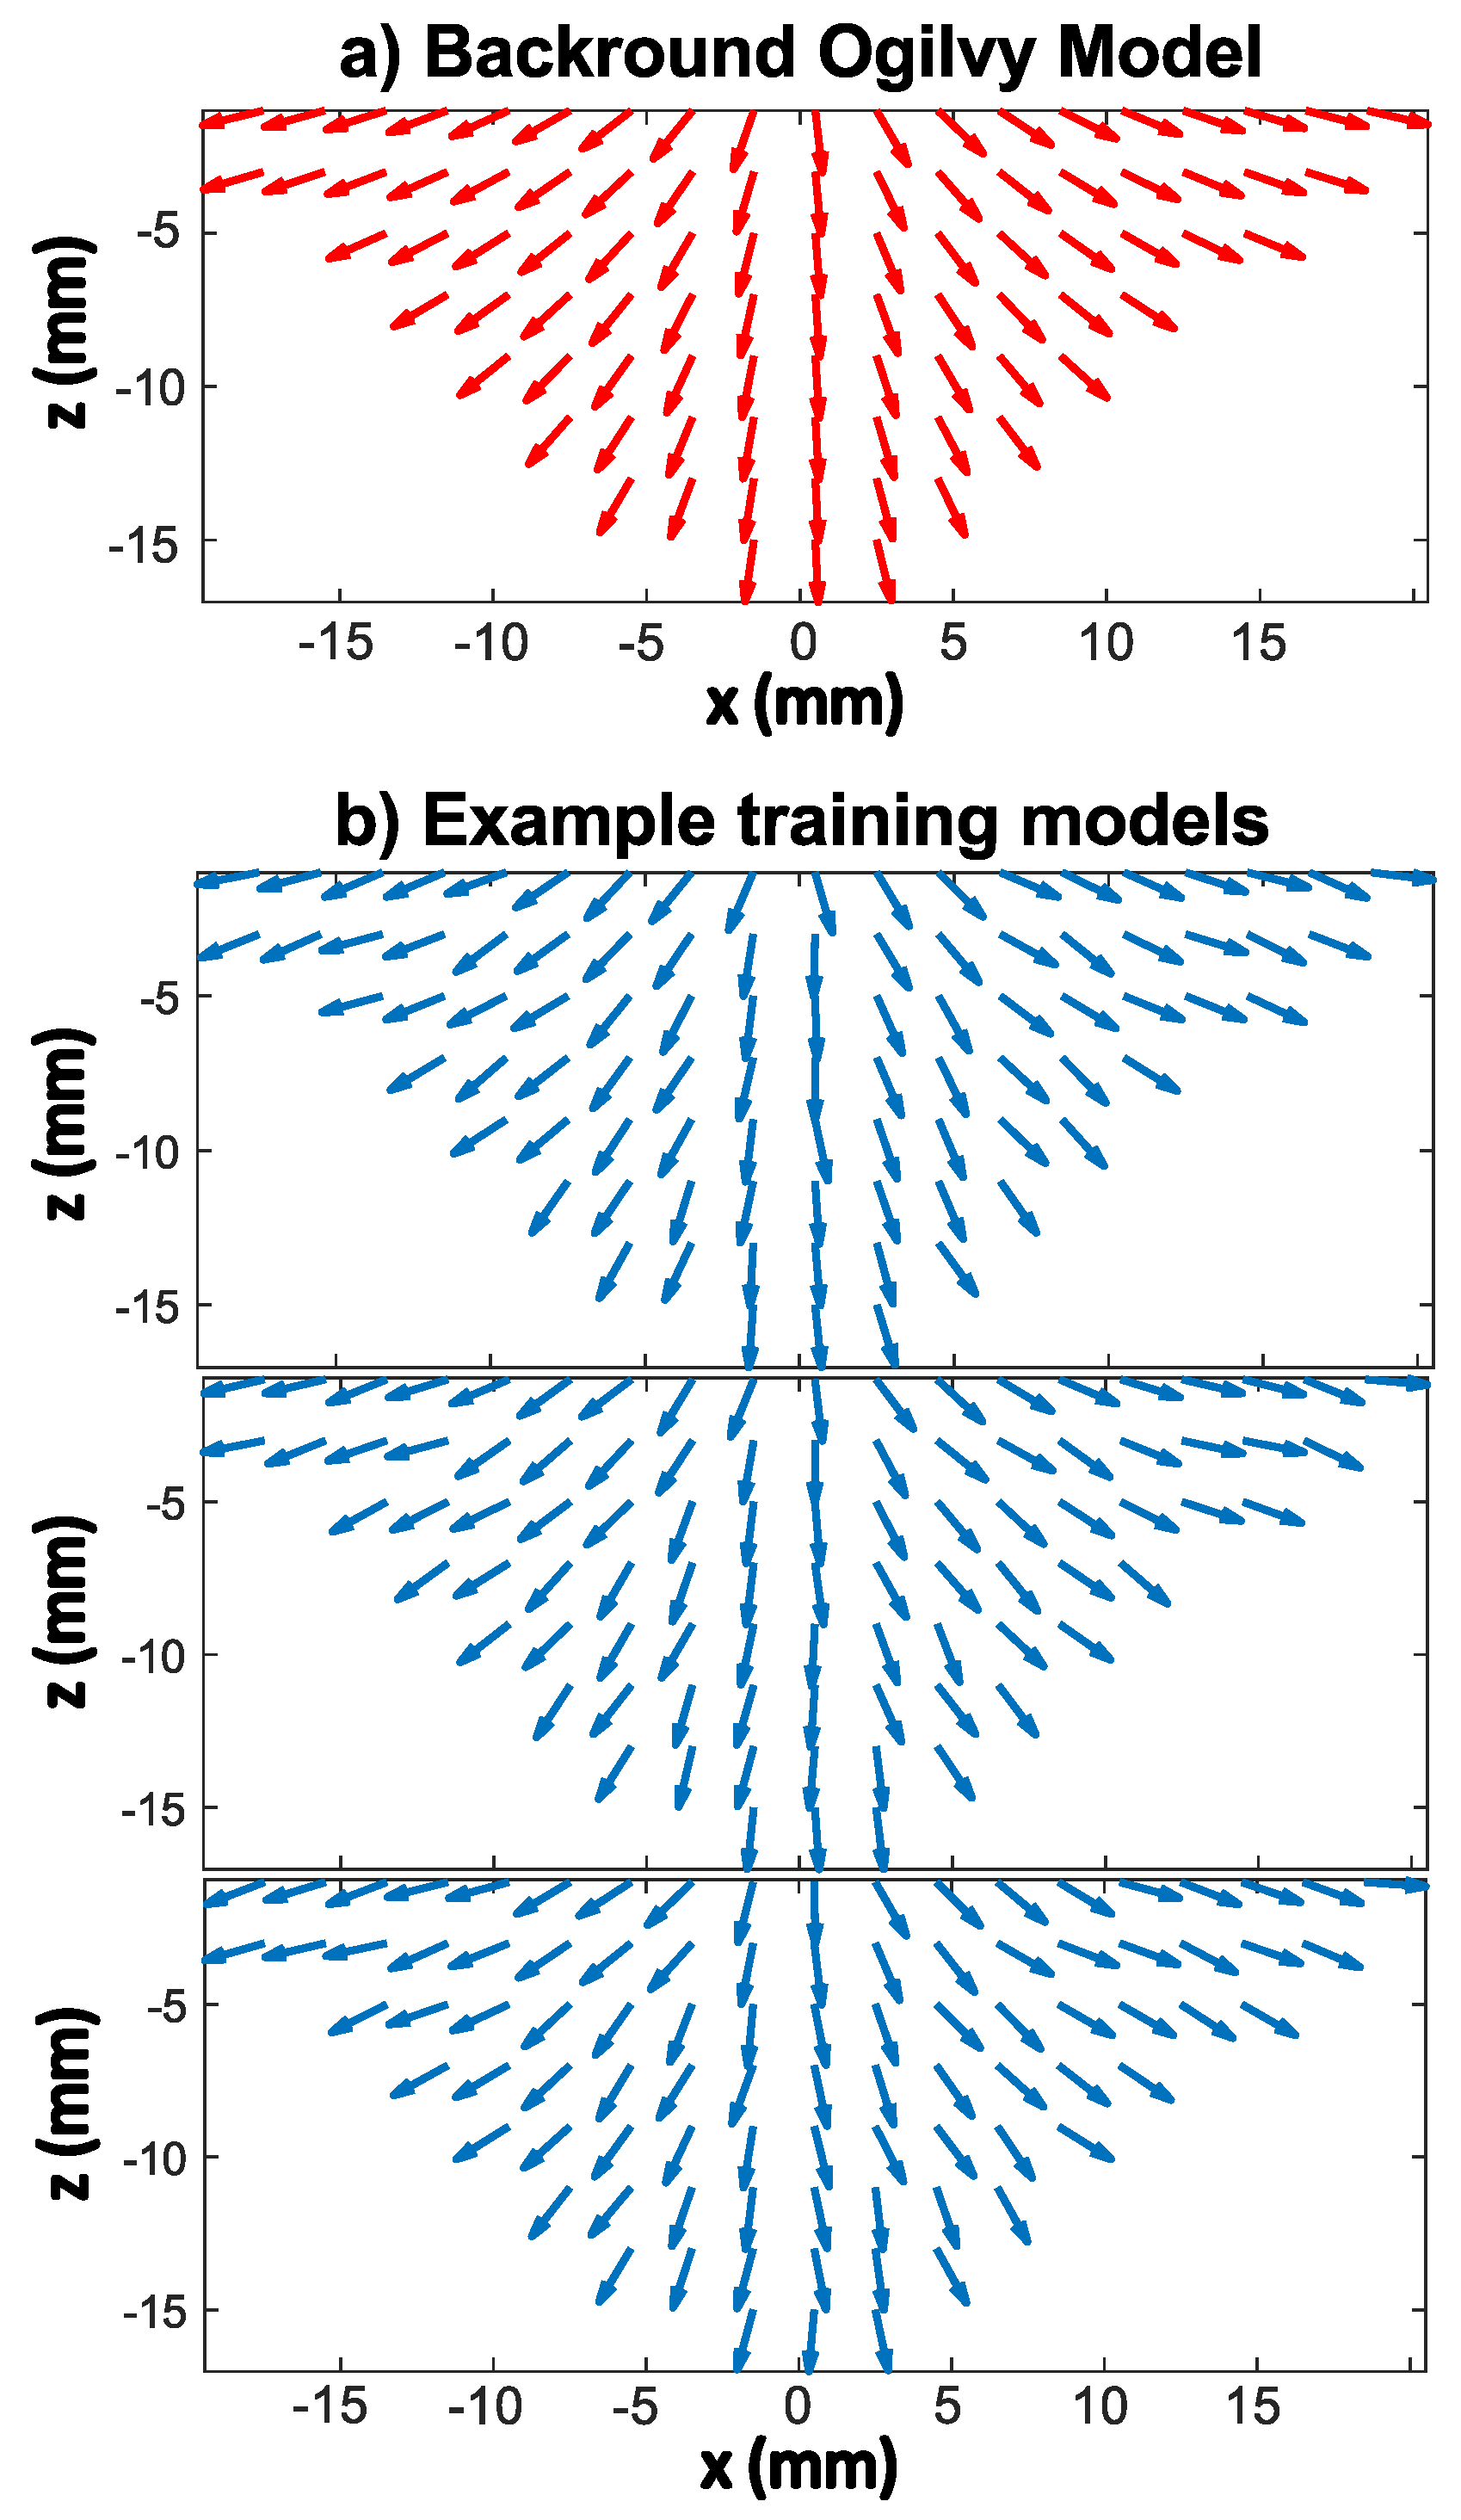
where Z is the weld depth, W 1 is the width of the weld root and α is the grain orientation at the fusion face. Grain orientations θ for the weld geometry shown in Figure 1a, further discretised into 91 sub-regions of size 2 mm2, where Z = 15 mm, W 1 = 1 mm and α = 23°, are shown in Figure 2a. In this work, this model will be used as a background reference model for creating the suite of models generated for the training of the DNN. Ten thousand training models are generated, each consisting of random perturbations of up to ±10° of each grain orientation in this background model. Some examples of these randomly perturbed weld maps are shown in Figure 2b. Of the full set of models, 8000 models are used for model training and 2000 models are used for validation purposes.

2.2. Data Acquisition Geometry

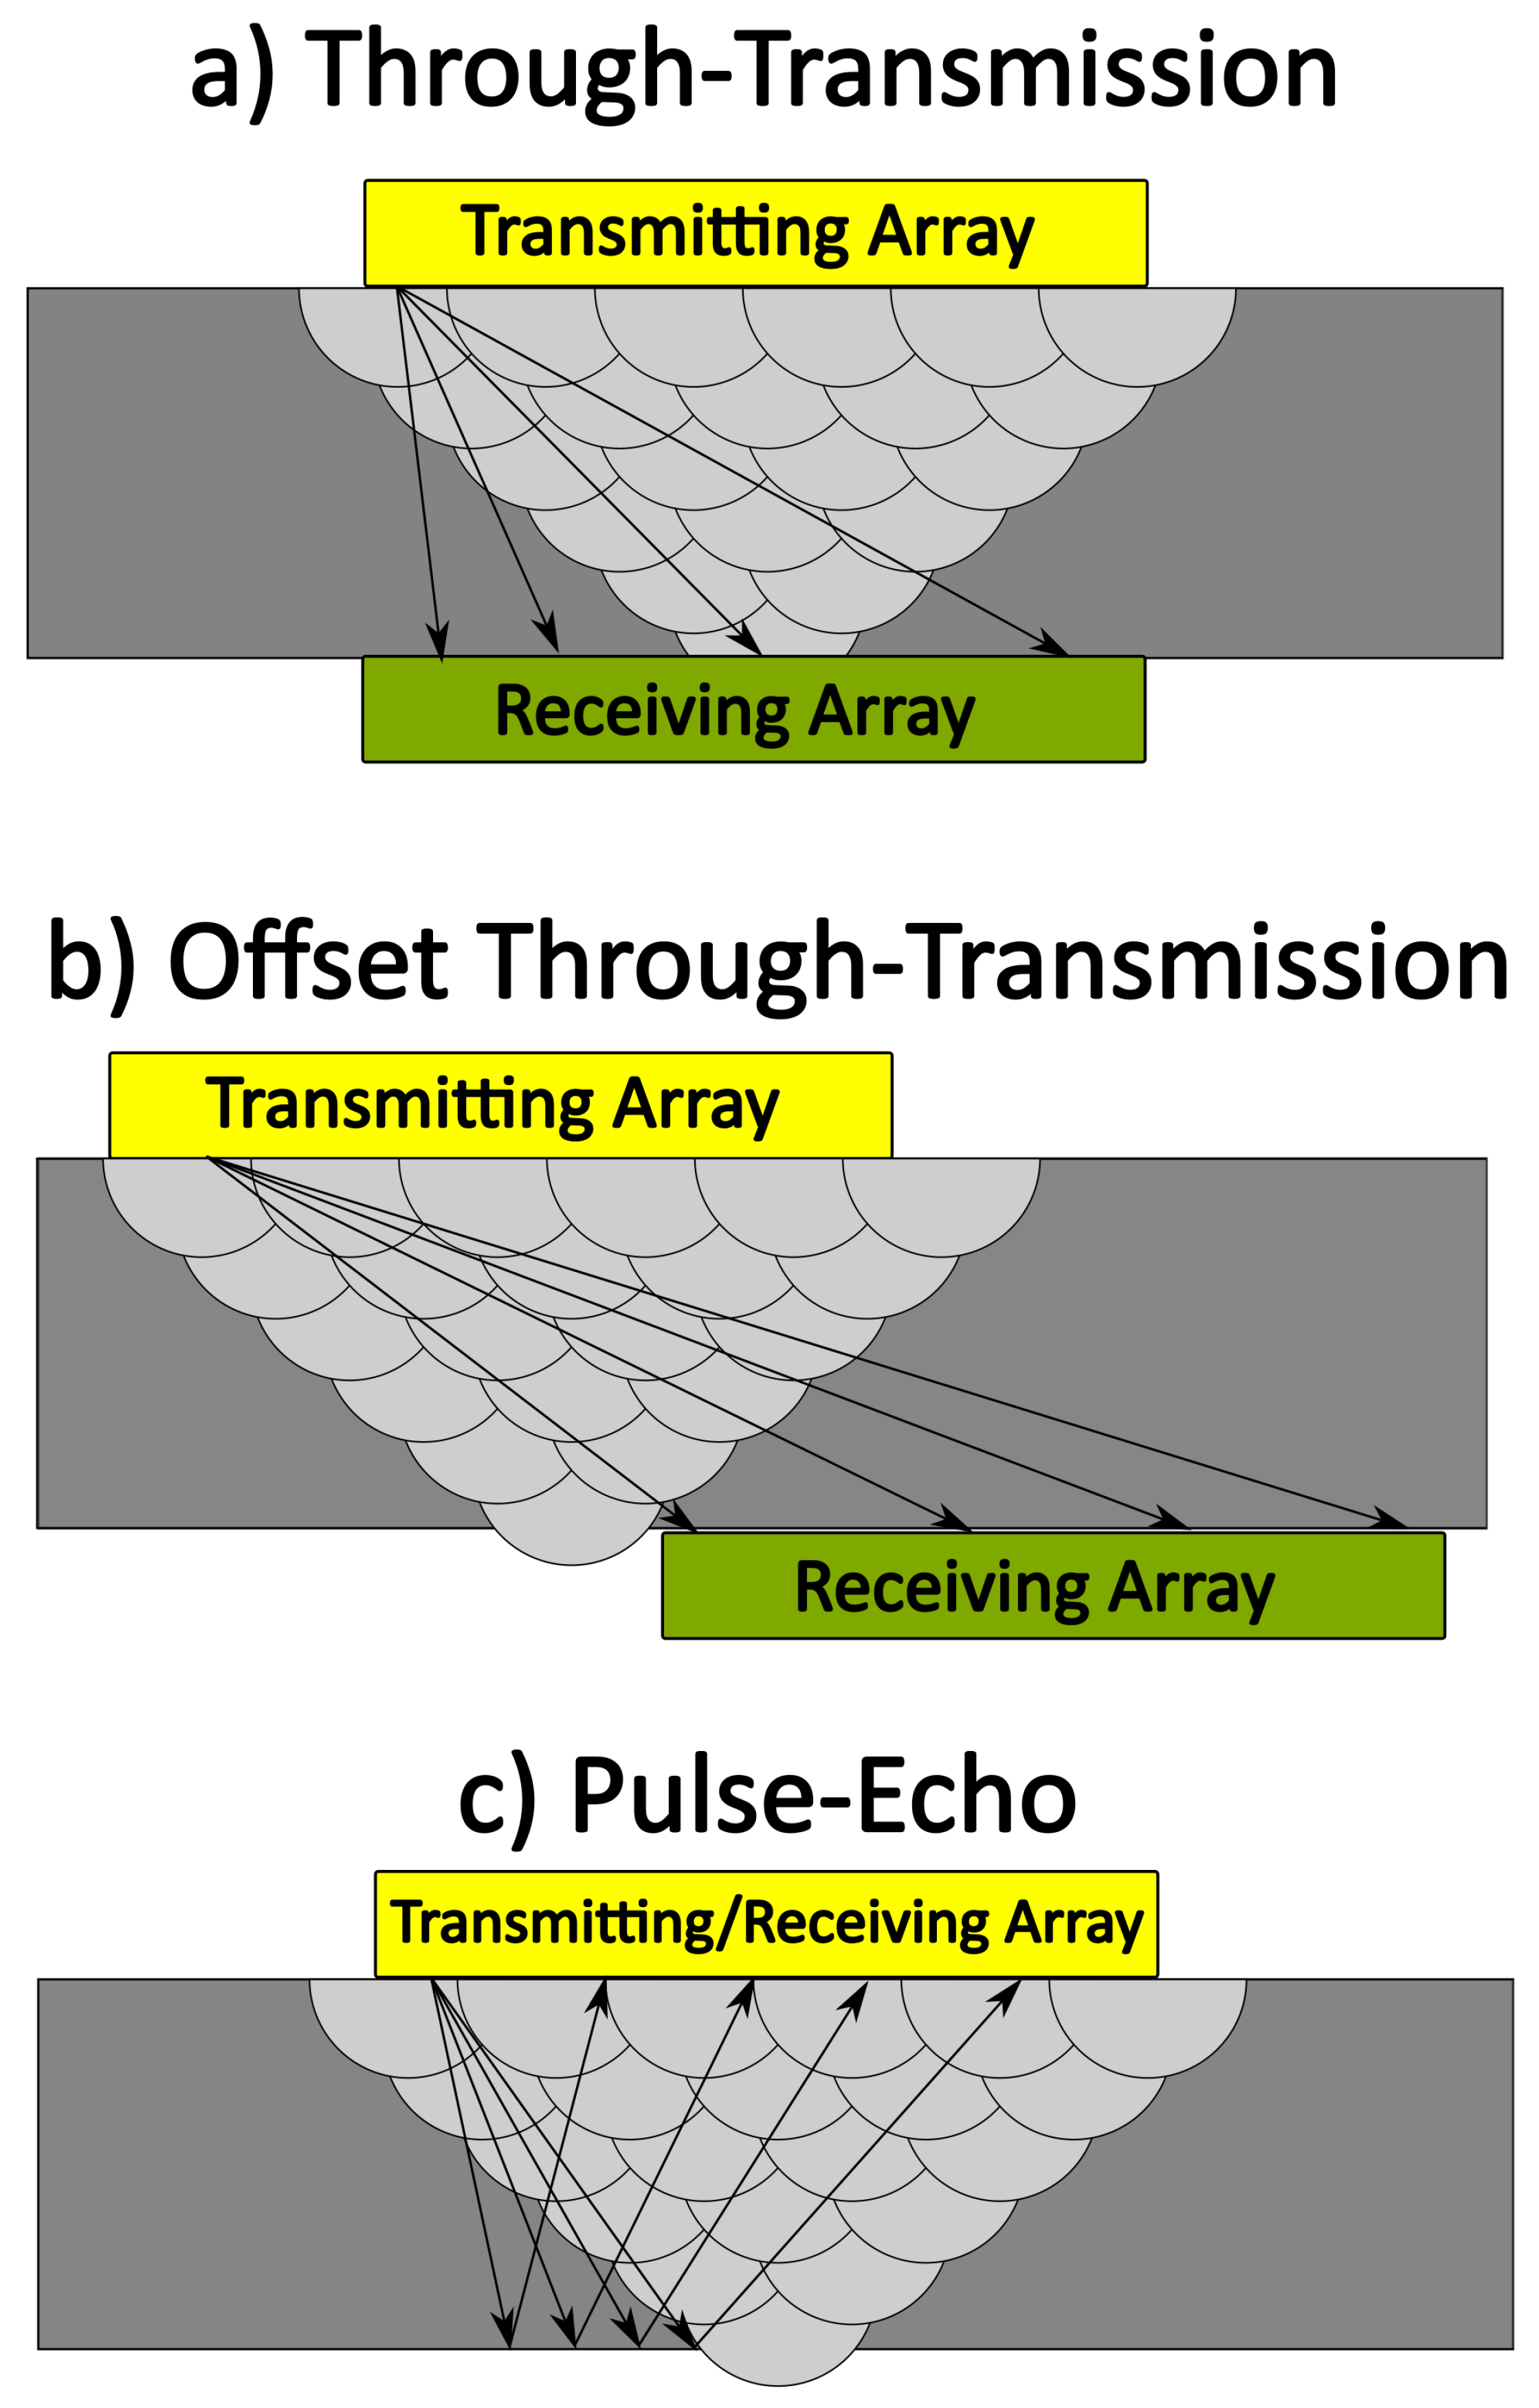
The training data pairs required for the DNN approach taken in this paper consist of weld models generated by Equation (1) and the associated travel-time data arising from their modelled linear phased array inspection (see Section 2.3). Three separate ultrasonic transducer array configurations are considered: a through-transmission configuration (Figure 3a), where an array of 32 transmitting elements with 1 mm pitch is placed on the top of the weld, and an array of 32 receiving elements with 1 mm pitch is placed directly opposite on the bottom of the weld; an offset through-transmission configuration (Figure 3b), where the 32 transmitting elements are placed at the top of the weld and the 32 receiving elements are placed at the bottom, offset to the right by 20 mm; and a pulse-echo configuration (Figure 3c), where a single transducer array of 32 elements (with 1mm pitch) is placed on top of the weld, and each transducer element acts both as a transmitter and a receiver. For each of these configurations (defined by c , a matrix containing the transmitter and receiver co-ordinates), the time of flight (ToF) matrix T m is constructed from 32 × 32 = 1024 travel times, representing the time of flights between every transmit-receive pair of elements. Note, that in the pulse-echo configuration, this time of flight does not represent the direct path between two elements (the surface wave), but instead the time taken for the transmitted wave to reflect from the back wall and return to the receiving element.

2.3. Forward Models

To efficiently model waves propagating through the weld geometry, the weld region shown in Figure 1a is discretised over a regularly spaced 2 × 2 mm grid, and so there exists a total of 91 grid points within the weld, each of which is assigned a distinct grain orientation θ ( x , y ) . To estimate these grain orientations from ultrasonic time of flight (ToF) data, a model-driven deep learning approach is taken, where a large set of weld models m θ and their corresponding ToF matrices T m are used to train a deep neural network. The forward problem of interest can be described as:
f ( m θ , c ) = T m ,
where f is a mechanical wave modelling operator and c describes the transducer array configuration. Note that later in this work, different wave modelling operators are used to generate the target travel time data (the DNN test data) and the training data so as to avoid the inverse crime [36].
To train the model based DNN to predict the weld structure from ultrasonic travel time data, an appropriate forward model is required to compute the ToF matrices T m arising from a given weld model m θ (these form the training data pairs). As a large number of models is required, a fast and efficient model is desirable. The anisotropic multi-stencils fast marching Method (AMSFMM) [4] suits these requirements. The AMSFMM (denoted f FMM ) is a semi-analytical model of wave front propagation based on solving the Eikonal equation using an upwind finite difference scheme [37]. In this work, the locally anisotropic weld geometry is parametrised using 91 sub-regions, each of which is assigned a dominant crystal orientation (see Figure 2) which dictates the rotation of the associated velocity curve at that point in the domain. For the finite difference calculations of the AMSFMM, this geometry is further discretised over a regular square grid with 0.01 mm grid spacing. By introducing additional stencils along which finite difference calculations can be made, the wave can propagate in an increased range of directions and can thus account for variation in velocity given the incident wave angle (approximated by the angle of the finite difference stencil) and the underlying crystal orientation at any point in the domain [4]. The result is that the shortest travel time τ ( x , y ; s i ) to any given point in the domain ( x , y ) from a known transmitter location s i can be calculated, and in the case where we are examining a through-transmission data acquisition geometry (see Figure 3a,b, a time of flight matrix T m FMM can be constructed by interpolating at the known receiver locations. An example travel time field τ arising from the Ogilvy model shown in Figure 2a is shown in Figure 4. It must be noted that as the AMSFMM does not incorporate any reflections, an alternative approach is required to construct T m for the pulse-echo transducer array configuration. In this case, the ToF data between transmitting and receiving elements are calculated by the summation of the ToF estimations between the transmitter element to all points along the lower plate boundary (backwall) and those between the receiving element and all points along the lower plate boundary. The output of this summation is an array of travel times corresponding to all the reflection points along the lower plate boundary, and the minimum value is taken to be the ToF for any pair of transmit-receive elements in the pulse-echo transducer array configuration.
The AMSFMM method is very fast and presents an efficient approach to modelling the thousands of data pairs required to train the neural network (the time to compute a single travel time field in Matlab on a standard desktop computer is 2.18 s, therefore to compute the 32 travel time fields required to construct the ToF matrix requires approximately 70 s per model—and this could be significantly sped up using a compiled language). To avoid the inverse crime and test the limitations of the model based training approach, an alternative forward modelling approach is implemented to generate the test data with which we can assess the trained DNN’s performance. For this Onscale, a commercial finite element (FE) package [38], is used to model the ultrasonic wave propagation through a given weld geometry (with dimensions and material properties as defined in Section 2.1). This FE model incorporates more of the physics that describes the wave propagation, such as reflections, scattering and frequency dependence, and so better represents the data we would expect to observe experimentally. However this model incurs significant computational expense which is why its use is restricted to generating test data only. The FE method takes approximately 3 min to simulate wave propagation for a single element (96 min for 32 elements). The FE test data used in this paper is modelled in Onscale using a Ricker wavelet with a central frequency of 2 MHz as the source-time function. Pressure loads are applied at the top of the model (simulating the transmitters) and the displacement is recorded at points determined by the receiving array configurations shown in Figure 3. Free boundary conditions are applied on all sides of the domain to model the finite extent of the steel plates. Note however, that any reflections from the vertical boundaries occur at a time much later than the first time of arrival and so do not interfere with the construction of the ToF matrices. The values for the finite element node spacing ( Δ x , Δ y ) are selected to ensure spatial stability conditions ( Δ x , Δ y = λ / 15 , where λ = 2.54 mm is the shortest wavelength present in the problem). Following the simulation for each transmitting array element, the ToF to each receiving transducer is automatically picked by selecting the time for the arriving energy to meet some threshold. In this work, the threshold is taken to be 1% of the peak displacement in the recorded signal.

2.4. Data Calibration

As there is an offset in arrival times associated with picking the first arriving energy in the recorded A-scans for the FEA approach, some calibration between the different modelling approaches is required. There are also some numerical errors associated with the AMSFMM approach due to the limited stencil directions that waves can propagate along. To calibrate the FEA data so that it can be used as input to a DNN trained on AMSFMM generated data, we assume the travel time data generated from the FEA and AMSFMM approaches are approximately related by some cubic function G ( t ( s i ) ) , where t is the measured travel times at all receiving elements using FEA approach for a given transmitting transducer element s i . The function G is a third degree polynomial, therefore contains four coefficients that are estimated for each transmitting element by fitting the function to the AMSFMM and FEA generated data (shown for three transmitting elements in Figure 5). The calibrated FEA data t is equal to the output of the function G ( t ( s i ) ) .

2.5. Deep Neural Networks

Neural networks are mathematical mappings that emulate the relationship between two parameter spaces, which learn (or are trained) by processing examples of input-output data pairs. Here, we train a DNN to approximate the inverse of f in Equation (2), mapping the weld grain orientation models m θ from their corresponding time of flight data T m . This can be written
DNN ( T m ) = m θ pred ,
where the superscript ‘pred’ denotes a predicted set of grain orientations.
DNNs are formed by a series of hidden layers, with each layer containing a set of nodes. The network consists of connections that connect the output of a node in one layer to the input of a node in the following layer. In this work we use a fully connected DNN, where all nodes in a given layer are connected to all nodes in the following layer. The output of a node is the weighted sum from the previous layer connections, with an additional bias term, passed through a non-linear activation function (see Table 1 for details). The weights and biases are adjusted during the training process to map between the input and output parameter spaces. Here, the Adam optimisation algorithm [39] is used to update these weights and biases, and was chosen as as it provides fast convergence and simple implementation. The algorithm adjusts weights and biases to minimise a loss function, which we define as the mean absolute error (MAE), given by:
MAE = i = 1 N | m θ true ( i ) m θ pred ( i ) | N ,
where i denotes the model index within the training data set, N is the number of models (so N = 8000 for model training and N = 100 for testing the trained network), the superscript ‘true’ denotes the known set of grain orientations that are used to generate the input ToF data. For each of the transducer array configurations shown in Figure 3, there are 32 transmitting elements and 32 receiving elements, therefore there are 32 × 32 = 1024 ToF measurements and 1024 nodes in the input layer of the DNN. We follow the approach of [25,40], where a separate network is trained for each output model sub-region, and so a total of 91 networks are trained to predict the grain orientations of the sub-regions within the weld.
An additional set of constant hyperparameters need to be assigned before the learning process can begin: such as the learning rate and decay rate used for the Adam optimisation, the number of hidden layers, the number of nodes in each layer and the non-linear activation function. To select the hyperparamters we use hyperopt, a stochastic optimisation library [41], which samples many different network hyperparameters to find the best performing network architecture, using a separate network architecture for each of the transducer array configurations. The outputs of these hyperparameter optimisations are shown in Table 1.
For network training, both the input travel times and the output orientations are scaled to have zero mean and unit variance. Of the 10,000 models in the full training data set, a validation data set is taken using 2000 models. To avoid over-fitting the network to the training data, the loss function in Equation (4) is evaluated over the validation data set at each iteration, and an early stopping criterion is implemented so that the training process stops once the loss function stops decreasing (with a patience of 20 iterations). The time to train 91 separate networks sequentially on a standard desktop computer is approximately 35 min, and once the network is trained, the time to evaluate the network to predict the set of 91 grain orientations m θ pred from some unseen ToF matrix T m is approximately 0.04 s.

3. Results

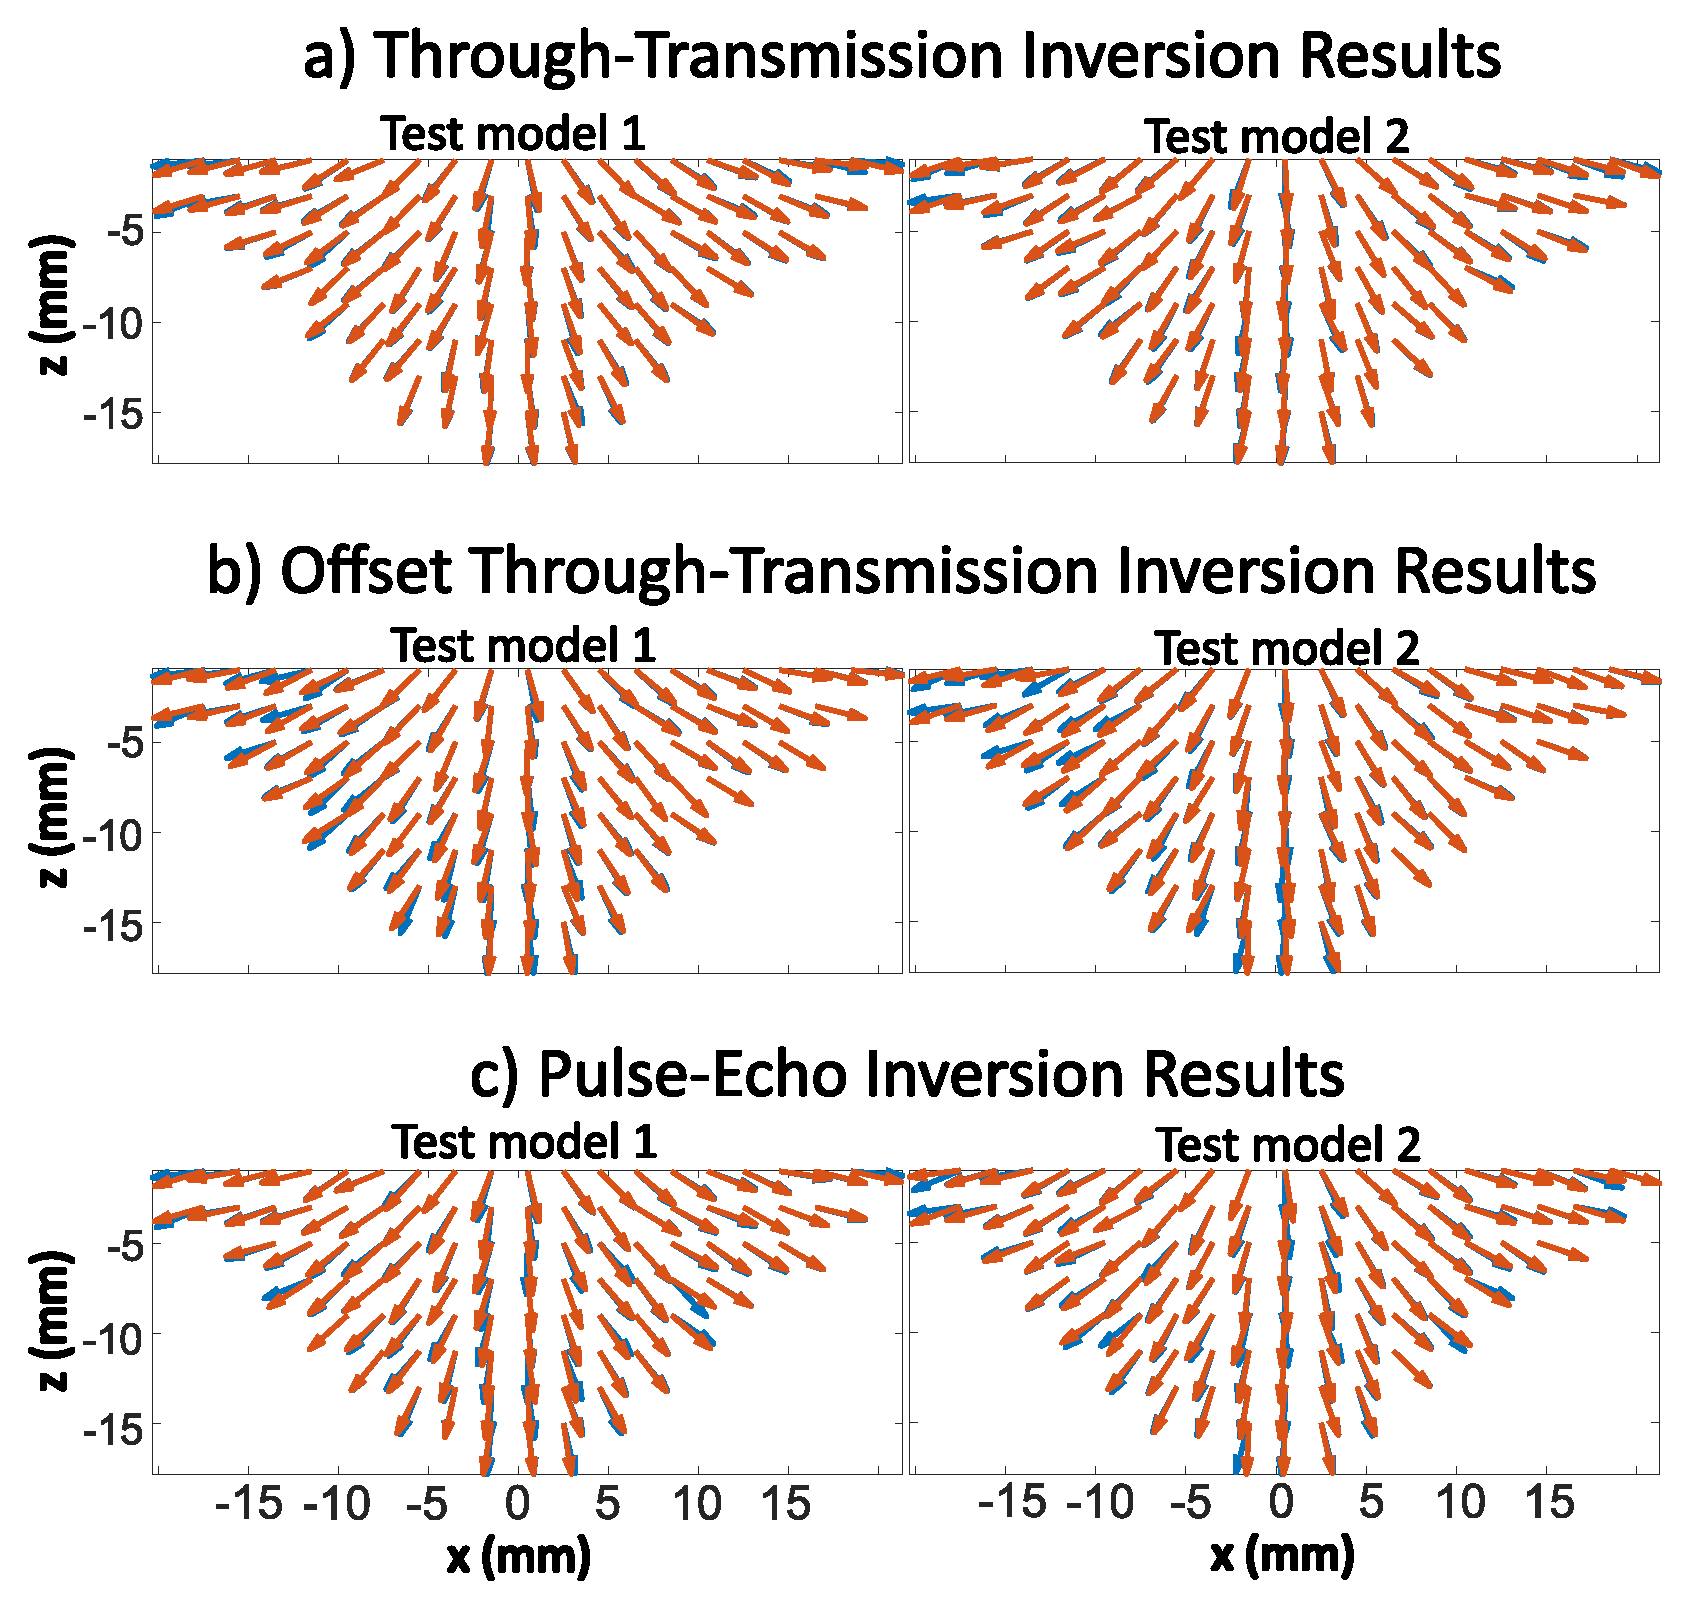
To initially test the performance of the trained DNNs, an additional set of 100 randomly generated weld models (not used in network training) are used as input to the AMSFMM forward model. The resulting ToF data was then used as input to the DNN to obtain predictions of the grain orientations (this is the inverse crime case where the model used to generate the training data and the test data is the same). Two examples of the predictions for grain orientation maps of the test models are compared against the true grain orientation maps in Figure 6, for each of the three transducer array configurations. For all cases, the predicted grain orientations (depicted by red arrows) closely resemble the true orientations (blue arrows), and in fact often lie on top of each other and are virtually indistinguishable.
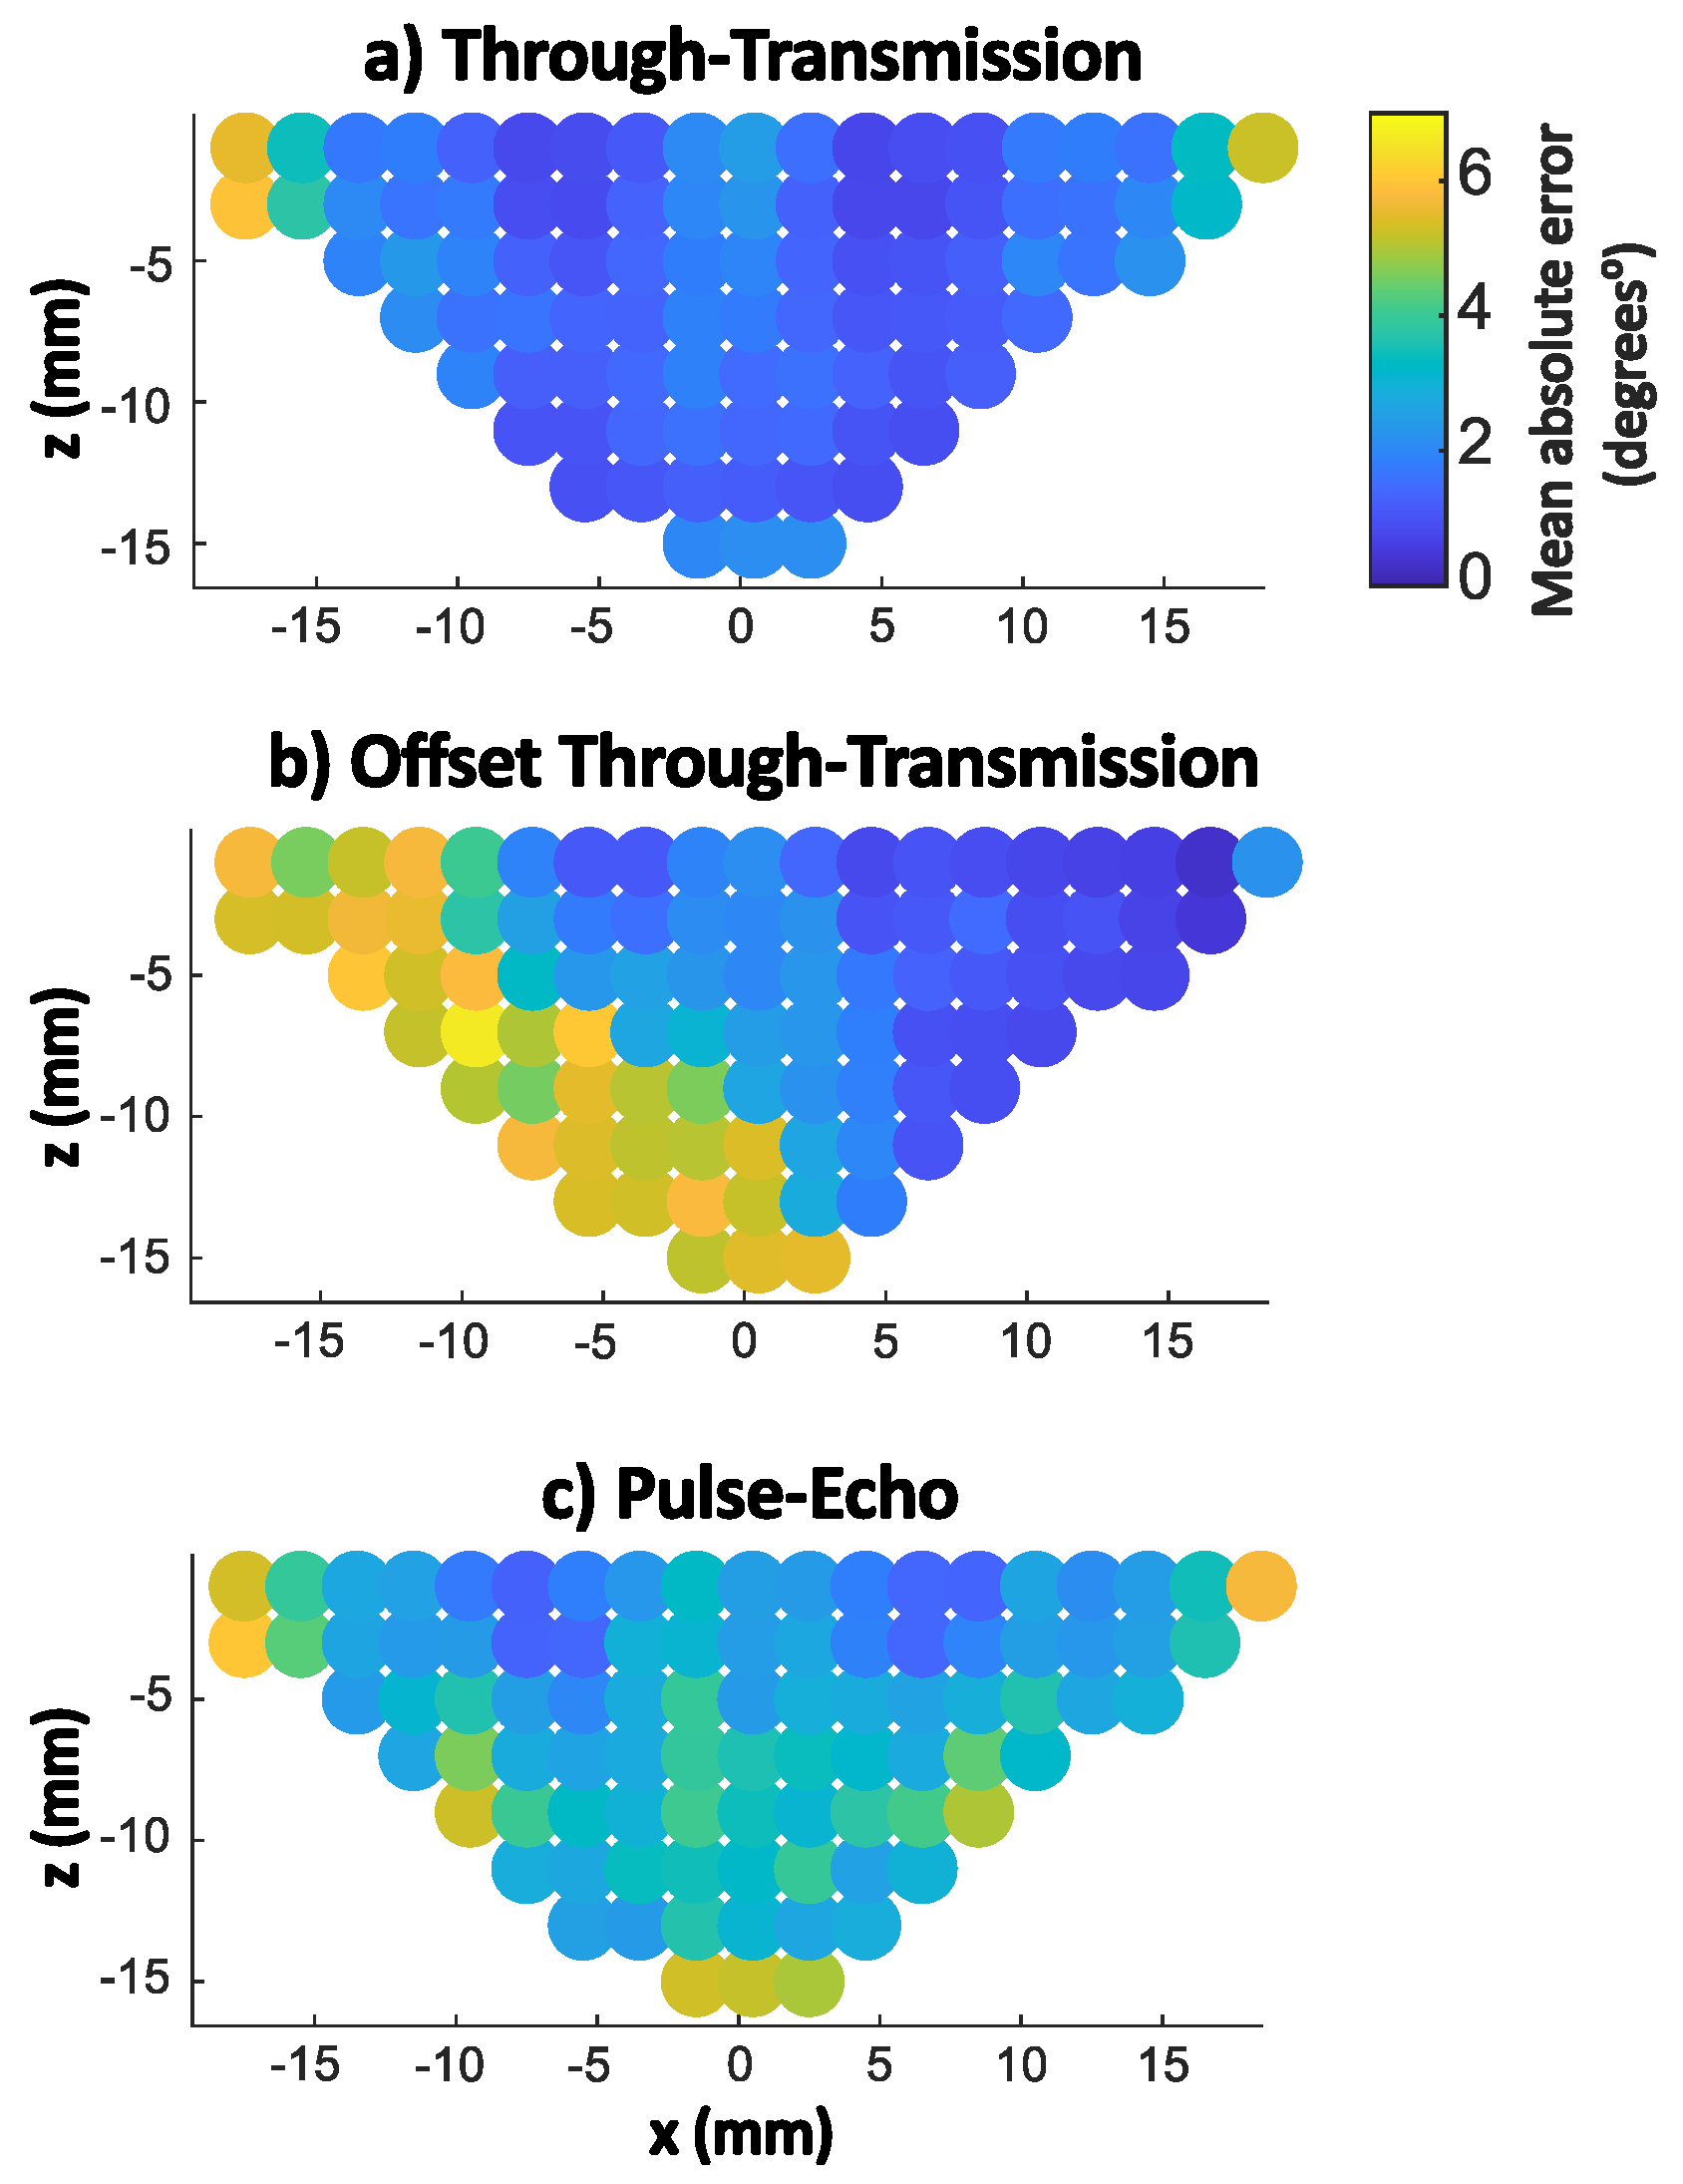
To examine these results further, the mean absolute error averaged across the 100 test models for each of the 91 sub-regions within the weld is shown in Figure 7 for each of the transducer array configurations. The DNN predictions in the through-transmission transducer array configuration case (Figure 6a and Figure 7a) perform the best, with low MAE values generally less than 2°, with particularly high accuracy in the centre of the weld where there the ultrasonic coverage is highest. The higher errors observed at the upper, outer edges of the weld can be attributed to the fact that few ray paths pass through these areas and so they are less well constrained by the ToF data. The offset through-transmission transducer array configuration (Figure 6b and Figure 7b) also exhibits a strong correlation between prediction accuracy with ultrasonic coverage. The receiving elements in this configuration are offset to the right hand side of the weld root, therefore along the left boundary of the weld there is poor coverage by the ultrasonic waves, so the accuracy is lower in these sub-regions ( MAE > 4 ° ). Where coverage is good, to the right of the weld region, the prediction accuracy is high ( MAE < 2 ° ). Finally the grain orientation predictions for the pulse-echo transducer array configuration exhibits poorer accuracy (MAE values are approximately between 2 and 4°). In the pulse-echo configuration, waves travel longer along more complex paths and so the inverse problem becomes more challenging.
For the tests described above, the same mathematical model (AMSFMM) has been used for both the training data and the test data (a so called inverse crime [36]), and this is not a sufficient challenge of the methodology [42], particularly as we are using model-driven techniques to describe real-world phenomena. So, to further test the performance of this model trained DNN framework, we now consider more realistic ToF data T m generated using the FE model described in Section 2.3 for the set of grain orientations shown in Test Model 1 (plotted in Figure 6). We use only the pulse-echo transducer array configuration, as this single-sided inspection is closer to what may be achieved in practice (although for in situ application, we would need to consider the topography of the weld cap-see discussion in Section 4). Note that there already exist validation studies which compare ultrasonic inspection data of austenitic welds modelled by Onscale with experimentally obtained data [32] and so application of the trained DNN to this FE data is an important step towards experimental implementation. The absolute error between the predicted m θ pred and true m θ true grain orientations for each of the weld sub-regions in Test Model 1 is shown in Figure 8 for both AMSFMM and FEA generated data. For the pulse-echo transducer array configuration, the grain orientation predictions made in the case where the test data arose from the FE modelled data are less accurate than the predictions obtained using test data generated by the AMSFMM, where the model reconstruction error averaged across each weld sub-region is equal to 2.61° for AMSFMM generated data and 3.04° for FE generated data. This is to be expected as we move away from the inverse crime, as noise and uncertainty is introduced to the system via both (i) differences in the modelling approaches and (ii) the picking of the arrival times from the full waveform data generated by the FE model (although some of this offset by the calibration step discussed in Section 2.4). However, the difference in the predicted orientations is relatively small, with the majority of weld sub-region error values around 3°, and only a small number of sub-regions exhibiting higher error values.

TFM Reconstruction Results

As shown in [3,4], estimations of the grain maps can be used to improve the ability to detect, locate and characterise any defects embedded in the weld. The total focusing method (TFM) is a reference imaging algorithm for detecting and characterising defects in the NDE community [1]. It exploits the full matrix capture (FMC) dataset, which is the set of all signals (or A-scans) generated by transmitting on each ultrasonic transmitting transducer element s i in turn, where i = 1 , . . , L and L is the number of transmitters, and recording at each receiving transducer element r j simultaneously, where j = 1 , . . . , M and M is the number of receivers (note M = L in this work), over time t. The amplitude of a recorded A-scan at time t is therefore denoted as A i , j ( t ) . In the TFM algorithm, the A-scans are summed in order to synthesise a focus at every point ( x , y ) in the imaging domain [1,30]. The travel times from each transmitting element s i and each receiving element r j , to every imaging point ( x , y ) are estimated, representing the wave’s journey between s i and r j via a point scatterer at ( x , y ) . The time this journey takes can then be related to an amplitude on the relevant A-scan A i , j . The intensity of each pixel I ( x , y ) in the TFM image is calculated by summing these amplitudes over all transmitter-receiver pairs:
I ( x , y ) = | i = 1 L j = 1 M H ( A i , j ( τ s i ( x , y ) + τ r j ( x , y ) ) ) |
where H ( · ) denotes the Hilbert transform, τ s i ( x , y ) is the travel-time between the transmitter s i and pixel ( x , y ) and τ r j ( x , y ) is the travel time between the pixel ( x , y ) and the receiver r j . In the case that a constant wave speed is assumed throughout the domain, τ s i ( x , y ) and τ r j ( x , y ) are the calculated travel times along straight rays between the transmitters/receivers and the point ( x , y ) . Alternatively, to account for spatial variations of the locally anisotropic material microstructure, and improve focussing capabilities in post processing, τ s i ( x , y ) and τ r j ( x , y ) can be extracted from travel time maps generated by the AMSFMM (which accounts for the varying wave speeds, anisotropy and the subsequent refraction). This approach has previously been referred to as TFM+ [4,5].
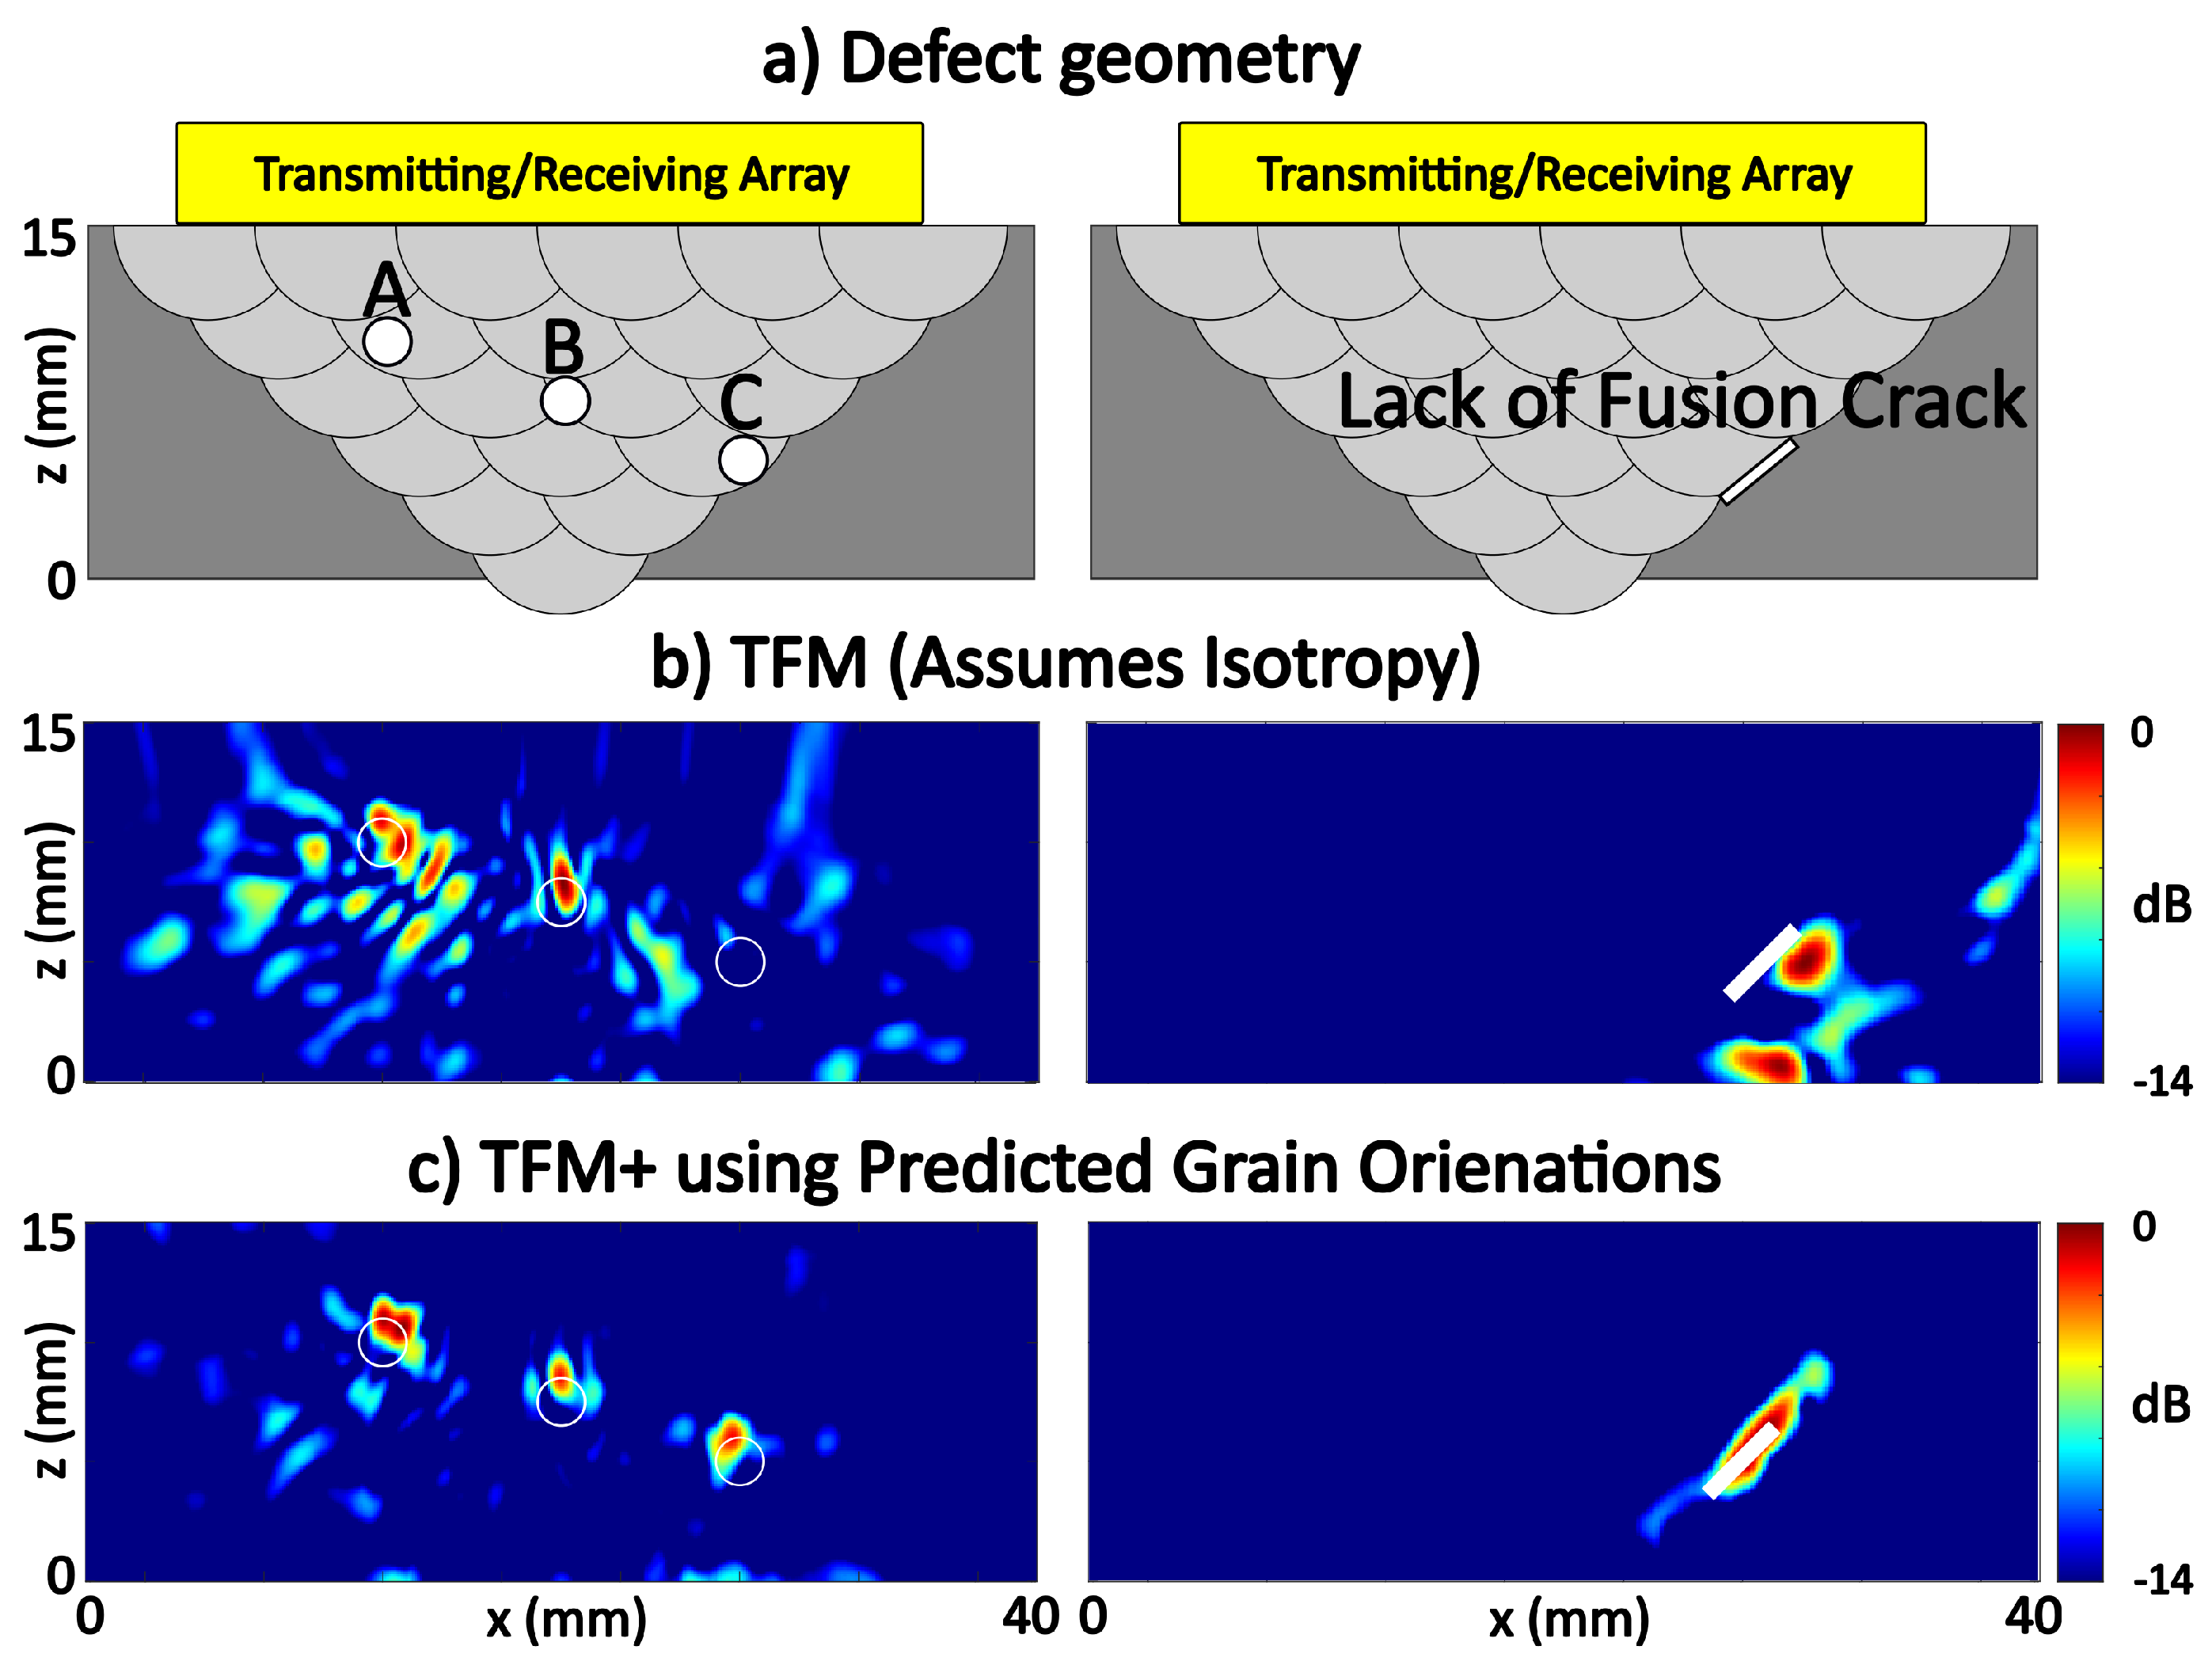
To test the success of our DNN reconstructed maps in the TFM+ framework, the Onscale FE package is used to simulate an FMC dataset arising from the 2 MHz (corresponding to a wavelength approximately of 2.5 mm) pulse-echo inspection of a weld containing three embedded circular voids, each with a 2 mm diameter (labelled A, B and C in Figure 9a, left image), and where the model parameters are as described in Section 2.3. The microstructure within the weld is parameterised using the sub-region grain orientations of Test Model 1 (shown in Figure 6). The TFM algorithm (Equation (5)), in which a constant isotropic wave speed is assumed throughout the domain (that of the parent material, where V L = 5790 m/s), was then applied to this generated FMC dataset. The resulting TFM image is shown in Figure 9b (left image) and exhibits peaks of image intensity I associated with the locations of defects A and B. However there are high levels of spatially coherent noise away from the true defect locations, which can be attributed to defocussing of the energy caused by the use of incorrect delay laws. Note that there appears to be no obvious third reflection in the image corresponding to defect C (although there is a small peak in intensity 2 mm to the left of its known location).
The TFM+ algorithm was then used in conjunction with the predicted grain orientation map generated from application of the model trained DNN to the FE generated ToF data, in the pulse-echo configuration (that is we use the tomographically reconstructed grain orientation map corresponding to the plot in bottom right image of Figure 8). The travel time fields through this predicted model were calculated using the AMSFMM algorithm, and these were then used in Equation (5) to construct the TFM+ image (shown in Figure 9c, left image). The resulting image shows three clear peaks in image intensity I corresponding to the three defects present, where the upper boundary of each defect is accurately depicted (due to the size of these defects we would expect the reflections to align with the upper defect edge as this is what is illuminated by the array inspection). The signal-to-noise ratio (SNR) is calculated for both the TFM and TFM+ images within a 5 × 5 mm window surrounding each defect, where the maximum within the window is divided by the mean of the values in the window. These values are provided in Table 2, with improvements in SNR given by the TFM+ algorithm of 2.6 and 5.3 dB for defects A and C, respectively. The SNR values for flaw B are consistent in both images. However note that this flaw lies centrally in the weld where there is little variation in grain orientation on the direct path and so the TFM in which a constant wavespeed is assumed performs very well here and the TFM+ does not improve upon the SNR. However, an improvement in axial spreading in the defect reconstruction can be observed across all three defects when the TFM+ is applied.
To further examine the improvements achieved when the DNN predicted map is used to correct the TFM delay laws, the simulation was run again in which the only change was the removal of the three circular defects and the embedding of a crack with length 4 mm and angled at 45° along the parent weld interface (Figure 9a, right hand image). A comparison between the TFM and TFM+ images can be seen in Figure 9b,c (right hand images). A significant improvement in the characterisation of the crack as a planar defect is observed when the grain map is accounted for. Furthermore, the location of the defect is more reliably portrayed and there is an improvement in SNR of 2.2 dB.
These results highlight the improvements which can be achieved when the grain orientation map is accounted for. To better explore the effects of the weld structure on the delay laws used to construct the TFM images, the difference between two travel time maps (both calculated from a centrally placed transducer element), where one assumes the constant wave speed of the parent material throughout the domain and the other accounts for the predicted grain map, is shown in Figure 10. First we observe the asymmetry in the error map, highlighting the asymmetrical nature of the weld structure and the heterogeneous distribution of anisotropy. Less texture in the error map is observed in the parent material areas where we see a more linear offset. This can be attributed to the fact that the errors accumulated in the weld are propagated outwards but towards the edge of the domain alternative, faster raypaths cease to exist and the error growth slows down. This should eventually result in slow linear growth caused by the fact that the AMSFMM works on a fixed grid and only facilitates wave propagation in a limited range of directions (standard TFM calculations are more accurate in large isotropic regions). It can also be seen that the further from the array a pixel lies, the more likely it is that errors will accumulate in the predicted travel time. This aligns with the results in Figure 9, where the largest improvements are observed in defect C and the crack, which lie furthest from the array.

4. Discussion

There are several limitations to the proposed framework that are yet to be overcome in the current work. Firstly, the experimental geometries considered here are confined to those where a transducer array is placed on top of the weld. This brings some practical challenges due to the non-planar topography of the weld cap. While these challenges could be overcome with the use of remote sensing systems (for example laser ultrasonics [43]), future studies will examine DNNs trained on alternative experimental geometries which can be applied in situ, for example where the arrays are placed away from the weld cap and mounted on wedges. In this paper, we have also used a simple background model (the Ogilvy model [29]) to constrain the inversion, by generating training data that consists only of random perturbations to this background model. The Ogilvy model is a relatively basic description of how grain orientations are distributed through welds, and it may be that more advanced weld models, such as the MINA model [13] which takes in more information about welding parameters, can be used as an alternative model to constrain the DNN inversion. Another possible avenue for improvement lies in further development of the model used to train the network. In its current state, although the AMSFMM is fast and provides travel time estimates within a desired tolerance for heterogeneous and locally anisotropic structures, it suffers from some biasing toward the underlying finite difference stencils, causing numerical errors to propagate in large homogeneous regions. Consideration of the anisotropic Eikonal equation and the curvature of the wavefront could significantly diminish these errors and provide more accurate models of the travel times, which could in turn reduce the requirement for the data calibration step as discussed in Section 2.4. Finally, the current approach provides a single approximation of the weld map and so, in real-world applications where the underlying weld geometry is unknown, it is not possible to definitively measure or comment on the accuracy of the predicted grain orientations. Estimating the uncertainty of the predicted grain orientations through the use of more sophisticated networks such as mixture density networks [25] or Bayesian neural networks [44] thus presents an important future step to improve the current framework.
The next step for testing this framework is application to data acquired from a controlled physical experiment, where ground truth of the weld structure is made available through destructive methods such as the electron backscatter diffraction technique. However, several assumptions need to be relaxed to reach the point where the presented DNN framework can be reliably applied to experimentally acquired data. Although it has been tested using Onscale data (which has undergone some experimental validation [32]), the current approach makes no allowance for background noise in the acquired data and uncertainty in the transducer locations. To overcome these assumptions, additional noise can be incorporated into the modelled travel time data representing the expected level of background noise or the uncertainty in the transducer locations.

5. Conclusions

A deep learning based framework for the real-time prediction of the spatially varying crystallographic orientations in a weld, from ultrasonic time-of-flight data, is presented. A series of deep neural networks (DNNs) are trained, using 10,000 modelled data pairs, to accurately and rapidly reconstruct grain orientation maps from ultrasonic array data collected using both through-transmission and pulse-echo transducer array configurations. Prior knowledge of the expected microstructures is used to constrain the DNN inversions and we use random perturbations to the Ogilvy weld model to generate the training data. In the case where the test data arises from commercial FE simulations, the trained DNNs predict grain orientations to within 3° and take approximately 0.04 s on a standard desktop computer. The improvement in defect detection and characterisation capabilities facilitated by access to these estimated grain orientation maps was demonstrated by incorporating the crystallographic orientation estimates into the delay law calculations on which the total focusing method algorithm is based. An improvement of up to 5.3 dB in signal-to-noise ratio was achieved and a strong reflection by a defect not previously detected was observed.
Overall, these results show significant potential for the use of DNNs to improve NDE capabilities. These methods provide fast and accurate characterisations of the weld structure which can be used to improve subsequent imaging results. Furthermore, this near real-time approach offers potential for extension to NDE of dynamic manufacturing processes, such as those present in the additive manufacturing field.

Author Contributions

Conceptualization, J.S., K.T., A.M. and C.M.; methodology, J.S. and K.T.; software, J.S.; validation, J.S.; formal analysis, J.S. and K.T.; investigation, J.S. and K.T.; resources, C.M.; data curation, J.S.; writing—original draft preparation, J.S. and K.T.; writing—review and editing, A.M. and C.M.; visualization, J.S.; supervision, K.T., A.M. and C.M.; project administration, A.M. and C.M.; funding acquisition, K.T., A.M. and C.M. All authors have read and agreed to the published version of the manuscript.

Funding

This work was funded by the Engineering and Physical Sciences Research Council (UK): grant numbers EP/P005268/1 and EP/S001174/1 and the UK Research Centre in Non Destructive Evaluation (RCNDE): AC-for-IPI.

Institutional Review Board Statement

Not applicable.

Informed Consent Statement

Not applicable.

Data Availability Statement

The data and Python scripts required to reproduce the findings in this publication are made available at: https://github.com/jonnyrsingh/DeepLearningWeldInversion accessed on 19 November 2021.

Conflicts of Interest

The authors declare no conflict of interest.

References

  1. Holmes, C.; Drinkwater, B.W.; Wilcox, P.D. Post-processing of the full matrix of ultrasonic transmit–receive array data for non-destructive evaluation. NDT & E Int. 2005, 38, 701–711. [Google Scholar]
  2. Connolly, G.; Lowe, M.; Temple, J.; Rokhlin, S. The application of Fermat’s principle for imaging anisotropic and inhomogeneous media with application to austenitic steel weld inspection. Proc. R. Soc. A Math. Phys. Eng. Sci. 2009, 465, 3401–3423. [Google Scholar] [CrossRef]
  3. Zhang, J.; Hunter, A.; Drinkwater, B.; Wilcox, P. Monte Carlo inversion of ultrasonic array data to map anisotropic weld properties. IEEE Trans. Ultrason. Ferroelectr. Freq. Control 2012, 59, 2487–2497. [Google Scholar] [CrossRef] [PubMed]
  4. Tant, K.M.M.; Galetti, E.; Mulholland, A.; Curtis, A.; Gachagan, A. Effective grain orientation mapping of complex and locally anisotropic media for improved imaging in ultrasonic non-destructive testing. Inverse Probl. Sci. Eng. 2020, 1–25. [Google Scholar] [CrossRef]
  5. Tant, K.M.M.; Galetti, E.; Mulholland, A.; Curtis, A.; Gachagan, A. A transdimensional Bayesian approach to ultrasonic travel-time tomography for non-destructive testing. Inverse Probl. 2018, 34, 095002. [Google Scholar] [CrossRef] [Green Version]
  6. Nageswaran, C.; Carpentier, C.; Tse, Y. Microstructural quantification, modelling and array ultrasonics to improve the inspection of austenitic welds. Insight-Non-Destr. Test. Cond. Monit. 2009, 51, 660–666. [Google Scholar] [CrossRef]
  7. Chassignole, B.; Villard, D.; Dubuget, M.; Baboux, J.; Guerjouma, R.E. Characterization of austenitic stainless steel welds for ultrasonic NDT. In Proceedings of the AIP Conference Proceedings; American Institute of Physics: College Park, MD, USA, 2000; Volume 509, pp. 1325–1332. [Google Scholar]
  8. Gueudré, C.; Le Marrec, L.; Moysan, J.; Chassignole, B. Direct model optimisation for data inversion. Application to ultrasonic characterisation of heterogeneous welds. NDT & E Int. 2009, 42, 47–55. [Google Scholar]
  9. Sharples, S.; Clark, M.; Somekh, M. Spatially resolved acoustic spectroscopy for fast noncontact imaging of material microstructure. Opt. Express 2006, 14, 10435–10440. [Google Scholar] [CrossRef]
  10. Abrahams, I.; Wickham, G. The propagation of elastic waves in a certain class of inhomogeneous anisotropic materials. I. The refraction of a horizontally polarized shear wave source. Proc. R. Soc. Lond. Ser. A Math. Phys. Sci. 1992, 436, 449–478. [Google Scholar]
  11. Spies, M. Analytical methods for modeling of ultrasonic nondestructive testing of anisotropic media. Ultrasonics 2004, 42, 213–219. [Google Scholar] [CrossRef]
  12. Harvey, G.; Tweedie, A.; Carpentier, C.; Reynolds, P. Finite element analysis of ultrasonic phased array inspections on anisotropic welds. In Proceedings of the AIP Conference Proceedings; American Institute of Physics: College Park, MD, USA, 2011; Volume 1335, pp. 827–834. [Google Scholar]
  13. Moysan, J.; Apfel, A.; Corneloup, G.; Chassignole, B. Modelling the grain orientation of austenitic stainless steel multipass welds to improve ultrasonic assessment of structural integrity. Int. J. Press. Vessel. Pip. 2003, 80, 77–85. [Google Scholar] [CrossRef]
  14. L’huillier, P.; Chassignole, B.; Oudaa, M.; Kerhervé, S.; Rupin, F.; Fouquet, T. Investigation of the ultrasonic attenuation in anisotropic weld materials with finite element modeling and grain-scale material description. Ultrasonics 2017, 78, 40–50. [Google Scholar] [CrossRef]
  15. Bodin, T.; Sambridge, M. Seismic tomography with the reversible jump algorithm. Geophys. J. Int. 2009, 178, 1411–1436. [Google Scholar] [CrossRef]
  16. Zhang, X.; Curtis, A. Variational full-waveform inversion. Geophys. J. Int. 2020, 222, 406–411. [Google Scholar] [CrossRef] [Green Version]
  17. Bai, C.; Huang, G.; Li, X.; Zhou, B.; Greenhalgh, S. Ray tracing of multiple transmitted/reflected/converted waves in 2-D/3-D layered anisotropic TTI media and application to crosswell traveltime tomography. Geophys. J. Int. 2013, 195, 1068–1087. [Google Scholar] [CrossRef] [Green Version]
  18. Zhu, H.; Komatitsch, D.; Tromp, J. Radial anisotropy of the North American upper mantle based on adjoint tomography with USArray. Geophys. J. Int. 2017, 211, 349–377. [Google Scholar] [CrossRef]
  19. Lebedev, S.; Van Der Hilst, R.D. Global upper-mantle tomography with the automated multimode inversion of surface and S-wave forms. Geophys. J. Int. 2008, 173, 505–518. [Google Scholar] [CrossRef] [Green Version]
  20. Guasch, L.; Agudo, O.; Tang, M.; Nachev, P.; Warner, M. Full-waveform inversion imaging of the human brain. NPJ Digit. Med. 2020, 3, 1–12. [Google Scholar] [CrossRef] [PubMed] [Green Version]
  21. Bernard, S.; Monteiller, V.; Komatitsch, D.; Lasaygues, P. Ultrasonic computed tomography based on full-waveform inversion for bone quantitative imaging. Phys. Med. Biol. 2017, 62, 7011. [Google Scholar] [CrossRef]
  22. Huthwaite, P.; Simonetti, F. High-resolution imaging without iteration: A fast and robust method for breast ultrasound tomography. J. Acoust. Soc. Am. 2011, 130, 1721–1734. [Google Scholar] [CrossRef] [Green Version]
  23. Bishop, C.M. Neural Networks for Pattern Recognition; Oxford University Press: Oxford, UK, 1995. [Google Scholar]
  24. Earp, S.; Curtis, A.; Zhang, X.; Hansteen, F. Probabilistic neural network tomography across Grane field (North Sea) from surface wave dispersion data. Geophys. J. Int. 2020, 223, 1741–1757. [Google Scholar] [CrossRef]
  25. Earp, S.; Curtis, A. Probabilistic neural network-based 2D travel-time tomography. Neural Comput. Appl. 2020, 32, 17077–17095. [Google Scholar] [CrossRef]
  26. Araya-Polo, M.; Jennings, J.; Adler, A.; Dahlke, T. Deep-learning tomography. Lead. Edge 2018, 37, 58–66. [Google Scholar] [CrossRef]
  27. Fan, Y.; Wang, H.; Gemmeke, H.; Hopp, T.; Hesser, J. Model-data-driven image reconstruction with neural networks for ultrasound computed tomography breast imaging. Neurocomputing 2022, 467, 10–21. [Google Scholar] [CrossRef]
  28. Zhao, W.; Wang, H.; Gemmeke, H.; Van Dongen, K.W.; Hopp, T.; Hesser, J. Ultrasound transmission tomography image reconstruction with a fully convolutional neural network. Phys. Med. Biol. 2020, 65, 235021. [Google Scholar] [CrossRef] [PubMed]
  29. Ogilvy, J.A. Ultrasonic beam profiles and beam propagation in an austenitic weld using a theoretical ray tracing model. Ultrasonics 1986, 24, 337–347. [Google Scholar] [CrossRef]
  30. Holmes, C.; Drinkwater, B.; Wilcox, P. The post-processing of ultrasonic array data using the total focusing method. Insight-Non-Destr. Test. Cond. Monit. 2004, 46, 677–680. [Google Scholar] [CrossRef]
  31. Connolly, G.; Lowe, M.; Temple, J.; Rokhlin, S. Correction of ultrasonic array images to improve reflector sizing and location in inhomogeneous materials using a ray-tracing model. J. Acoust. Soc. Am. 2010, 127, 2802–2812. [Google Scholar] [CrossRef] [PubMed] [Green Version]
  32. Dobson, J.; Tweedie, A.; Harvey, G.; O’Leary, R.; Mulholland, A.; Tant, K.; Gachagan, A. Finite element analysis simulations for ultrasonic array NDE inspections. In Proceedings of the AIP Conference Proceedings; AIP Publishing LLC: Melville, NY, USA, 2016; Volume 1706, p. 040005. [Google Scholar]
  33. Chassignole, B.; El Guerjouma, R.; Ploix, M.A.; Fouquet, T. Ultrasonic and structural characterization of anisotropic austenitic stainless steel welds: Towards a higher reliability in ultrasonic non-destructive testing. NDT & E Int. 2010, 43, 273–282. [Google Scholar]
  34. Gueudré, C.; Mailhé, J.; Ploix, M.; Corneloup, G.; Chassignole, B. Influence of the uncertainty of elastic constants on the modelling of ultrasound propagation through multi-pass austenitic welds. Impact on non-destructive testing. Int. J. Press. Vessel. Pip. 2019, 171, 125–136. [Google Scholar] [CrossRef]
  35. Lhémery, A.; Calmon, P.; Lecœur-Taıbi, I.; Raillon, R.; Paradis, L. Modeling tools for ultrasonic inspection of welds. NDT & E Int. 2000, 33, 499–513. [Google Scholar]
  36. Wirgin, A. The Inverse Crime. arXiv 2004, arXiv:math-ph/0401050. [Google Scholar]
  37. Sethian, J.A. Level Set Methods and Fast Marching Methods: Evolving Interfaces in Computational Geometry, Fluid Mechanics, Computer Vision, and Materials Science; Cambridge University Press: Cambridge, MA, USA, 1999; Volume 3. [Google Scholar]
  38. OnScale. 770 Marshall Street, Redwood City, CA, USA. Available online: https://onscale.com/about-us/ (accessed on 19 November 2021).
  39. Kingma, D.P.; Ba, J. Adam: A method for stochastic optimization. arXiv 2014, arXiv:1412.6980. [Google Scholar]
  40. Singh, J.; Tant, K.M.; Curtis, A.; Mulholland, A.J. Real-time super-resolution mapping of locally anisotropic grain orientations for ultrasonic non-destructive evaluation of crystalline material. Neural Comput. Appl. 2021. [Google Scholar] [CrossRef]
  41. Bergstra, J.; Komer, B.; Eliasmith, C.; Yamins, D.; Cox, D.D. Hyperopt: A Python library for model selection and hyperparameter optimization. Comput. Sci. Discov. 2015, 8, 014008. [Google Scholar] [CrossRef]
  42. Kelly, B.; Matthews, T.P.; Anastasio, M.A. Deep learning-guided image reconstruction from incomplete data. arXiv 2017, arXiv:1709.00584. [Google Scholar]
  43. Stratoudaki, T.; Javadi, Y.; Kerr, W.; Wilcox, P.D.; Pieris, D.; Clark, M. Laser induced phased arrays for remote ultrasonic imaging of additive manufactured components. In Proceedings of the 57th Annual Conference of the British Institute of Non-Destructive Testing, NDT 2018, Nottingham, UK, 10–12 September 2018; pp. 174–182. [Google Scholar]
  44. Jospin, L.V.; Buntine, W.; Boussaid, F.; Laga, H.; Bennamoun, M. Hands-on Bayesian Neural Networks–a Tutorial for Deep Learning Users. arXiv 2020, arXiv:2007.06823. [Google Scholar]
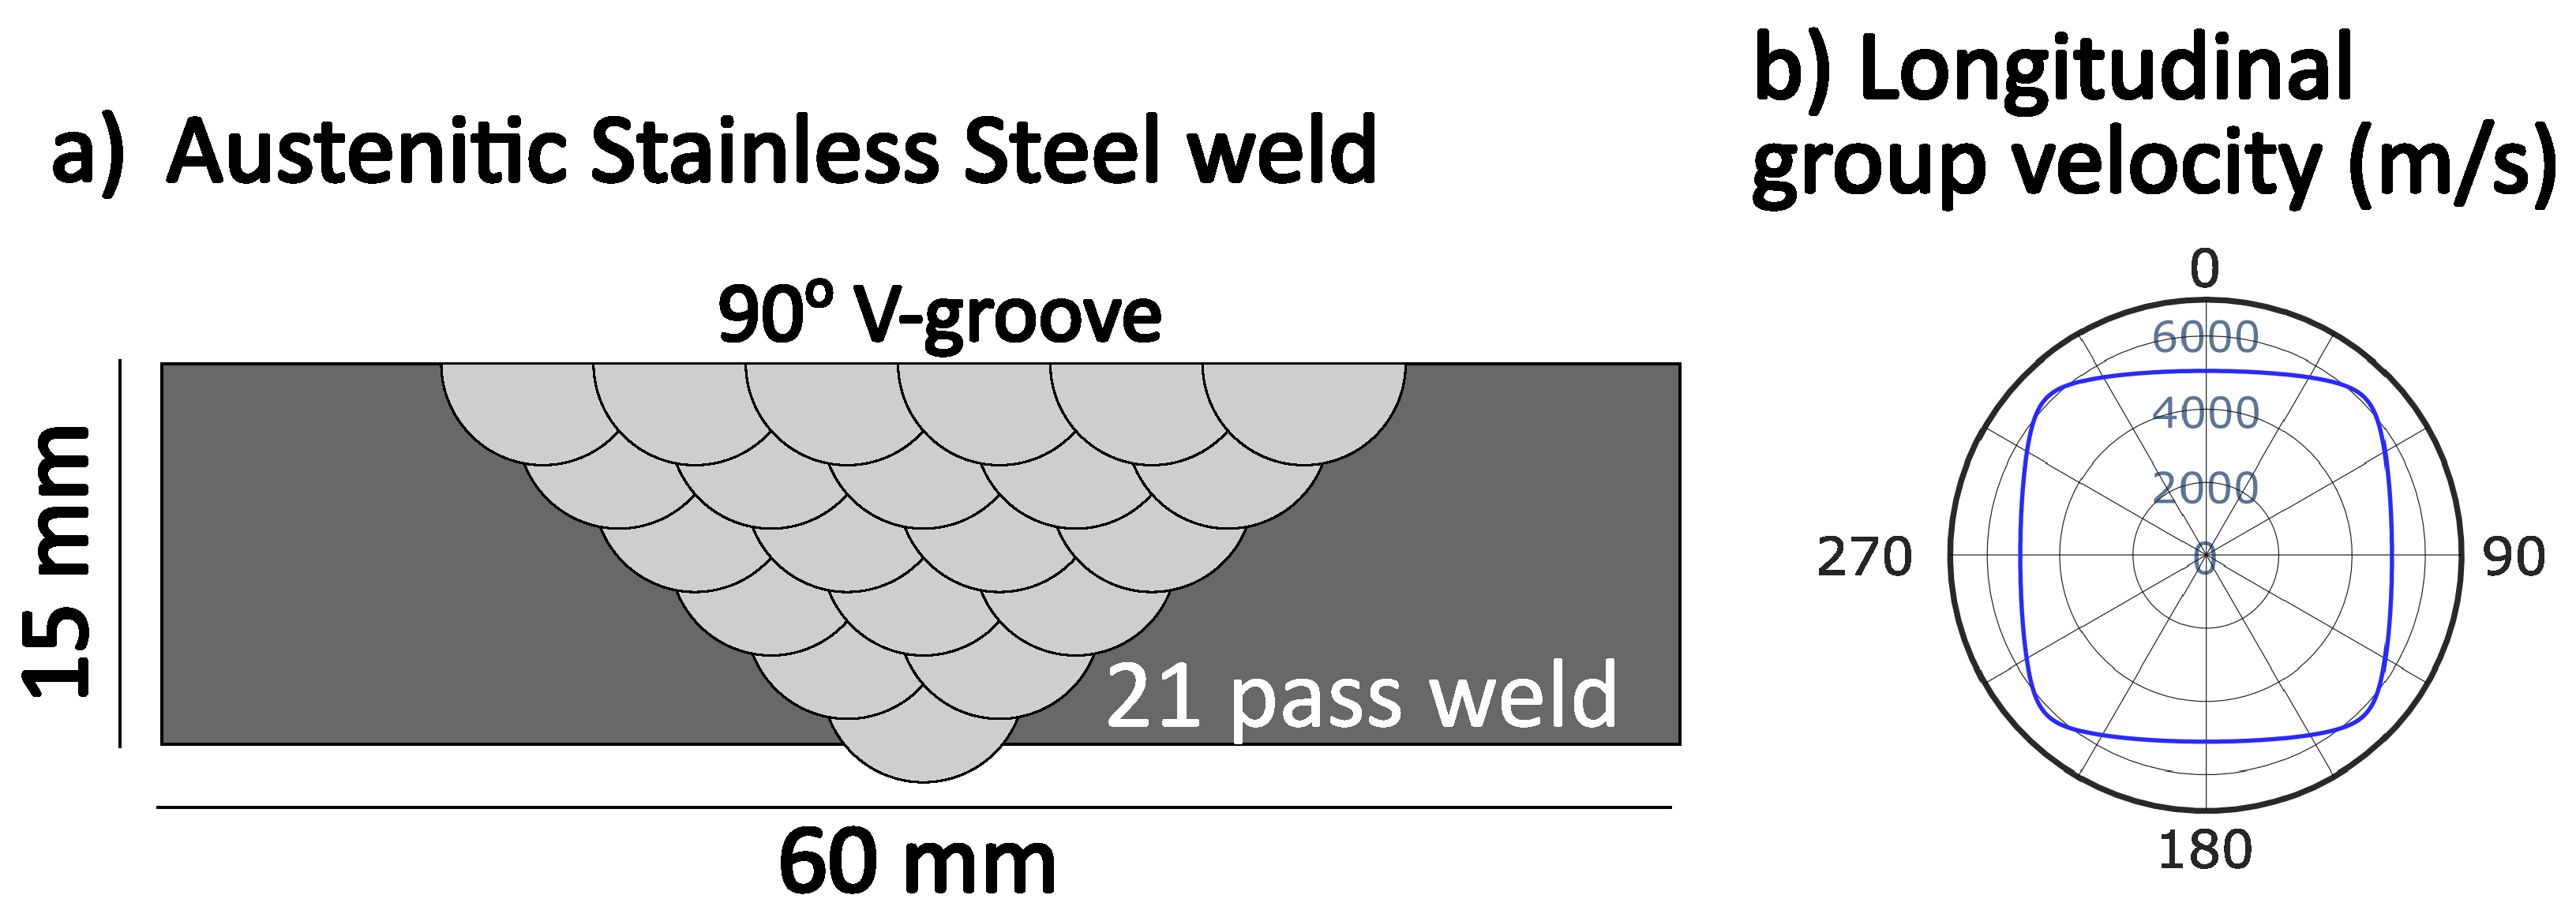
Figure 1. (a) Schematic of the considered weld geometry, a 90° V-groove austenitic stainless steel weld constructed from 21 weld passes; (b) the group velocity curve used to model austenitic stainless steel using a cubic stiffness tensor where c 11 = 203.6 GPa, c 12 = 133.5 GPa and c 44 = 129.8 GPa and the density is ρ = 7874 kg/m 3 (from [12,32]).
Applsci 12 00532 g001
Figure 2. (a) Grain orientations given by the Ogilvy model (Equation (1)) used as an underlying background model for the training data. (b) Example grain orientation maps used to generate training data, computed as uniformly random perturbations to the Ogilvy model within ± 10 ° range.
Applsci 12 00532 g002
Figure 3. Transducer elements are positioned in three configurations: (a) a through-transmission configuration, where an array of 32 transmitting elements are placed on the top of the weld, and an array of 32 receiving elements are placed directly opposite on the bottom of the weld; (b) an offset through-transmission configuration, where transmitting elements are placed at the top of the weld and the receiving elements are placed at the bottom, but offset to the right by 20 mm (to avoid the weld bead); (c) a pulse-echo configuration, where the array is placed on top of the weld, and each transducer element acts both as a transmitter and a receiver.
Applsci 12 00532 g003
Figure 4. Example travel time map given by the anisotropic multi-stencil fast marching method [4] through a weld model parametrised with grain orientations given by the Ogilvy model (shown in Figure 2a).
Applsci 12 00532 g004
Figure 5. The calculated travel times at all receiving elements for the anisotropic multi-stencil fast marching method (AMSFMM) plotted against the travel times taken from the finite element analysis (FEA) models, plotted for three transmitting elements s i , where i is the transmitter index. The data are fit with a third degree polynomial G (red curves), which is for calibrating the FEA generated data so it can be used with the DNN trained on AMSFMM data.
Applsci 12 00532 g005
Figure 6. The predicted grain orientations (tomographic reconstructions) from the DNN inversion (red) compared against the true grain orientations (blue) that were used to generate the ToF data, for two test models (not part of the training data). Predictions are shown for (a) the through-transmission, (b) offset through-transmission, and (c) pulse-echo transducer array configurations.
Applsci 12 00532 g006
Figure 7. Mean absolute error (MAE) for each weld sub-region of the predicted grain orientations (tomographic reconstructions) averaged over 100 test models for (a) the through-transmission, (b) offset through-transmission, and (c) pulse-echo transducer array configurations.
Applsci 12 00532 g007
Figure 8. Comparison of absolute error (in degrees°) between predicted and true grain orientations for Test Model 1 (as in Figure 6) using the pulse-echo transducer array configuration. The error distributions are shown for case of the inverse crime, with AMSFMM generated data (left), and for FEA generated data (right).
Applsci 12 00532 g008
Figure 9. (a) Schematics of the FEA simulations using the pulse-echo transducer array configuration of a weld region parameterised with the Test Model 1 grain orientations shown in Figure 6. On the left: three circular defects (labelled A, B and C) with 2 mm diameter are embedded within the weld. On the right: the model is embedded with a crack with length 4 mm and angled at 45° to simulate a lack of fusion defect at the parent weld interface. Image (b) arises from the application of the TFM algorithm in which a constant wave speed is assumed throughout the domain. Image (c) uses the TFM+ algorithm, exploiting the predicted grain orientations arising from application of the DNN to the FEA data generated by simulation of the pulse-echo inspection as depicted in Figure 8. The known boundaries of the defects are represented by the white circles.
Applsci 12 00532 g009
Figure 10. The difference between a travel time map that assumes the constant wave speed of the parent material throughout the domain and one that accounts for the predicted grain map, using centrally placed transducer element.
Applsci 12 00532 g010
Table 1. DNN hyperparameters selected from stochastic optimisation.
HyperparameterThrough-Transmission (TT)Offset TTPulse-Echo
Learning rate5 × 10 3 2 × 10 3 3.8 × 10 3
Decay rate5.4 × 10 3 4.4 × 10 3 4.5 × 10 3
Nodes in layer 1283220303
Nodes in additional layers464844
Number of layers444
Activation functionSigmoidSigmoidSigmoid
Table 2. Signal-to-noise ratio (SNR) for TFM and TFM+ flaw images shown in Figure 9.
Defect ADefect BDefect C
TFM11.7 dB14.1 dB10.5 dB
TFM+14.3 dB14.1 dB15.8 dB
Publisher’s Note: MDPI stays neutral with regard to jurisdictional claims in published maps and institutional affiliations.