

Reliability Sensitivity Analysis by the Axis Orthogonal Importance Sampling Method Based on the Box-Muller Transformation

Abstract
:1. Introduction
2. Axis Orthogonal Importance Sampling Method
3. Reliability Sensitivity Calculation
4. Quasi-Monte Carlo Method
4.1. Latin Hypercubes Sampling (LHS)
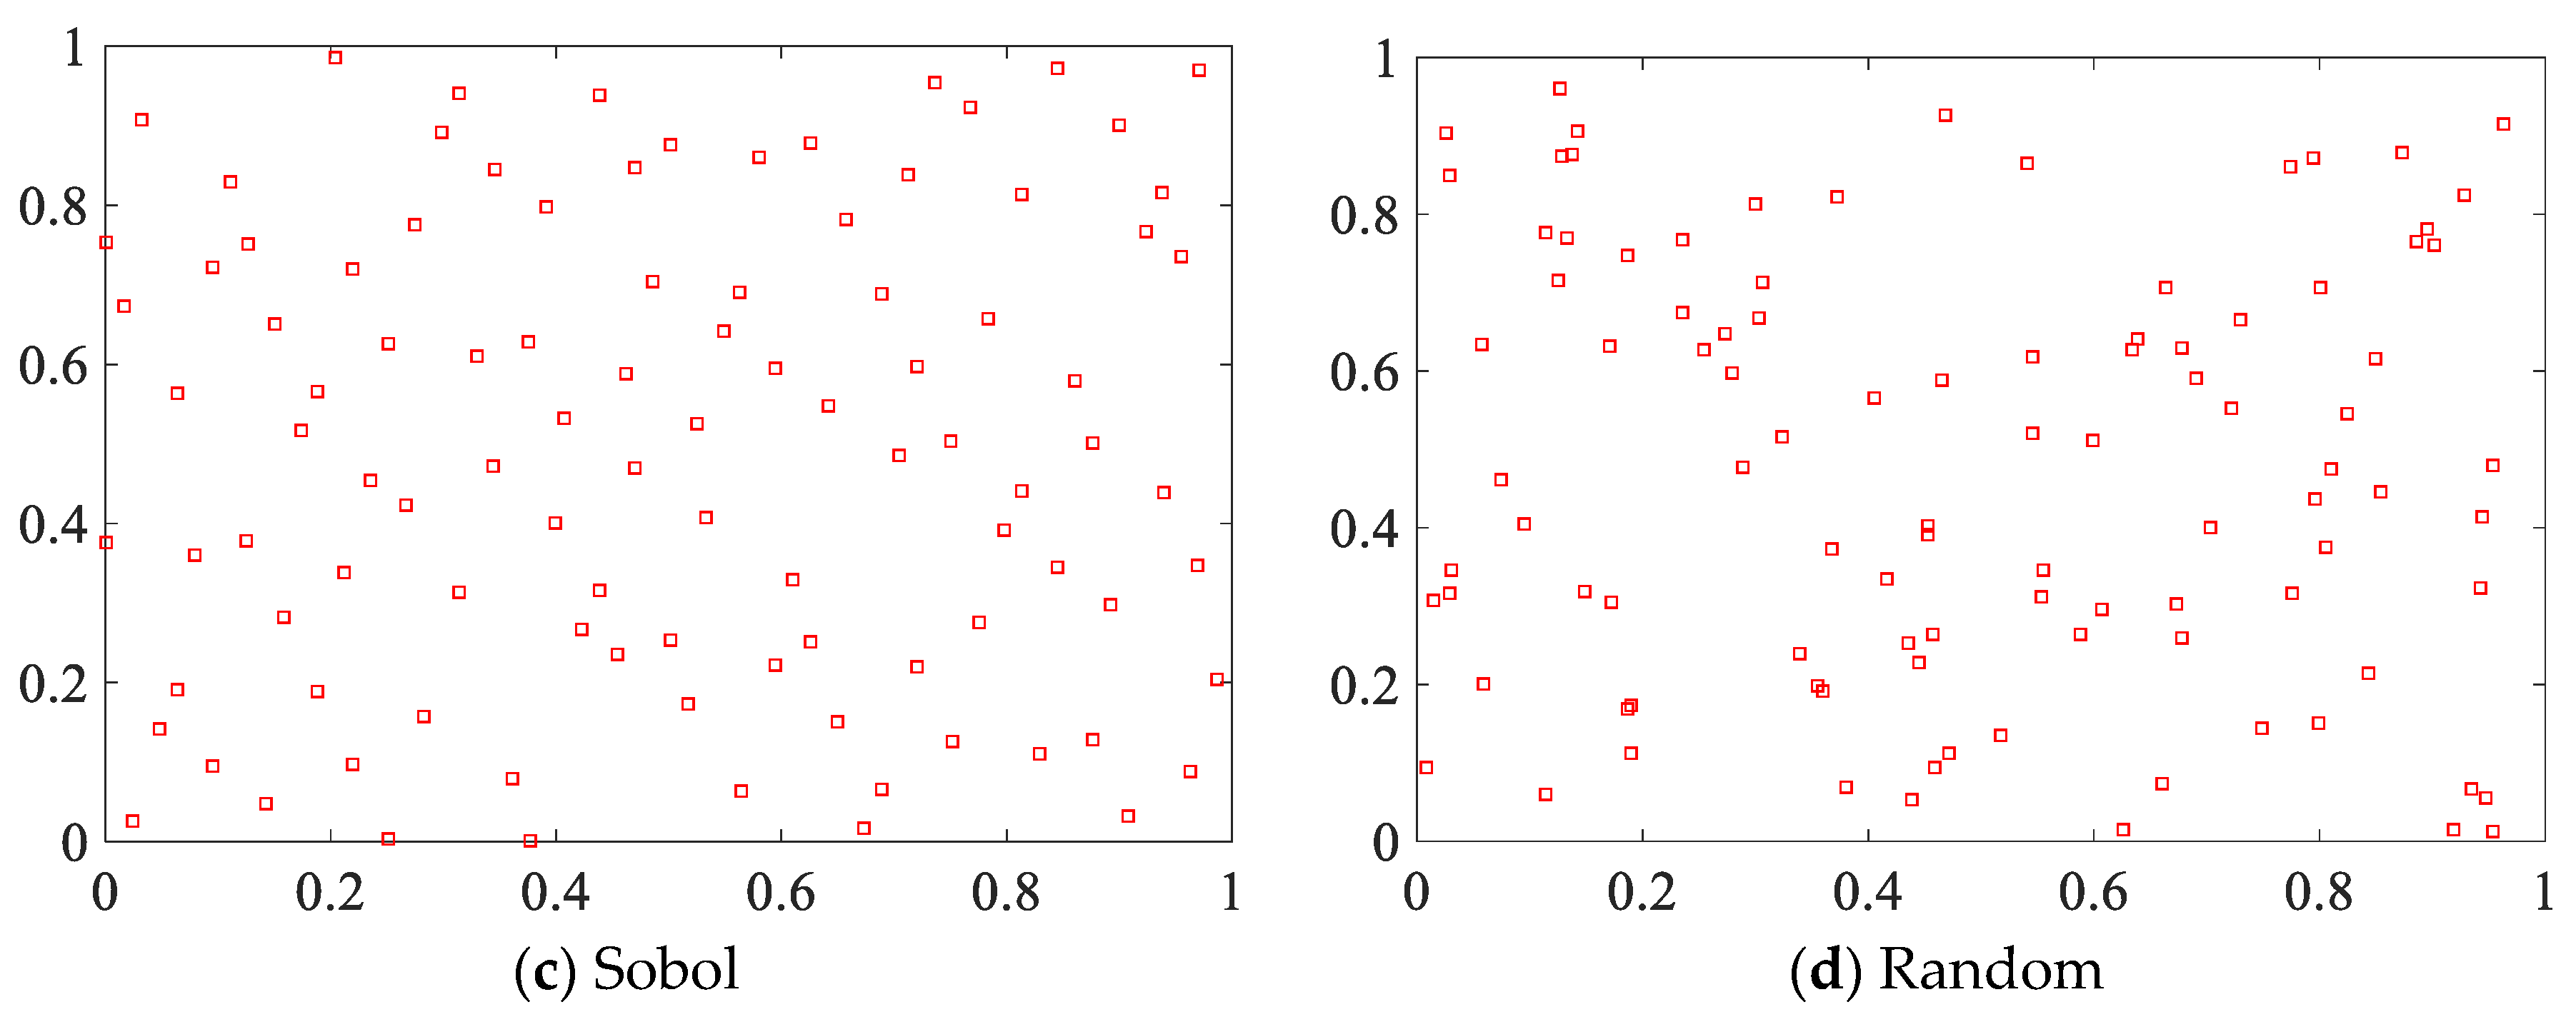
4.2. Quasi-Random Sequence
5. Quasi-Random Sequence and Box-Muller Transformation for Reliability Sensitivity Analysis Based on the Axis Orthogonal Importance Sampling Method
5.1. Random Sequence following a Target Distribution
5.1.1. Inverse Transformation
5.1.2. Box-Muller Transformation
5.2. Quasi-Random Sequence and Box-Muller Transformation for Reliability Sensitivity Analysis
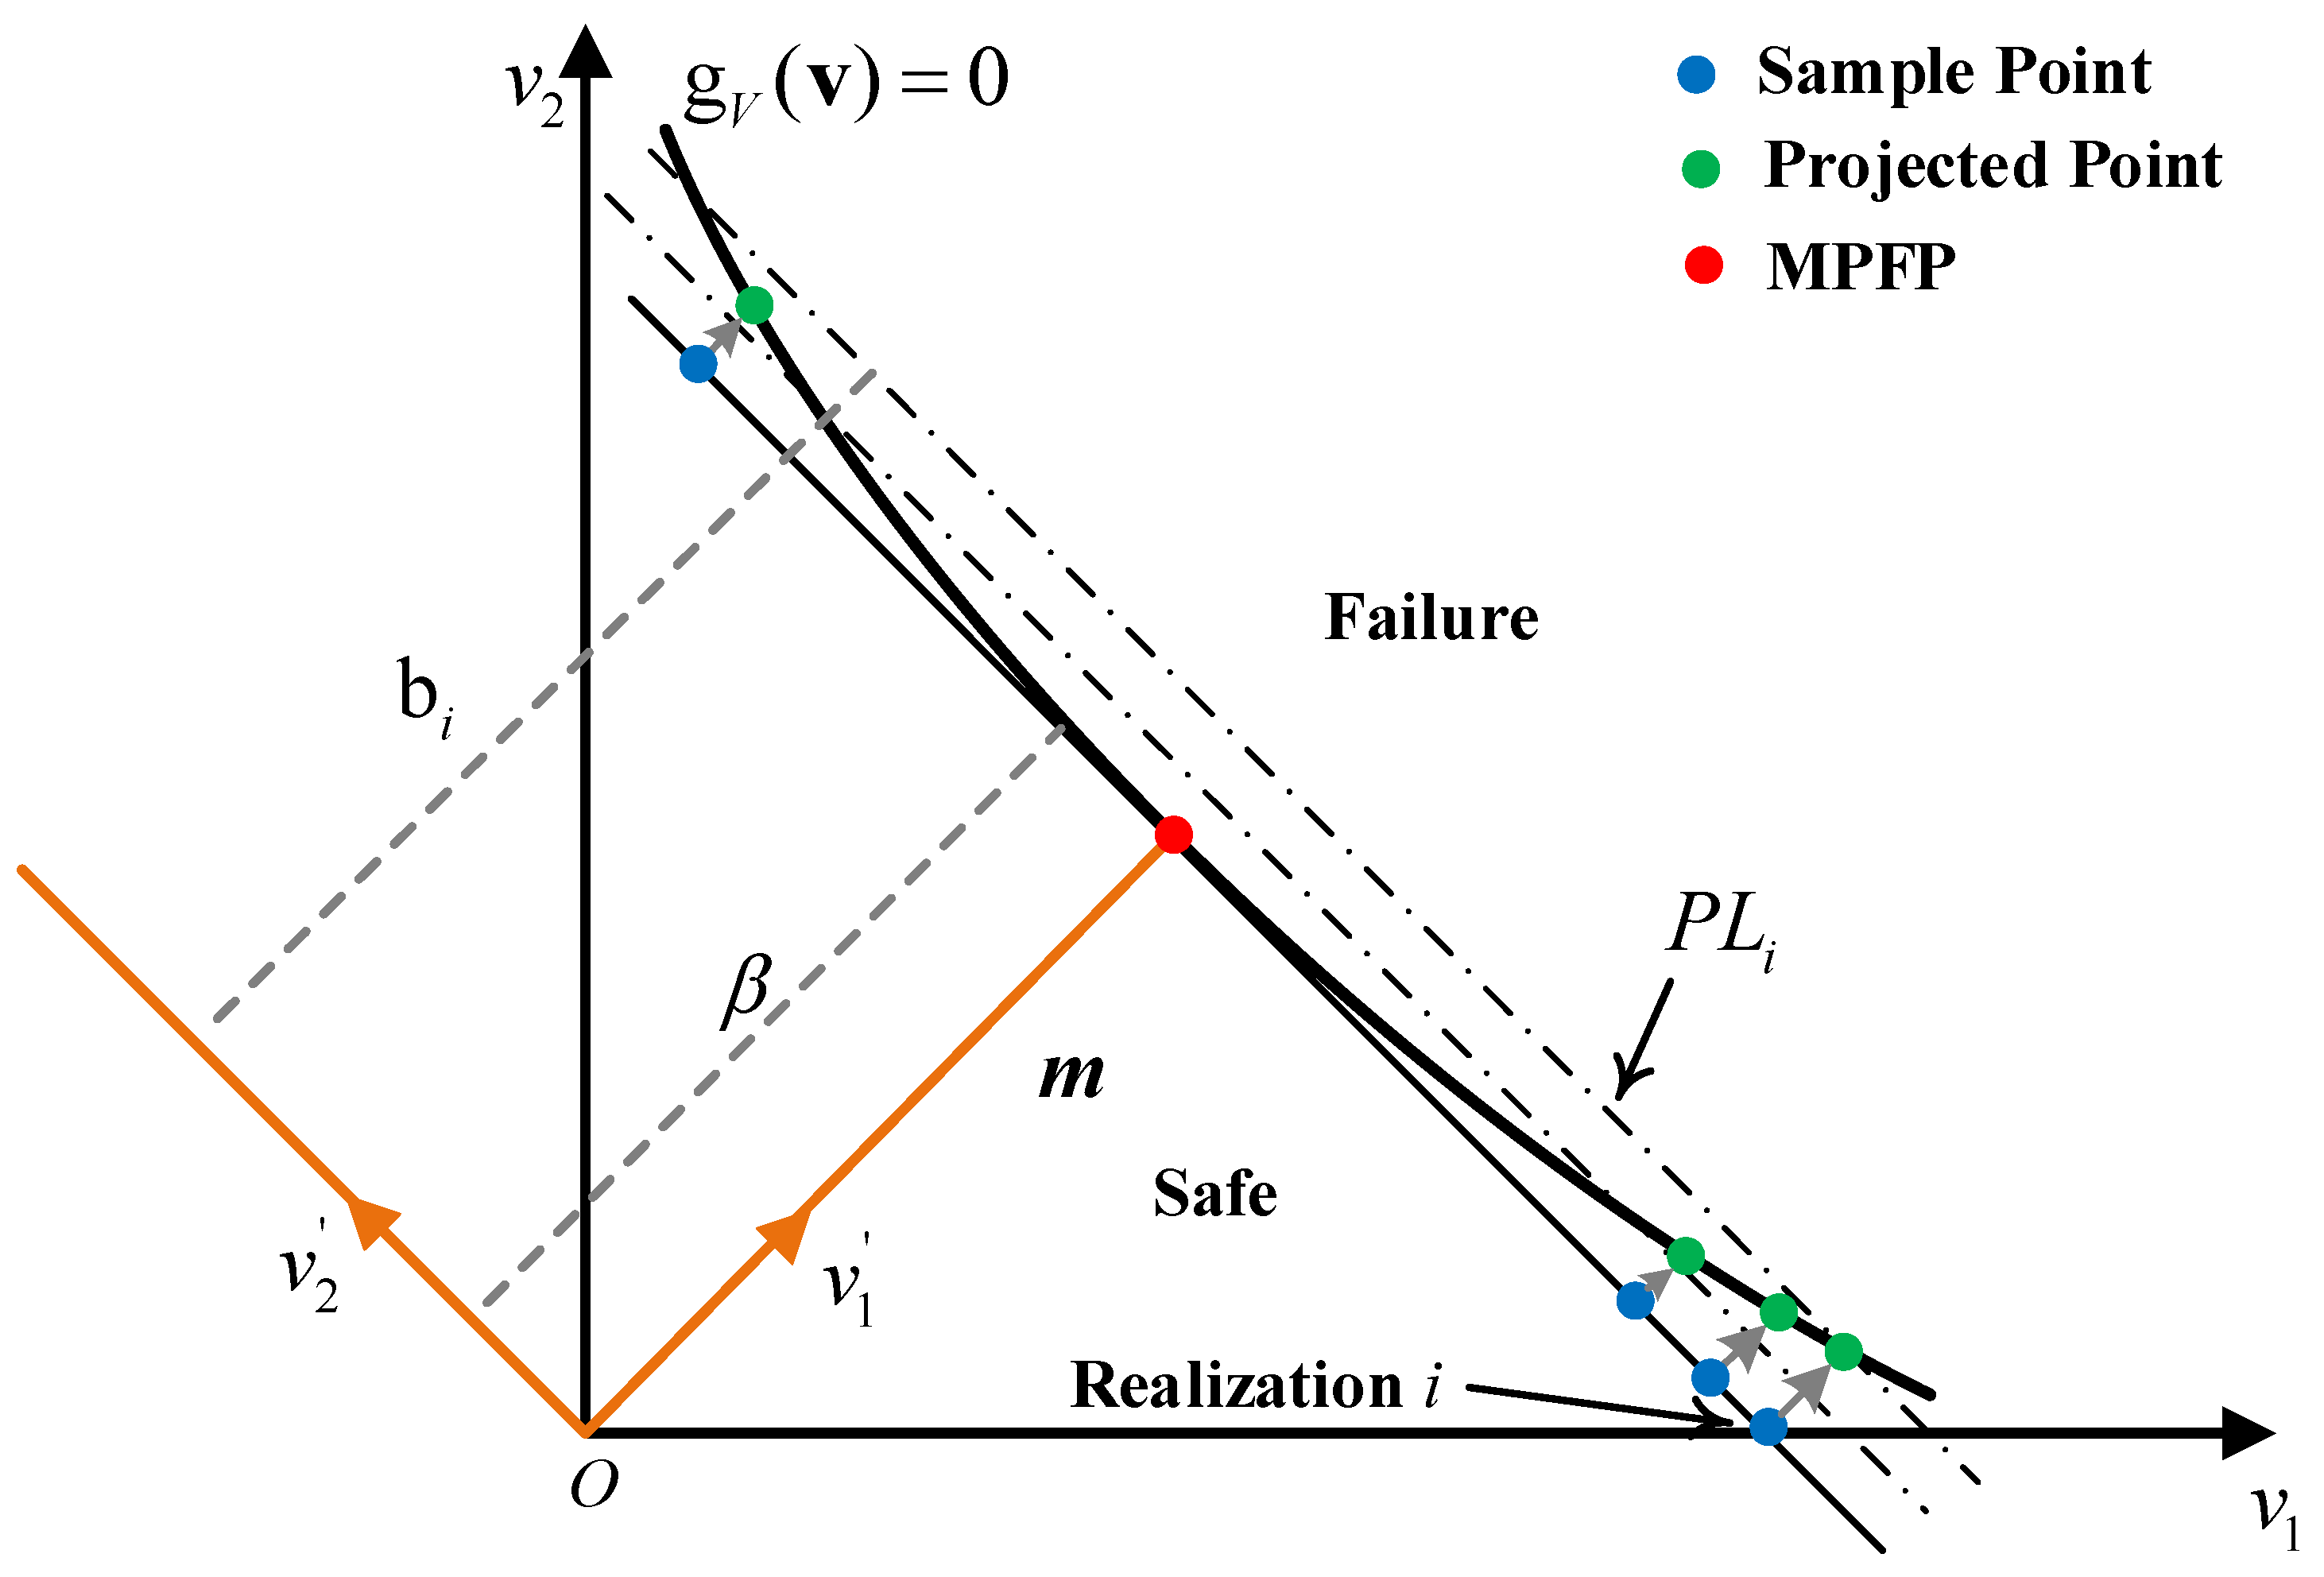
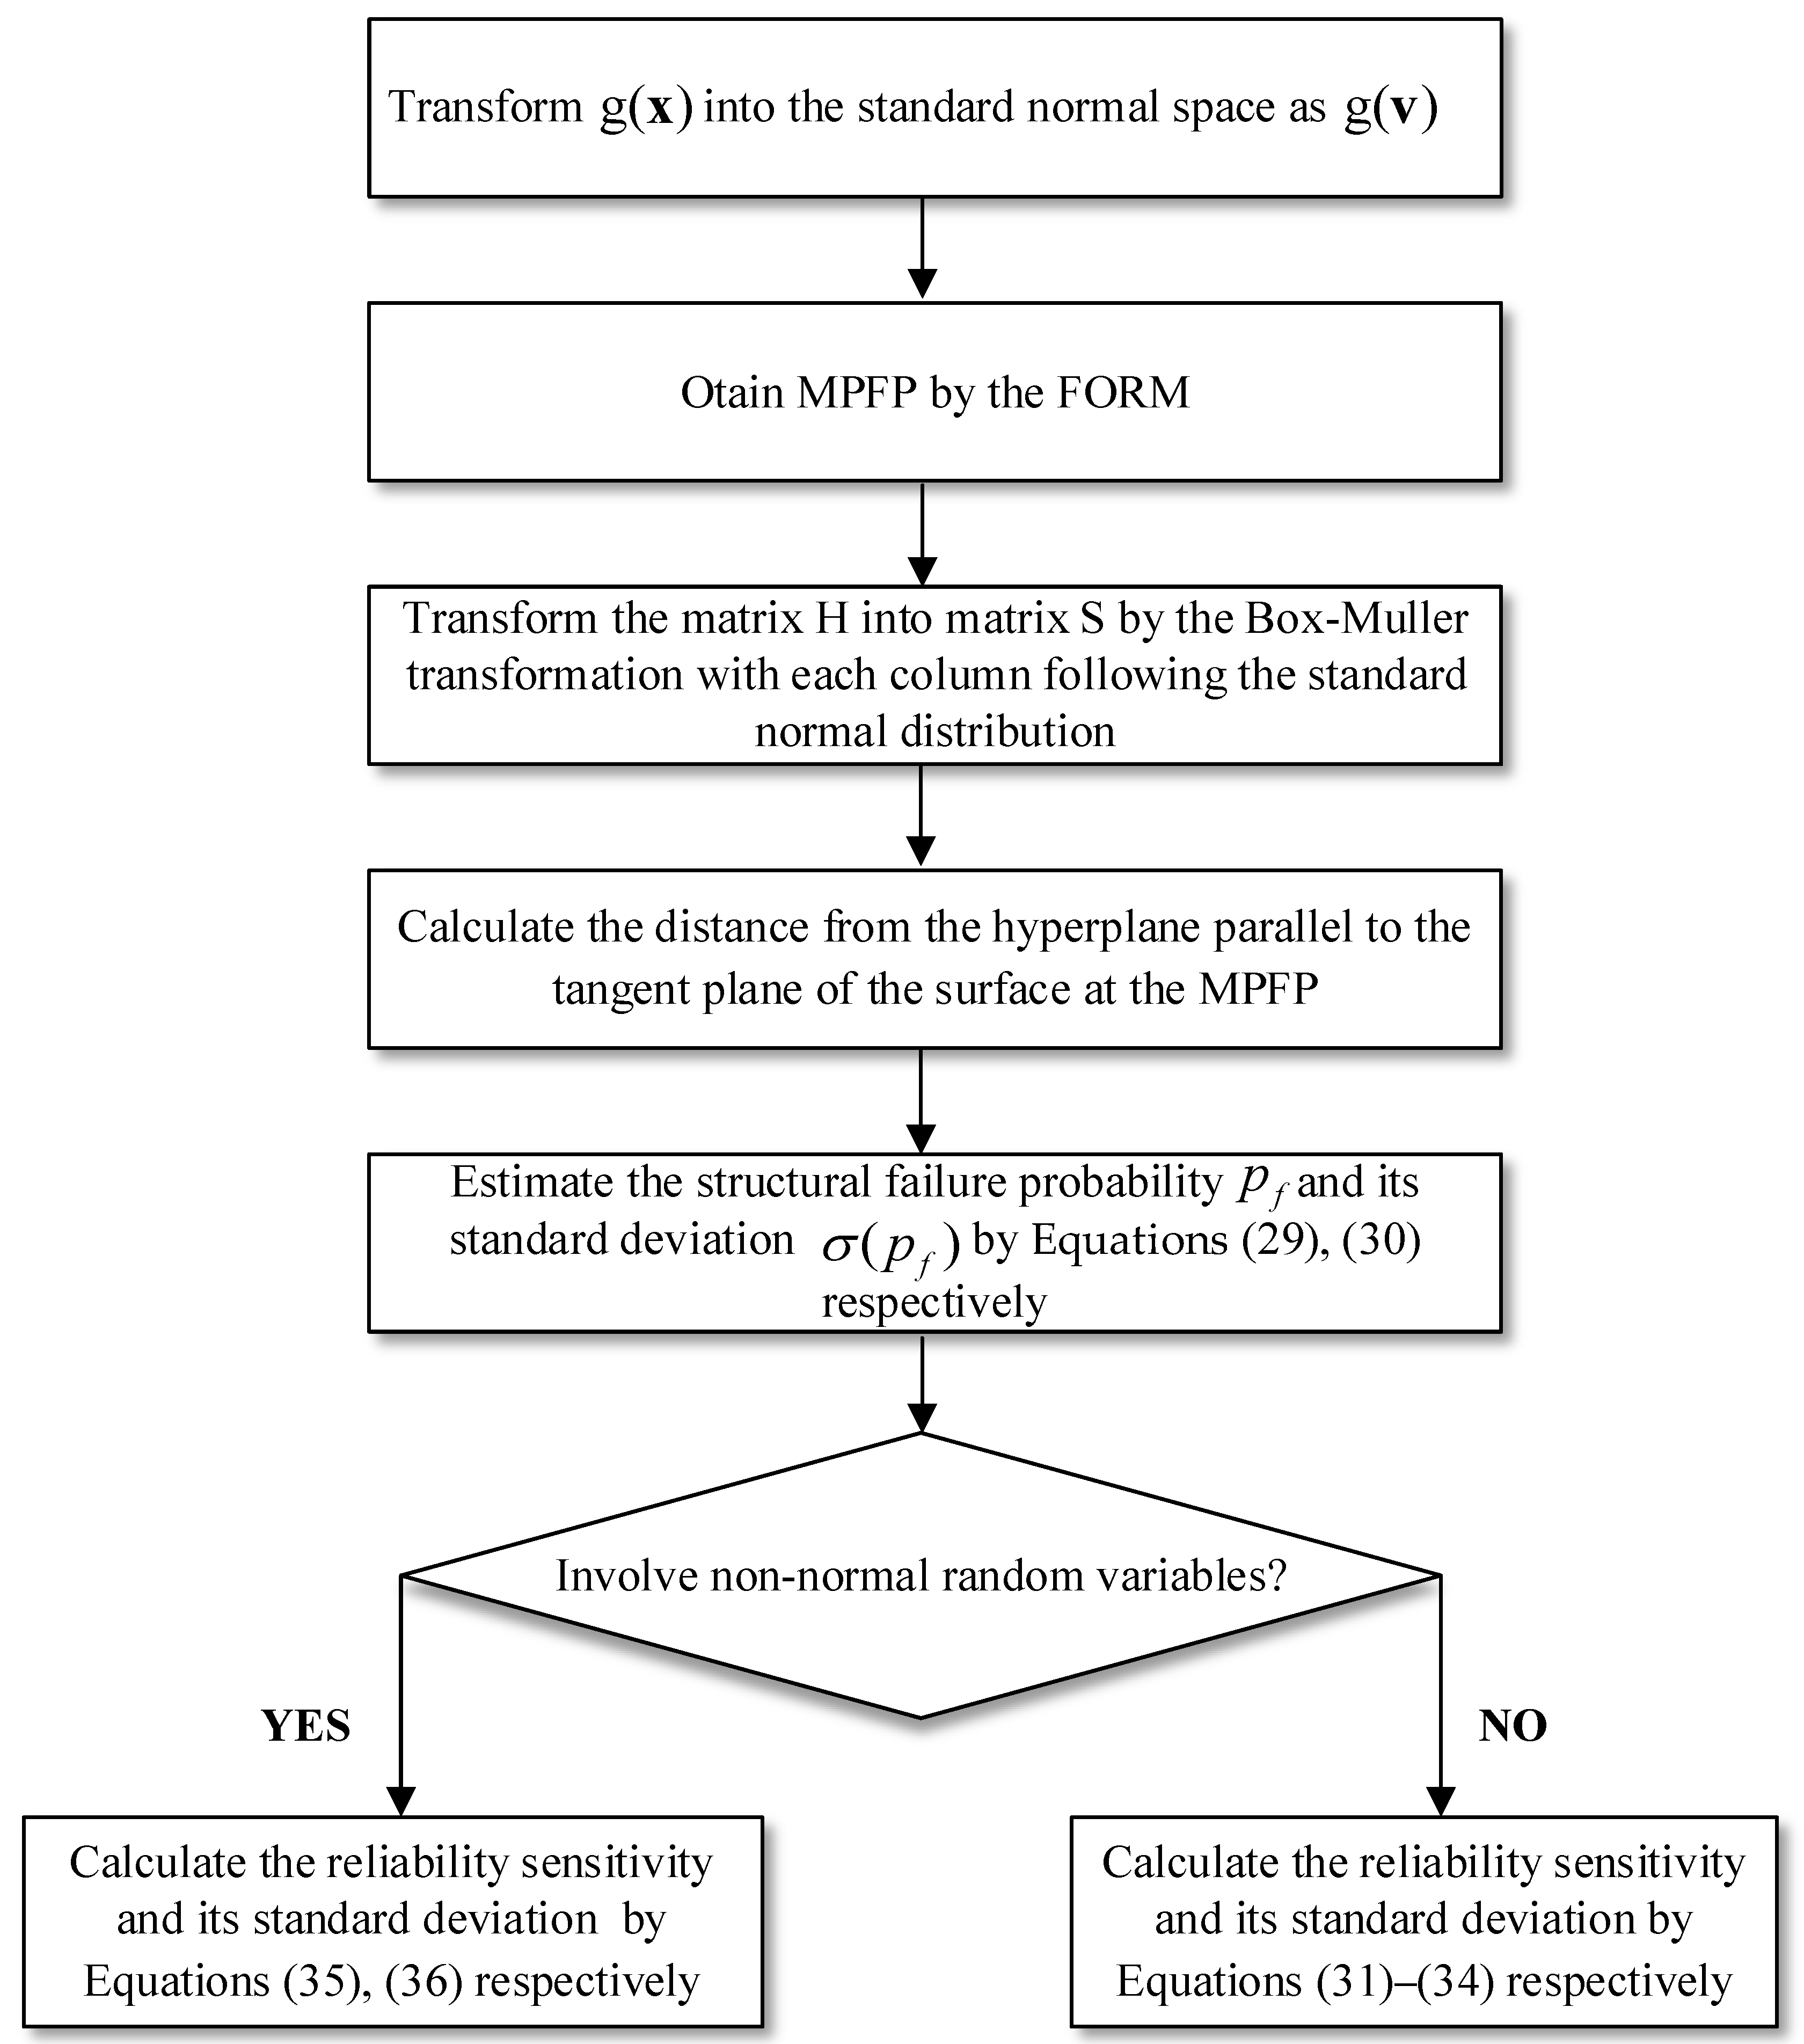
- Step 1. The performance function ) is transformed into the standard normal space as in terms of Rosenblatt transform. A MPFP is obtained by the first-order reliability method.
- Step 2. An matrix of quasi-random sequence matrix (LHS, Sobol, Halton) following the uniform distribution in , which is transformed into a matrix with each column following the standard normal distribution by the Box-Muller transformation. Each row of is used as a sample point , in the tangent plane of the limit state surface at the importance sampling center, namely the MPFP .
- Step 3. For the projection point of each sample point defined in Equation (6) on the limit state surface, solving Equation (7), a distance , can be calculated.
- Step 4. The structural failure probability and its standard deviation are estimated according to Equations (29) and (30) respectively.
- Step 5. For the cases of not involving non-normal random variables, sensitivity of structural failure probability and its standard deviation with respect to the mean and standard deviation of a random variable are calculated by Equations (31)–(34), respectively. Otherwise, they are evaluated by Equations (35) and (36) respectively.
6. Numerical Examples
7. Conclusions
Author Contributions
Funding
Institutional Review Board Statement
Informed Consent Statement
Data Availability Statement
Conflicts of Interest
References
- Liu, H.; Chen, W.; Sudjianto, A. Probabilistic Sensitivity Analysis Methods for Design Under Uncertainty. In Proceedings of the 10th AIAA/ISSMO Multidisciplinary Analysis and Optimization Conference, Albany, NY, USA, 30 August–1 September 2004; American Institute of Aeronautics and Astronautics: Albany, NY, USA, 2004. [Google Scholar]
- Keshtegar, B.; Meng, Z. A Hybrid Relaxed First-Order Reliability Method for Efficient Structural Reliability Analysis. Struct. Saf. 2017, 66, 84–93. [Google Scholar] [CrossRef]
- Meng, Z.; Li, G.; Yang, D.; Zhan, L. A New Directional Stability Transformation Method of Chaos Control for First Order Reliability Analysis. Struct. Multidiscip. Optim. 2017, 55, 601–612. [Google Scholar] [CrossRef]
- Yang, D.; Li, G.; Cheng, G. Convergence Analysis of First Order Reliability Method Using Chaos Theory. Comput. Struct. 2006, 84, 563–571. [Google Scholar] [CrossRef]
- Dudzik, A.; Potrzeszcz-Sut, B. Hybrid Approach to the First Order Reliability Method in the Reliability Analysis of a Spatial Structure. Appl. Sci. 2021, 11, 648. [Google Scholar] [CrossRef]
- Hu, Z.; Du, X. First Order Reliability Method for Time-Variant Problems Using Series Expansions. Struct. Multidiscip. Optim. 2015, 51, 1–21. [Google Scholar] [CrossRef]
- Li, G.; Li, B.; Hu, H. A Novel First-Order Reliability Method Based on Performance Measure Approach for Highly Nonlinear Problems. Struct. Multidiscip. Optim. 2018, 57, 1593–1610. [Google Scholar] [CrossRef]
- Du, X.; Zhang, J. Second-Order Reliability Method With First-Order Efficiency. In Proceedings of the Volume 1: 36th Design Automation Conference, Parts A and B, New Orleans, LA, USA, 15–18 August 2010; ASMEDC: Montreal, QC, Canada, 2010; pp. 973–984. [Google Scholar]
- Fan, W.; Liu, R.; Ang, A.H.-S.; Li, Z. A New Point Estimation Method for Statistical Moments Based on Dimension-Reduction Method and Direct Numerical Integration. Appl. Math. Model. 2018, 62, 664–679. [Google Scholar] [CrossRef]
- Zhao, Y.-G.; Ono, T. Moment Methods for Structural Reliability. Struct. Saf. 2001, 23, 47–75. [Google Scholar] [CrossRef]
- Zhao, Y.-G.; Zhang, X.-Y.; Lu, Z.-H. A Flexible Distribution and Its Application in Reliability Engineering. Reliab. Eng. Syst. Saf. 2018, 176, 1–12. [Google Scholar] [CrossRef]
- Lu, Z.; Song, J.; Song, S.; Yue, Z.; Wang, J. Reliability Sensitivity by Method of Moments. Appl. Math. Model. 2010, 34, 2860–2871. [Google Scholar] [CrossRef]
- Balesdent, M.; Morio, J.; Marzat, J. Kriging-Based Adaptive Importance Sampling Algorithms for Rare Event Estimation. Struct. Saf. 2013, 44, 1–10. [Google Scholar] [CrossRef]
- Dai, H.; Zhang, H.; Wang, W. A New Maximum Entropy-Based Importance Sampling for Reliability Analysis. Struct. Saf. 2016, 63, 71–80. [Google Scholar] [CrossRef]
- Melchers, R.E.; Li, C.Q. A Benchmark Study on Importance Sampling Techniques in Structural Reliability. Struct. Saf. 1994, 14, 299–302. [Google Scholar] [CrossRef]
- Melchers, R.E. Search-Based Importance Sampling. Struct. Saf. 1990, 9, 117–128. [Google Scholar] [CrossRef]
- Olsson, A.; Sandberg, G.; Dahlblom, O. On Latin Hypercube Sampling for Structural Reliability Analysis. Struct. Saf. 2003, 25, 47–68. [Google Scholar] [CrossRef]
- Ibrahim, Y. Observations on Applications of Importance Sampling in Structural Reliability Analysis. Struct. Saf. 1991, 9, 269–281. [Google Scholar] [CrossRef]
- Shayanfar, M.A.; Barkhordari, M.A.; Barkhori, M.; Barkhori, M. An Adaptive Directional Importance Sampling Method for Structural Reliability Analysis. Struct. Saf. 2018, 70, 14–20. [Google Scholar] [CrossRef]
- Au, S.K.; Beck, J.L. Important Sampling in High Dimensions. Struct. Saf. 2003, 25, 139–163. [Google Scholar] [CrossRef]
- Malakzadeh, K.; Daei, M. Finding Design Point Base on a Quasi-Importance Sampling Method in Structural Reliability Analysis. Structures 2022, 43, 271–284. [Google Scholar] [CrossRef]
- Zhang, X.; Lu, Z.; Cheng, K. Cross-Entropy-Based Directional Importance Sampling with von Mises-Fisher Mixture Model for Reliability Analysis. Reliab. Eng. Syst. Saf. 2022, 220, 108306. [Google Scholar] [CrossRef]
- Wang, Y.; Xie, B.; E, S. Adaptive Relevance Vector Machine Combined with Markov-Chain-Based Importance Sampling for Reliability Analysis. Reliab. Eng. Syst. Saf. 2022, 220, 108287. [Google Scholar] [CrossRef]
- Xie, B.; Peng, C.; Wang, Y. Combined Relevance Vector Machine Technique and Subset Simulation Importance Sampling for Structural Reliability. Appl. Math. Model. 2022, 113, 129–143. [Google Scholar] [CrossRef]
- Menz, M.; Dubreuil, S.; Morio, J.; Gogu, C.; Bartoli, N.; Chiron, M. Variance Based Sensitivity Analysis for Monte Carlo and Importance Sampling Reliability Assessment with Gaussian Processes. Struct. Saf. 2021, 93, 102116. [Google Scholar] [CrossRef]
- Mathew, T.V.; Prajith, P.; Ruiz, R.O.; Atroshchenko, E.; Natarajan, S. Adaptive Importance Sampling Based Neural Network Framework for Reliability and Sensitivity Prediction for Variable Stiffness Composite Laminates with Hybrid Uncertainties. Compos. Struct. 2020, 245, 112344. [Google Scholar] [CrossRef]
- Liu, F.; Wei, P.; Zhou, C.; Yue, Z. Reliability and Reliability Sensitivity Analysis of Structure by Combining Adaptive Linked Importance Sampling and Kriging Reliability Method. Chin. J. Aeronaut. 2020, 33, 1218–1227. [Google Scholar] [CrossRef]
- Zhao, W.; Chen, Y.; Liu, J. Reliability Sensitivity Analysis Using Axis Orthogonal Importance Latin Hypercube Sampling Method. Adv. Mech. Eng. 2019, 11, 168781401982641. [Google Scholar] [CrossRef]
- Juang, C.H.; Gong, W.; Martin, J.R. Subdomain Sampling Methods—Efficient Algorithm for Estimating Failure Probability. Struct. Saf. 2017, 66, 62–73. [Google Scholar] [CrossRef]
- Liu, P. Structural Reliability Analysis Based on Improved Latin Hypercube Important Sampling. Master’s Thesis, Jinan University, Guangzhou, China, 2016. [Google Scholar]
- Atanassov, E.; Ivanovska, S. On the Use of Sobol’ Sequence for High Dimensional Simulation. In Proceedings of the Computational Science—ICCS 2022; Groen, D., de Mulatier, C., Paszynski, M., Krzhizhanovskaya, V.V., Dongarra, J.J., Sloot, P.M.A., Eds.; Springer International Publishing: Cham, Switzerland, 2022; pp. 646–652. [Google Scholar]
- Liu, X.; Zheng, S.; Wu, X.; Chen, D.; He, J. Research on a Seismic Connectivity Reliability Model of Power Systems Based on the Quasi-Monte Carlo Method. Reliab. Eng. Syst. Saf. 2021, 215, 107888. [Google Scholar] [CrossRef]
- Xu, J.; Zhang, W.; Sun, R. Efficient Reliability Assessment of Structural Dynamic Systems with Unequal Weighted Quasi-Monte Carlo Simulation. Comput. Struct. 2016, 175, 37–51. [Google Scholar] [CrossRef]
- Ökten, G.; Liu, Y. Randomized Quasi-Monte Carlo Methods in Global Sensitivity Analysis. Reliab. Eng. Syst. Saf. 2021, 210, 107520. [Google Scholar] [CrossRef]
- Ökten, G.; Göncü, A. Generating Low-Discrepancy Sequences from the Normal Distribution: Box-Muller or Inverse Transform? Math. Comput. Model. 2011, 53, 1268–1281. [Google Scholar] [CrossRef]
- Niederreiter, H. Error Bounds for Quasi-Monte Carlo Integration with Uniform Point Sets. J. Comput. Appl. Math. 2003, 150, 283–292. [Google Scholar] [CrossRef]
- Ökten, G.; Eastman, W. Randomized Quasi-Monte Carlo Methods in Pricing Securities. J. Econ. Dyn. Control 2004, 28, 2399–2426. [Google Scholar] [CrossRef]
- Papageorgiou, A. Fast Convergence of Quasi-Monte Carlo for a Class of Isotropic Integrals. Math. Comput. 2000, 70, 297–306. [Google Scholar] [CrossRef]
- Papageorgiou, A. The Brownian Bridge Does Not Offer a Consistent Advantage in Quasi-Monte Carlo Integration. J. Complex. 2002, 18, 171–186. [Google Scholar] [CrossRef]
- Dai, H.; Wang, W. Application of Low-Discrepancy Sampling Method in Structural Reliability Analysis. Struct. Saf. 2009, 31, 55–64. [Google Scholar] [CrossRef]
- McKay, M.D.; Beckman, R.J.; Conover, W.J. A Comparison of Three Methods for Selecting Values of Input Variables in the Analysis of Output from a Computer Code. Technometrics 1979, 21, 239. [Google Scholar] [CrossRef]


| Variable | Mean | Standard Deviation | Distribution |
|---|---|---|---|
| 40.0 | 5.0 | Normal | |
| 50.0 | 2.5 | Normal | |
| 1000.0 | 200.0 | Normal |
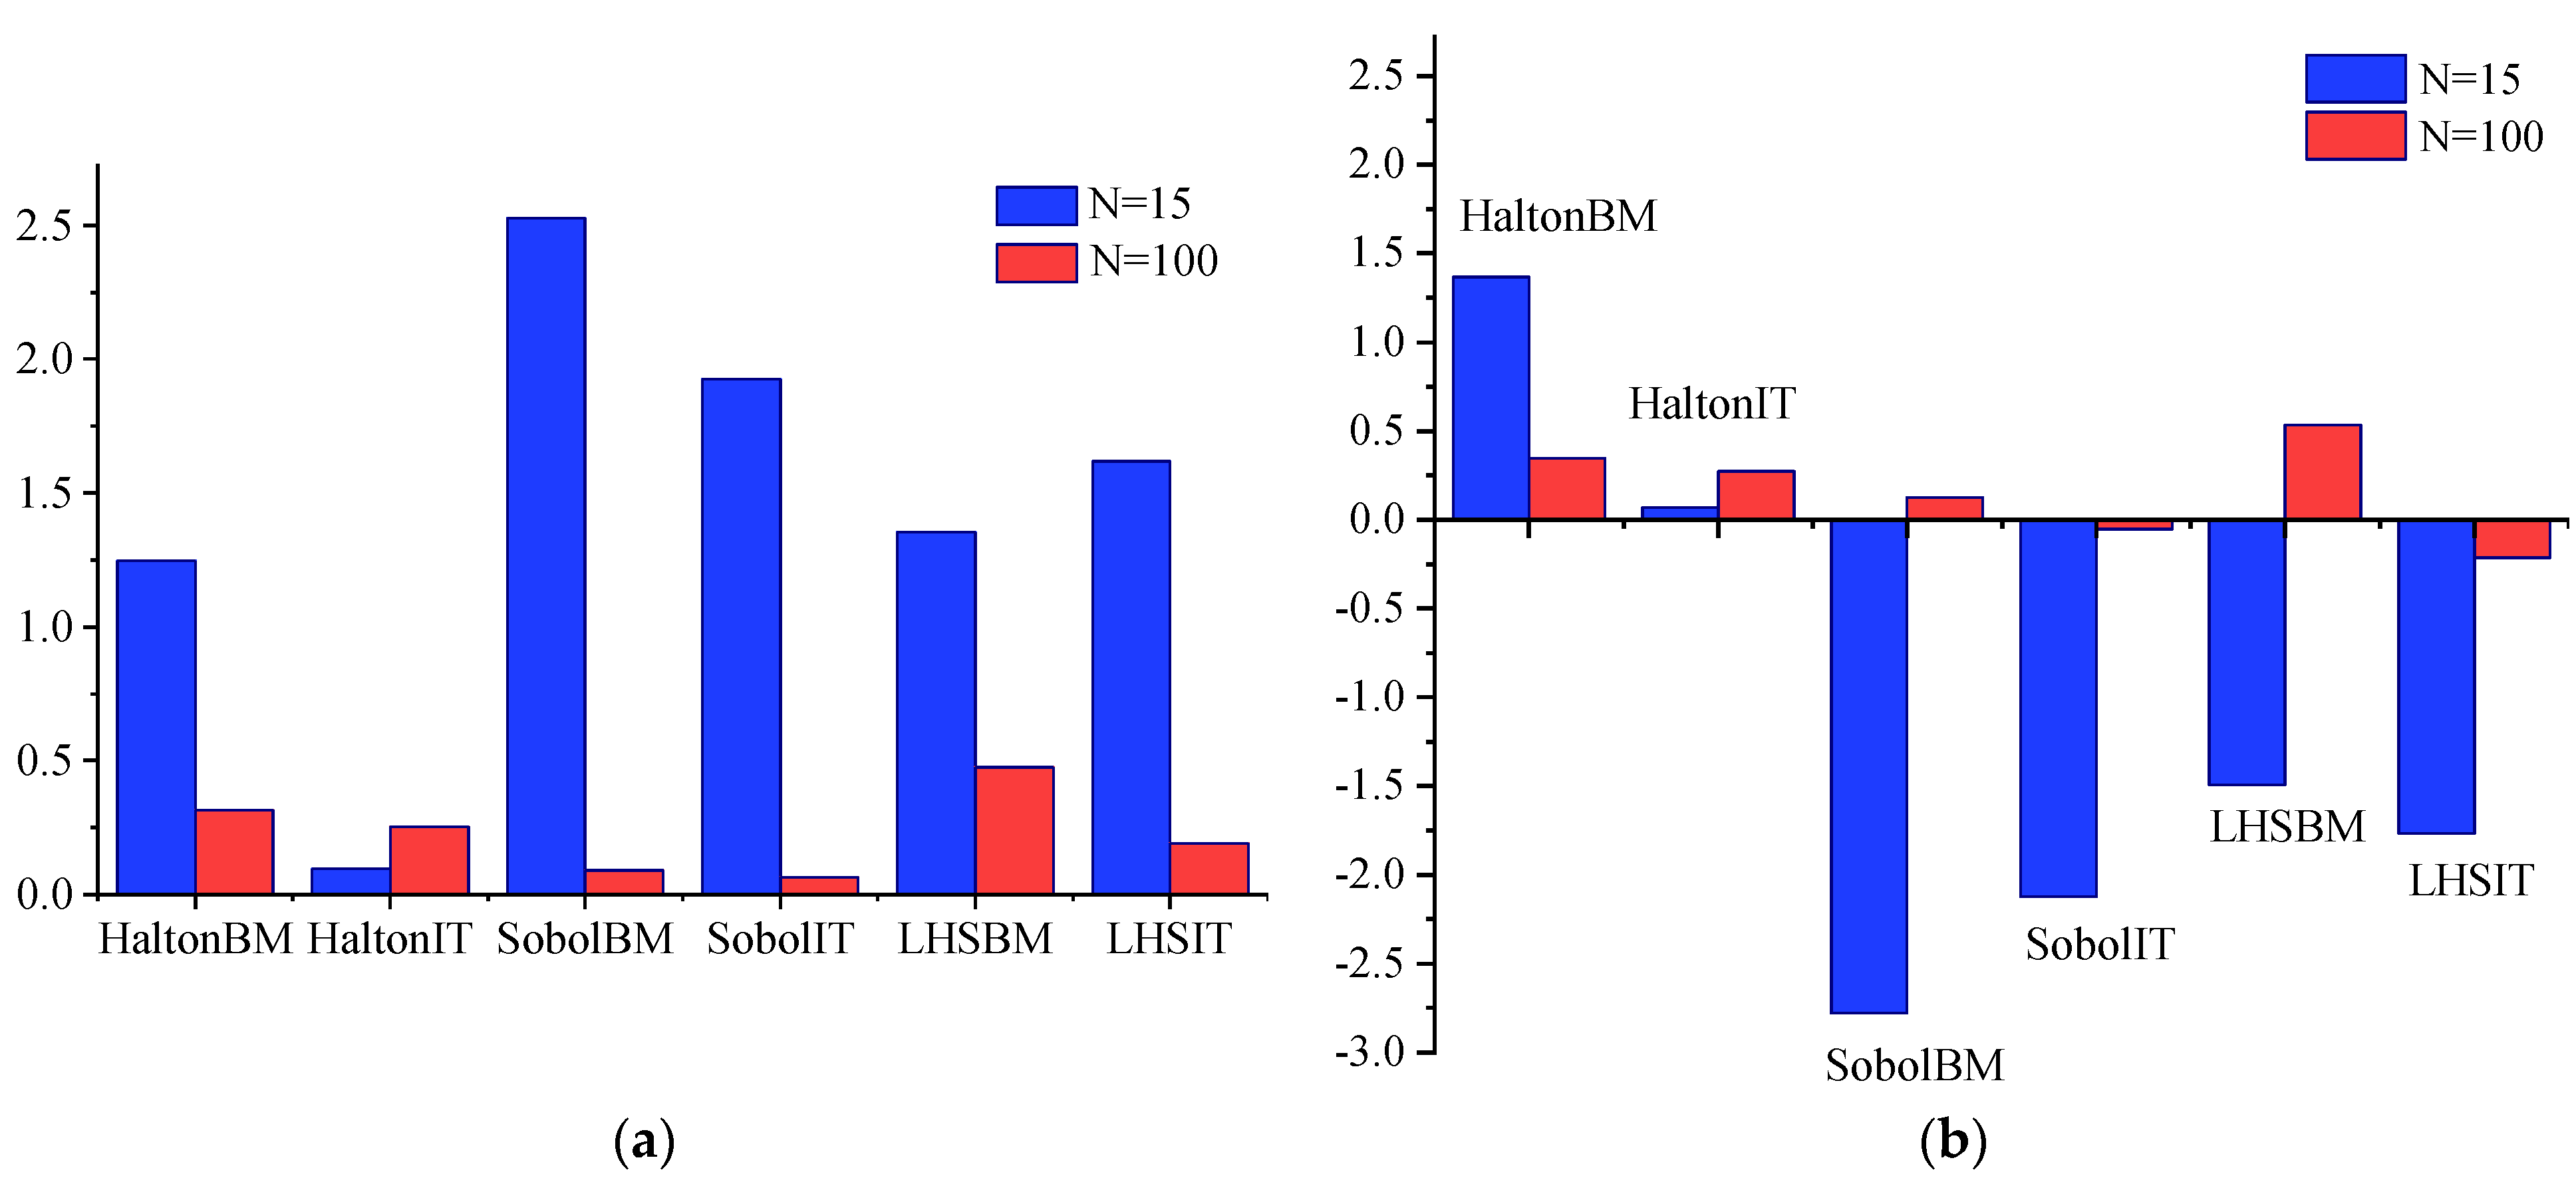
| HaltonBM | HaltonIT | SobolBM | SobolIT | LHSBM | LHSIT | |||
|---|---|---|---|---|---|---|---|---|
| −5.9807 | −5.9121 | −5.758 | −5.7936 | −5.8274 | −5.8116 | −5.9071 | −5.95 | |
| 0.15559 | 0.11522 | 0.097977 | 0.098288 | 0.10587 | 0.13867 | 0.0017258 | - | |
| −3.3503 | −3.3119 | −3.2256 | −3.2455 | −3.2644 | −3.2556 | −3.3091 | −3.48 | |
| 0.087157 | 0.064547 | 0.054886 | 0.05506 | 0.05931 | 0.077681 | 0.0009668 | - | |
| 1.2256 | 1.2115 | 1.1799 | 1.1872 | 1.1941 | 1.1909 | 1.2105 | 1.13 | |
| 0.031883 | 0.023612 | 0.020078 | 0.020142 | 0.021696 | 0.028417 | 0.0003537 | - | |
| 1.3724 | 1.3587 | 1.3271 | 1.3345 | 1.3413 | 1.3378 | 1.3574 | 1.31 | |
| 0.031636 | 0.023361 | 0.020164 | 0.020186 | 0.021706 | 0.02819 | 0.0003490 | - | |
| 2.1534 | 2.1319 | 2.0823 | 2.0938 | 2.1046 | 2.0992 | 2.1299 | 2.60 | |
| 0.049638 | 0.036656 | 0.031638 | 0.031674 | 0.034058 | 0.044232 | 0.0005475 | - | |
| 2.3053 | 2.2822 | 2.292 | 2.2415 | 2.2531 | 2.2473 | 2.2801 | 2.12 | |
| 0.05314 | 0.039241 | 0.033869 | 0.033908 | 0.03646 | 0.047352 | 0.0005862 | - | |
| 1.1930 | 1.1778 | 1.1442 | 1.1519 | 1.1593 | 1.1561 | 1.1769 | 1.175 | |
| 0.003407 | 0.025289 | 0.0212 | 0.02135 | 0.023031 | 0.030374 | 0.0003798 | - | |
| 3.0374 | 3.0413 | 3.0500 | 3.0480 | 3.0460 | 3.0469 | 3.0415 | 3.042 | |
| Variable | Mean | Standard Deviation | Distribution |
|---|---|---|---|
| 4.0 | 0.1 | Weibull | |
| 25000 | 2000 | Lognormal | |
| 0.875 | 0.1 | Type extreme value for maxima | |
| 20.0 | 1.0 | Uniform | |
| 100.0 | 100.0 | Exponential | |
| 150.0 | 10.0 | Normal |
| HaltonBM | HaltonIT | SobolBM | SobolIT | LHSBM | LHSIT | |||
|---|---|---|---|---|---|---|---|---|
| −4.4805 | −4.2795 | −4.413 | −4.337 | −4.4310 | −4.5150 | −4.4548 | −5.20 | |
| 0.2713914 | 0.2137251 | 0.2250217 | 0.208 | 0.2600737 | 0.2609230 | 0.0024682 | - | |
| −7.4163 | −7.0930 | −7.301 | −7.203 | −7.2940 | −7.4026 | −7.3439 | −8.70 | |
| 0.4267501 | 0.3426847 | 0.3608565 | 0.332 | 0.4110419 | 0.4014935 | 0.0038877 | - | |
| −2.1632 | −2.0696 | −2.135 | −2.091 | −2.1589 | −2.1658 | −2.1454 | −2.49 | |
| 0.1453419 | 0.1144816 | 0.1213083 | 0.110 | 0.1425801 | 0.1320312 | 0.0013030 | - | |
| −9.0523 | −8.6619 | −8.904 | −8.783 | −8.9912 | −9.1386 | −8.9977 | −11.1 | |
| 0.5241810 | 0.4197971 | 0.4361038 | 0.407 | 0.5171387 | 0.5127979 | 0.0048062 | - | |
| 1.7895 | 1.7025 | 1.757 | 1.729 | 1.7686 | 1.7998 | 1.7756 | 1.62 | |
| 0.1115595 | 0.0871507 | 0.0910651 | 0.085 | 0.1065609 | 0.1061127 | 0.0010073 | - | |
| 2.3032 | 2.2054 | 2.266 | 2.227 | 2.2676 | 2.3185 | 2.2904 | 2.18 | |
| 0.1420661 | 0.1126045 | 0.1164029 | 0.109 | 0.1303329 | 0.1335243 | 0.0012916 | - | |
| 2.8604 | 9.4543 | 8.637 | 5.932 | 3.8737 | 6.3602 | 6.4306 | 5.80 | |
| 5.3080620 | 5.1575787 | 4.9949124 | 4.885 | 5.5545088 | 5.8329506 | 0.0519940 | - | |
| 3.2309 | 3.5380 | 3.419 | 3.582 | 2.7430 | 2.5446 | 3.0182 | 2.86 | |
| 0.7201443 | 0.6241239 | 0.6492102 | 0.722 | 0.7533407 | 0.8138001 | 0.0074955 | - | |
| 1.0396 | 1.0904 | 1.123 | 1.012 | 1.2107 | 0.9601 | 1.0226 | 1.17 | |
| 0.2223653 | 0.2028553 | 0.2255991 | 0.203 | 0.2366053 | 0.1788639 | 0.0021001 | - | |
| 2.1030 | 2.9926 | 2.406 | 2.770 | 2.9629 | 2.7989 | 2.3960 | 3.02 | |
| 1.0970256 | 0.8681692 | 0.9527431 | 0.897 | 0.8966280 | 1.0181269 | 0.0099550 | - | |
| 1.7895 | 1.7025 | 1.757 | 1.729 | 1.7686 | 1.7998 | 1.7756 | 1.62 | |
| 0.1115595 | 0.0871507 | 0.0910651 | 0.085 | 0.1065609 | 0.1061127 | 0.0010073 | - | |
| 1.2412 | 0.9692 | 1.148 | 1.174 | 1.3588 | 1.2172 | 1.1570 | 1.17 | |
| 0.2536233 | 0.2177463 | 0.2325403 | 0.236 | 0.2690602 | 0.2634566 | 0.0025039 | - | |
| 3.4667 | 3.2737 | 3.394 | 3.329 | 3.4548 | 3.4739 | 3.4252 | 3.54 | |
| 2.7000 | 2.7190 | 2.707 | 2.714 | 2.7012 | 2.6993 | 2.7040 | 2.69 | |
| Variable | Unit | Mean | Standard Deviation |
|---|---|---|---|
| 1400 | |||
| 0.04 | 0.0048 | ||
| HaltonBM | HaltonIT | SobolBM | SobolIT | LHSBM | LHSIT | |||
|---|---|---|---|---|---|---|---|---|
| 9.918 | 9.6477 | 10.3354 | 10.1801 | 10.2009 | 10.1206 | 9.9576 | 11.059 | |
| 0.38406 | 0.39845 | 0.51619 | 0.66 | 0.45354 | 0.4274 | 0.0032015 | - | |
| 4.367 | 4.248 | 4.5508 | 4.4824 | 4.4916 | 4.4562 | 4.3845 | 11.059 | |
| 0.1691 | 0.17544 | 0.22728 | 0.29061 | 0.1997 | 0.18819 | 0.0014096 | - | |
| −1.847 | −1.7966 | −1.9247 | −1.8958 | −1.8997 | −1.8847 | −1.8543 | −1.86262 | |
| 0.07152 | 0.0742 | 0.096126 | 0.12291 | 0.084459 | 0.079592 | 0.0005962 | - | |
| −2.4147 | −2.3489 | −2.5163 | −2.4785 | −2.4836 | −2.464 | −2.4243 | −2.1299 | |
| 0.093504 | 0.097008 | 0.12567 | 0.16069 | 0.11042 | 0.10406 | 0.0007795 | - | |
| −1.7958 | −1.7469 | −1.8714 | −1.8433 | −1.847 | −1.8325 | −1.8030 | −1.8265 | |
| 0.069539 | 0.072145 | 0.093463 | 0.1195 | 0.08212 | 0.077388 | 0.0005797 | - | |
| −4.3967 | −4.2769 | −4.5817 | −4.5129 | −4.5221 | −4.4865 | −4.4142 | −3.7592 | |
| 0.17025 | 0.17663 | 0.22883 | 0.29258 | 0.20106 | 0.18947 | 0.0014192 | - | |
| 1.2965 | 1.2669 | 1.335 | 1.3121 | 1.3241 | 1.3173 | 1.2980 | 1.6187 | |
| 0.040819 | 0.0411 | 0.052102 | 0.059032 | 0.04631 | 0.042617 | 0.0003199 | - | |
| 2.1546 | 2.1053 | 2.2185 | 2.1804 | 2.2003 | 2.189 | 2.1569 | 1.85 | |
| 0.06783 | 0.0683 | 0.086583 | 0.0981 | 0.076957 | 0.07082 | 0.0005316 | - | |
| 1.8923 | 1.849 | 1.9484 | 1.915 | 1.9325 | 1.9225 | 1.8944 | 2.05932 | |
| 0.059576 | 0.059986 | 0.07604 | 0.08616 | 0.067589 | 0.062199 | 0.0004669 | - | |
| 2.6349 | 2.5747 | 2.7131 | 2.6665 | 2.6909 | 2.677 | 2.6378 | 2.5381 | |
| 0.082956 | 0.083527 | 0.10589 | 0.11997 | 0.094115 | 0.086609 | 0.0006501 | - | |
| 1.8217 | 1.78 | 1.8757 | 1.8436 | 1.8604 | 1.8508 | 1.8274 | 2.0119 | |
| 0.057353 | 0.057748 | 0.073206 | 0.082943 | 0.065068 | 0.059878 | 0.014554 | - | |
| 2.1839 | 2.134 | 2.2487 | 2.2102 | 2.2303 | 2.2189 | 2.1908 | 1.9986 | |
| 0.068758 | 0.069231 | 0.087763 | 0.099436 | 0.078006 | 0.071786 | 0.017448 | - | |
| 9.2942 | 9.0111 | 9.7881 | 9.6807 | 9.6186 | 9.5211 | 9.3992 | 9.373 | |
| 2.3511 | 2.3652 | 2.3344 | 2.3385 | 2.3409 | 2.3447 | 2.3495 | 2.3505 | |
| HaltonBM | HaltonIT | SobolBM | SobolIT | LHSBM | LHSIT | |||
|---|---|---|---|---|---|---|---|---|
| 9.989 | 9.9297 | 9.9646 | 9.9752 | 10.2009 | 10.1206 | 9.9576 | 11.059 | |
| 0.10508 | 0.097691 | 0.099142 | 0.10558 | 0.45354 | 0.4274 | 0.0032015 | - | |
| 4.3983 | 4.3722 | 4.3875 | 4.3922 | 4.4916 | 4.4562 | 4.3845 | 11.059 | |
| 0.04627 | 0.043015 | 0.043654 | 0.04649 | 0.1997 | 0.18819 | 0.0014096 | - | |
| −1.8602 | −1.8491 | −1.8556 | −1.8576 | −1.8997 | −1.8847 | −1.8543 | −1.86262 | |
| 0.019569 | 0.018192 | 0.018463 | 0.019662 | 0.084459 | 0.079592 | 0.0005962 | - | |
| −2.432 | −2.4175 | −2.426 | −2.4286 | −2.4836 | −2.464 | −2.4243 | −2.1299 | |
| 0.025584 | 0.023784 | 0.024138 | 0.025706 | 0.11042 | 0.10406 | 0.0007795 | - | |
| −1.8086 | −1.7979 | −1.8042 | −1.8062 | −1.847 | −1.8325 | −1.8030 | −1.8265 | |
| 0.019027 | 0.017688 | 0.017951 | 0.019117 | 0.08212 | 0.077388 | 0.0005797 | - | |
| −4.4282 | −4.4019 | −4.4173 | −4.422 | −4.4315 | −4.4487 | −4.4142 | −3.7592 | |
| 0.046584 | 0.043307 | 0.04395 | 0.046805 | 0.0452164 | 0.0458443 | 0.0014192 | - | |
| 1.3006 | 1.2956 | 1.299 | 1.299 | 1.3019 | 1.3058 | 1.2980 | 1.6187 | |
| 0.010358 | 0.0098796 | 0.010067 | 0.010396 | 0.0102519 | 0.0103275 | 0.0003199 | - | |
| 2.1614 | 2.153 | 2.1586 | 2.1587 | 2.1635 | 2.17 | 2.1569 | 1.85 | |
| 0.017213 | 0.016418 | 0.01673 | 0.017276 | 0.0170365 | 0.0171621 | 0.0005316 | - | |
| 1.8983 | 1.8909 | 1.8958 | 1.8959 | 1.9001 | 1.9059 | 1.8944 | 2.05932 | |
| 0.015118 | 0.014419 | 0.014693 | 0.015173 | 0.0149626 | 0.0150729 | 0.0004669 | - | |
| 2.6432 | 2.633 | 2.6399 | 2.64 | 2.6458 | 2.6538 | 2.6378 | 2.5381 | |
| 0.021051 | 0.020078 | 0.02046 | 0.021128 | 0.0208347 | 0.0209883 | 0.0006501 | - | |
| 1.8274 | 1.8204 | 1.8251 | 1.8252 | 1.8292 | 1.8347 | 1.8274 | 2.0119 | |
| 0.014554 | 0.013881 | 0.014145 | 0.014607 | 0.0144043 | 0.0145105 | 0.014554 | - | |
| 2.1908 | 2.1824 | 2.188 | 2.1882 | 2.193 | 2.1996 | 2.1908 | 1.9986 | |
| 0.017448 | 0.016642 | 0.016958 | 0.017511 | 0.0172687 | 0.017396 | 0.017448 | - | |
| 9.3992 | 9.3244 | 9.3643 | 9.3853 | 9.4026 | 9.4462 | 9.3992 | 9.373 | |
| 2.3495 | 2.3525 | 2.3509 | 2.3501 | 2.3494 | 2.3476 | 2.3495 | 2.3505 | |
| Variable | Unit | Mean | Standard Deviation |
|---|---|---|---|
| m2 | 0.0014 | 0.00014 | |
| GPa | 200 | 20 | |
| kN | 40 | 4 |
| Example | N | Method (In Ascending Order of the Relative Errors) | |||||
|---|---|---|---|---|---|---|---|
| 1 (<1%) | 15 | HaltonIT | HaltonBM | LHSBM | LHSIT | SobolIT | SobolBM |
| 100 | SobolIT | SobolBM | LHSIT | HaltonIT | HaltonBM | LHSBM | |
| 2 (<5%) | 100 | LHSIT | SobolIT | SobolBM | LHSBM | HaltonIT | HaltonBM |
| 1000 | HaltonBM | SobolIT | SobolBM | HaltonIT | LHSIT | LHSBM | |
| 3 (<1%) | 50 | HaltonBM | LHSIT | LHSBM | SobolIT | HaltonIT | SobolBM |
| 1000 | SobolBM | SobolIT | HaltonIT | HaltonBM | LHSBM | LHSIT | |
| 4 (<1%) | 15 | LHSIT | LHSBM | SobolIT | SobolBM | HaltonBM | HaltonIT |
| 100 | SobolBM | LHSIT | LHSBM | SobolIT | HaltonBM | HaltonIT | |
| 200 | SobolBM | LHSIT | SobolIT | HaltonIT | LHSBM | HaltonBM | |
| 500 | LHSIT | LHSBM | SobolBM | HaltonIT | SobolIT | HaltonBM | |
| 1000 | HaltonIT | SobolBM | SobolIT | LHSIT | LHSBM | HaltonBM | |
Publisher’s Note: MDPI stays neutral with regard to jurisdictional claims in published maps and institutional affiliations. |
© 2022 by the authors. Licensee MDPI, Basel, Switzerland. This article is an open access article distributed under the terms and conditions of the Creative Commons Attribution (CC BY) license (https://creativecommons.org/licenses/by/4.0/).
Share and Cite
Zhao, W.; Wu, Y.; Chen, Y.; Ou, Y. Reliability Sensitivity Analysis by the Axis Orthogonal Importance Sampling Method Based on the Box-Muller Transformation. Appl. Sci. 2022, 12, 9860. https://doi.org/10.3390/app12199860
Zhao W, Wu Y, Chen Y, Ou Y. Reliability Sensitivity Analysis by the Axis Orthogonal Importance Sampling Method Based on the Box-Muller Transformation. Applied Sciences. 2022; 12(19):9860. https://doi.org/10.3390/app12199860
Chicago/Turabian StyleZhao, Wei, Yeting Wu, Yangyang Chen, and Yanjun Ou. 2022. "Reliability Sensitivity Analysis by the Axis Orthogonal Importance Sampling Method Based on the Box-Muller Transformation" Applied Sciences 12, no. 19: 9860. https://doi.org/10.3390/app12199860
APA StyleZhao, W., Wu, Y., Chen, Y., & Ou, Y. (2022). Reliability Sensitivity Analysis by the Axis Orthogonal Importance Sampling Method Based on the Box-Muller Transformation. Applied Sciences, 12(19), 9860. https://doi.org/10.3390/app12199860